
Path Integration Detects Prodromal Alzheimer’s Disease and Predicts Cognitive Decline
Abstract
Background:
The entorhinal cortex is the very earliest involvement of Alzheimer’s disease (AD). Grid cells in the medial entorhinal cortex form part of the spatial navigation system.
Objective:
We aimed to determine whether path integration performance can be used to detect patients with mild cognitive impairment (MCI) at high risk of developing AD, and whether it can predict cognitive decline.
Methods:
Path integration performance was assessed in 71 patients with early MCI (EMCI) and late MCI (LMCI) using a recently developed 3D virtual reality navigation task. Patients with LMCI were further divided into those displaying characteristic brain imaging features of AD, including medial temporal lobe atrophy on magnetic resonance imaging and posterior hypoperfusion on single-photon emission tomography (LMCI+), and those not displaying such features (LMCI–).
Results:
Path integration performance was significantly lower in patients with LMCI+than in those with EMCI and LMCI–. A significantly lower performance was observed in patients who showed progression of MCI during 12 months, than in those with stable MCI. Path integration performance distinguished patients with progressive MCI from those with stable MCI, with a high classification accuracy (a sensitivity of 0.88 and a specificity of 0.70).
Conclusions:
Our results suggest that the 3D virtual reality navigation task detects prodromal AD patients and predicts cognitive decline after 12 months. Our navigation task, which is simple, short (12–15 minutes), noninvasive, and inexpensive, may be a screening tool for therapeutic choice of disease-modifiers in individuals with prodromal AD.
INTRODUCTION
In recent years, disease-modifying drugs of Alzheimer’s disease (AD), such as lecanemab, which target and remove amyloid-β from the brain have been approved for the treatment of early AD and mild cognitive impairment (MCI) due to AD.1 Therefore, the identification of AD in its earliest stages is needed to make therapeutic choices that can delay or prevent the onset of dementia. The detection of prodromal AD is very challenging. Biomarkers and amyloid and/or tau positron emission tomography (PET) examinations provide useful information to improve the diagnosis of prodromal AD. Recently, blood-based biomarkers are likely to be game changers in AD diagnosis. However, it is difficult to determine blood-based maker changes correlating with cognitive symptoms at early stages of AD. Therefore, simple and noninvasive tools to detect early AD and to predict cognitive decline of MCI patients are required.
The entorhinal cortex is affected at a very early stage of AD.2 Grid cells, mainly in the medial entorhinal cortex, form part of the spatial navigation system.3,4 In an AD mouse model, tau pathology in the entorhinal cortex has been associated with grid cell dysfunction and spatial navigation deficits.5,6 Path integration is a navigation process to keep track of one’s position, by integrating self-motion cues.7 Human studies have shown that path integration performance decreases with increasing age in normal volunteers,6,8 and is also impaired in adults who are APOE4 carriers,9–11 have a family history of dementia, or have AD risk factors,12 in addition to patients with amnestic MCI and early stage of AD.13–17 Functional magnetic resonance imaging (fMRI) studies demonstrated that reduced grid-like fMRI signals were associated with impairment of path integration performance.8–10,12 These studies suggest that path integration deficits are the initial behavioral change that occurs in early AD, prior to memory impairment.12 Therefore, path integration performance has the potential to be a sensitive marker in clinical practice for the detection of prodromal AD.
A variety of different paradigms to test spatial navigation have been reported to date. We recently developed a 3D virtual reality (VR) navigation test that measures the individual abilities of path integration.6 This test is simple and noninvasive. The test takes only approximately 12 to 15 min. In the present study, we aimed to determine whether the analysis of path integration performance using VR goggles can identify prodromal AD (MCI patients at increased risk of developing AD). In addition, we investigated the association between path integration deficits and cognitive changes during the follow-up period, to determine whether path integration can predict the cognitive decline of patients with MCI.
MATERIALS AND METHODS
Participants
Patients with amnestic MCI (n = 73, 31 men and 42 women; mean age: 74.4 years, range: 51–85 years) were enrolled between October 2021 and February 2024 from the Memory Clinic at Tokyo General Hospital. All patients underwent detailed physical, neurological, and psychiatric examinations, extensive laboratory tests, and MRI and single-photon emission computed tomography (SPECT). Although patients with mild white matter hyperintensity lesions on MRI (grade 0–2 based on the scale of Fazekas et al.18) were included, those with infarctions or severe white matter hyperintensity lesions (grade 3) were excluded. Patients with psychiatric diseases, substance use disorders, and traumatic brain injuries were also excluded. All patients had normal or corrected-to-normal vision.
The diagnosis of MCI was based on the AD Neuroimaging Initiative (ADNI) criteria19 for MCI, as follows: 1) subjective memory complaints reported by themselves, study partner, or clinician; 2) objective memory loss defined as scoring below an education-adjusted cut-off score on delayed recall of Story A of the Wechsler Memory Scale-revised (WMS-R) Logical Memory test (maximum 25 points). Early MCI (EMCI) was considered to be a score of 9 to 11 for those with 16 or more years of education, a score of 5 to 9 for those with 8 to 15 years of education, or a score of 3 to 6 for those with 0 to 7 years of education. Late MCI (LMCI) was considered to be a score of 8 or lower for those with 16 or more years of education, a score of 4 or lower for those with 8 to 15 years of education, or a score of 2 or lower for those with 0 to 7 years of education; 3) a global Clinical Dementia Rating score of 0.5; 4) sufficiently preserved general cognitive and functional performance such that a diagnosis of dementia could not be made; and 5) Mini-Mental State Examination (MMSE)20 score between 24 and 30. Patients with MCI were divided into those with characteristic brain imaging features of AD, including medial temporal lobe (MTL) atrophy on MRI and posterior hypoperfusion on SPECT (MCI+), and those without these features (MCI–).
Cognitive functions were assessed using the MMSE, the Montreal Cognitive Assessment (MoCA),21 and the WMSR-Logical Memory test. Although patients with clinically diagnosed depression were excluded, Geriatric Depression Scale-15 (GDS-15)22 scores were compared among MCI groups.
Patients with MCI who were followed for approximately 12 months were assessed regarding changes in their neuropsychological test results, and were divided into progressive MCI (pMCI) and stable MCI (sMCI). pMCI included patients with an average score of MMSE and MoCA changes (last score – initial score) [(ΔMMSE +ΔMoCA)/2] of less than – 2, and sMCI included patients with an average score of – 2 or more. Patients who were admitted to hospital or nursing homes during the follow-up period were excluded from the longitudinal study.
The study design was approved by the ethics review board of National Institutes for Quantum Science and Technology and Tokyo General Hospital and all patients provided written informed consent before participating in this study.
MRI and SPECT analyses
The atrophy of MTL structures displayed on MRI (Siemens MAGNETOM Avanto 1.5T MRI system), including the entorhinal cortex and the parahippocampal gyrus, was assessed using the automated software program, voxel-based specific regional analysis system for AD, which is widely used for the clinical diagnosis of AD in Japan.23 Based on the Z-score obtained in the target voxel of interest (MTL structures including CA1, CA2, CA3, dentate gyrus, subiculum, entorhinal cortex, Brodmann 35, and Brodmann 36), the severity of atrophy in each patient was classified as grade 0 (Z-score < 1.0, no atrophy), grade 1 (1.0≤Z-score < 2.0, mild atrophy), and grade 2 (Z-score≥2.0, moderate to severe atrophy).
The severity of hypoperfusion in the posterior cerebral lobe, including the parietal and posterior cingulate regions, was assessed by SPECT (E.CAM Signature gamma camera with a low medium energy general purpose collimator). Perfusion SPECT data after an intravenous injection of 222 MBq of N-isopropyl-p-[123I] iodoamphetamine were processed using the 3D stereotactic surface projection method.24 Hypoperfusion in the right and left parietal lobes and posterior cingulate gyri was analyzed using the computer-assisted diagnostic system, Z-score summation analysis method.25 The extent of hypoperfusion in each patient was classified as grade 0 (hypoperfusion in neither the parietal cortex nor the posterior cingulate), grade 1 (hypoperfusion in either the parietal cortex or the posterior cingulate), and grade 2 (hypoperfusion in both the parietal cortex and the posterior cingulate). Brain imaging abnormalities were graded between 0 and 4 by summing the MRI data (grades 0 to 2) and SPECT data (grades 0 to 2), and this score was defined as the AD score. A higher AD score indicates more severe imaging abnormalities characteristic for AD, and a lower AD score indicates less severe imaging abnormalities characteristic for AD. In this study, MCI+was defined as an AD score of 2 or more, and MCI–was defined as an AD score of 1 or less. The methods of MRI and SPECT data acquisition have been described in detail elsewhere.26
VR path integration task
The VR space consists of a 20 virtual meter (vm) diameter virtual arena surrounded by a 3 vm high wall. Subjects wearing 3D VR goggles seated on a swivel chair operate their movements with a joystick (forward and backward movements), and by rotating their body (right and left movements). The software and VR goggles have been described previously,15 and were provided by MIG Inc. (Tokyo, Japan: https://www.medicalig.com).6
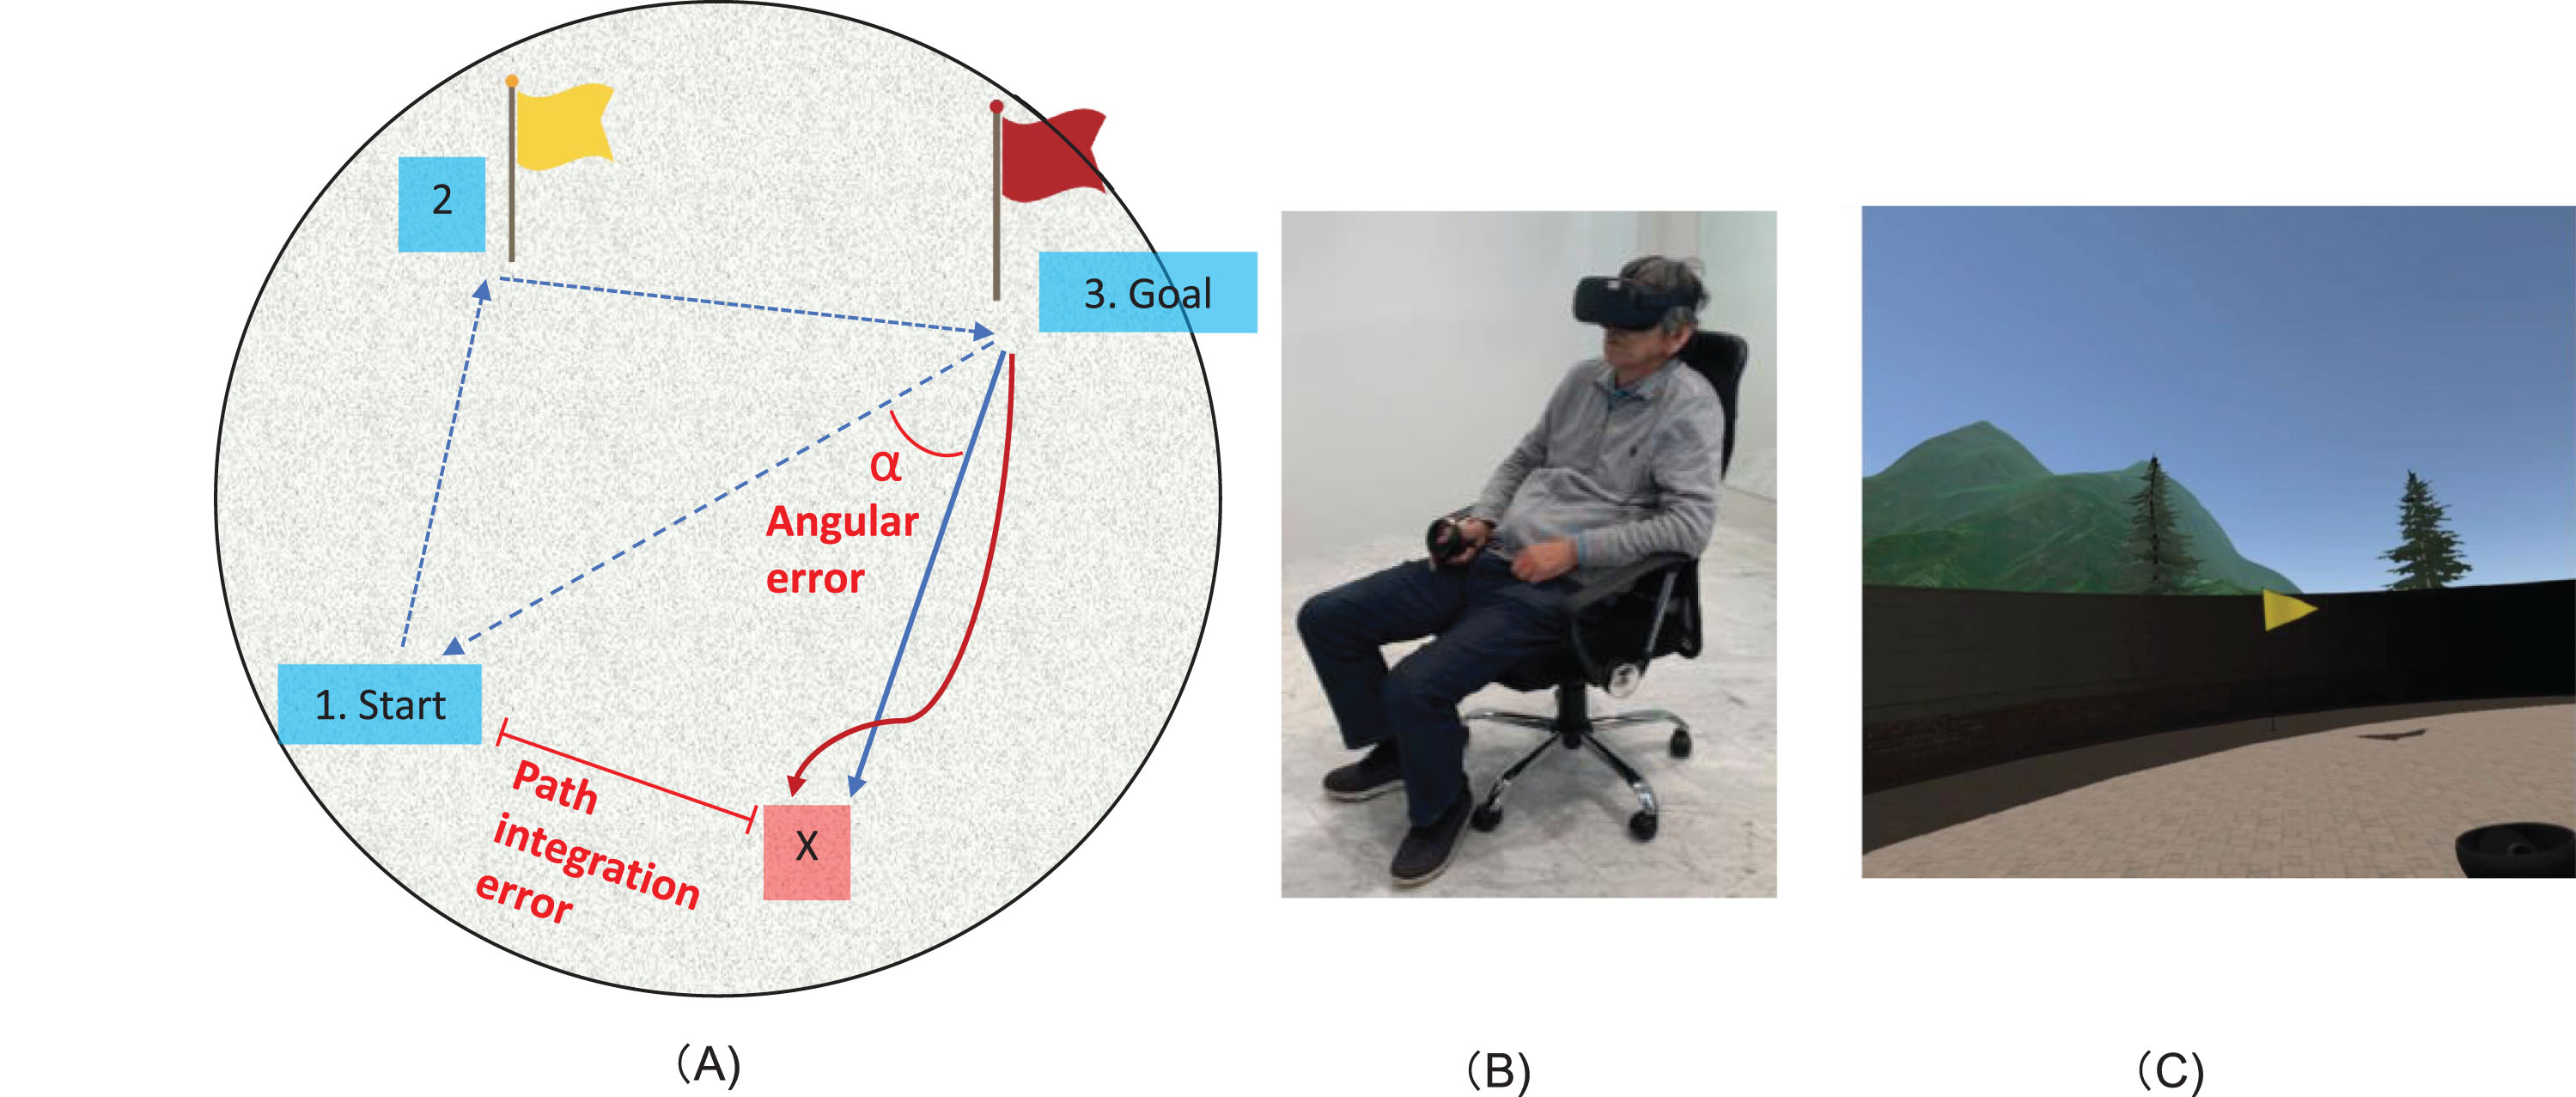
First, subjects wearing the VR goggles go to an indicated location A (a yellow flag), then to a different indicated location B (a red flag), and finally return to the starting point (Fig. 1). As the flags that serve as landmarks disappear, participants primarily use egocentric navigation for path integration. However, the virtual space is designed in such a way that it does not interfere with allocentric navigation, in which participants use minimal visual cue information. Therefore, it is reasonable to conclude that this task assesses subjects’ path integration abilities based on mainly self-motion and the limited visual cue information. Therefore, it is reasonable to conclude that this task assesses subjects’ navigation abilities based on self-motion information. The return time is 1 min, and the position after 1 min is considered the end position of that subject (point X). The subject position during traveling was recorded every 0.5 s. The path integration error (the distance between the subject’s final position and the actual starting point) and angular error, which was angle between the path of the subject and the ideal direction (the angle between the straight line connecting the goal and the starting point, and the straight line connecting the average direction of travel from the goal to point X) were measured. The average direction of travel was obtained by calculating the regression line of traveling from the goal to point X. The subjects took the test 3 times, and the averages of the error distance and angular error were used as indices of path integration performance. All 3 trials started from different locations and returned from different locations, but the distance from the location of the red flag to the starting point remained constant. Each trial takes only a few minutes. After a practice trial, 3 actual trials are performed. The total test time of the path integration task for each participant (including a practice trial and 3 actual trials) is about 12 to 15 min.
Fig. 1
Path integration task. A) Illustration of the path integration task. A subject wearing the VR goggles goes to the indicated location A (yellow flag), and then to a different indicated location B (red flag), and finally returns to the starting point. Point X is the final position, which is hence the point that the subjects consider to be the starting position. The path integration error (the distance between the subject’s final position and the actual starting point), and angular error (the rotation angle between the straight line connecting the goal and the starting point, and the straight line connecting the goal and point X) were measured. B) Demonstration of the VR equipment, with a subject wearing 3D VR goggles seated on a swivel chair during the task. C) An example of the environment that is observed from the goggles, showing the yellow flag.
Statistical analysis
Values are expressed as the mean±standard deviation (SD). The demographic variables, cognitive test scores, and path integration errors were compared among the MCI groups. The quantitative variables were compared using one-way analysis of variance and the Bonferroni correction post-hoc test or Student t-test. The differences among the qualitative variables were calculated using the χ2 test. Neuropsychological data were analyzed using analysis of covariance with age and education as covariates. Correlations between cognitive test scores and path integration performance, and between cognitive test scores and AD scores were analyzed using Spearman’s rank correlation test because of nonparametric data analyses (such as for cognitive test and AD scores). The ability to distinguish pMCI patients from sMCI patients using path integration performance (distance errors and angular errors) and AD scores was compared using measured area under the curve of the receiver operating characteristic (ROC). A p-value of less than 0.05 was considered to indicate a statistically significant difference between groups. SPSS 26.0 software was used for all statistical analyses.
RESULTS
We obtained results from 71 of the 73 patients with MCI, because 2 patients (2.7%) experienced VR sickness and were unable to perform the test.
1) Differences in demographics and path integration performance among the EMCI, LMCI–, and LMCI+groups
Table 1 shows differences in demographics among the EMCI (n = 14), LMCI–(n = 20), and LMCI+ (n = 37) groups. As among the 14 patients with EMCI, only 3 were EMCI+, whereas 11 were EMCI–, both EMCI– and EMCI+patients were included in the EMCI group in this study. There were no significant differences in age, sex, MMSE, MoCA, and GDS-15 scores, and education among the groups. By definition, WMS Logical Memory scores were significantly lower in the LMCI+ and LMCI– groups than in the EMCI group, and AD scores were significantly higher in the LMCI+group than in the EMCI and LMCI– groups. Path integration error (vm) and angular error (degrees) were 4.82±2.25 and 16.44±8.90, respectively, in the EMCI group, 4.86±1.82 and 15.63±8.58, respectively, in the LMCI– group, and 7.53±3.48 and 31.40±22.9, respectively, in the LMCI+group, but no significant differences were observed between the LMCI– group and the EMCI group (Fig. 2). Among all patients with MCI, MMSE and MoCA scores did not correlate significantly with the path integration error or the angular error.
2) Differences in demographics and path integration performance between the pMCI group and the sMCI group Forty-five patients with MCI who were followed for approximately 12 months (mean duration: 12.4 months; range: 6–24 months) were divided into the pMCI (n = 8) and sMCI (n = 37) groups. Table 2 shows the differences in demographics between the pMCI group and the sMCI group. As 8 out of the 23 patients with LMCI+had progressive disease, whereas the others had stable symptoms during the follow-up study, the proportion of LMCI + patients differed significantly between the pMCI group and the sMCI group (100% [pMCI] versus 41% [sMCI]). There were no significant differences in age, sex, MMSE, MoCA, and GDS-15 scores, education, follow-up time, and use of anti-dementia medications (cholinesterase inhibitors and memantine hydrochloride) between the groups. AD scores were significantly higher in the pMCI group than in the sMCI group. Regarding path integration performance, path integration error and angular error were 10.34±3.28 and 59.13±27.51, respectively, in the pMCI group, and 5.66±2.58 and 19.41±12.38, respectively, in the sMCI group. Both path integration error and angular error were significantly higher in the pMCI group than in the sMCI group (Fig. 3). The average scores of MMSE and MoCA changes during the follow-up period correlated significantly with the error distance, angular error, and AD scores (Fig. 4). We also obtained the same results in Pearson’s correlation test.
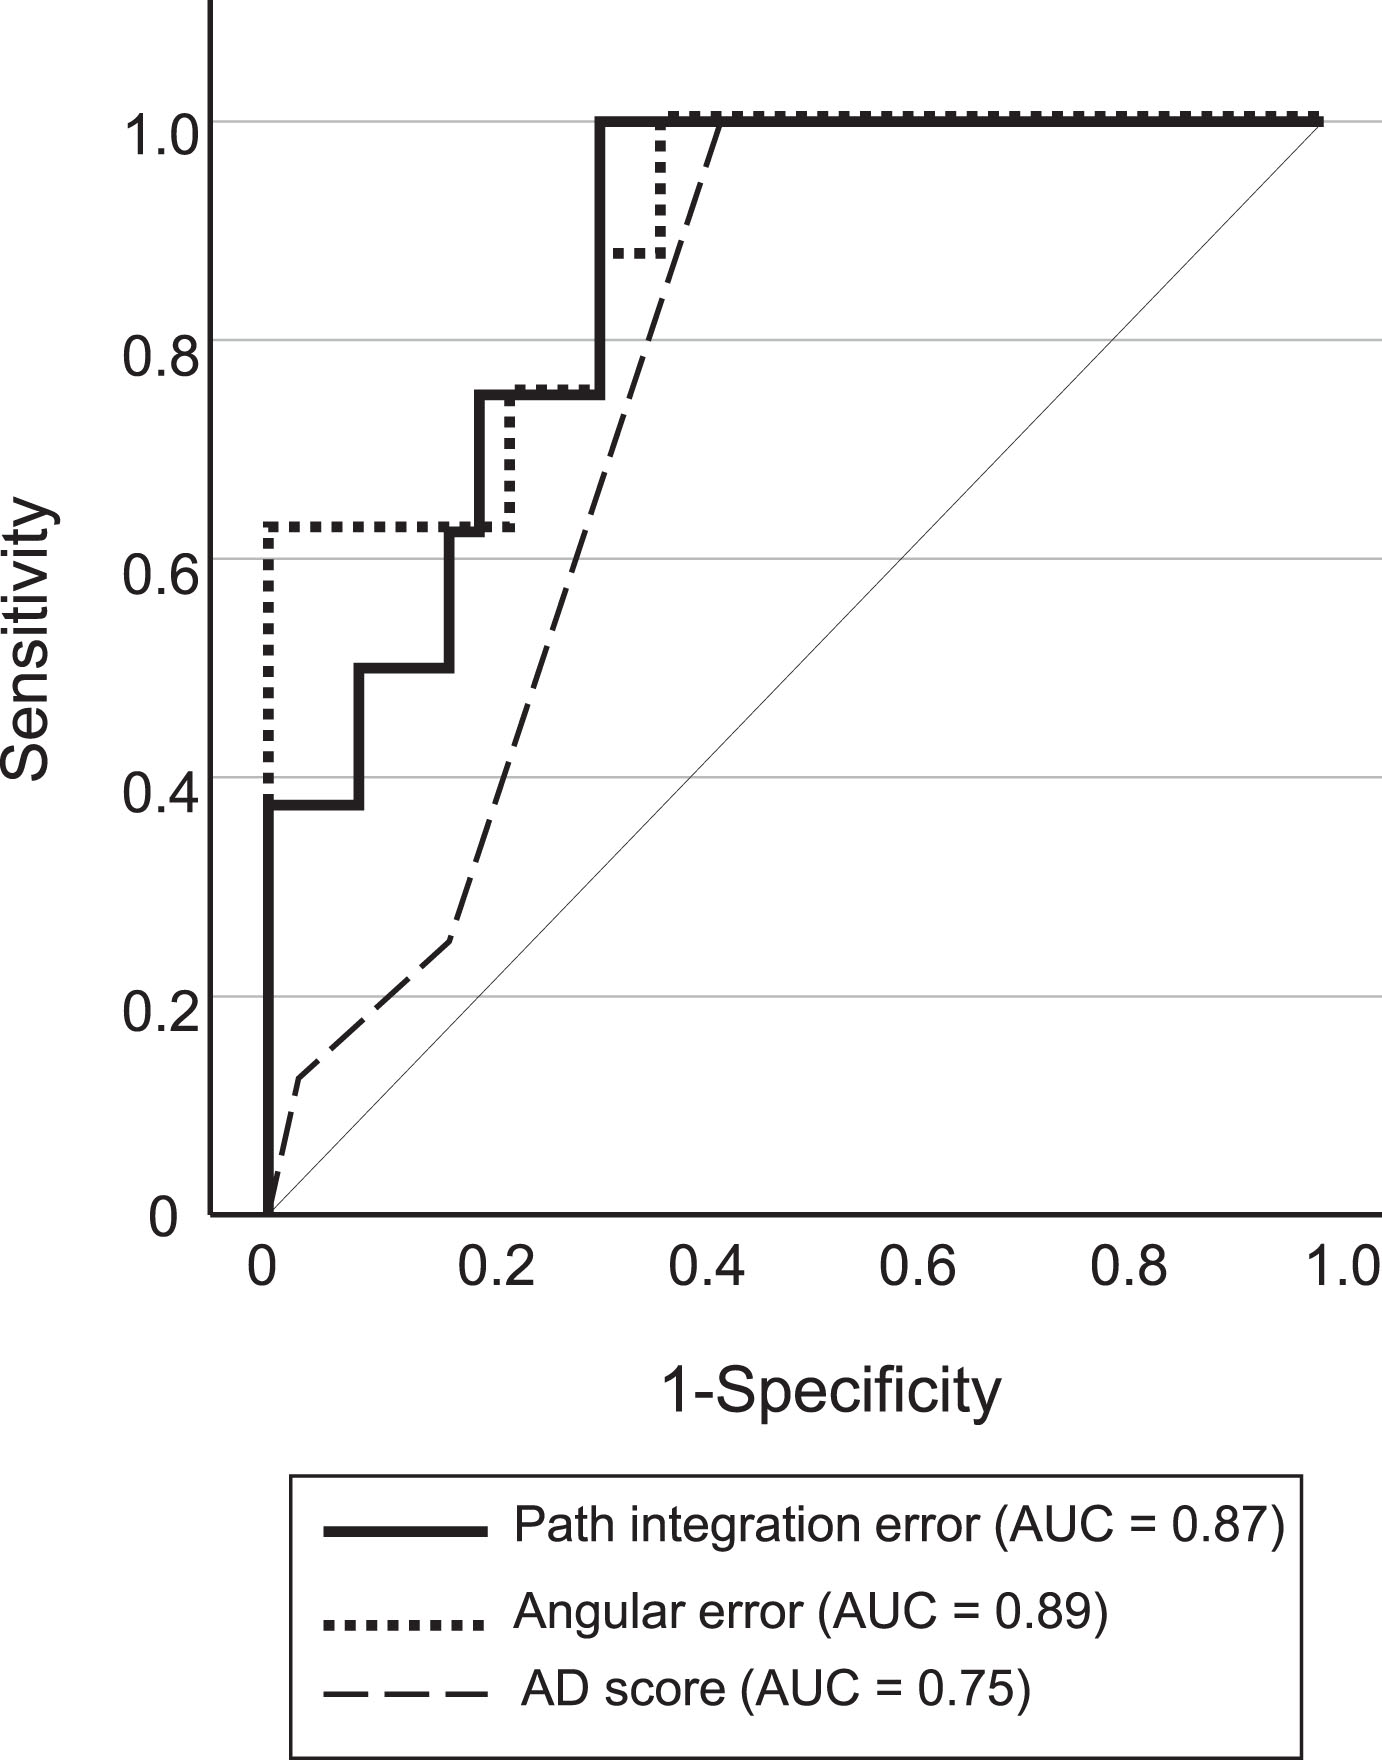
3) Classification accuracy of pMCI and sMCI using path integration performance As there were no significant differences in the results of baseline neuropsychological tests (WMSR-LM Story A, MMSE, and MoCA) between the pMCI and sMCI groups, we investigated the classification accuracy of pMCI and sMCI patients using path integration performance and AD score. Figure 5 shows ROC plots for the classification of pMCI and sMCI. The classification accuracy of pMCI and sMCI was relatively higher using path integration performance than using the AD score (sensitivity and specificity of 0.88 and 0.70, respectively, for path integration error [cut-off = 7.22 vm], 0.88 and 0.70, respectively, for angular error [cut-off = 23.75 degree] and 1.00 and 0.53, respectively, for AD score [cut-off = 2]), although the difference was not statistically significant (path integration error versus angular error, p = 0.751; path integration error versus AD score, p = 0.079; angular error versus AD score, p = 0.074).
Table 1
Comparison of demographics among patients of the EMCI, LMCI& ndash, and LMCI+ groups
| Demographic factor | EMCI | LMCI- | LMCI+ | Post-hoc paired comparison | |||
| EMCI vs. LMCI- | EMCI vs. LMCI+ | LMCI- vs. LMCI+ | |||||
| No. of patients | 14 | 20 | 37 | ||||
| Age, y | 74.9±6.6 | 73.5±8.0 | 74.7±6.5 | F-value=0.253 | |||
| Sex (male/female) | 7/7 | 10/10 | 13/24 | χ2 = 1.605, df = 2 | |||
| Education, y | 13.2±2.3 | 14.5±2.4 | 14.1±2.4 | F-value=1.139 | |||
| MMSE | 27.3±2.1 | 26.1±1.8 | 26.8±2.0 | F-value=1.366 | |||
| MoCA | 23.2±3.2 | 22.6±2.7 | 21.9±2.5 | F-value=1.584 | |||
| GDS-15 | 3.5±2.0 | 3.8±2.8 | 3.6±3.6 | F-value=1.235 | |||
| WMSR-LM Story A | 7.6±2.7 | 1.1±1.4 | 1.1±1.5 | F-value=76.113 | * | * | |
| AD score | 1.1±0.9 | 0.8±0.5 | 2.5±0.8 | F-value=35.104 | * | * | |
Values are shown as the mean±SD. MMSE, Mini-Mental State Examination; MoCA, Montreal Cognitive Assessment; WMSR-LM, Wechsler memory scale-revised; EMCI, early MCI; LMCI-, late MCI without AD brain imaging features; LMCI+, late MCI with AD brain imaging features; df, degrees of freedom *p < 0.0001.
Fig. 2
Path integration performance in patients with EMCI, LMCI–, and LMCI+. Box and Whisker plots showing the distribution of path integration error (A) and angular error (B) in patients with EMCI, LMCI–, and LMCI+. The median is represented as line located in the middle of the box. The top and bottom of the box are the 75th and 25th percentiles respectively, and the ends of the whiskers are the 75th (or 25th) percentile±1.5×interquartile range. The circle represents outliers. EMCI, early MCI; LMCI–, late MCI with an AD score of less than 2; LMCI+, late MCI with an AD score of 2 or higher.
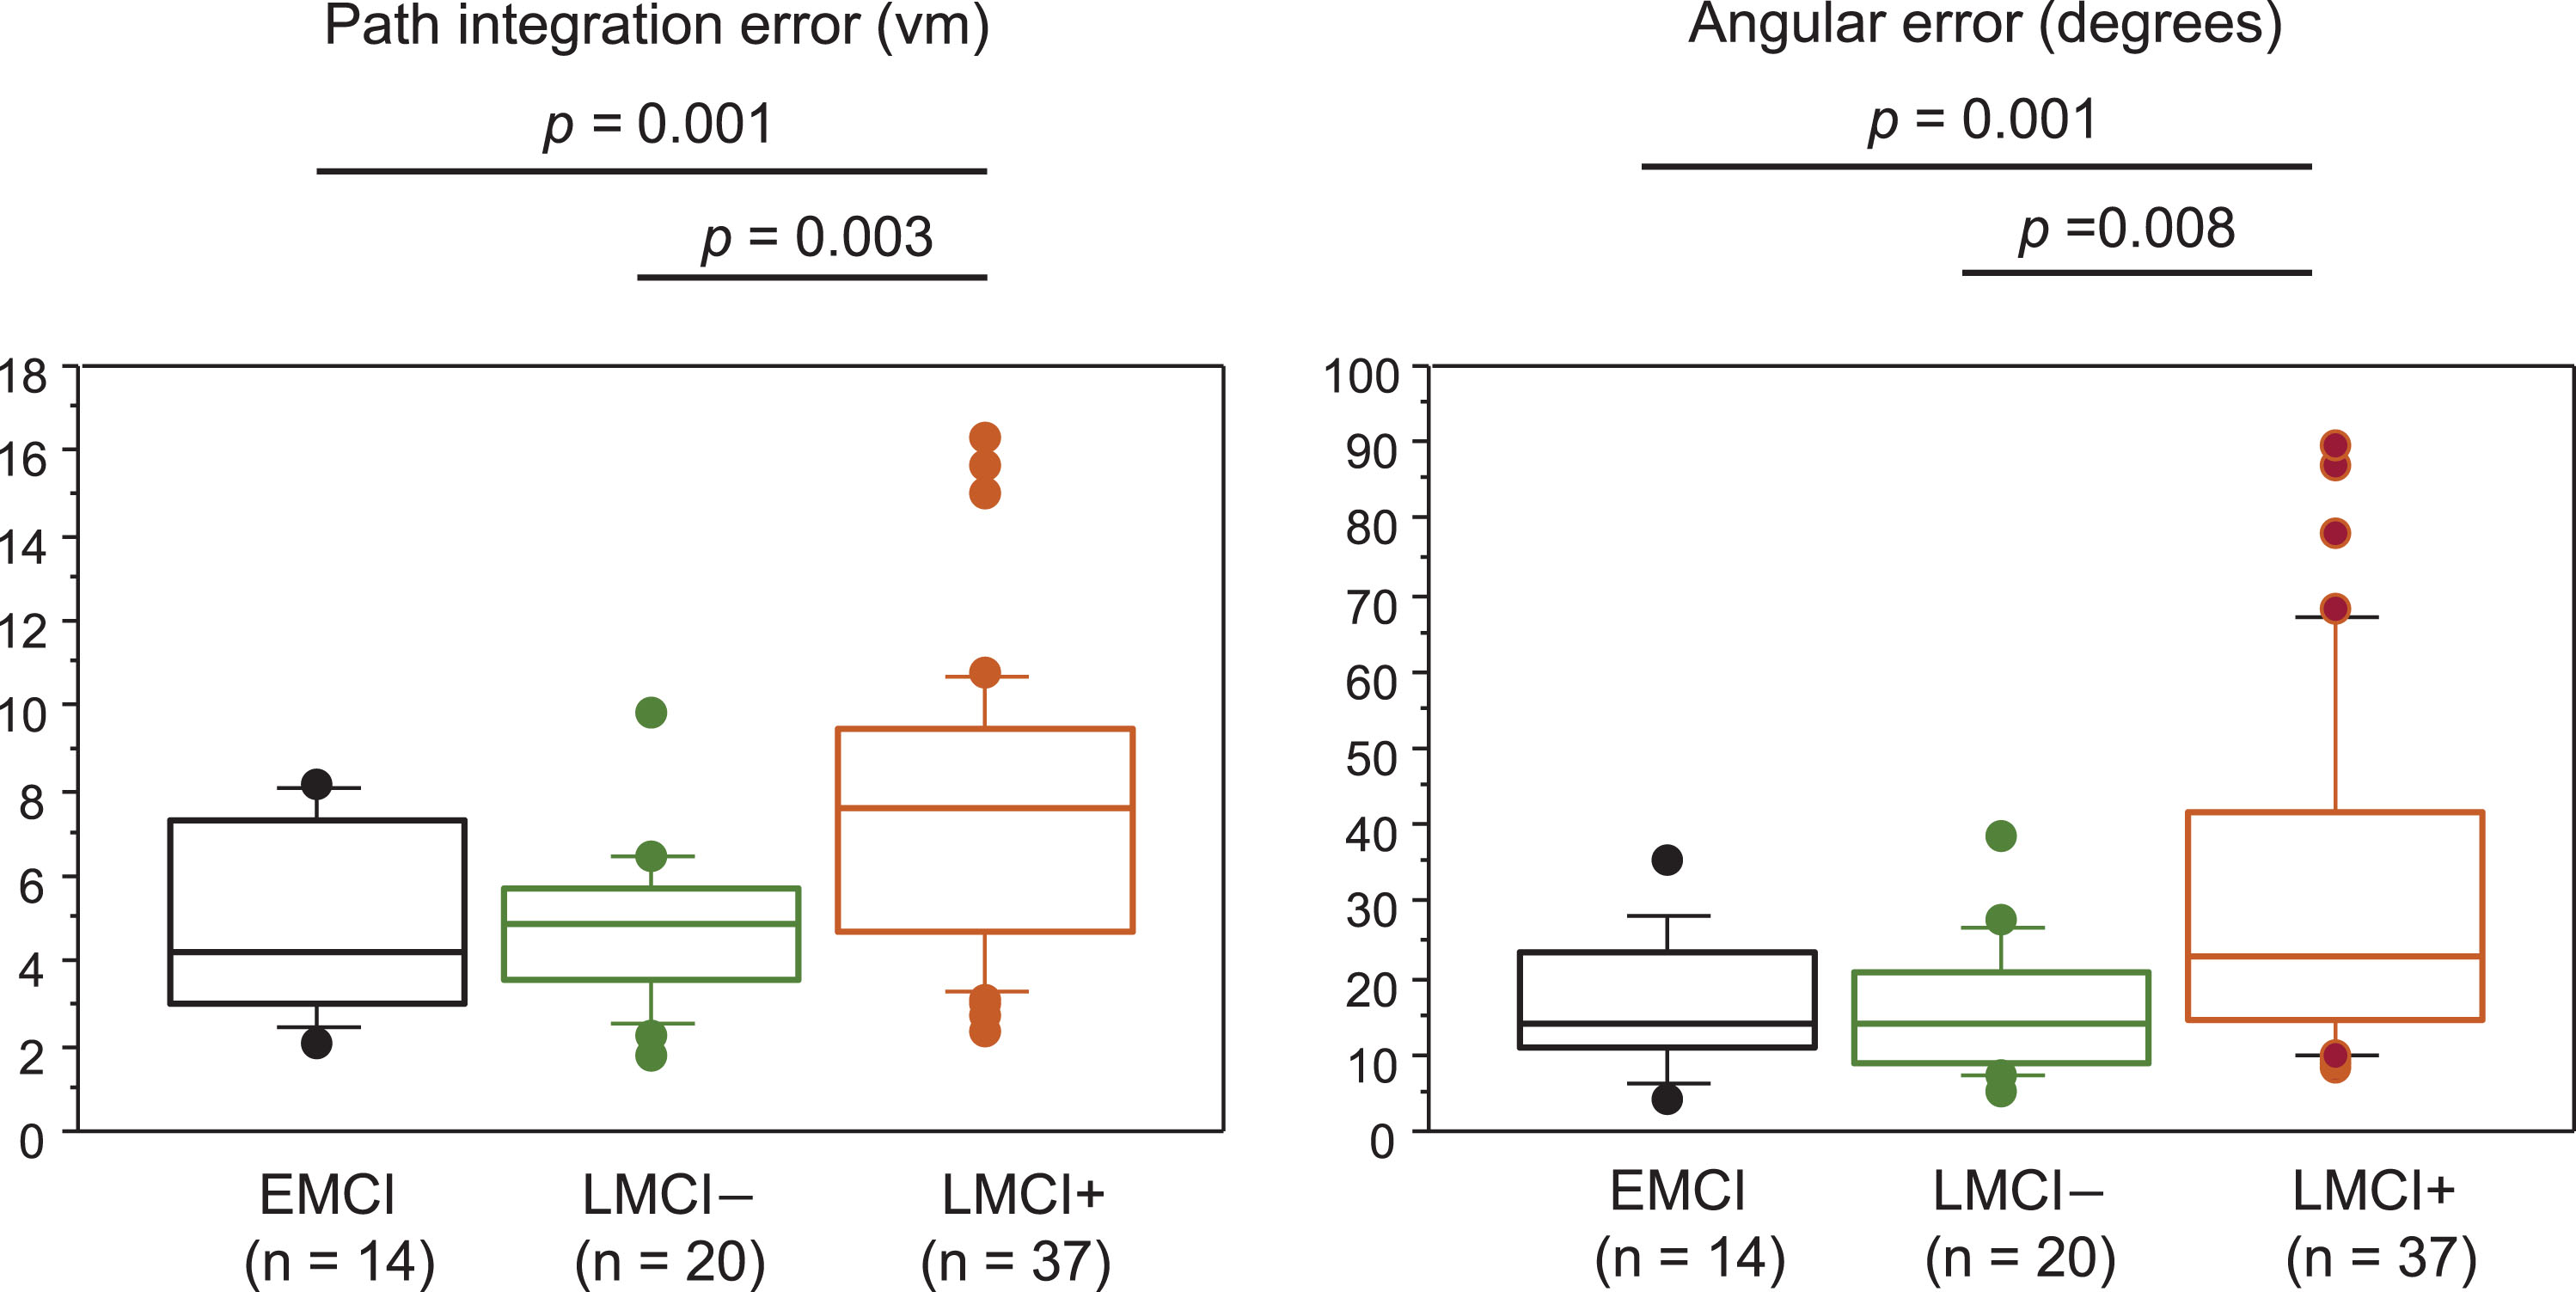
Table 2
Comparison of demographics between the pMCI group and the sMCI group
| Demographic factors | pMCI | sMCI | p |
| No. of patients | 8 | 37 | |
| MCI subtype (EMCI/LMCI–/LMCI+) | 0/0/8 | 8/14/15 | 0.009 (df = 2) |
| Age, y | 72.1±8.7 | 75.0±6.7 | 0.279 |
| Sex (male/female) | 2/6 | 13/24 | 0.883 |
| Education, y | 14.3±1.7 | 13.7±2.2 | 0.513 |
| Baseline | |||
| MMSE | 27.1±2.0 | 26.4±1.9 | 0.321 |
| MoCA | 22.5±2.3 | 22.2±2.5 | 0.729 |
| GDS-15 | 4.4±3.7 | 3.5±3.0 | 0.128 |
| WMSR-LM Story A | 0.7±1.5 | 2.3±2.8 | 0.161 |
| Duration of follow-up, months | 13.7±4.5 | 12.1±4.3 | 0.338 |
| Use of anti-dementia medications (%) | 8 (100%) | 23 (62%) | 0.092 |
| Average MMSE and MoCA score changes | –4.8±1.8 | 0.6±1.8 | <0.0001 |
| AD score | 2.3±0.7 | 1.5±1.1 | 0.027 |
Values are shown as the mean±SD. MMSE, Mini-Mental State Examination, MoCA, Montreal Cognitive Assessment; WMSR-LM, Wechsler memory scale-revised – Logical Memory; GDS, Geriatric Depression Scale; pMCI, progressive MCI; sMCI, stable MCI; EMCI, early MCI; LMCI–, late MCI without AD brain imaging features; LMCI+, late MCI with AD brain imaging features; df, degrees of freedom.
Fig. 3
Path integration performance in patients with pMCI and sMCI. Box and Whisker plots showing the distribution of path integration error (A) and angular error (B) in patients with pMCI and sMCI. The median is represented as line located in the middle of the box. The top and bottom of the box are the 75th and 25th percentiles respectively, and the ends of the whiskers are the 75th (or 25th) percentile±1.5×interquartile range. The circle represents outliers. pMCI, progressive MCI; sMCI, stable MCI.
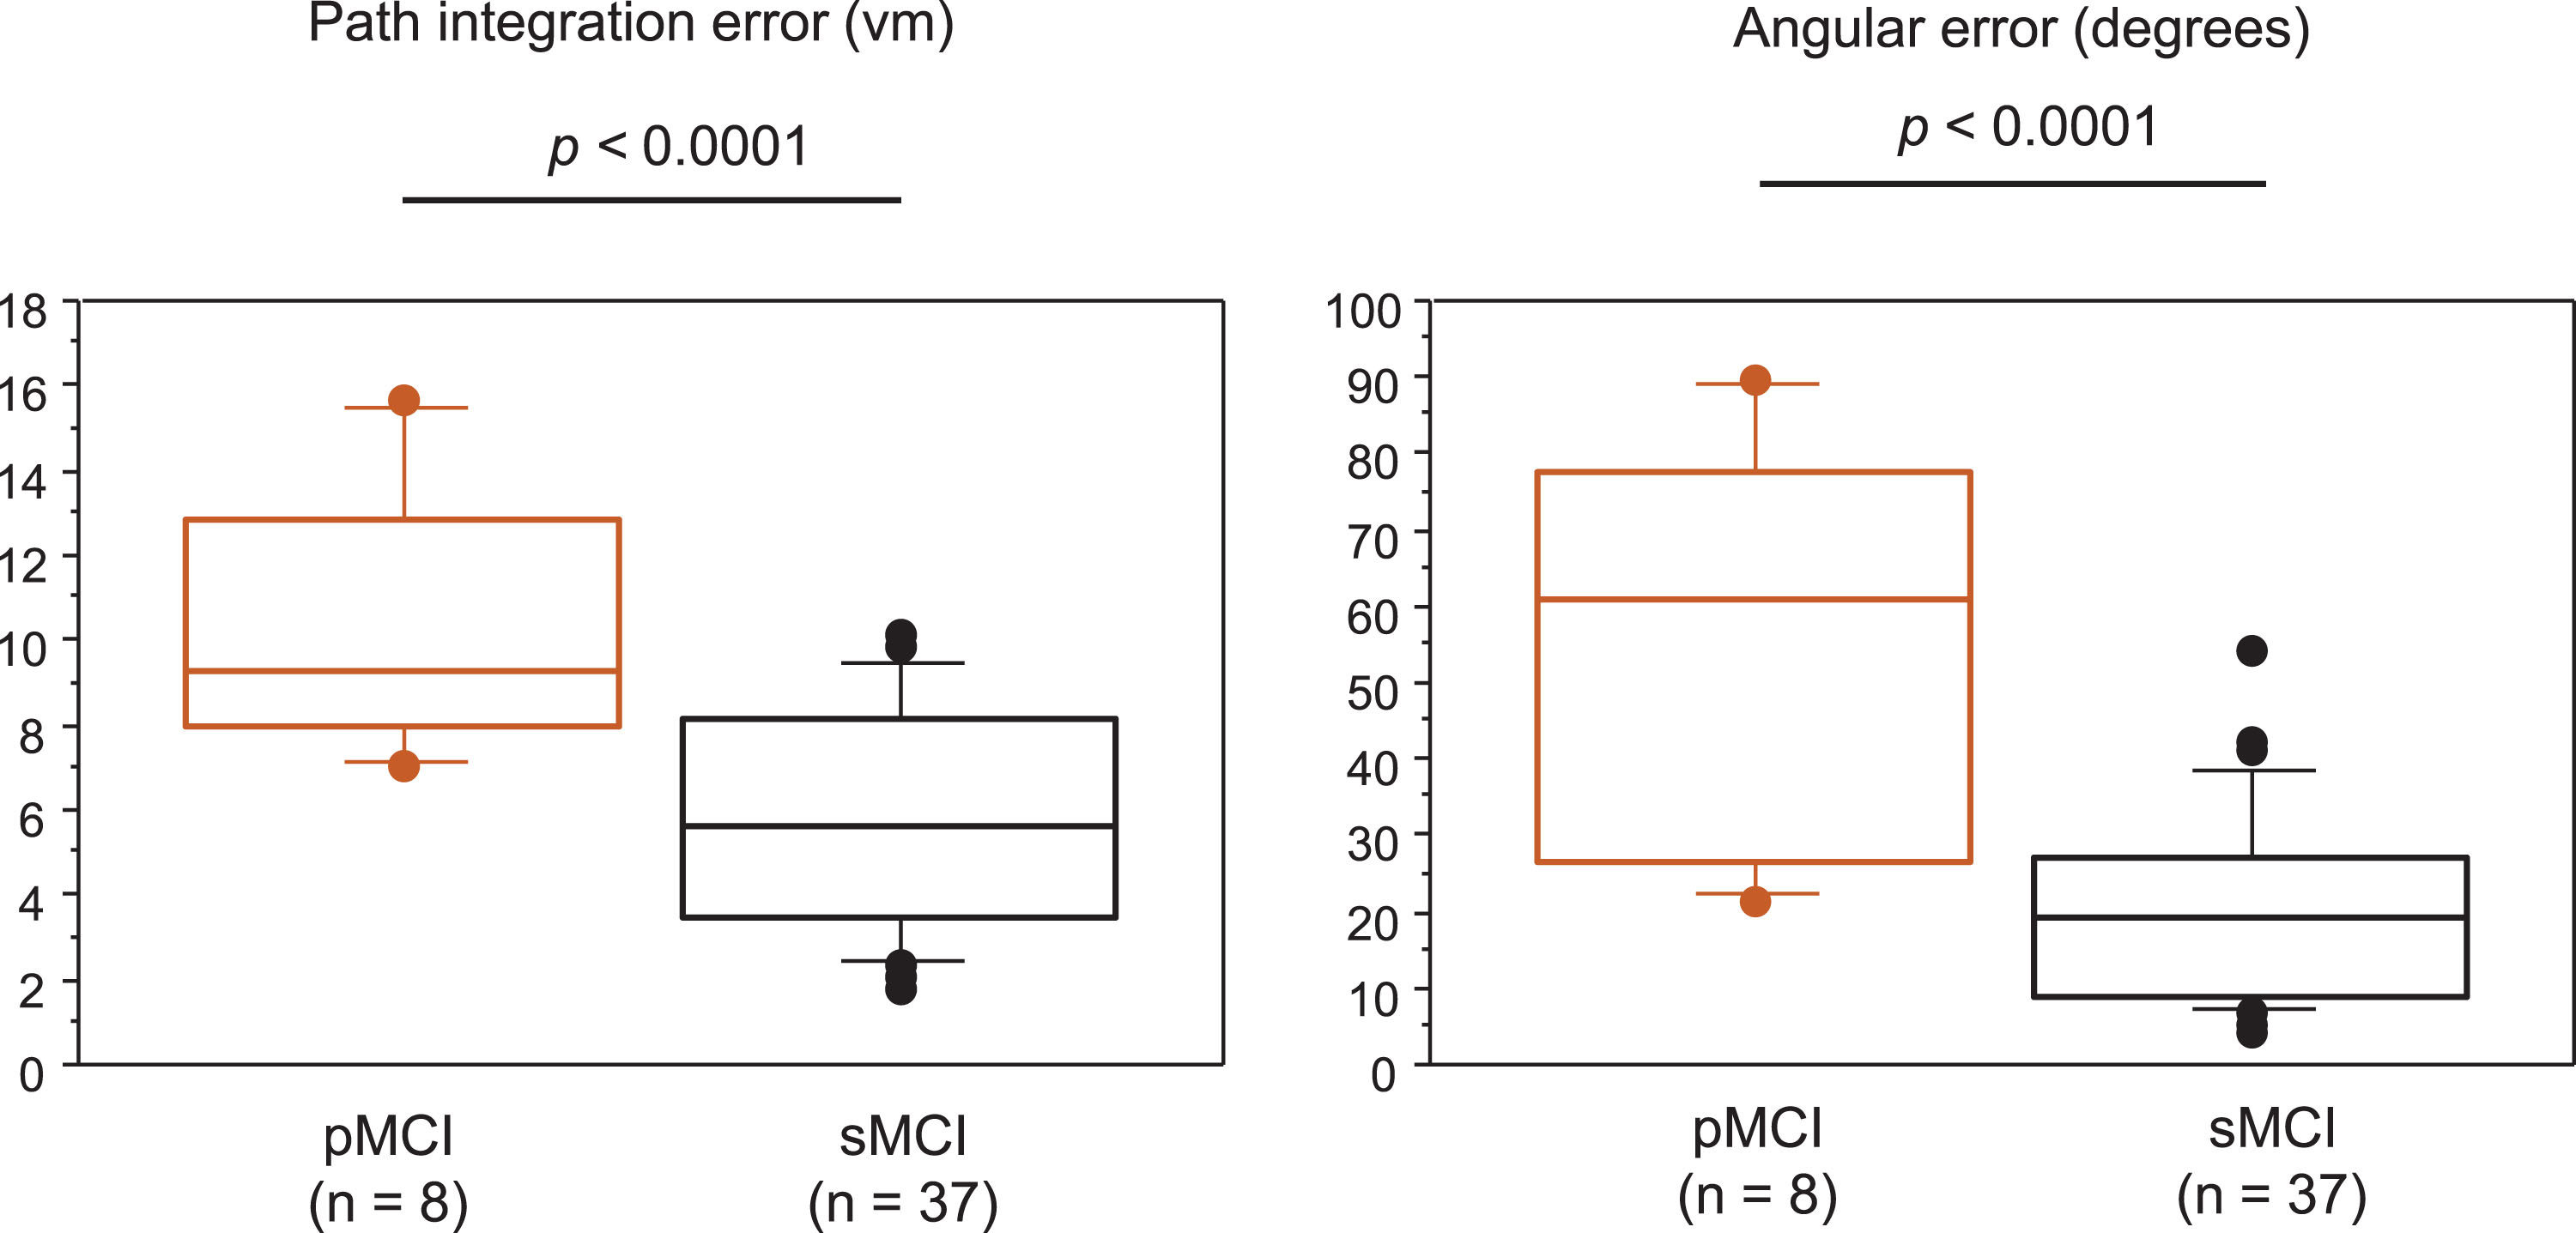
Fig. 4
Correlations of average MMSE and MoCA score changes with path integration performance and AD score.
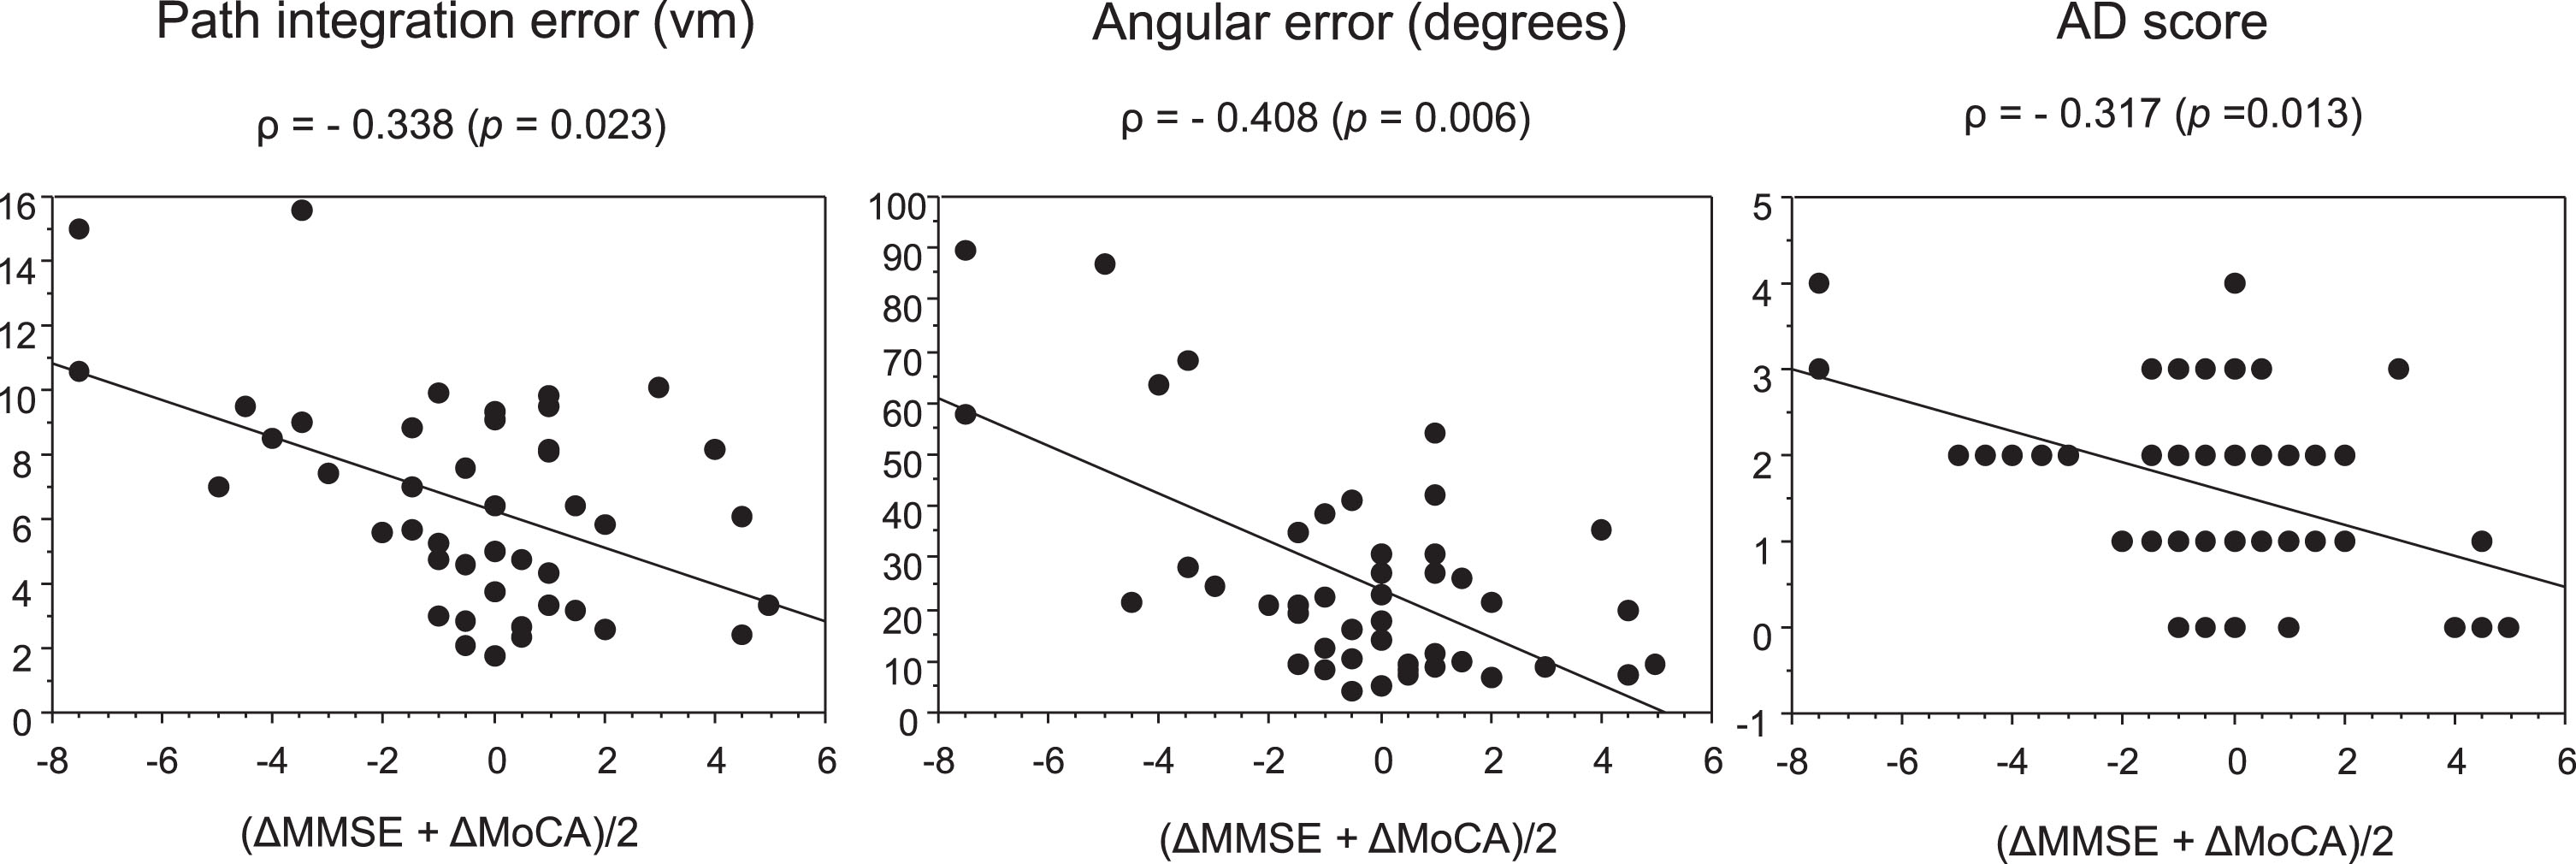
Fig. 5
Receiver operating curves for pMCI and sMCI classifications. pMCI, progressive MCI; sMCI, stable MCI; AUC, area under the curve.
DISCUSSION
We found that the path integration task6 could differentiate patients with LMCI+from those with LMCI– and EMCI, although MMSE and MoCA scores did not differ among the groups. Path integration performance was significantly lower in patients with pMCI than in those with sMCI, and also correlated significantly with average scores of MMSE and MoCA changes during the follow-up period. We found that path integration performance was able to distinguish patients with pMCI from those with sMCI with a high sensitivity and a high specificity, although there were no significant differences in classification accuracy between path integration and AD score. These results suggest that our VR navigation test is able to detect patients with prodromal AD, and can predict cognitive decline. Because our 3D VR path integration test is simple, noninvasive, inexpensive, and requires only a short time (approximately 12–15 min), it may be a useful screening test for therapeutic choice of disease-modifiers in individuals with prodromal AD.
Previous studies showed that path integration was impaired in patients with amnestic MCI.13–17 However, clinically diagnosed MCI is a pathologically heterogeneous disorder.27,28 In addition to AD pathology (neurofibrillary tangles mainly in the entorhinal cortex and hippocampus, corresponding to Braak stages 3 and 4), underlying brain pathologies of MCI include cerebrovascular lesions, Lewy bodies, TDP-43, argyrophilic grains, and others. Mixed pathologies are often observed in older patients. These pathological alterations likely affect navigational performance. We classified patients with amnestic MCI into those with EMCI and LMCI according to their severity of memory impairment based on ADNI criteria,19 because the prognosis and clinical course might differ between EMCI and LMCI.29 Patients with LMCI were moreover classified into those with LMCI+and LMCI–based on brain imaging results. As MTL atrophy and posterior hypoperfusion and hypofunction are characteristic imaging markers for AD that reflect AD pathology, patients with LMCI+are considered to have prodromal AD or be at increased risk of developing AD.30 In the present study, we found no significant correlations between path integration errors and cognitive impairments. The MMSE and MoCA are widely used as screening tests to assess global cognitive function, but do not include a domain of spatial navigation. Path integration differentiated patients with LMCI+from those with EMCI and LMCI–, even though conventional cognitive test scores (MMSE and MoCA) did not differ between these groups. Navigational errors in patients with EMCI and LMCI–were found to be comparable to those of normal volunteers in our previous study.6 These findings are consistent with the results from a study by Howett at al.15 Structural and functional MRI studies demonstrated that volume and signal changes in the entorhinal cortex and hippocampus correlate with navigational errors,8–10,12,15,16 supporting the role of the entorhinal cortex and hippocampus in path integration.
The detection of individuals who are likely showing signs of early cognitive decline among patients with prodromal AD is even more required in clinical practice, after the advent of disease-modifying therapies. The importance of cerebrospinal fluid (CSF) biomarkers,31 fluorodeoxyglucose PET,32 amyloid PET,33 SPECT,30 and MRI34 for predicting the conversion from MCI to AD has been described. However, there are few simple and noninvasive tools to predict the conversion of or cognitive decline of MCI patients. Wood et al.35 demonstrated that spatial memory testing based on the cognitive map theory of hippocampal function predicts the conversion from MCI to dementia. Although the aim of our present study was not to determine whether the path integration task can predict the conversion from MCI to AD, we were able to differentiate patients with pMCI from those with sMCI during 12 months, with a higher classification accuracy than AD scores. We believe that if a path integration test is added, individuals who are at high risk of developing AD can easily and accurately be identified. Then, CSF biomarkers and/or PET analyses can be performed to confirm amyloid accumulation in the brain before anti-amyloid therapy is started. Our results suggest that the task used in this study may be a simple screening test for the detection of MCI patients at high risk of developing AD (prodromal AD or progressing MCI), for considering anti-amyloid therapy.
Our study has some limitations. First, previous studies showed age-associated changes and sex differences in path integration performance.6,8,12 Although we found no significant differences in age and sex between the MCI groups, the consideration of age- and sex-adjusted navigational errors may be necessary to compare differences between the groups. As none of the participants showed any improvement in path integration performance in the 3 trials, we believe that there is no practice effect in this task. Second, our sample included patients with single-domain and multiple-domain amnestic MCI. As some researchers described that spatial navigation deficits differ between single-domain and multiple-domain amnestic MCI subjects,13,16 different performance results may be obtained for patients of each MCI subtype. Third, our follow-up duration was relatively short (about 12 months). Patients with sMCI may also show significant cognitive decline after a longer follow-up period. Further studies with MCI subtypes and longer follow-up periods will be needed to confirm our results. Finally, it has been suggested that path integration involves the integration of multiple sources of information across a wide neural network.7 Castegnaro et al.17 described that path integration reflects multiple subprocesses. In our path integration test, participants had access to self-motion information, boundary cues, and distant cues. Therefore, path integration errors may not solely reflect specific neural circuit disorders due to pathological developments in AD. To investigate the exact correlation with AD pathology, we plan to measure other types of path integration errors specifically associated with the development of AD pathologies and investigate their correlation with AD biomarkers.
Conclusion
Our 3D VR path integration task is able to differentiate patients with MCI who are at high risk of developing AD from those representing a heterogenous population, despite these patients showing comparable results in conventional cognitive tests. Moreover, our task predicts cognitive decline after 12 months in patients with MCI. This simple test is equivalent to or better than expensive, time-consuming and invasive neuroimaging to detect heightened risk of future AD. Our path integration task may hence have the potential as a screening tool in clinical practice for therapeutic choices of disease-modifying therapies in individuals with prodromal AD and early cognitive decline.
AUTHOR CONTRIBUTIONS
Haruo Hanyu (Conceptualization; Writing – original draft); Yumi Koyama (Investigation); Kazuki Umekida (Investigation); Sadayoshi Watanabe (Formal analysis); Hiroshi Matsuda (Formal analysis); Riki Koike (Investigation); Akihiko Takashima (Conceptualization).
ACKNOWLEDGMENTS
We are grateful to the medical editors of the Center for International Education and Research at Tokyo Medical University for editing and reviewing the English manuscript. We would like to thank Dr. Tomohiko Sato and Dr. Yuta Inagawa (Department of Geriatric Medicine, Tokyo Medical University) for their valuable help on the statistical analysis and interpretation of data. MIG Inc. provided the equipment for the 3D VR test and assisted with the 3D VR test measurements.
FUNDING
This study was funded by MIG Inc. and was supported by AMED grant number JP21wm0425016 to AT.
CONFLICT OF INTEREST
HH and HM received honorarium from MIG Inc. AT is a cofounder of MIG Inc. The other authors have no conflicts of interest to disclose in association with this study. HM is affiliated with an endowed chair provided by Southern Tohoku Research Institute for Neuroscience.
DATA AVAILABILITY
Data supporting the findings of this study are available from the corresponding author upon reasonable request.
REFERENCES
1. | Eisai. Eisai Obtains Manufacturing and Marketing Approval for Rekenvi® Intravenous Injection (Generic Name: Lecanemab) as a Treatment for Alzheimer’s Disease in Japan, https://www.eisai.co.jp/news/2023/news202359.html (2023, accessed 9 2023). |
2. | Berron D , Vogel JW , Insel PS , et al. Early stages of tau pathology and its associations with functional connectivity, atrophy and memory. Brain (2021) ; 144: : 2771–2783. |
3. | Fyhn M , Molden S , Witter MP , et al. Spatial representation in the entorhinal cortex. Science (2004) ; 305: : 1258–1264. |
4. | Jacobs J , Kahana MJ , Ekstrom AD , et al. A sense of direction in human entorhinal cortex. Proc Natl Acad Sci U S A (2010) ; 107: : 6487–6492. |
5. | Fu H , Rodriguez GA , Herman M , et al. Tau pathology induces excitatory neuron loss, grid cell dysfunction, and spatial memory deficits reminiscent of early Alzheimer’s disease. Neuron (2017) ; 93: : 533–541. |
6. | Koike R , Soeda Y , Kasai A , et al. Path integration deficits are associated with phosphorylated tau accumulation in the entorhinal cortex. Brain Commun (2024) ; 6: : fcad359. |
7. | Segen V , Ying J , Morgan E , et al. Path integration in normal aging and Alzheimer’s disease. Trends Cogn Sci (2022) ; 26: : 142–158. |
8. | Stangl M , Achtzehn J , Huber K , et al. Compromised grid-cell-like representations in old age as a key mechanism to explain age-related navigational deficits. Curr Biol (2018) ; 28: : 1108–1115. |
9. | Kunz L , Schröder TN , Lee H , et al. Reduced grid-cell– like representations in adults at genetic risk for Alzheimer’s disease. Science (2015) ; 350: : 430–433. |
10. | Bierbrauer A , Kunz L , Gomes C , et al. Unmasking selective path integration deficits in Alzheimer’s disease risk carriers. Sci Adv (2020) ; 6: : eaba1394. |
11. | Coughlana G , Coutrotb A , Khondokera M , et al. Toward personalized cognitive diagnostics of at-genetic-risk Alzheimer’s disease. Proc Natl Acad Sci U S A (2019) ; 116: : 9285–9292. |
12. | Newton C , Pope M , Rua C , et al. Entorhinal-based path integration selectively predicts midlife risk of Alzheimer’s disease. Alzheimers Dement (2024) ; 20: : 2779–2793. |
13. | Hort J , Laczó J , Vyhnálek M , et al. Spatial navigation deficit in amnestic mild cognitive impairment. Proc Natl Acad Sci U S A (2007) ; 104: : 4042–4047. |
14. | Laczó J , Andel R , Vyhnalek M , et al. Human analogue of the Morris water maze for testing subjects at risk of Alzheimer’s disease. Neurodegener Dis (2010) ; 7: : 148–152. |
15. | Howett D , Castegnaro A , Krzywicka K , et al. Differentiation of mild cognitive impairment using an entorhinal cortex-based test of virtual reality navigation. Brain (2019) ; 142: : 1751–1766. |
16. | Laczó M , Martinkovic L , Lerch O , et al. Different profiles of spatial navigation deficits in Alzheimer’s disease biomarker-positive versus biomarker-negative older adults with amnestic mild cognitive impairment. Front Aging Neurosci (2022) ; 14: : 886778. |
17. | Castegnaro A , Ji Z , Rudzka K , Chan D , et al. Overestimation in angular path integration precedes Alzheimer’s dementia. Curr Biol (2023) ; 33: : 4650–4661. |
18. | Fazekas F , Chawluk JB , Alavi A , et al. MR signal abnormalities at 1.5T in Alzheimer’s dementia and normal aging. AJR Am J Roentgenol (1987) ; 149: : 351–356. |
19. | Edmonds EC , McDonald CR , Marshall A , et al. Early vs. late MCI: Improved MCI staging using a neuropsychological approach. Alzheimers Dement (2019) ; 15: : 699–708. |
20. | Folstein M , Folstein S and McHugh P “Mini-mental state”-a practical method for grading the cognitive state of patients for the clinician. J Psychiatr Res (1975) ; 12: : 189–198. |
21. | Nasreddine ZS , Phillips NA , Bedirian V , et al. The Montreal Cognitive Assessment, MoCA: A brief screening tool for mild cognitive impairment. J Am Geriatr Soc (2005) ; 53: : 695–699. |
22. | Mitchell AJ , Bird V , Rizzo M , et al. Diagnostic validity and added value of the geriatric depression scale for depression in primary care: A meta-analysis of GDS30 and GDS15. J Affect Disord (2015) ; 125: : 10–17. |
23. | Matsuda H , Mizumura S , Nemoto K , et al. Automatic voxel-based morphometry of structural MRI by SPM8 plus diffeomorphic anatomic registration through exponentiated lie algebra improves the diagnosis of probable Alzheimer Disease. AJNR Am J Neuroradiol (2012) ; 33: : 1109–1114. |
24. | Minoshima S , Frey KA , Koeppe RA , et al. A diagnostic approach in Alzheimer’s disease using three-dimensional stereotactic surface projections of fluorine -18 FDG PET. J Nucl Med (1995) ; 36: : 1238–1248. |
25. | Ishii K , Ito K , Nakanishi A , et al. Computer-assisted system for diagnosing degenerative dementia using cerebral blood flow SPECT and 3D-SSP: A multicenter study. Jpn J Radiol (2014) ; 32: : 383–390. |
26. | Sato T , Hanyu H , Koyama Y , et al. Discrepancy between the degree of cognitive impairment and brain imaging abnormalities in Alzheimer disease patients is associated with cognitive reserve. J Alzheimers Dis (2021) ; 84: : 273–281. |
27. | Schneider JA , Arvanitakis Z , Leurgans SE , et al. The neuropathology of probable Alzheimer disease and mild cognitive impairment. Ann Neurol (2009) ; 66: : 200–208. |
28. | Markesbery WR Neuropathologic alterations in mild cognitive impairment: A review. J Alzheimers Dis (2010) ; 19: : 221–228. |
29. | Lin SY , Lin PC , Lin YC , et al. The clinical course of early and late mild cognitive impairment. Front Neurol (2022) ; 13: : 685636. |
30. | Yuan Y , Gu Z-X and Wei WS Fluorodeoxyglucose-positron-emission tomography, single-photon emission tomography, and structural MR imaging for prediction of rapid conversion to Alzheimer disease in patients with mild cognitive impairment: A meta-analysis. AJNR Am J Neuroradiol (2009) ; 30: : 404–410. |
31. | Ferreira D , Rivero-Santana A , Perestelo-Pérez L , et al. Improving CSF biomarkers’ performance for predicting progression from mild cognitive impairment to Alzheimer’s disease by considering different confounding factors: A meta-analysis. Front Aging Neurosci (2014) ; 16: : 287. |
32. | Smailagic N , Vacante M , Hyde C , et al. 18F-FDG PET for the early diagnosis of Alzheimer’s disease dementia and other dementias in people with mild cognitive impairment (MCI). Cochrane Database Syst Rev (2015) ; 1: : CD010632. |
33. | Zhang S , Smailagic N , Hyde C , et al. (11) C-PIB-PET for the early diagnosis of Alzheimer’s disease dementia and other dementias in people with mild cognitive impairment (MCI). Cochrane Database Syst Rev (2014) ; 7: : CD010386. |
34. | Risacher SL , Shen Li , West JD , et al. Longitudinal MRI atrophy biomarkers: Relationship to conversion in the ADNI cohort. Neurobiol Aging (2010) ; 8: : 1401–1418. |
35. | Wood RA , Moodley KK , Lever C , et al. Allocentric spatial memory testing predicts conversion from mild cognitive impairment to dementia: An initial proof-of-concept study. Front Neurol (2016) ; 7: : 215. |


