
Impact of Preanalytical Procedures on Complement Biomarkers in Cerebrospinal Fluid and Plasma from Controls and Alzheimer’s Disease Patients
Abstract
Background:
Studies comparing cerebrospinal fluid (CSF) and plasma complement proteins in Alzheimer’s disease (AD) patients versus healthy controls (HC) have yielded inconsistent results. Discrepancies in the preanalytical sample handling could contribute to the heterogeneity in the reported findings.
Objective:
Using qualified immunoassays, we aimed at assessing the impact of preanalytical procedures on complement proteins in blood and CSF from AD patients and HCs.
Methods:
We supplemented HC and AD CSF/plasma with complement stabilizers and measured the complement proteins C4a, C4, C3a, C3, Factor Bb and Factor B by immunoassay. We tested the impact of freeze-thaw (FT) cycles on fluid complement proteins.
Results:
Most complement proteins were mildly impacted by FT cycles in plasma but not CSF, except for C3a which displayed greater sensitivity to FTs in CSF than in plasma. In CSF, the effect of FTs on C3a was reduced but not prevented by the supplementation with EDTA (±Futhan).
Conclusions:
Our findings provide recommendations for CSF/plasma sample handling to ensure robust and reproducible complement biomarker analyses in AD.
INTRODUCTION
Alzheimer’s disease (AD), the leading cause of dementia, is characterized by two pathological hallmarks including extracellular amyloid-β (Aβ) plaques and intracellular neurofibrillary tau tangles.1 Recent genetic, molecular, and clinical evidence suggests that neuroimmune mechanisms are associated with AD risk and contribute to disease progression.2 AD patients display alterations in brain, cerebrospinal fluid (CSF) and blood inflammatory proteins.3–8 This suggests that neuroinflammation represents a third pathological hallmark of AD, although it is controversial whether immune cells exert beneficial or detrimental activities in the pathogenesis of AD.9,10 Among the effector mechanisms of the immune system, the complement cascade has been shown to contribute to the pathological synapse loss in AD.11
As part of the innate immune system, the complement system comprises a cascade of protein reactions which results in the lysis of pathogens, recruitment of immune cells and the clearance of apoptotic cells. Complement activation occurs via three distinct pathways: The classical pathway (CP) is activated by immune complexes and other molecules such as actin or myelin. Lectin pathway (LP) activation is promoted by carbohydrates present on the surface of pathogens. CP and LP induce the cleavage of C4 into C4a and C4b, followed by the cleavage of C2 into C2a and C2b and the formation of a C3 convertase, cleaving C3 into C3a and C3b. In the alternative pathway (AP), spontaneously hydrolyzed C3 interacts with Factor B (FB) and Factor D to generate the Factor Ba and Factor Bb (Bb) cleavage fragments and form the C3 convertase. All pathways converge onto the formation of a C5 convertase, cleaving C5 into C5a and C5b and initiating the osmolysis of cells or pathogens via the membrane attack complex. C3a and C5a act as pro-inflammatory anaphylatoxins, while the opsonins C4b and C3b promote the phagocytosis of invading organisms and altered self.12
Disrupted complement function has been associated with neurological autoimmune and neurodegenerative disorders, including AD.13,14 Complement activation products have been shown to colocalize with amyloid plaques and neurofibrillary tangles in AD brains.15 Moreover, increased brain expression of CP (but not LP or AP) components has been reported in human AD and mouse models of amyloidosis and tauopathy.16,17 The current accepted model suggests that the CP initiating molecule C1q targets synapses, leading to C4 and C3 cleavage followed by glial engulfment of synapses through C3b opsonization.18 The inhibition or deletion of C1q or C3 rescued synapse loss in mouse models of amyloidosis and tauopathy, suggesting that the CP contributes to neurodegeneration in AD.17–19 Thus, there is an increasing interest to further characterize the type and extent of complement pathway activation and develop complement targeting-therapeutics in AD.
Plasma and CSF complement proteins are not established as reliable AD prognostic or pharmacodynamic biomarkers, in part due to the heterogeneity in the results reported across studies.4,5,17,19–25 Like for many other fluid biomarkers of neurodegenerative diseases, possible explanations for the inconsistencies across studies include small patient cohorts, differences in the diagnostic criteria and sample collection/handling procedures as well as analytical methods.26 Complement proteins are labile and can undergo spontaneous in vitro activation as a result of improper sample handling or variable intrinsic protease activity.27–29 Therefore, well-controlled preanalytical sample handling may be a prerequisite to obtain robust and reproducible complement activity measurements in biofluids.
Blood complement protein levels are typically analyzed in EDTA plasma (∼6 mM EDTA30,31) to limit in vitro complement activation in blood by chelating Ca2+ and Mg2+ ions thereby, blocking the function of the C1 complex and the C3 convertases.27–29,32,33 Yet, in vitro complement activation still occurs in EDTA plasma.34 Blood in vitro complement activation may be minimized through the supplementation with higher EDTA concentrations35,36 and/or the addition of protease inhibitors (e.g., the serine protease inhibitor Futhan-175 (FUT)34 or broad spectrum protease inhibitor cocktails (PIC)). In contrast to blood, the stability of CSF complement proteins has not been investigated. Also, it remains unknown whether AD pathology could influence the expression or activity of complement cleaving enzymes and thus impact CSF/plasma analyte stability.
This study aimed at evaluating the impact of stabilizing additives and freeze-thaw (FT) cycles on the stability of CSF and blood complement proteins in healthy control (HC) and AD subjects. To this end, we developed and/or qualified immunoassays to measure CSF/plasma complement proteins reflecting CP/LP activity (C4, C4a); AP activity (FB, Bb) as well as C3 activation downstream CP/LP/AP activity (C3, C3a) (Supplementary Figure 1). We then applied the 6 immunoassays in AD and HV CSF/plasma collected in the presence or absence of additives and submitted to up to four FTs.
METHODS
Study design
This prospective, non-interventional study was conducted between November 2021 and January 2022 in Germany. The samples were collected at the University Hospital, LMU Munich, Germany. The study was conducted in accordance with the principles of the Declaration of Helsinki and the International Council for Harmonisation Good Clinical Practice guidelines. All participants provided written informed consent to participate in the Munich mental health biobank (MMHB) project, including the collection, storage, analysis, scientific utilization, and distribution of samples. CSF and Blood samples were anonymized, and no clinical data was shared. MMHB was conducted by the Department of Psychiatry and Psychotherapy, LMU Munich, and received approval from the ethics committee of LMU Munich (project number 18–716).
Participants and sample collection/handling
Eligible participants were patients with cognitive impairment due to possible or probable AD according to the National Institute on Aging-Alzheimer’s Association criteria,37 presenting for routine clinical visits at the University Hospital, LMU Munich, Germany. Genentech Inc. received the samples for CSF/plasma for complement biomarker measurements as well as the CSF Aβ42 and Aβ40 data generated by LMU Munich. Genentech Inc. received no further patient information. The study included subjects with subjective cognitive impairment (SCI), early and moderate AD. Participants with AD were further subdivided into dementia due to AD and MCI due to AD: The criteria for Alzheimer’s dementia were met if the cognitive or behavioral symptoms were objectified by cognitive tests, interfered with activities of daily living, showed a significant decline compared with the premorbid state, were not explained by other psychiatric or neurological conditions and were confirmed by an informant.37 MCI due to AD was defined as objective but evidence of cognitive decline (scores on cognitive tests below –1 or –1.5 standard deviations the standardized mean) cross-sectionally or longitudinally decline of –1 to –.15 standard deviations together with subjective concerns about the cognition and preservation of independency in the daily life.38 All individuals were administered a standardized battery of neuropsychological tests assessing multiple cognitive domains, including verbal and visual episodic memory, semantic memory, verbal ability, executive function, visuospatial function and praxis by the expanded Consortium to Establish a Registry for Alzheimer’s Disease (CERAD) battery including the Trail Making Test (TMT) part A and B (visual attention and set shifting/executive control).39 No blinding or predetermined sample size calculations were employed.
CSF and blood samples were collected as previously described.40 The lumbar puncture at L4/L5 was performed using the drip method. After discarding the first 1–2 mL, the blood-free CSF was collected directly into a 15 mL primary polypropylene collection tube (Sarstedt AG, Numbrecht, Germany). The primary collection tube was inverted 2–3 times to gently mix the sample and placed on wet ice at 4°C. Within 10 min after the collection, the CSF was centrifuged at 2000g for 10 minutes at 4°C. After centrifugation, the supernatant was dispensed into the pre-aliquoted 0.5 mL polypropylene screw top microtubes (Sarstedt AG, Numbrecht, Germany) containing either water (No Addition), EDTA, EDTA + FUT or PIC (see section ‘Preanalytical assessments’). During the aliquotation the primary collection tubes and the aliquot tubes were kept on ice at 4°C. The samples were vortexed to mix the CSF with the pre-aliquoted chemicals, frozen and stored at –80°C.
For the venepuncture, approximately 6 mL of whole blood were collected into a 6 mL K2EDTA primary collection tube (BD Life Sciences). The blood collection tube was inverted gently 8–10 times to ensure the anticoagulant is mixed well with the blood and placed on wet ice at 4°C. Within 10 min after the collection, the blood was centrifuged at 1500 g for 10 minutes at 4°C. After centrifugation, the supernatant was dispensed into the pre-aliquoted 0.5 mL polypropylene screw top microtubes (Sarstedt AG, Numbrecht, Germany) containing either water (No Addition), EDTA, EDTA + FUT or PIC (see section ‘Preanalytical assessments’). During the aliquotation, the blood collection tubes and the aliquot tubes were kept on ice. The samples were vortexed to mix the plasma with the pre-aliquoted chemicals, frozen and stored at –80 °C.
Preanalytical assessments
Assessment of the sample supplementation with EDTA, EDTA + FUT or PIC at the clinical site
Polypropylene 0.5 mL screw cap micro tubes (Sarstedt AG, Numbrecht, Germany) were pre-aliquoted with either water or complement-stabilizing agents. The volume of the pre- aliquoted solution was less than 10% of the final sample volume. The final concentration of the additives in the CSF and blood samples were as follows: 20 mM EDTA (Sigma Aldrich),+1X (50μg/mL) FUT (FUT-175, BD Biosciences), 1X PIC (Complete Protease inhibitors; Roche). The blood samples were collected in a 6 mL K2EDTA primary collection tube (BD Life Sciences) containing 10.8 mg EDTA according to the manufacturer’s instructions. The resulting plasma with a molarity of ∼6.2 mM EDTA was supplemented with extra EDTA to bring the EDTA molarity up to 20 mM.
Assessment of the FT cycles
To evaluate the effects of FT cycles on CSF and blood biomarker levels, aliquoted CSF or plasma were subjected up to four FT cycles. During each FT cycle, samples were frozen at –80°C for ≥16 h before thawing on ice. Since the assays were not run at the clinical site, no biomarker measurements were performed in fresh never-frozen samples.
Aβ42 and Aβ40 measurements
Immunoassays from IBL International (Hamburg, Germany) (Aβ1-40 and Aβ1–42) were used and their values were interpreted according to values established by the LMU laboratory: Aβ1–42/1–40 ratio < 5.5% were considered amyloid positive.
Complement measurements
Four ELISAs were developed to measure C3, C3a, C4, and Factor B in plasma and CSF. The C3 assay measures full-length C3 using anti-human C3a polyclonal antibody (R& D Systems, catalog AF3677) as a capture antibody and polyclonal anti-human C3 antibody for detection (MP Bio, catalog 0855033). The C3a assay was designed to only measure the cleaved C3a and C3a desArg fragments, using a monoclonal anti-human C3a antibody (R& D Systems, clone 354113) capture and a monoclonal detection antibody also specific to C3a/C3a desArg (Biolegend, clone K13/16). In the C4 assay, we employ a polyclonal anti-human C4c antibody for capture (Abbexa, catalog abx102219) and a monoclonal anti-human C4c antibody (Quidel, catalog A211) for detection, both purported to be specific to C4c. However, in our testing, the capture antibody has shown specificity to only C4 and C4b, and the assay measures both full-length C4 and C4b fragments. We note that despite the cross-reactivity of the C4 assay with C4b (Table 1), the assay is sensitive to ex vivo complement activation with HAGG suggesting a preferential detection of endogenous C4 (Supplementary Figure 1b). The Factor B ELISA was developed to measure full-length Factor B with a monoclonal anti-human Factor B (AbCam, clone 6G11) used for capture and Genentech derived monoclonal anti-human Factor B for detection. Calibration curve proteins were purchased from Complement Tech, C3 (A113), C3a (A118), C4 (A105), and Factor B (A135). Samples were prepared either at a single dilution in duplicate or at four serial dilutions in singlicate. The mean value of each sample was reported. For all the developed ELISAs, 96-well half-area high bind microplates (Corning) were coated with capture antibodies diluted in PBS and incubated at 2–8 °C for 18 to 72 h. Plates were washed and blocked (PBS, 0.5% BSA, 15 ppm Proclin) for 1 h. After washing with PBS, 0.05% Tween 20, standards, controls and samples were diluted in 1X PBS pH 7.4, 0.5% BSA, 0.05% Tween 20, 0.35 M NaCl, 0.25% CHAPS, 0.2% BgG, 5 mM EDTA, 15PPM Proclin, added to the microplate wells and then incubated for 1.5 h at room temperature (RT). After a wash step, for C3, C3a, and C4 assays, detection antibodies directly conjugated to HRP (Dojindo) were added and incubated for 1 h at RT before a final wash step. For Factor B, a biotinylated detection antibody was added to the wells and incubated for 1 h at RT. After another wash step, streptavidin poly-HRP (Cytiva) solution was added to the microplate wells and incubated for 30 min at RT. Detection antibodies were diluted in PBS, 0.5% BSA, 0.05% Tween 20, pH7.4, 15 PPM Proclin. After final wash steps, TMB substrate solution was added to the wells for color development, which was stopped by the addition of 1M phosphoric acid. The optical density was measured at 450 nm with a 650 nm reference wavelength subtraction, using a SpectraMax ELISA plate reader (Molecular Devices). Standard regression was established using a logistic (4-PL) curve fit.
Table 1
Sensitivity, precision and specificity results for the complement assays
| Sensitivity | Precision | Specificity | ||
| Assay Range (LLOQ–ULOQ) (ng/mL) | Inter-/Intra-Assay (% CV) | Tested Protein | Tested Levels (ng/mL) | Reactivity (%) |
| Factor B (0.031–2.0) | 10.0/6.2 | Factor Ba | 12.5–200 | 0.0 |
| Factor Bb | 12.5–200 | 0.0 | ||
| Factor Bb (0.230–23.3)* | 10.9/2.6 | Factor B | 20.0–60 | 5.0 |
| Factor Ba | 10.0–20 | 0.0 | ||
| C3 (0.313–20.0) | 14.1/7.8 | C3a | 11.1–300 | 0.0 |
| C3b | 11.1–300 | 1.3 | ||
| C3c | 11.1–300 | 0.5 | ||
| C3d | 11.1–300 | 0.0 | ||
| C3a (0.016–1.0) | 14.4/8.4 | C3 | 0.781–100 | 0.7 |
| C3a desArg | 0.781–100 | 99.4 | ||
| C3b | 0.781–100 | 0.0 | ||
| C3c | 0.781–100 | 0.0 | ||
| C3d | 0.781–100 | 0.0 | ||
| C4 (0.047–3.0) | 11.4/3.0 | C4a | 11.1–300 | 2.6 |
| C4a desArg | 11.1–300 | 2.4 | ||
| C4b | 11.1–300 | 100.0 | ||
| C4c | 11.1–300 | 0.0 | ||
| C4d | 11.1–300 | 0.0 | ||
| C4a (0.313–20.0) | 19.2/6.9 | C4 | 10.0–100 | 0.4 |
| C4b | 10.0–100 | 0.0 | ||
| C4c | 10.0–100 | 0.1 | ||
| C4d | 10.0–100 | 0.1 | ||
*Tested on Quanterix Simoa Platform. desArg, desarginated; LLOQ, Lower limit of quantification; ULOQ, upper limit of quantification.
C4a concentrations were determined by a sandwich ELISA using the Human C4a ELISA kit (BD Biosciences), according to the product instructions. Factor Bb measurements were performed on the Simoa platform as described previously.41
All complement immunoassays were qualified for key parameters including precision, dilution linearity, specificity, spike recovery and cross-reactivity following industry guidelines.35–37 To determine the precision of the assays, two QC plasma samples were assayed separately three times over 2–3 days (inter-assay precision), as well as reproducibility within a single run (intra-assay precision) with acceptance criteria of 20%. Dilution linearity was tested by diluting CSF (n = 3) and plasma (n = 3) samples with 2-fold serial dilutions. The concentration for each dilution was corrected by the dilution factor and dilution linearity was confirmed if multiple dilutions demonstrated a ≤20.0% change in concentration. Assay specificity was tested by pre-incubating three CSF and three plasma samples with or without assay-specific capture antibody for 1 h shaking at room temperature. The samples were then processed as normal test samples in the same run to assess reduction in signal (80–100%) due to the prevention of immuno-sandwich formation. Spike recovery was assessed by spiking calibrator material into CSF and plasma samples from three normal subjects and into the sample diluent. Spiked samples were then tested as normal, with the acceptance criteria for spike recovery of 70–130%. To test potential cross-reactivity of the assays, similar proteins were tested at varying concentrations to determine levels of cross-reactivity. Also, the addition of complement stabilizers (EDTA, FUT, PIC) were tested to ensure no interference on recovery of complement proteins by comparing to unsupplemented samples with acceptable recovery of±30%. Since C4a is a commercial assay, specificity and spike recovery was not performed due to not having access to the reagents required to perform either.
Heat-aggregated gamma globulin (HAGG) stimulation
To demonstrate the assays could capture the activation and inhibition of the complement classical pathway, serum was pre-incubated with FUT (100μg/mL) (BD Pharmingen) for 1 h at 37°C. Classical pathway activator HAGG from Quidel (0.5 mg/ml) was then added and incubated for an additional 30 minutes at 37°C before stopping the reaction by adding 20 mM EDTA to the samples. Samples were stored frozen at –80°C until analysis.
Statistical analysis
Results were based on signal recovery rates versus the reference sample. The % recovery from No Addition was calculated by dividing the analyte concentration in the supplemented condition by the analyte concentration in the unsupplemented condition and multiplying by 100. The % recovery from FT1 was calculated by dividing the analyte concentration at FT2, FT3 or FT4 by the analyte concentration at FT1 and multiplying by 100. The sample size was not statistically determined; it was driven by sample availability. Due to the discovery nature of the project, we did not do formal statistical hypothesis testing (including p-values). Despite the small sample size, the effects were consistent across donors, which increases the confidence in the robustness of the observed effects. Plasma and CSF complement biomarkers included in the present analysis were measured in duplicate or at four serial dilutions in singlicate and mean values were calculated. For all parameters tested, recovery signals for C4a, C4, C3a, C3, Bb and FB compared with the reference sample were reported. During the assay qualification, a 20% inter-assay variability was set as the threshold (Table 1). Any variation exceeding this range could be attributed to preanalytical handling. Box plots of the analyte levels were generated using RStudio version 1.4.1717.
RESULTS
Study design and complement assays
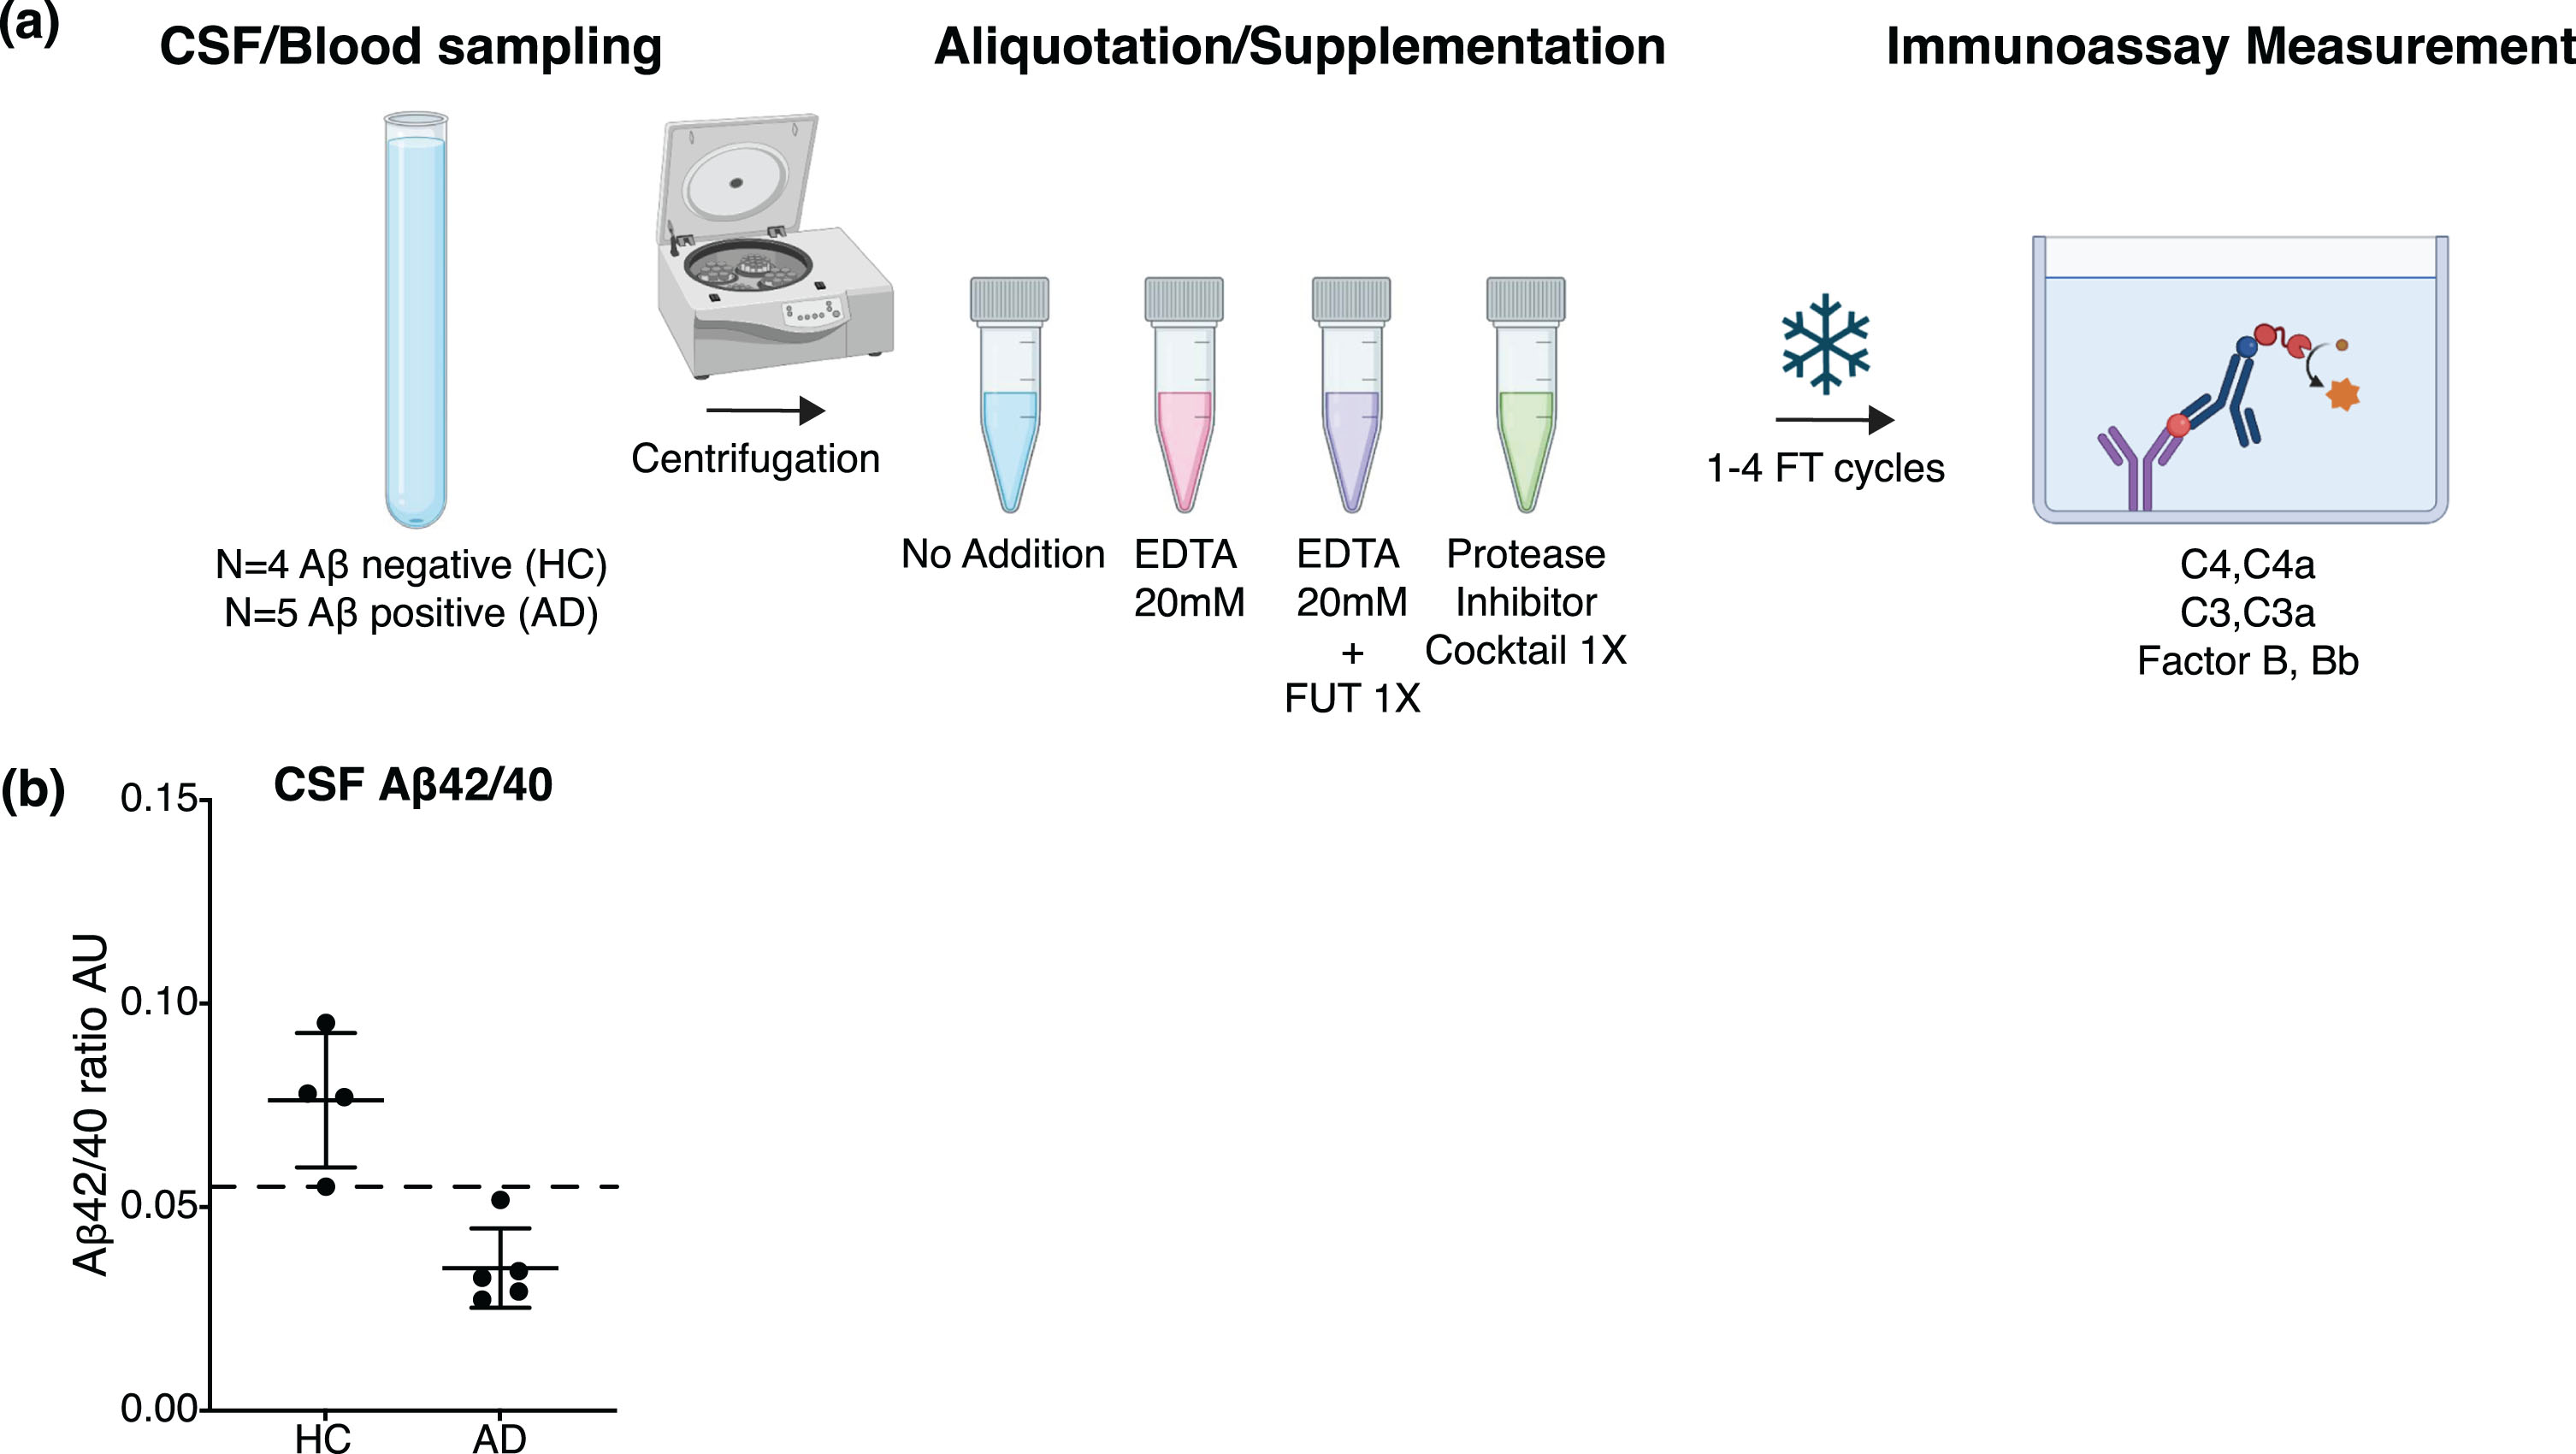
Plasma and CSF samples were collected from four HC and five AD subjects. The samples were centrifuged and aliquoted in the absence or presence of EDTA, EDTA + FUT or PIC at the clinical site and submitted to 1–4 FT cycles (Fig. 1a). Amyloid positivity in the AD subjects was confirmed by CSF Aβ42/40 ratios below the diagnostic cutoff (Fig. 1b, see Methods). CSF and plasma complement proteins C4, C4a, C3, C3a, FB, and Bb were measured using in-house developed ELISAs, commercially available ELISA kits or the Simoa platform (41, Supplementary Figure 1a). All six assays met the qualification acceptance criteria for sensitivity/specificity, dilution linearity, spike recovery with stabilizing agents (to assure no interference on assays) and sensitivity to the in vitro complement activation and inhibition (Supplementary Figures 1b, 2, 3, 4,41).
Fig. 1
(a) Schematic of the study design to assess complement stability in plasma or CSF from HC and AD subjects. CSF and blood were collected from 9 donors, the biofluids were centrifuged and aliquoted at the clinical site without (No Addition) or with supplementation of the complement-stabilizing agents EDTA, EDTA + FUT and PIC. The CSF and plasma aliquots underwent 1-4 FT cycles. C4a, C3a, Bb, C4, C3, and FB concentrations were assessed by immunoassay. Created with BioRender.com. (b) AD diagnostic biomarkers Aβ42 and Aβ40 were measured by immunoassay in non-supplemented CSF samples from each donor. Aβ42:Aβ40 ratio (AU) in HC (amyloid negative, N = 4) and AD (amyloid positive, N = 5) subjects; horizontal and vertical lines represent the mean and SD respectively. The dashed line represents the diagnostic cutoff value of 0.055.
Impact of EDTA, EDTA + FUT, or PIC on plasma and CSF complement stability
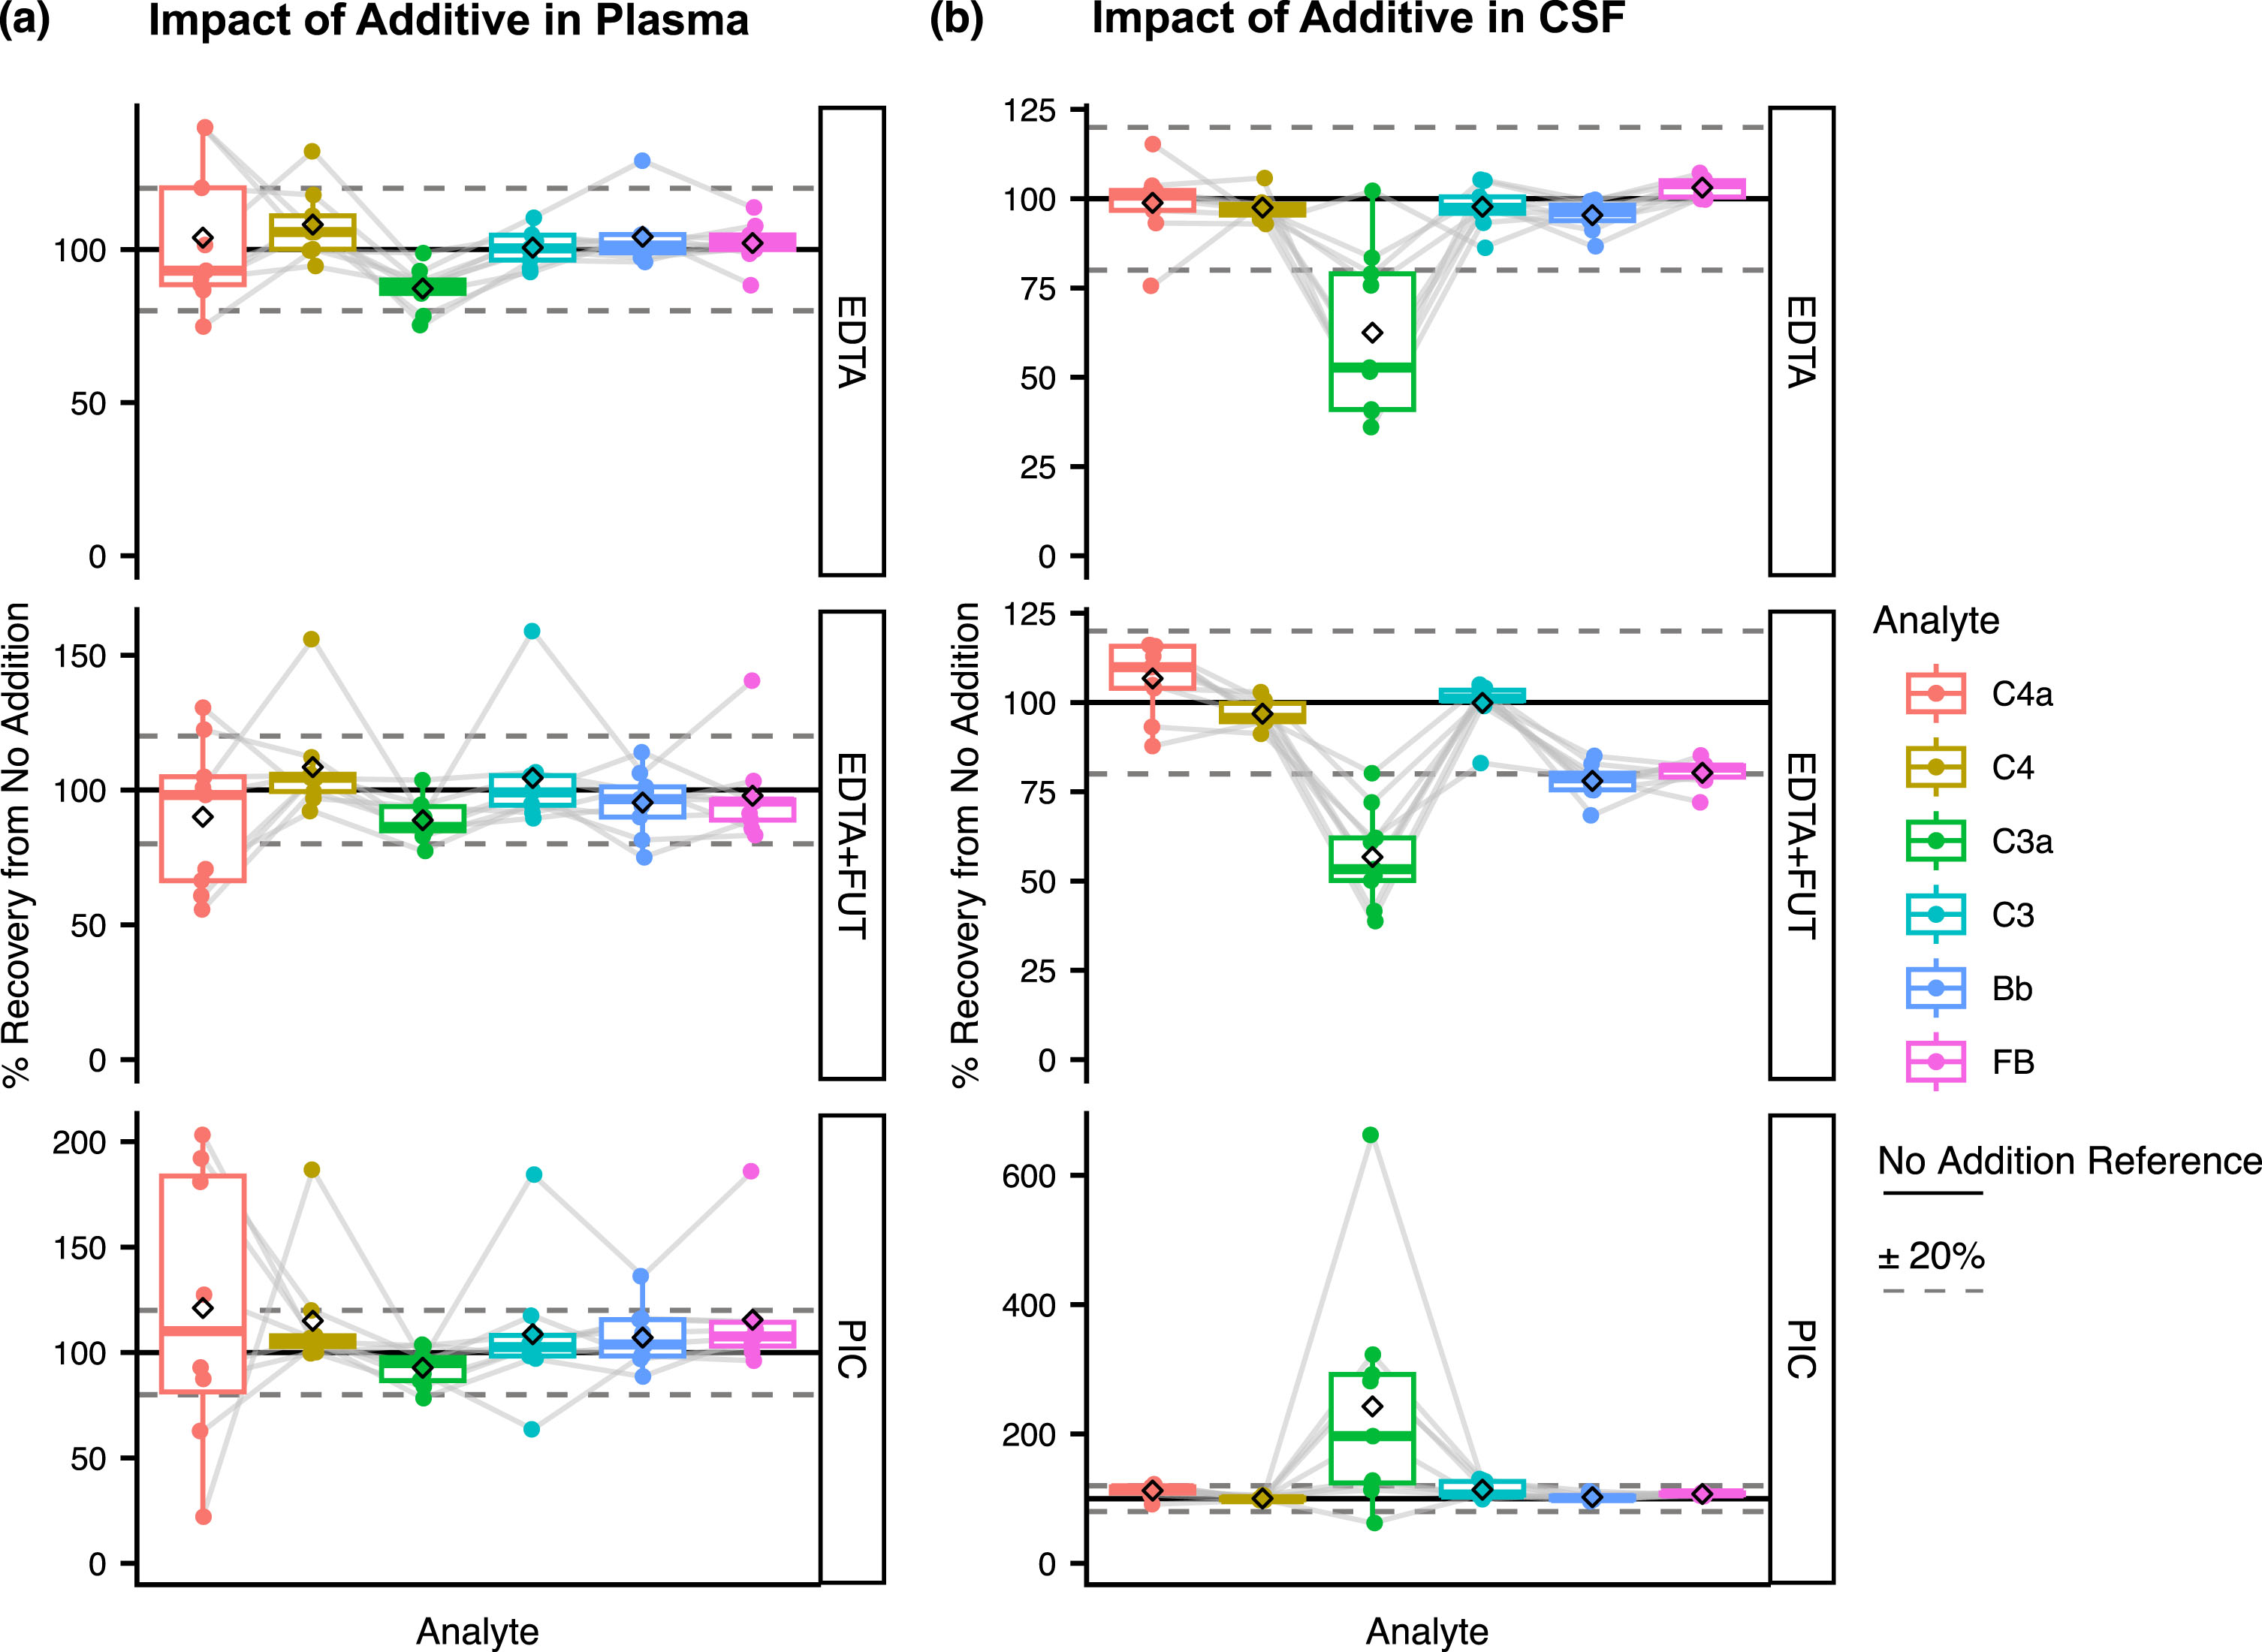
We first assessed the impact of plasma and CSF supplementation with EDTA, EDTA + FUT or PIC at the clinical site on complement stability at FT1. For C4a, C4, C3, Bb, and FB the mean plasma recovery signals from the unsupplemented condition (see Methods) were close to 100% with EDTA, EDTA + FUT, and PIC (Fig. 2a; Supplementary Figure 5, Supplementary Table 1). A higher variability was observed for C4a compared to the other analytes (22%–203% recovery range, Supplementary Table 1). Plasma C3a displayed slightly lower recovery signals with EDTA and EDTA + FUT supplementation, though still within±20% (Fig. 2a; Supplementary Figure 5, Supplementary Table 1). CSF recovery signals from the unsupplemented condition for C4a, C4, and C3 were within±20% of the reference condition with all three additives (Fig. 2b; Supplementary Figure 6, Supplementary Table 2). By contrast, C3a displayed greater variability (36%–102% recovery, Supplementary Table 2) and around 40% lower recovery in CSF aliquots supplemented with EDTA (62 (mean)±8 (SE)) or EDTA + FUT (57±5) (Fig. 2b; Supplementary Figure 6, Supplementary Table 2). Notably, PIC supplementation was associated with greater CSF C3a (243±61) recovery when compared to the EDTA and EDTA + FUT conditions (Fig. 2b; Supplementary Figure 6, Supplementary Table 2). Furthermore, CSF Bb and FB recovery signals from the unsupplemented condition were reduced by 20% with EDTA + FUT (Bb: 78±2, FB: 80±1) but not EDTA or PIC (Fig. 2b; Supplementary Figure 6). If EDTA + FUT were to enhance the stability of CSF FB, lower Bb and higher FB recovery signals would be expected. Thus, the observed effect of EDTA + FUT supplementation on CSF FB and Bb levels likely results from technical variability with the assay rather than a blockage of in vitro complement activation. Together these results show that the CSF or plasma supplementation with EDTA, EDTA + FUT or PIC does not impact the stability of most of the analytes. CSF C3a represents an exception and could benefit from increased stability upon supplementation with EDTA or EDTA + FUT.
Fig. 2
(a–b) Impact of the different additives on complement levels in plasma (a) and CSF (b). Shown are the % recovery from the unsupplemented condition (No Addition) in the supplemented conditions (EDTA, EDTA + FUT, and PIC) for C4a, C3a, Bb, C4, C3, and FB at FT1. The dashed line represents the ‘No Addition’ reference (100%). Box plots shown comprise data from N = 9 individual donors. Boxes represent the median and interquartile range (IQR); The lower and upper hinges correspond to the first and third quartiles (the 25th and 75th percentiles). The upper whisker extends from the hinge to the largest value no further than 1.5 * IQR from the hinge. The lower whisker extends from the hinge to the smallest value at most 1.5 * IQR of the hinge. The diamond shape represents the mean. Individual data points are plotted over the box plots.
Impact of FT cycles on complement stability in plasma and CSF supplemented with or without EDTA, EDTA + FUT, or PIC
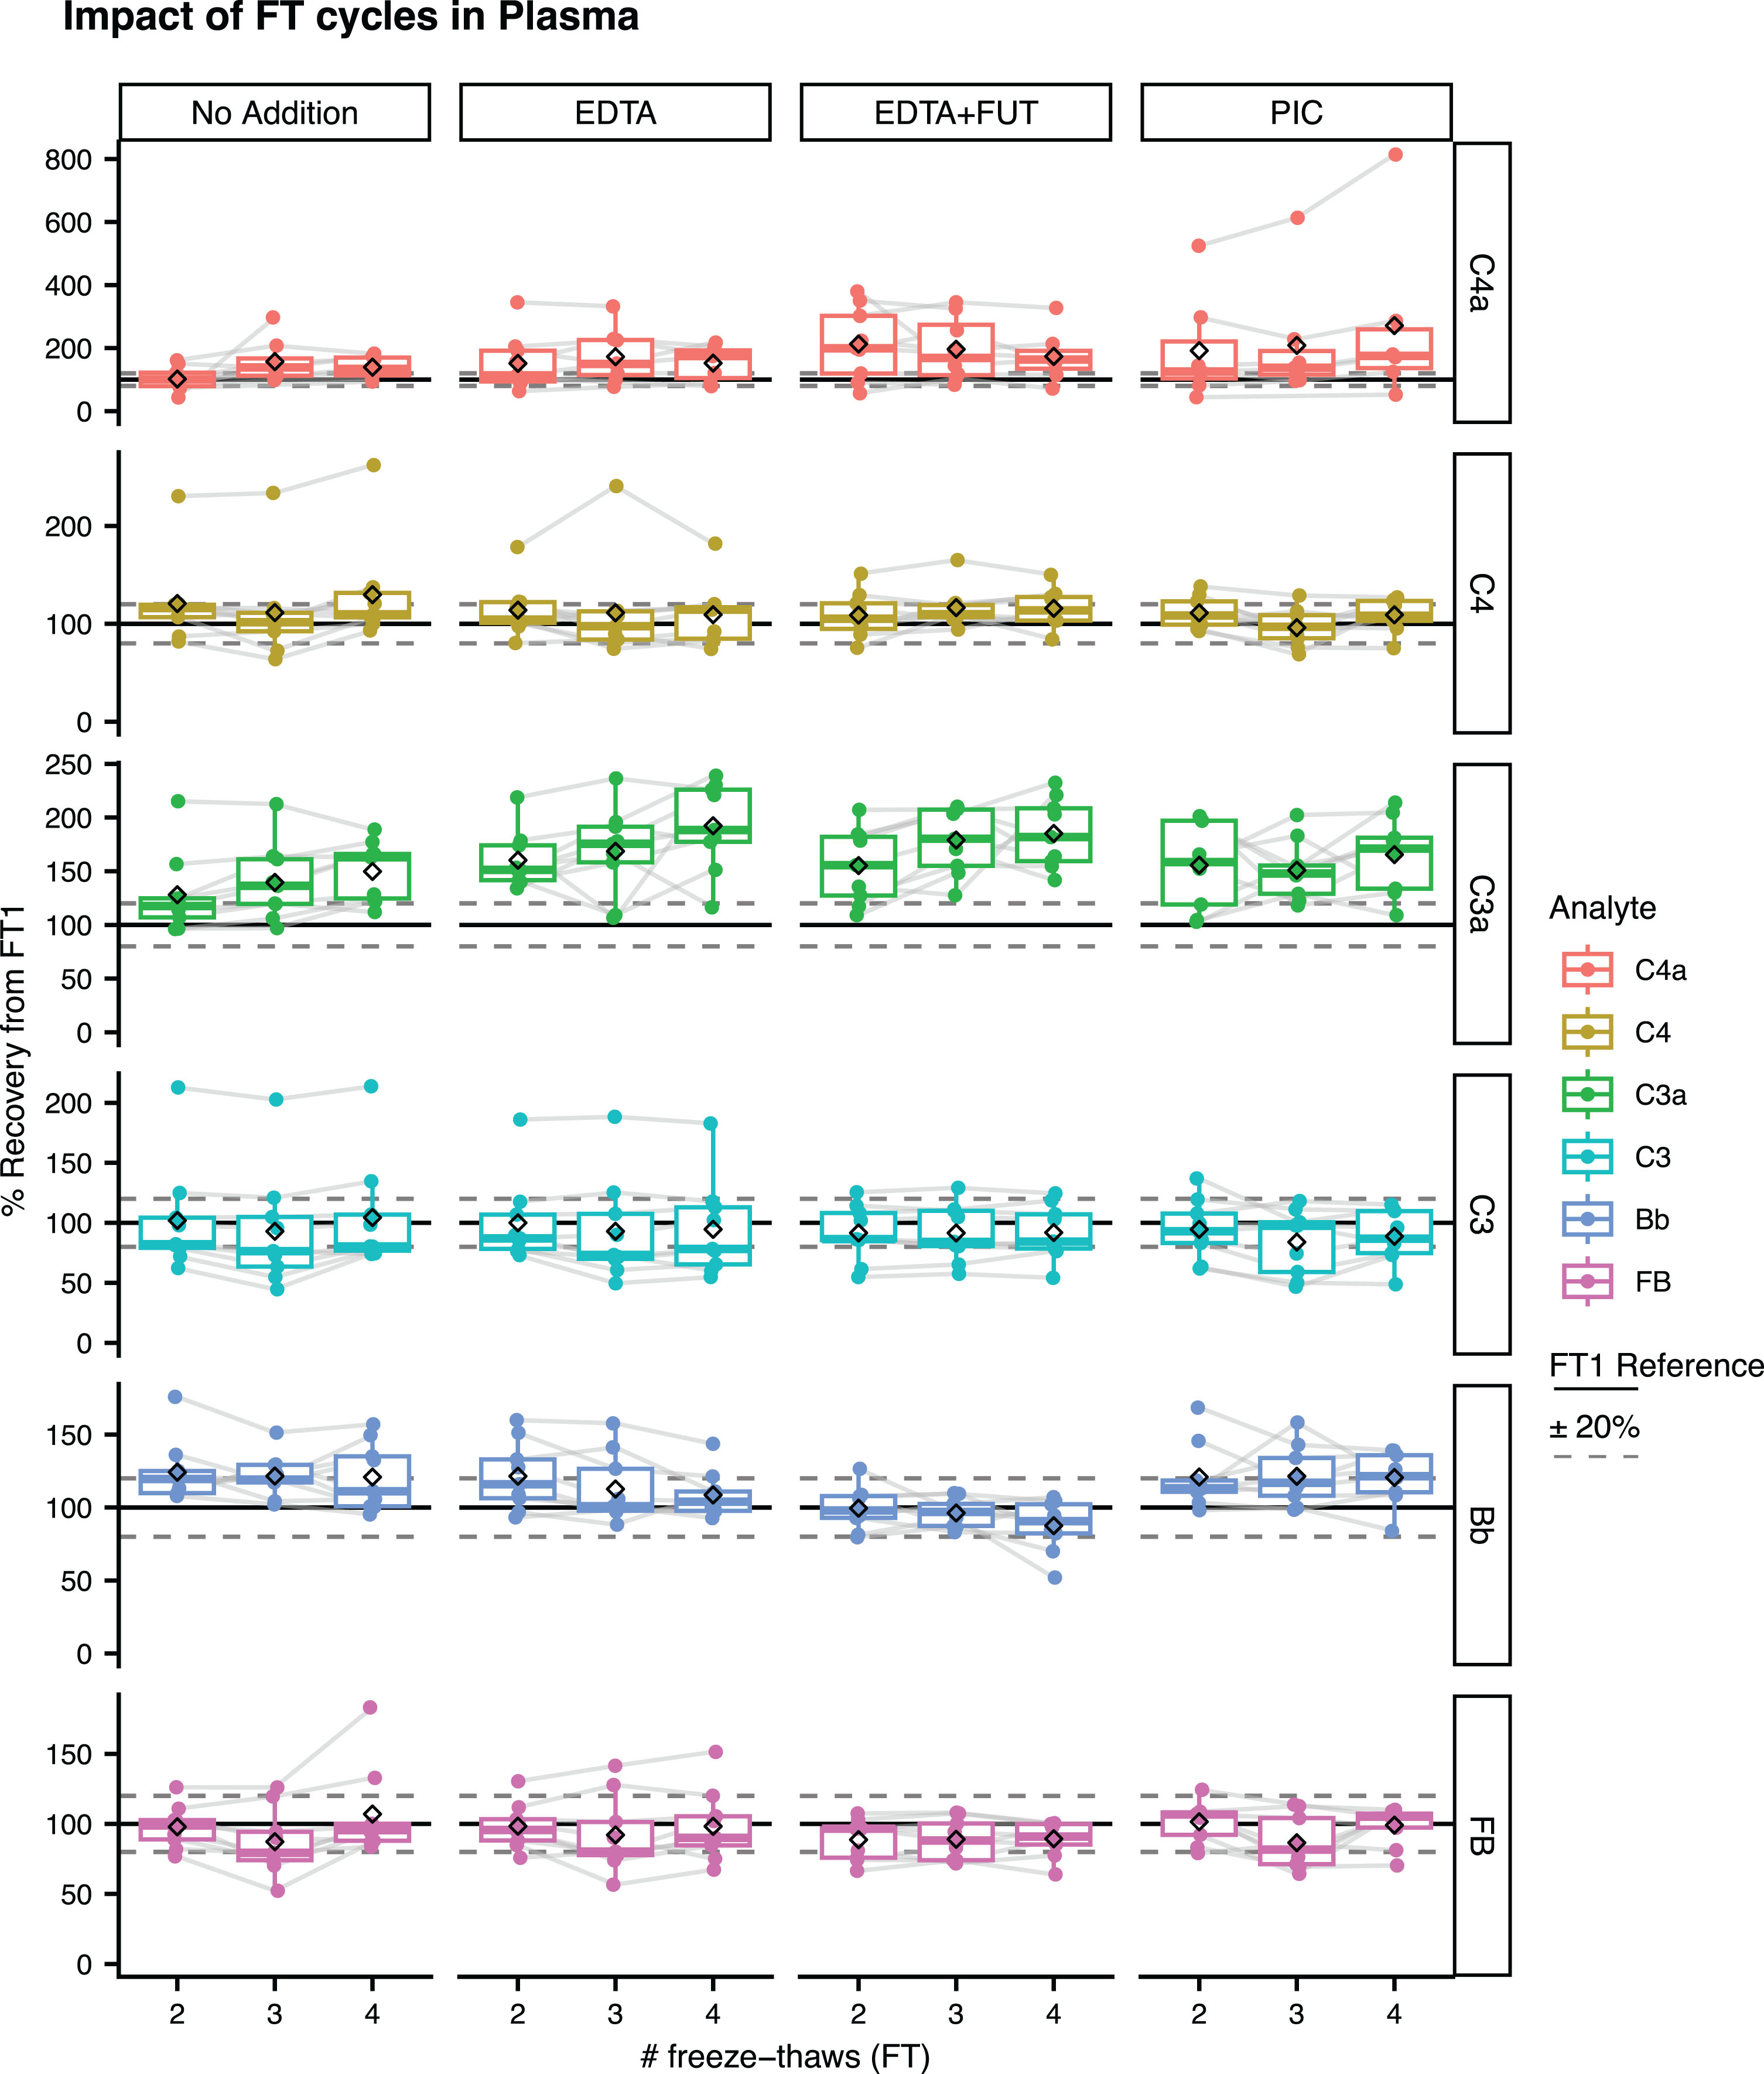
Plasma and CSF samples with or without additive supplementation underwent up to 4 FT cycles (FT1–FT4). The recovery signals from FT1 were evaluated for each complement protein at FT2, FT3, or FT4 (see Methods). In plasma, C3 and FB displayed mean recovery signals from FT1 within the acceptable±20% in presence and absence of additives (Fig. 3, Supplementary Table 3). Slightly greater mean recovery signals from FT1 close to 20% were observed for Bb and C4 in the unsupplemented condition (Fig. 3, Supplementary Table 3). The Bb recovery signal was lower with EDTA + FUT compared to the unsupplemented condition. Plasma C4a and C3a were the most impacted by FT cycles, with mean recovery signals ranging from 102–157% and 128–150% in the unsupplemented condition, respectively (Fig. 3; Supplementary Table 3, Supplementary Figure 7). Surprisingly, greater plasma C3a and C4a recovery signals were observed with EDTA, EDTA + FUT and PIC compared to the unsupplemented condition (Fig. 3, Supplementary Table 3, Supplementary Figure 7).
Fig. 3
Impact of FT cycles on complement levels in plasma. Shown are the % recovery from FT1 in the FT2, FT3, and FT4 unsupplemented (No Addition) or supplemented aliquots (EDTA, EDTA + FUT, PIC) for C4a, C3a, Bb, C4, C3, and FB. The dashed line represents the ‘FT1’ reference (100%). Box plots shown comprise data from N = 9 individual donors. Boxes represent the median and interquartile range (IQR); The lower and upper hinges correspond to the first and third quartiles (the 25th and 75th percentiles). The upper whisker extends from the hinge to the largest value no further than 1.5 * IQR from the hinge. The lower whisker extends from the hinge to the smallest value at most 1.5 * IQR of the hinge. The diamond shape represents the mean. Individual data points are plotted over the box plots.
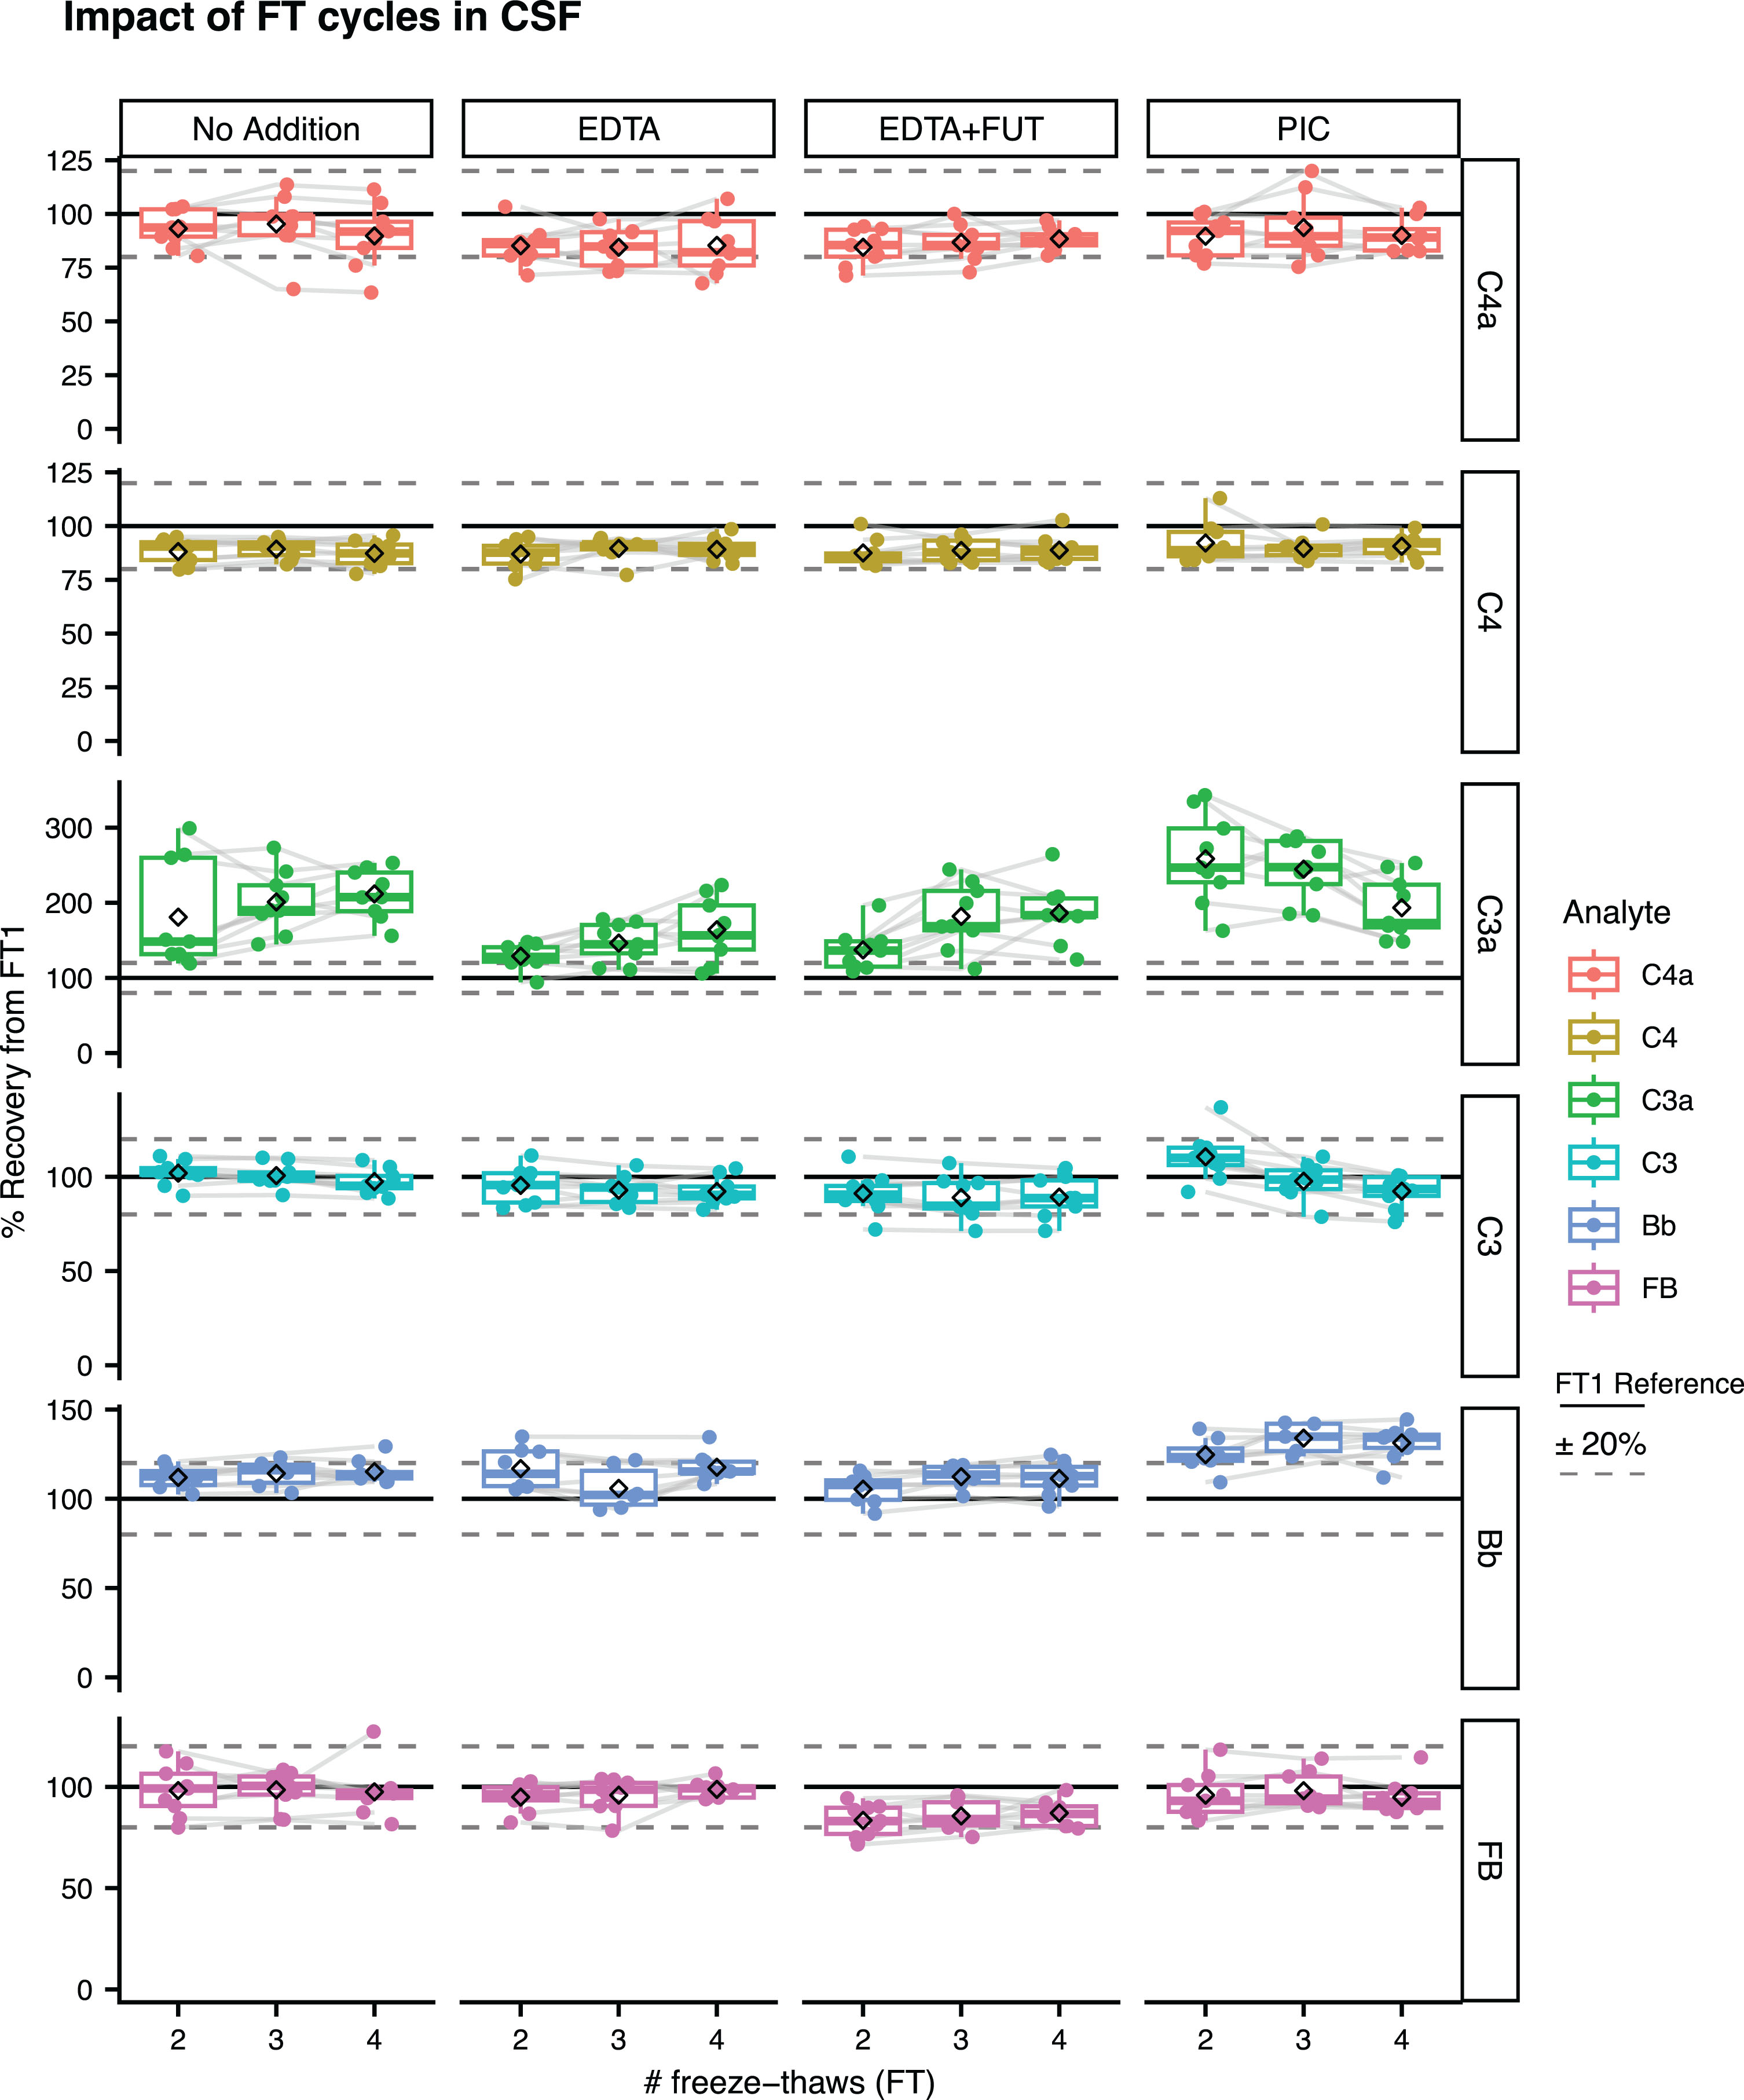
In CSF, the mean recovery signals from FT1 for C4a, C4, C3, and FB were within ±20%, irrespective of the presence of additives in the samples (Fig. 4; Supplementary Figure 8 for absolute concentrations, Supplementary Table 3). For CSF Bb, mean recovery rates within ±20% were observed with No Addition, EDTA and EDTA + FUT, while the mean recovery signals with PIC ranged between 125–134% (Fig. 4; Supplementary Figure 8 for absolute concentrations, Supplementary Table 3). C3a appeared to be the most affected by FT cycles in unsupplemented CSF, as reflected by the increased percent recovery from FT1 (181–212%). CSF C3a recovery signals were slightly lower with EDTA (129–164%) or EDTA + FUT (137–186%) supplementation, although still not within the acceptable±20% (Fig. 4; Supplementary Table 4, Supplementary Figure 8). Supplementation with PIC was associated with greater mean CSF C3a recovery signals when compared to No Addition, EDTA and EDTA + FUT (Fig. 4; Supplementary Table 4, Supplementary Figure 8).
Fig. 4
Impact of FT cycles on complement levels in CSF. Shown are the % recovery from FT1 in the FT2, FT3 and FT4 unsupplemented (No Addition) or supplemented aliquots (EDTA, EDTA + FUT, PIC) for C4a, C3a, Bb, C4, C3, and FB. The dashed line represents the ‘FT1’ reference (100%). Box plots shown comprise data from N = 9 individual donors. Boxes represent the median and interquartile range (IQR); The lower and upper hinges correspond to the first and third quartiles (the 25th and 75th percentiles). The upper whisker extends from the hinge to the largest value no further than 1.5 * IQR from the hinge. The lower whisker extends from the hinge to the smallest value at most 1.5 * IQR of the hinge. The diamond shape represents the mean. Individual data points are plotted over the box plots.
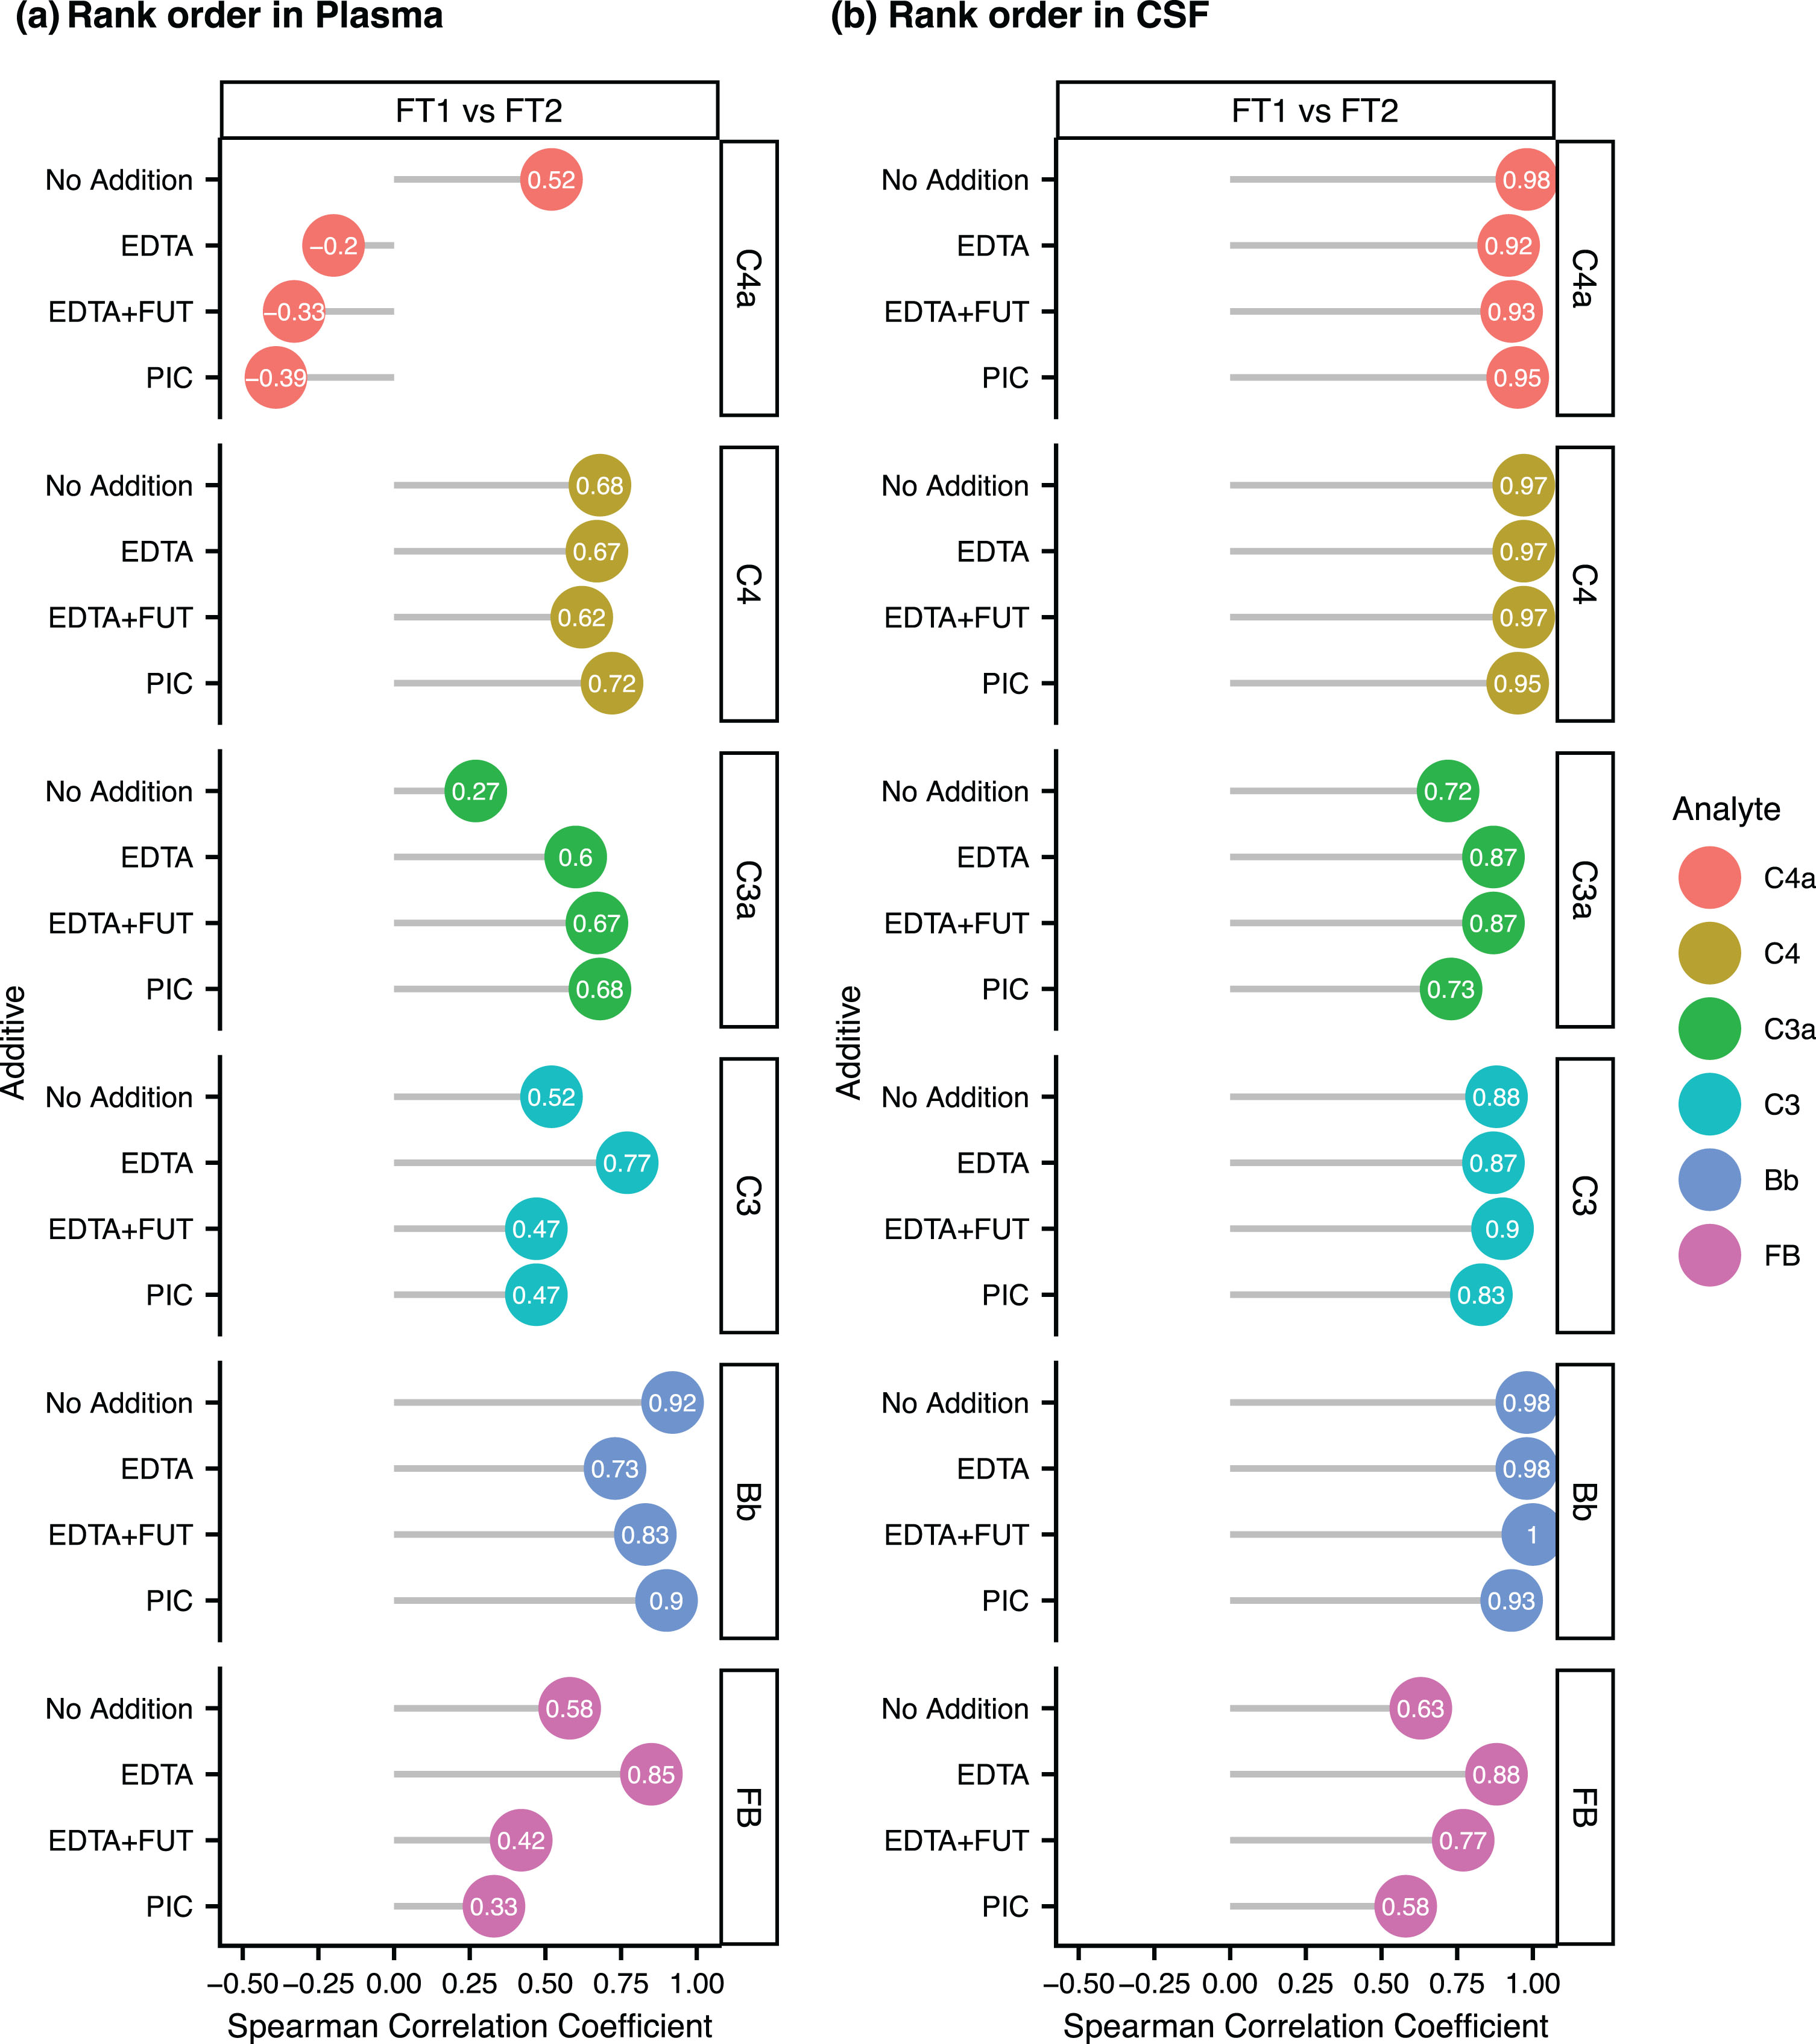
We next investigated the impact of FTs on the rank order of complement protein concentrations in unsupplemented and supplemented CSF/plasma aliquots. For each complement protein, we computed the Spearman correlation coefficient of the FT1 versus FT2 levels in the different additive conditions. For all analytes, the Spearman correlation coefficients were greater in CSF than plasma, suggesting a better rank order preservation in CSF (Fig. 5a,b, Supplementary Figures 9 and 10 for FT1 versus FT3-4 correlations). In plasma, the rank order of C4a, C3a, C3, and FB appeared to be the least preserved, as shown by the FT1 versus FT2 correlation coefficients below 0.6 in the unsupplemented condition (Fig. 5a). No consistent improvement in the rank order preservation of all tested analytes was seen in EDTA, EDTA + FUT or PIC supplemented plasma or CSF (Fig. 5a,b, Supplementary Figures 9 and 10). Taken together, most complement proteins are mildly impacted by FT cycles in plasma but not CSF, except for C3a which displayed greater sensitivity to FTs in CSF than in plasma and may slightly benefit from a CSF supplementation with EDTA or EDTA + FUT.
Fig. 5
(a–b) Rank order preservation of complement levels between the first (FT1) and second (FT2) freeze-thaw cycle in plasma (a) and CSF (b). Lollipop plot showing the Spearman Correlation Coefficient between the concentrations at FT1 and the concentrations at FT2 in unsupplemented (No Addition) or supplemented aliquots (EDTA, EDTA + FUT, PIC) for C4a, C3a, Bb, C4, C3, and FB.
DISCUSSION
The present study investigated the impact of the complement-stabilizing additives EDTA, EDTA + FUT, or PIC on the stability of the complement proteins C4, FB, C3, and their activation products C4a, Bb, and C3a in blood and CSF from HC and AD subjects. In addition, the influence of up to 4 FT cycles on the stability of CSF and blood complement analytes was evaluated with and without additive supplementation. In both CSF and plasma, most complement analytes were not impacted by the different additives. Most complement protein (Bb, C4, C3a, and C4a) absolute concentrations were mildly impacted by FT cycles in plasma but not CSF. The preservation of the relative concentration rank order was acceptable for a subset of plasma analytes and all CSF analytes. Except for C3a, plasma complement proteins were more susceptible to FT cycles than CSF analytes. The addition of complement-stabilizing agents did not prevent the impact of FT cycles on CSF and plasma concentrations for most analytes. C3a displayed mildly increased stability in the presence of EDTA or EDTA + FUT.
The supplementation of CSF and plasma samples with additives did not impact C4 and FB cleavage, while the addition of EDTA or EDTA + FUT mildly benefited C3a stability, especially in CSF. C3 may be more susceptible to in vitro activation because of its downstream position in the complement cascade and its cleavage in response to classical, lectin and alternative pathway activation. C4 and FB are located upstream in the classical/lectin and alternative pathways, respectively, which could make them less sensitive to intrinsic protease activity. We also observed greater impact of EDTA and EDTA + FUT on C3a levels in CSF than plasma. This could be due to the absence of EDTA in the non-supplemented CSF versus the presence of 6 mM EDTA in the non-supplemented plasma. Unlike a previous study which showed that the stabilizing effect of EDTA + FUT was greater for C4a compared to C3a in plasma,34 our study only revealed minor effects of this additive on plasma C3a but not C4a.
Although EDTA or EDTA + FUT slightly decreased the impact of FT cycles on CSF C3a, the additives did not completely prevent the increases in C3a levels beyond the prespecified±20% threshold. While C3a levels increased with repeated FTs, C3 levels remained relatively stable. This contrasts with the expected decrease in C3 observed in response to in vitro complement activity. Because CSF and plasma C3 concentrations are roughly 1000-fold higher than C3a concentrations (Supplementary Figures 5 and 6), the C3a assay may be more sensitive to small changes in the analyte concentration. In line with this hypothesis, we observed greater serum C3a than C3 fold-changes in response to ex vivo complement activation with HAGG (Supplementary Figure 1b). Complement proteins C4a, C4, and Bb were mildly sensitive to FTs (% recovery signals from FT1 within or around the predefined±20% threshold), irrespective of the presence of complement-stabilizing additives. This sensitivity was greater in plasma than CSF, likely due to the higher intrinsic protease activity in peripheral blood versus CSF. Our findings contrast with a previous study which showed no impact of FT cycles on plasma C3a and Bb stability.28 Discrepancies between the studies may originate from differences in the presence/absence of pathology in the donors and analytical methods. For a subset of plasma analytes and all CSF analytes the correlation between FT1 and FT2 concentrations was greater than 0.5, suggesting an acceptable rank order preservation across FTs. This means that the number of FT cycles for CSF and plasma should be kept to a minimum and consistent between conditions.
There are limitations to this study: First, all our comparisons were made between samples that have undergone one FT. Performing this study in fresh (never frozen) biofluids was logistically not feasible. Second, with N = 4 HC and N = 5 AD donors, the sample size is relatively small and does not allow drawing meaningful conclusions about potential differences in the impact of preanalytical handling on complement concentrations in the two groups. Nonetheless, we observed consistent trends across all donors suggesting that there are no major discrepancies in the impact of the tested additives and FTs on CSF/plasma complement stability in AD versus HC subjects. Third, we acknowledge that there might be additional preanalytics for CSF and blood complement measurements that were not investigated here, including timing to centrifugation, incubation at RT and storage time/temperature.32,42 Fourth, we did not assess differences in the standardization of the assays used in this study and assays applied by other labs. Although discrepancies in standardization can contribute to inconsistencies in complement concentrations across studies,33 potential discrepancies in assay standardization do not impact this study’s conclusions which are based on relative measurements in the presence versus absence of additives or FT cycles. The main strengths of this study are that the samples were collected 1) from a mix of HC/AD donors and 2) according to a standardized procedure that is employed for AD biomarkers in Roche clinical trials and many academic centers.40,43
Our findings have implications on sample handling for the evaluation of C4a, C4, C3a, C3, Bb, and FB as diagnostic, prognostic or pharmacodynamic biomarkers in AD: A supplementation with EDTA (±FUT) may be considered to increase the stability of CSF C3a. To ensure accurate absolute C4, FB, C3, C4a, Bb, and C3a quantification, we recommend keeping the number of CSF/plasma FT cycles to a minimum, though future studies will be needed to compare complement concentration in never frozen and once frozen CSF/plasma. For relative comparisons between donors/conditions, matching FT cycles may be acceptable as shown by the preservation of the relative rank order of tested complement protein concentrations in this study.
In conclusion, plasma and CSF sample handling recommendations presented here may improve the reproducibility of future studies investigating complement activity in biofluids from patients with neurodegenerative disorders and may support the application of the assays developed herein into clinical practice (e.g., for the pharmacodynamic evaluation of complement therapeutics).
AUTHOR CONTRIBUTIONS
Johnny Gutierrez (Formal analysis; Methodology; Supervision; Writing – original draft; Writing – review & editing); Carolin Kurz (Conceptualization; Methodology; Writing – review & editing); Cosme Sandoval (Formal analysis; Methodology; Writing – review & editing); Rose Edmonds (Methodology; Writing – review & editing); Tobias Bittner (Conceptualization; Writing – review & editing); Robert Perneczky (Conceptualization; Methodology; Supervision; Writing – review & editing); Anne Biever (Conceptualization; Formal analysis; Supervision; Writing – original draft; Writing – review & editing).
ACKNOWLEDGMENTS
We thank Balasz Toth for his input on the data analysis. We thank Lee Honigberg for his input on the study design. We thank Michael Chang for assistance with the complement biomarker measurements. We thank all patients who donated their blood and CSF for their contribution to this research.
FUNDING
The work has been funded by Genentech Inc.
CONFLICT OF INTEREST
JG, CS, RE, TB, and AB are full-time employees of Genentech Inc. (member of the Roche group). RP has received consultancy fees. CK and RP received speaker honoraria from Roche.
DATA AVAILABILITY
The data supporting the findings of this study are available on request from the corresponding author.
SUPPLEMENTARY MATERIAL
[1] The supplementary material is available in the electronic version of this article: https://dx.doi.org/10.3233/JAD-240287.
REFERENCES
1. | DeTure MA and Dickson DW. The neuropathological diagnosis of Alzheimer’s disease. Mol Neurodegener (2019) ; 14: : 32. |
2. | Haage V and Jager PLD. Neuroimmune contributions to Alzheimer’s disease: A focus on human data. Mol Psychiatry (2022) ; 27: : 3164–3181. |
3. | Brosseron F , Traschütz A , Widmann CN , et al. Characterization and clinical use of inflammatory cerebrospinal fluid protein markers in Alzheimer’s disease. Alzheimers Res Ther (2018) ; 10: : 25. |
4. | Brosseron F , Kolbe C-C , Santarelli F , et al. Multicenter Alzheimer’s and Parkinson’s disease immune biomarker verification study. Alzheimers Dementia (2020) ; 16: : 292–304. |
5. | Brosseron F , Maass A , Kleineidam L , et al. Soluble TAM receptors sAXL and sTyro3 predict structural and functional protection in Alzheimer’s disease. Neuron (2022) ; 110: : 1009–1022.e4. |
6. | Rauchmann B-S , Sadlon A , Perneczky R , et al. Soluble TREM2 and inflammatory proteins in Alzheimer’s disease cerebrospinal fluid. J Alzheimers Dis (2020) ; 73: : 1615–1626. |
7. | Shen X-N , Niu L-D , Wang Y-J , et al. Inflammatory markers in Alzheimer’s disease and mild cognitive impairment: A meta-analysis and systematic review of 170 studies. J Neurol Neurosurg Psychiatry (2019) ; 90: : 590. |
8. | Hopperton KE , Mohammad D , Trépanier MO , et al. Markers of microglia in post-mortem brain samples from patients with Alzheimer’s disease: A systematic review. Mol Psychiatry (2018) ; 23: : 177–198. |
9. | Leng F and Edison P. Neuroinflammation and microglial activation in Alzheimer disease: Where do we go from here? Nat Rev Neurol (2021) ; 17: : 157–172. |
10. | Paolicelli RC , Sierra A , Stevens B , et al. Microglia states and nomenclature: A field at its crossroads. Neuron (2022) ; 110: : 3458–3483. |
11. | Dejanovic B , Sheng M , Hanson JE . Targeting synapse function and loss for treatment of neurodegenerative diseases. Nat Rev Drug Discov (2024) ; 23: : 23–42. |
12. | Mastellos DC , Ricklin D and Lambris JD. Clinical promise of next-generation complement therapeutics. Nat Rev Drug Discov (2019) ; 18: : 707–729. |
13. | Morgan BP and Harris CL. Complement, a target for therapy in inflammatory and degenerative diseases. Nat Rev Drug Discov (2015) ; 14: : 857–877. |
14. | Dalakas MC , Alexopoulos H and Spaeth PJ. Complement in neurological disorders and emerging complement-targeted therapeutics. Nat Rev Neurol (2020) ; 16: : 601–617. |
15. | Veerhuis R . Histological and direct evidence for the role of complement in the neuroinflammation of AD. Curr Alzheimer Res (2011) ; 8: : 34–58. |
16. | Bai B , Wang X , Li Y , et al. Deep multilayer brain proteomics identifies molecular networks in Alzheimer’s disease progression. Neuron (2020) ; 105: : 975–991.e7. |
17. | Wu T , Dejanovic B , Gandham VD , et al. Complement C3 is activated in human AD brain and is required for neurodegeneration in mouse models of amyloidosis and tauopathy. Cell Rep (2019) ; 28: : 2111–2123.e6. |
18. | Hong S , Beja-Glasser VF , Nfonoyim BM , et al. Complement and microglia mediate early synapse loss in Alzheimer mouse models. Science (2016) ; 352: : aad8373. |
19. | Dejanovic B , Wu T , Tsai M-C , et al. Complement C1q-dependent excitatory and inhibitory synapse elimination by astrocytes and microglia in Alzheimer’s disease mouse models. Nat Aging (2022) ; 2: : 837–850. |
20. | Burgelman M , Dujardin P , Vandendriessche C , et al. Free complement and complement containing extracellular vesicles as potential biomarkers for neuroinflammatory and neurodegenerative disorders. Front Immunol (2023) ; 13: : 1055050. |
21. | Krance SH , Wu C-Y , Zou Y , et al. The complement cascade in Alzheimer’s disease: A systematic review and meta-analysis. Mol Psychiatr (2021) ; 26: : 5532–5541. |
22. | Hu WT , Chen-Plotkin A , Arnold SE , et al. Novel CSF biomarkers for Alzheimer’s disease and mild cognitive impairment. Acta Neuropathol (2010) ; 119: : 669–678. |
23. | Hu WT , Watts KD , Tailor P , et al. CSF complement 3 and factor H are staging biomarkers in Alzheimer’s disease. Acta Neuropathol Commun (2016) ; 4: : 14. |
24. | Simonsen AH , McGuire J , Hansson O , et al. Novel panel of cerebrospinal fluid biomarkers for the prediction of progression to Alzheimer dementia in patients with mild cognitive impairment. Arch Neurol Nat Commun (2020) ; 11: : 6252. |
25. | Wang Y , Hancock AM , Bradner J , et al. Complement 3 and factor H in human cerebrospinal fluid in Parkinson’s disease, Alzheimer’s disease, and multiple-system atrophy. Am J Pathol (2011) ; 178: : 1509–1516. |
26. | Mattsson-Carlgren N , Palmqvist S , Blennow K , et al. Increasing the reproducibility of fluid biomarker studies in neurodegenerative studies. Nat Commun (2020) ; 11: : 6252. |
27. | Mollnes TE , Garred P and Bergseth G. Effect of time, temperature and anticoagulants on in vitro complement activation: Consequences for collection and preservation of samples to be examined for complement activation. Clin Exp Immunol (1988) ; 73: : 484–488. |
28. | Yang S , McGookey M , Wang Y , et al. Effect of blood sampling, processing, and storage on the measurement of complement activation biomarkers. Am J Clin Pathol (2015) ; 143: : 558–565. |
29. | Sinosich MJ , Teisner B , Brandslund I , et al. Influence of time, temperature and coagulation on the measurement of C3, C3 split products and C4. J Immunol Methods (1982) ; 55: : 107–114. |
30. | Bowen RAR , Remaley AT . Interferences from blood collection tube components on clinical chemistry assays. Biochem Med (2014) ; 24: : 31–44. |
31. | BD website, https://www.bd.com/en-us (accessed May 3, 2024). |
32. | Shimizu Y and Ichihara K. Elucidation of stability profiles of common chemistry analytes in serum stored at six graded temperatures. Clin Chem Lab Med (CCLM) (2019) ; 57: : 1388–1396. |
33. | Frazer-Abel A , Kirschfink M and Prohászka Z. Expanding horizons in complement analysis and quality control. Front Immunol (2021) ; 12: : 697313. |
34. | Pfeifer PH , Kawahara MS and Hugli TE. Possible mechanism for in vitro complement activation in blood and plasma samples: Futhan/edta controls in vitro complement activation. Clin Chem (1999) ; 45: : 1190–1199. |
35. | Bergseth G , Ludviksen JK , Kirschfink M , et al. An international serum standard for application in assays to detect human complement activation products. Mol Immunol (2013) ; 56: : 232–239. |
36. | Brandwijk RJMGE , Michels MAHM , Rossum M van , et al. Pitfalls in complement analysis: A systematic literature review of assessing complement activation. Front Immunol (2022) ; 13: : 1007102. |
37. | McKhann GM , Knopman DS , Chertkow H , et al. The diagnosis of dementia due to Alzheimer’s disease: Recommendations from the National Institute on Aging-Alzheimer’s Association workgroups on diagnostic guidelines for Alzheimer’s disease. Alzheimers Dement (2011) ; 7: : 263–269. |
38. | Albert MS , DeKosky ST , Dickson D , et al. The diagnosis of mild cognitive impairment due to Alzheimer’s disease: Recommendations from the National Institute on Aging-Alzheimer’s Association workgroups on diagnostic guidelines for Alzheimer’s disease. Alzheimers Dement (2011) ; 7: : 270–279. |
39. | Chandler MJ , Lacritz LH , Hynan LS , et al. A total score for the CERAD neuropsychological battery. Neurology (2005) ; 65: : 102–106. |
40. | Ostrowitzki S , Bittner T , Sink KM , et al. Evaluating the safety and efficacy of crenezumab vs placebo in adults with early Alzheimer disease. JAMA Neurol (2022) ; 79: : 1113–1121. |
41. | Edmonds R , Steffen V , Honigberg LA , et al. Alternative complement pathway inhibition by lampalizumab analysis of data from Chroma and Spectri Phase III clinical trials. Ophthalmol Sci (2023) ; 3: : 100286. |
42. | Morgan AR , O’Hagan C , Touchard S , et al. Effects of freezer storage time on levels of complement biomarkers. BMC Res Notes (2017) ; 10: : 559. |
43. | Kurz C , Stöckl L , Schrurs I , et al. Impact of pre-analytical sample handling factors on plasma biomarkers of Alzheimer’s disease. J Neurochem (2023) ; 165: : 95–105. |


