
Association of Loneliness with Functional Connectivity MRI, Amyloid-β PET, and Tau PET Neuroimaging Markers of Vulnerability for Alzheimer’s Disease
Abstract
Background:
Loneliness has been declared an “epidemic” associated with negative physical, mental, and cognitive health outcomes such as increased dementia risk. Less is known about the relationship between loneliness and advanced neuroimaging correlates of Alzheimer’s disease (AD).
Objective:
To assess whether loneliness was associated with advanced neuroimaging markers of AD using neuroimaging data from Framingham Heart Study (FHS) participants without dementia.
Methods:
In this cross-sectional observational analysis, we used functional connectivity MRI (fcMRI), amyloid-β (Aβ) PET, and tau PET imaging data collected between 2016 and 2019 on eligible FHS cohort participants. Loneliness was defined as feeling lonely at least one day in the past week. The primary fcMRI marker was Default Mode Network intra-network connectivity. The primary PET imaging markers were Aβ deposition in precuneal and FLR (frontal, lateral parietal and lateral temporal, retrosplenial) regions, and tau deposition in the amygdala, entorhinal, and rhinal regions.
Results:
Of 381 participants (mean age 58 [SD 10]) who met inclusion criteria for fcMRI analysis, 5% were classified as lonely (17/381). No association was observed between loneliness status and network changes. Of 424 participants (mean age 58 [SD = 10]) meeting inclusion criteria for PET analyses, 5% (21/424) were lonely; no associations were observed between loneliness and either Aβ or tau deposition in primary regions of interest.
Conclusions:
In this cross-sectional study, there were no observable associations between loneliness and select fcMRI, Aβ PET, and tau PET neuroimaging markers of AD risk. These findings merit further investigation in prospective studies of community-based cohorts.
INTRODUCTION
At least a quarter of older US adults report feeling lonely [1], and the COVID-19 pandemic has exacerbated this trend [2, 3]. Older adults are especially at risk of experiencing loneliness— a recent survey of over fifteen-thousand older adults found that almost 55% reported some degree of loneliness [4]. These findings are particularly concerning in light of a recent study suggesting an association of loneliness with a higher 10-year risk of subsequent dementia [5].
The relationship between loneliness and imaging markers of Alzheimer disease (AD) is a burgeoning area of research [6, 7]. Decreased total cerebral and hippocampal volumes [8] and increased white matter hyperintensity load [9] on MRI are changes observed even in individuals with mild cognitive impairment due to AD [10]. Lonely older adults may demonstrate a greater degree of these AD-specific changes [5]. Loneliness [11] and AD [12–14] may also have overlap in more advanced imaging modalities as well; specifically, functional connectivity MRI (fcMRI), amyloid-β (Aβ) PET [6, 15], and tau PET [16, 17] show promise. However, further work is needed to fully characterize functional connectivity and neuropathologic relationships. In this cross-sectional observational study, we analyzed data from dementia-free Framingham Heart Study (FHS) participants to assess whether loneliness was associated with advanced neuroimaging markers of AD, focusing on three separate imaging modalities: fcMRI, Aβ PET, and tau PET imaging. We propose that greater loneliness is associated with increased default mode network (DMN) activation, and that greater loneliness is associated with increased deposition of Aβ and tau proteins in chosen areas associated with AD pathology.
METHODS
Sample
This study used data from the Framingham Heart Study (FHS), one of the largest and longest-running longitudinal research cohorts in the US. The FHS is a community cohort based in Framingham, Massachusetts that was initially designed to study cardiovascular risk factors. More recently, the study has been expanded to include detailed assessments of cognitive function; this dataset includes assessments of middle- aged dementia- free individuals.
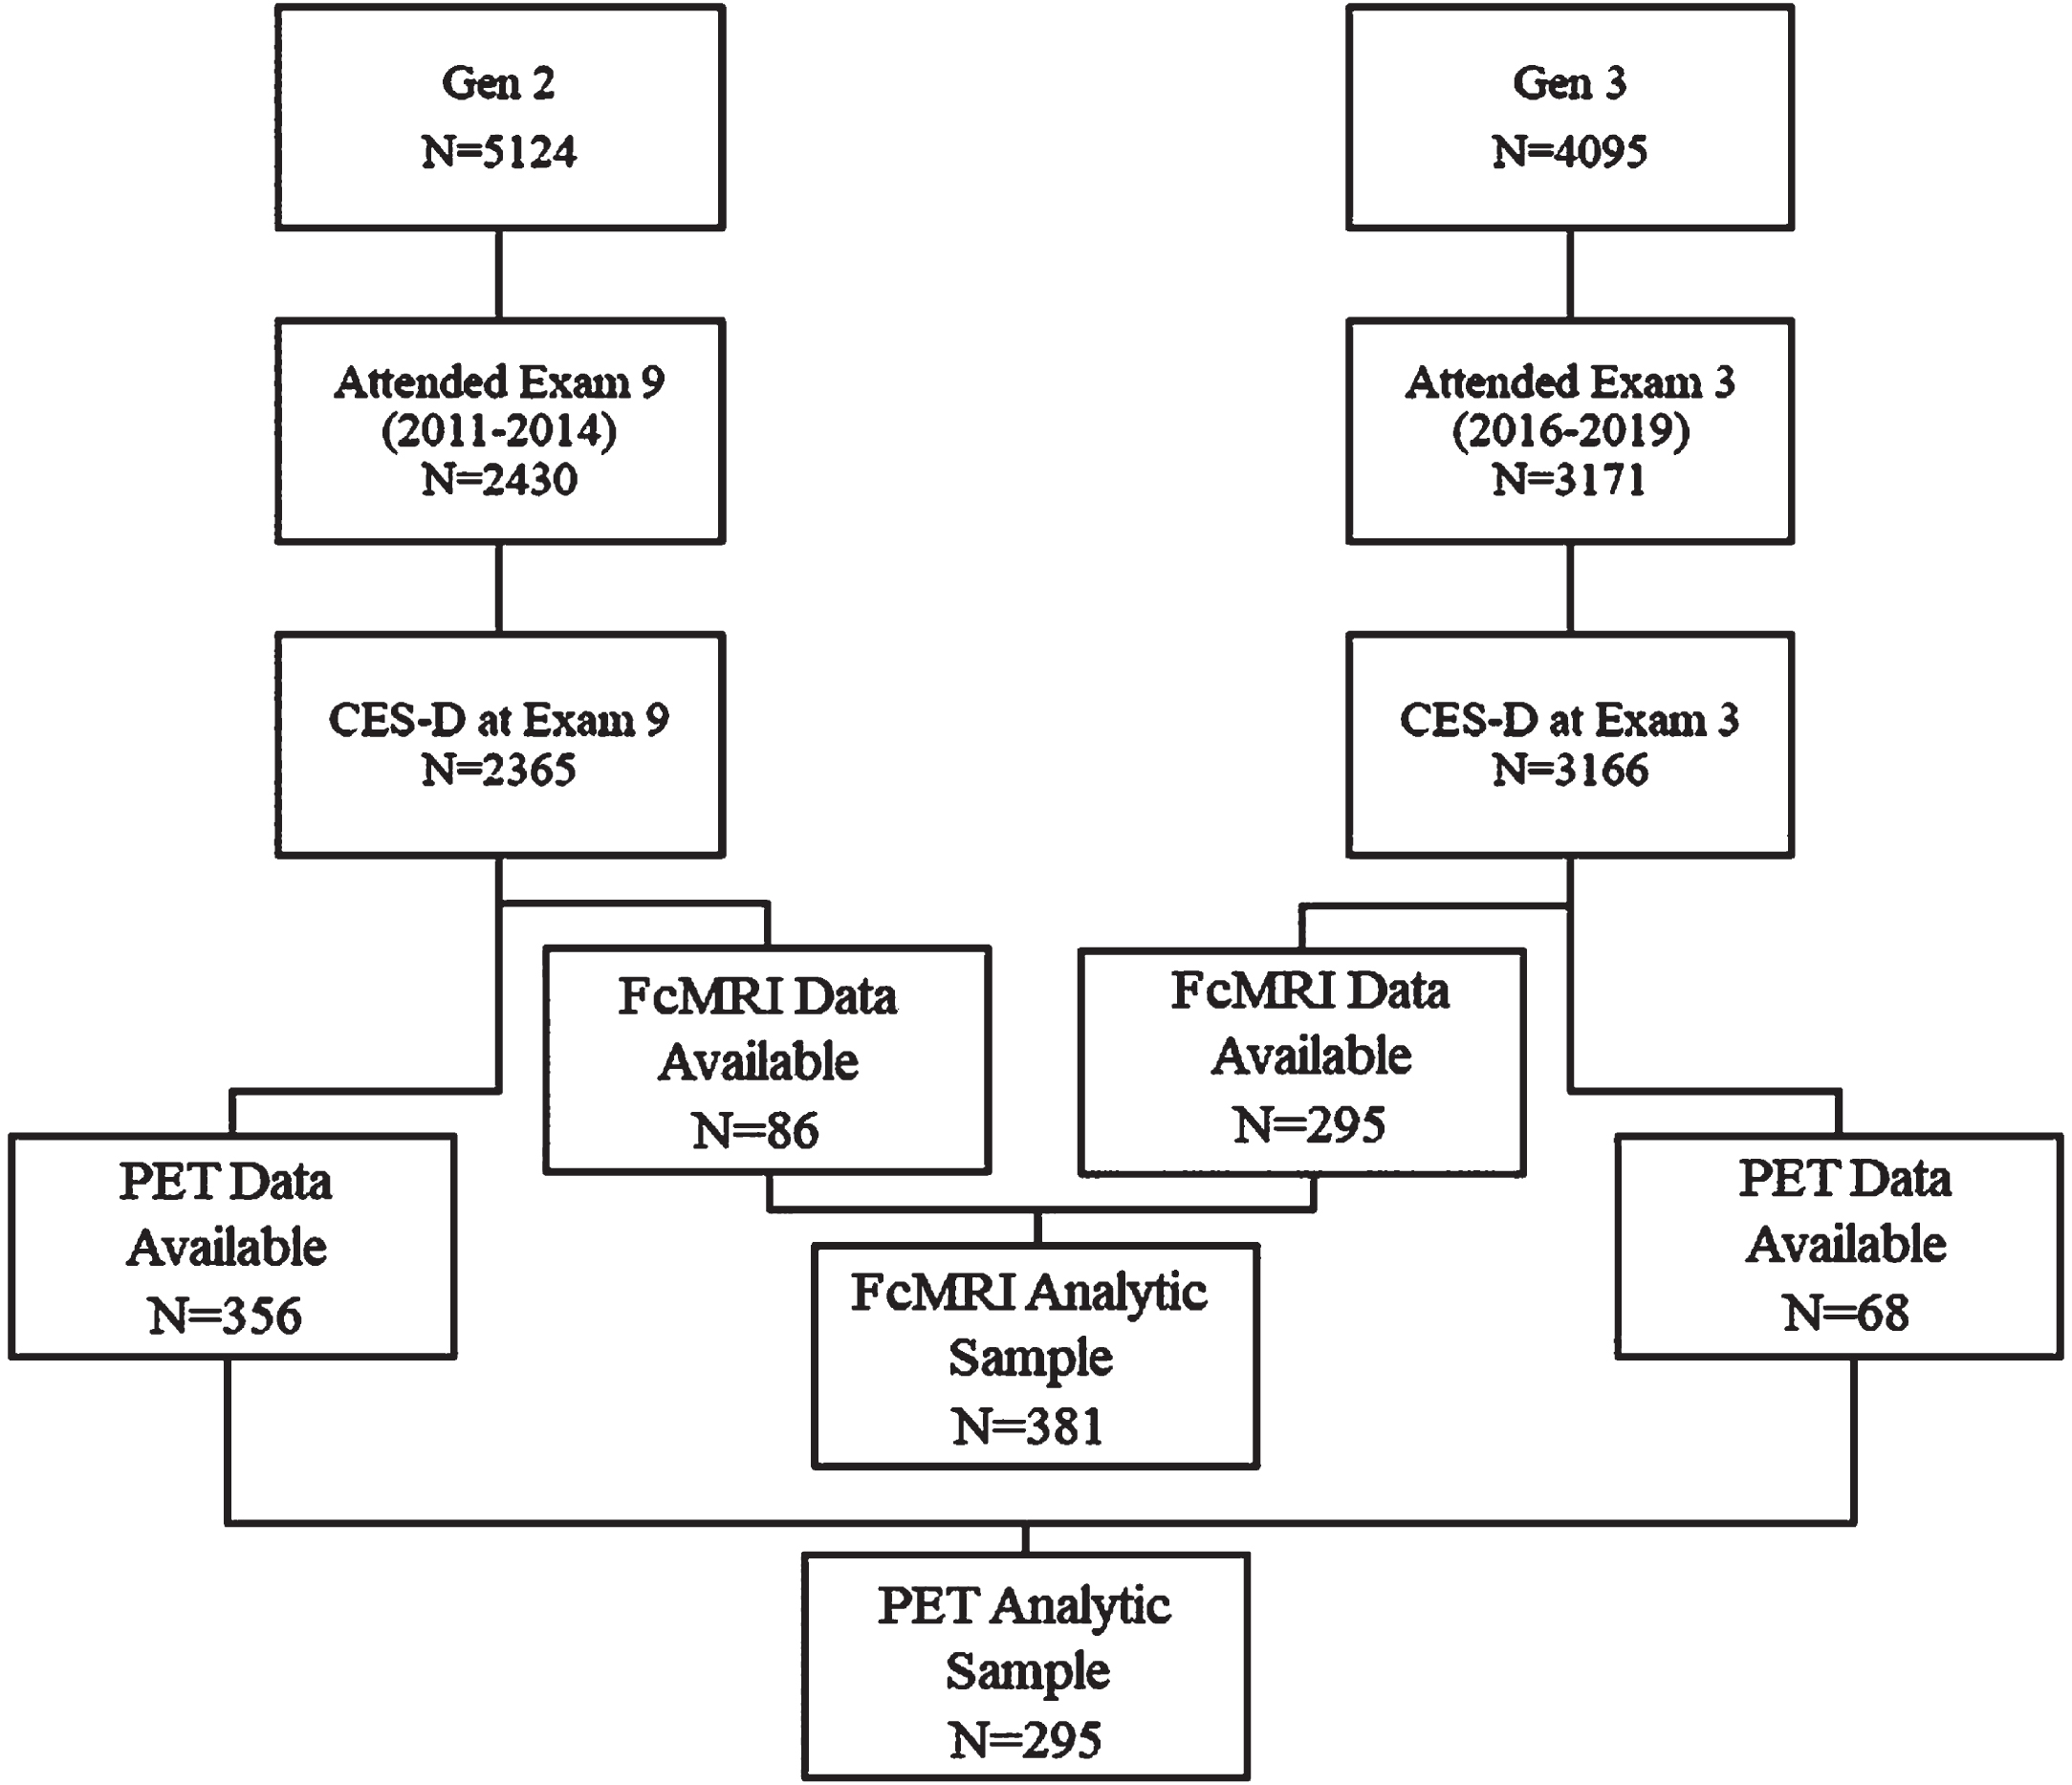
Between 2016 and 2019, Generation 2 and Generation 3 participants (children and grandchildren of the Original cohort, respectively) [18] underwent brain MRI, functional MRI, and amyloid and tau PET imaging. Participants were excluded from these imaging studies if they had history of dementia, stroke, or another neurological condition that could affect brain imaging assessment. Our sample was comprised of 381 individuals with fully processed fcMRI data and 424 individuals with amyloid and tau PET imaging (Fig. 1).
Fig. 1
Flow diagram for analytic sample derivation.
Standard protocol approvals, registrations, and patient consents
All participants provided written informed consent. The Institutional Review Board of Boston University Medical Center approved the consent form and study protocol.
Loneliness measures
Loneliness is a construct used to describe the subjective experience of feeling isolated due to a perceived gap between one’s desired social relationships, and one’s existing social relationships [19]. The Center for Epidemiologic Studies-Depression; (CES-D) scale has previously been used to quantify loneliness in large community-based cohorts such as ours [20, 21]. The CES-D is a 20- item questionnaire assessing the frequency of each of a series of twenty depressive symptoms in the past week, where symptoms are reported as occurring “rarely or none of the time (less than 1 day)” (0 points), “some or a little of the time (1–2 days)” (1 point), “occasionally or a moderate amount of time (3–4 days)” (2 points), or “most or all of the time (5–7 days)” (3 points). The total score ranges between 0 to 60 points, where higher scores correspond with greater depressive symptomatology. The ‘lonely’ item of the CES-D asks participants how often they “felt lonely in the past week”, and was used to quantify loneliness in this study based on similar prior applications of this measure[6, 20].
‘Loneliness’ was defined as ‘feeling lonely for at least 1 day in the past week’— this was a dichotomous variable corresponding to any single- item score greater than 0 [5, 20]. For exploratory analyses, ‘loneliness’ was analyzed using a more conservative threshold of ‘feeling lonely for at least 3 days in the past week’. Our primary definition and our conservative definition of loneliness have both previously been used in prior FHS and Health and Retirement Studies, and have both been associated with both positive and null results [5, 20, 22, 23]. ‘Loneliness’ was also modeled as an ordinal variable in exploratory analyses by assigning ordinal values to various CES-D scores, divided into loneliness < 1 day, 1–2 days, 3–4 days, or 5–7 days per week (assigned scores of ‘1’, ‘2’, ‘3’, ‘4’, respectively). CES-D scores from the exam closest to fcMRI acquisition were used.
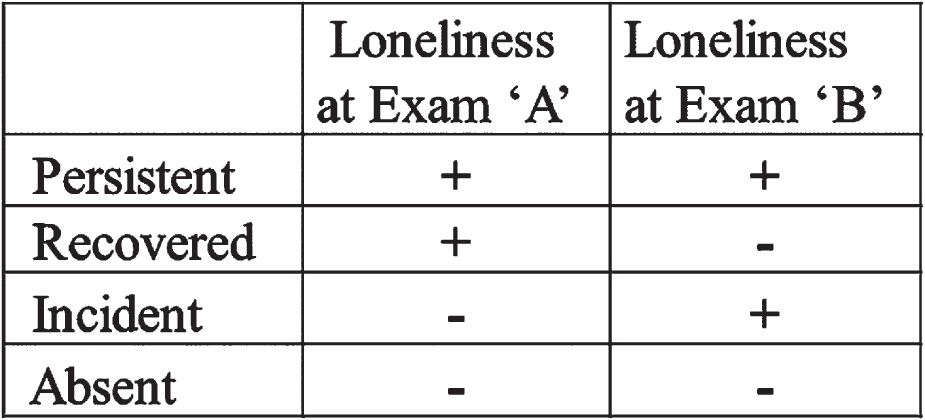
Importantly, the experience of loneliness is a dynamic quality that changes over time, and these temporal shifts in loneliness have been observed to have differential effects on health outcomes. In particular, persistent loneliness was found to be an independent risk factor for incident dementia from AD within the FHS cohort, and varying risk has been noted based on the concept of ‘persistent loneliness’ [20]; thus, we included a four-level exposure variable to take this concept into consideration based on prior constructs of persistent loneliness (Fig. 2) [20]. We used two consecutive CES-D scores to determine change in loneliness over time (Exams 8 (2005- 2008) and 9 (2011- 2014) for Generation 2 participants, and Exams 2 (2009- 2011) and 3 (2016- 2019) for Generation 3 participants). ‘Persistent’ loneliness was defined as feeling lonely (loneliness reported at least 1 day per week, as above) at both exams. ‘Recovered’ loneliness was defined as feeling lonely at the first but not the second of these exams (termed ‘transient’ loneliness in prior constructs [20]). ‘Incident’ loneliness was defined as loneliness reported at the second but not the first of these exams. ‘Absent’ loneliness was defined as loneliness absent at both exams. Participants with only one CES-D measurement at these exams were excluded from this portion of the analysis.
Fig. 2
Summary of terms used to describe and analyze in loneliness status over time.
Imaging measures
Functional connectivity MRI
MRI is an established antemortem biomarker of AD, and associations between volumetric MRI measures and postmortem AD-related neuropathology have previously been observed in the FHS cohort [8]. However, traditional MRI has limitations. While MRI can provide information on general structural and volumetric changes, it is less able to provide information on the functional network disruptions that underlie AD pathology [24]. Further antemortem assessments would promise advances in AD detection, prevention, and treatment. Thus, we chose to examine associations between loneliness and functional connectivity MRI (fcMRI). fcMRI is an imaging technique that relies on detection of local alterations in blood flow and metabolism, and is able to describe functional networks that exist between non-anatomically contiguous regions [25].
In this study, MRI scans were conducted on a Philips 3T Achieva system using a 32- channel head coil. For T1 scans parameters were: voxel size = 1.05 mm x 1.05 mm x 1.20 mm, 170 sagittal slices. For resting state fMRI (rsfMRI scan) scans, parameters were: scan time = 7 min, voxel size = 3.3125 mm x 3.3125 mm x 3.3125, 170 sagittal slices. T1 Turbo Field Echo (TFE) MRI scans were processed using Freesurfer version 6.0. RsfMRI scans were analyzed using FSL tools. Data preprocessing was conducted using FMRI Expert Analysis Tool (FEAT) version 6.0.[26, 27] The resting state fMRI and T1 images were co-registered using Boundary-Based Registration (BBR) [28]. An in-house developed script was used to calculate correlations between seed regions based on the Yeo 7 Network model. The data was normalized by a Fisher Z transformation for each participant.
PET imaging
11C-Pittsburgh Compound B (PiB) Aβ and 18F-Flortaucipir (FTP) tau PET images were acquired from two cameras: a GE Discovery scanner and a Siemens ECAT HR+scanner (3D mode; 63 image planes; 15.2 cm axial field of view; 5.6 mm transaxial resolution; and, 2.4 mm slice interval); full details published previously [29]. GE Discovery scanner data was combined with the HR+scanner data and smoothing was applied. An mCi bolus injection of the tracer was administered, followed by 60 min of image acquisition in 4 x 5-min frames. SPM8 was used to co-register PiB and FTP images to a structural T1-weighted MRI scan. FreeSurfer version 6.0 was used to derive regions of interest. The cerebellar cortex was used as a reference region in expressing distribution volume ratios (DVRs) for PiB and in expressing standardized uptake value ratios (SUVRs) for FTP retention.
Covariates
Covariates included age, sex, APOE4 carrier status, interval time (time between loneliness assessment and image acquisition), PET camera (HR+versus Smoothed Discovery GE), education (3- level variable; high school, some college, college or more), and modified CES-D score (depressive symptom burden calculated as the CES-D score minus the loneliness item, natural log-transformed to normalize its distribution).
Statistical analysis
Our primary fcMRI measure was default mode network (DMN) intra-network connectivity [11].
Primary PET measures of interest were Aβ deposition in FLR (a summary of frontal, lateral parietal and lateral temporal, retrosplenial cortices) and precuneal regions, and tau deposition in the amygdala, entorhinal, and rhinal regions.
In our primary model (Model 1), we created separate multivariable linear regression models to relate loneliness to fcMRI and PET measures, adjusted for age, age2, sex, interval time, and PET camera (for PET analyses only). Age2 was included in Model 1 to account for non-linear relationships between age and dependent variables, consistent with prior FHS studies [30]. Model 2 additionally adjusted for education and Model 3 adjusted for Model 1 and 2 covariates and for modified CES-D scores. We performed interaction analyses to assess effect modification by age (age < 60 versus age≥60), sex, and APOE4 allele carrier status on PET and fcMRI imaging. We conducted stratified analyses where interactions met our predefined exploratory threshold (p < 0.10). We ran a priori stratified analyses by APOE4 allele on all PET analyses.
Secondary exploratory measures for fcMRI imaging were intra-network connectivity in the following other available Yeo networks: limbic, frontoparietal, dorsal attention, ventral attention, somatomotor, and visual; DMN-limbic internetwork connectivity was also selected as an exploratory dependent variable. Exploratory PET secondary measures were inferior temporal, parahippocampal, precuneal, and medial orbitofrontal tau. These areas were chosen a priori based on AD pathology in prior studies [29].
RESULTS
Association of loneliness with FcMRI
In the fcMRI sample, 381 participants met inclusion criteria (86 Generation 2 members, 295 Generation 3 members) (Fig. 1). Mean age was 58 years (SD = 10), and our sample was 49% female, with 62% of participants holding at least a college degree. Only 17% of the participants reported feeling lonely one or more days a week at baseline (Table 1). Persistent loneliness was assessed in 366 participants, of which 8% reported persistent loneliness, 8% reported recovered, 8% reported incident, and 75% reported absent loneliness. The mean modified CES-D score (defined as the CES-D score excluding the ‘loneliness’ item) was 6 (SD = 7). There was no association between fcMRI activation changes and loneliness (feeling lonely more than 1 day per week) (Table 2) or between fcMRI changes and loneliness defined ordinally (Supplementary Table 2). Greater visual intra-network connectivity was associated with loneliness defined conservatively (feeling lonely more than 3 days per week) (Supplementary Table 1), but this was no longer present after adjustment for depressive symptom burden (Model 3). DMN to limbic inter-network connectivity had a significant and positive association with recovered loneliness when performing ‘Persistent Loneliness’ analyses (Table 3), and this relationship persisted even after adjustment for education and depressive symptom burden.
Table 1
Sample characteristics
| FcMRI sample (n = 381) | PET sample (n = 424) | |
| Characteristic | ||
| Cohort, No. (%) | ||
| Generation 2 (Offspring) | 86 (22.6) | 356 (84) |
| Generation 3 | 295 (77.4) | 68 (16) |
| Age, y | 58 (10) | 58 (10) |
| Sex, No. (%) | ||
| Female | 188 (49.3) | 213 (50) |
| Male | 193 (50.7) | 211 (50) |
| Education, No. (%) | ||
| High school degree only | 38 (10) | 42 (10) |
| Some college | 108 (28) | 106 (25) |
| College degree or more | 235 (62) | 276 (65) |
| Baseline Cognitiona | 0.6 (0.8) | 0.6 (0.8) |
| Loneliness, No. (%)b,c | ||
| <1 day (0 points) | 317 (83.2) | 353 (83) |
| 1–2 days (1 point) | 47 (12.3) | 50 (12) |
| 3–4 days (2 points) | 10 (2.6) | 14 (3) |
| 5–7 days (3 points) | 7 (1.8) | 7 (2) |
| Loneliness 1 or more days in the past week (≥1 points), No (%) | 64 (16.8) | 71 (17) |
| Persistent Loneliness, No. (%)d | ||
| Persistent | 30 (8.2) | 29 (7) |
| Transient | 31 (8.5) | 40 (10) |
| Incident | 31 (8.5) | 40 (10) |
| Absent | 274 (74.9) | 301 (73) |
| Modified CES-D (range 0–57)e | 6.1 (7.0) (range 0–47.4) | 6 (7) |
| APOE4 carrier status, positive, No. (%) | 80 (21.8) | 95 (23) |
| FcMRI Measuresf | ||
| DMN-Intra | 2.5 (0.08) | |
| Limbic-Intra | 2.7 (0.08) | |
| Frontoparietal-Intra | 2.3 (0.09) | |
| Dorsal Attention-Intra | 2.3 (0.08) | |
| Ventral Attention-Intra | 2.5 (0.09) | |
| Somatomotor-Intra | 0.04 [0.01, 0.1] | |
| Visual-Intra | 2.1 (0.07) | |
| DMN to Limbic | 0.04 [0.03, 0.06] | |
| PET Measuresg | ||
| Aβ, FLR | 1.1 (0.1) | |
| Aβ, Precuneus | 1.2 (0.1) | |
| Tau, Amygdala | 1.2 (0.1) | |
| Tau, Entorhinal | 1.1 (0.09) | |
| Tau, Rhinal | 1.1 (0.1) | |
| Tau, Inferior Temporal | 1.1 (0.08) | |
| Tau, Parahippocampus | 1.1 (0.08) | |
| Tau, Precuneus | 1.1 (0.08) |
APOE4, Apolipoprotein E4; CES-D, Center for Epidemiologic Studies Depression Scale; DMN, Default Mode Network; FcMRI, Functional Connectivity MRI; FLR, Frontal, lateral parietal and lateral temporal, and retrosplenial cortices; JNC, Joint National Commission; Aβ, Amyloid-β. Data are presented as mean (SD) unless otherwise indicated. aComposite score of Logical Memories (Immediate and Delayed Recall), Visual Reproduction (Immediate and Delayed Recall), Similarities, and Trail Making Test B. Standardized to mean 0, standard deviation 1. bFor CES-D loneliness item, “I felt lonely” during the past week less than 1 day (0 points), 1-2 days (1 point), 3–4 days (2 points), 5–7 days (3 points). cLoneliness from exam most approximate to fcMRI acquisition. d‘Persistent’ loneliness defined as loneliness reported at least 1 day/ week at exam approximate to fcMRI and exam prior to that. ‘Transient’ loneliness defined as loneliness reported at least 1 day/week at the first but not the second of these exams. ‘Incident’ loneliness defined as loneliness reported at least 1 day/week at the second but not the first of these exams. ‘Absent’ loneliness defined as loneliness reported less than 1 day/week at both exams. eModified CES-D is the sum score of CES-D items remaining after exclusion of the loneliness item. fFcMRI measurements provided as correlations. gPET measurements provided as Partial-Volume Uncorrected values.
Table 2
Multivariable-Adjusted Models of Functional Connectivity MRI Measures as a Function of Loneliness Status aPrimary outcomes indicated with emphasized border; all others are secondary outcomes
| Model 1b | Model 2c | Model 3d | |||||||
| fcMRI Measures | No. of | Estimate | p | No. of | Estimate | p | No. of | Estimate | p |
| participants | (SE) | participants | (SE) | participants | (SE) | ||||
| DMN-Intra | 381 | –0.0003 (0.0102) | 0.9733 | 381 | –0.0003 (0.0102) | 0.9732 | 381 | –0.0040 (0.0106) | 0.7049 |
| Limbic-Intra | 381 | –0.0157 (0.0116) | 0.1770 | 381 | –0.0151 (0.0116) | 0.1927 | 381 | –0.0170 (0.0121) | 0.1614 |
| Frontoparietal-Intra | 381 | 0.0085 (0.0117) | 0.4644 | 381 | 0.0083 (0.0117) | 0.4785 | 381 | 0.0022 (0.0121) | 0.8546 |
| Dorsal Attention-Intra | 381 | 0.0055 (0.0105) | 0.6016 | 381 | 0.0052 (0.0105) | 0.6219 | 381 | 0.0023 (0.0110) | 0.8320 |
| Ventral Attention-Intra | 381 | 0.01 (0.01) | 0.56 | 381 | 0.01 (0.01) | 0.54 | 381 | 0.01 (0.01) | 0.57 |
| Somatomotor-Intra | 381 | 0.00 (0.03) | 0.99 | 381 | 0.00 (0.03) | 0.99 | 381 | 0.002 (0.03) | 0.94 |
| Visual-Intra | 381 | 0.005 (0.01) | 0.6 | 381 | 0.005 (0.01) | 0.59 | 381 | 0.002 (0.01) | 0.82 |
| DMN to Limbic | 381 | –0.001 (0.003) | 0.8 | 381 | –0.001 (0.003) | 0.81 | 381 | –0.001 (0.003) | 0.85 |
DMN, Default Mode Network. aPredictor: Lonely (1 + days/week) versus not lonely (<1 days/week). bModel 1: Age, age-squared, sex, time interval between loneliness assessment and PET camera (binary variable: HR+vs. Smoothed Discovery GE). cModel 2:+Level of educational achievement (three-level variable). dModel 3:+Modified CES-D (continuous, logarithm of CES-D excluding loneliness item).
Table 3
Multivariable-Adjusted Models of Functional Connectivity MRI Measures as a Function of Dynamic Loneliness Statusa
| Model 1b | Model 2c | Model 3d | |||||||||
| Loneliness | No. of | Estimate | p | No. of | Estimate | p | No. of | Estimate | p | ||
| level | participants | (SE) | participants | (SE) | participants | (SE) | |||||
| DMN-Intra | Incident | –0.01 (0.01) | 0.55 | –0.01 (0.01) | 0.59 | –0.01 (0.01) | 0.44 | ||||
| Persistent | 366 | 0.005 (0.01) | 0.75 | 366 | 0.004 (0.01) | 0.77 | 366 | 0 (0.01) | 0.99 | ||
| Recovered | 0.01 (0.01) | 0.57 | 0.01 (0.01) | 0.61 | 0.01 (0.01) | 0.72 | |||||
| Absent | Ref | Ref | Ref | Ref | Ref | Ref | |||||
| Limbic-Intra | Incident | –0.01 (0.02) | 0.66 | –0.01 (0.02) | 0.69 | –0.01 (0.02) | 0.6 | ||||
| Persistent | 366 | –0.03 (0.02) | 0.12 | 366 | –0.02 (0.02) | 0.13 | 366 | –0.03 (0.02) | 0.11 | ||
| Recovered | 0.003 (0.02) | 0.83 | 0.002 (0.02) | 0.89 | 0.001 (0.02) | 0.95 | |||||
| Absent | Ref | Ref | Ref | Ref | Ref | Ref | |||||
| Frontoparietal- | Incident | –0.002 (0.02) | 0.92 | –0.001 (0.02) | 0.94 | –0.01 (0.02) | 0.68 | ||||
| Intra | Persistent | 366 | 0.02 (0.02) | 0.3 | 366 | 0.02 (0.02) | 0.32 | 366 | 0.01 (0.02) | 0.55 | |
| Recovered | 0.02 (0.02) | 0.27 | 0.02 (0.02) | 0.28 | 0.01 (0.02) | 0.39 | |||||
| Absent | Ref | Ref | Ref | Ref | Ref | Ref | |||||
| Dorsal | Incident | –0.01 (0.01) | 0.72 | –0.005 (0.01) | 0.74 | –0.01 (0.02) | 0.59 | ||||
| Attention- | Persistent | 366 | 0.01 (0.01) | 0.33 | 366 | 0.01 (0.02) | 0.36 | 366 | 0.01 (0.02) | 0.52 | |
| Intra | Recovered | –0.001 (0.01) | 0.95 | –0.001 (0.01) | 0.94 | –0.003 (0.01) | 0.83 | ||||
| Absent | Ref | Ref | Ref | Ref | Ref | Ref | |||||
| Ventral | Incident | –0.003 (0.02) | 0.87 | –0.002 (0.02) | 0.91 | –0.002 (0.02) | 0.93 | ||||
| Attention- | Persistent | 366 | 0.01 (0.02) | 0.44 | 366 | 0.01 (0.02) | 0.44 | 366 | 0.01 (0.02) | 0.45 | |
| Intra | Recovered | 0.004 (0.02) | 0.81 | 0.003 (0.02) | 0.88 | 0.003 (0.02) | 0.87 | ||||
| Absent | Ref | Ref | Ref | Ref | Ref | Ref | |||||
| Visual-Intra | Incident | 0.01 (0.03) | 0.69 | 0.01 (0.03) | 0.68 | 0.02 (0.04) | 0.59 | ||||
| Persistent | 366 | 0.001 (0.04) | 0.97 | 366 | –0.001 (0.04) | 0.99 | 366 | 0.005 (0.04) | 0.9 | ||
| Recovered | –0.05 (0.03) | 0.12 | –0.05 (0.03) | 0.12 | –0.05 (0.03) | 0.15 | |||||
| Absent | Ref | Ref | Ref | Ref | Ref | Ref | |||||
| Somatomotor-Intra | Incident | –0.002 (0.01) | 0.86 | –0.002 (0.01) | 0.88 | –0.01 (0.01) | 0.68 | ||||
| Persistent | 366 | 0.01 (0.01) | 0.66 | 366 | 0.01 (0.01) | 0.66 | 366 | 0.002 (0.01) | 0.88 | ||
| Recovered | –0.01 (0.01) | 0.32 | –0.01 (0.01) | 0.31 | –0.02 (0.01) | 0.24 | |||||
| Absent | Ref | Ref | Ref | Ref | Ref | Ref | |||||
| DMN to Limbic | Incident | 0.001 (0.004) | 0.89 | 0.001 (0.004) | 0.9 | 0.001 (0.004) | 0.79 | ||||
| Persistent | 366 | 0 (0.004) | 0.99 | 366 | 0 (0.004) | 0.97 | 366 | 0.001 (0.004) | 0.84 | ||
| Recovered | 0.01 (0.004) | 0.03 | 0.01 (0.004) | 0.03 | 0.01 (0.004) | 0.03 | |||||
| Absent | Ref | Ref | Ref | Ref | Ref | Ref | |||||
DMN, Default Mode Network. aPredictor: four-level exposure variable, persistent/incident/recovered/absent. bModel 1: Age, age-squared, sex, time interval between loneliness assessment and PET camera (binary variable: HR+vs. Smoothed Discovery GE). cModel 2:+Level of educational achievement (three-level variable). dModel 3:+Modified CES-D (continuous, logarithm of CES-D excluding loneliness item).
Association of loneliness with Aβ and tau PET
In the PET sample, 424 participants met inclusion criteria (356 Generation 2 members, 68 Generation 3 members). Mean age at PET imaging was 58 years (SD = 10), with a sample that was 50% female, and with 65% of participants holding at least a college degree. Eighty-three percent of participants reported < 1 day of loneliness per week, 12% reported 1–2 days of loneliness, 3% reported 3–4 days of loneliness, and 2% reported loneliness for 5–7 days a week. Persistent loneliness was assessed in 410 participants, of which 7% reported persistent loneliness, 10% reported recovered, 10% reported incident, and 73% reported absent loneliness. The mean modified CES-D score was 6 (SD = 7).
In the PET sample, we did not observe an association between loneliness (defined as feeling lonely for one day or more per week) and Aβ deposition in primary outcome locations (FLR, precuneus) (Table 4). We also did not observe any association between loneliness and tau deposition in any primary outcome regions (the amygdala, entorhinal, and rhinal regions) or secondary outcome regions (inferior temporal, parahippocampal, precuneal, and medial orbitofrontal tau) (Table 4). When using a more conservative definition of loneliness (feeling lonely for 3 days or more, per week), we again did not observe an association between loneliness and Aβ deposition in FLR or precuneal areas, nor an association between loneliness and tau deposition in primary or secondary outcome regions (Supplementary Table 3). When treated as an ordinal variable, loneliness remained unassociated with Aβ and tau (Supplementary Table 4). When analyzing the association between ‘persistent loneliness state’ (e.g., persistent, incident, recovered, and absent loneliness) and Aβ and tau deposition, again no association was seen (Table 5).
Table 4
Multivariable-Adjusted Models of PET Measures as a Function of Loneliness Status aPrimary outcomes indicated with emphasized border; all others are secondary outcomes
| Model 1c | Model 2d | Model 3e | |||||||
| PET Measuresb | No. of | Estimate | pf | No. of | Estimate | p | No. of | Estimate | p |
| participants | (SE) | participants | (SE) | participants | (SE) | ||||
| Aβ, FLR | 415 | –0.01 (0.01) | 0.85 | 415 | 0.00 (0.01 | 0.85 | 368 | –0.01 (0.01) | 0.85 |
| Aβ, Precuneus | 416 | –0.01 (0.02) | 0.85 | 416 | –0.01 (0.02) | 0.85 | 369 | –0.02 (0.02) | 0.85 |
| Tau, Amygdala | 321 | –0.01 (0.02) | 0.85 | 321 | –0.01 (0.02) | 0.85 | 287 | 0.00 (0.02) | 0.96 |
| Tau, Entorhinal | 321 | –0.01 (0.01) | 0.85 | 321 | –0.01 (0.01) | 0.85 | 287 | –0.02 (0.02) | 0.85 |
| Tau, Rhinal | 314 | –0.01 (0.02) | 0.85 | 314 | –0.01 (0.02) | 0.85 | 282 | –0.02 (0.02) | 0.85 |
| Tau, Inferior Temporal | 321 | –0.01 (0.01) | 0.85 | 321 | 0.00 (0.01) | 0.87 | 287 | 0.00 (0.01) | 0.89 |
| Tau, Parahippocampus | 321 | –0.02 (0.01) | 0.85 | 321 | –0.02 (0.01) | 0.85 | 287 | –0.01 (0.01) | 0.85 |
| Tau, Precuneus | 321 | –0.01 (0.01) | 0.85 | 321 | –0.01 (0.01) | 0.85 | 287 | 0.00 (0.01) | 0.91 |
| Tau, Medial Orbitofrontal | 321 | –0.02 (0.01) | 0.85 | 321 | –0.01 (0.01) | 0.85 | 287 | 0.00 (0.02) | 0.88 |
Aβ, Amyloid- β; FLR, Frontal, lateral parietal and lateral temporal, and retrosplenial cortices. aPredictor: Lonely (1 + days/week) versus not lonely (<1 days/week). bPET measurements provided as Partial-Volume Uncorrected values. cModel 1: Age, age-squared, sex, time interval between loneliness assessment and PET camera (binary variable: HR+vs. Smoothed Discovery GE). dModel 2:+Level of educational achievement (three-level variable). eModel 3:+Modified CES-D (continuous, logarithm of CES-D excluding loneliness item). fFDR-corrected p-value.
Table 5
Multivariable-Adjusted Models of PET Measures as a Function of Persistent Loneliness Statusa
| Model 1c | Model 2d | Model 3e | ||||||||
| PET Measuresb | Loneliness | No. of | Estimate | pf | No. of | Estimate | pf | No. of | Estimate | pf |
| Level | participants | (SE) | participants | (SE) | participants | (SE) | ||||
| Aβ, FLR | Persistent | 401 | 0.00 (0.02) | 0.99 | 401 | 0.00 (0.02) | 0.99 | 358 | 0.00 (0.02) | 0.99 |
| Incident | –0.01 (0.01) | 0.99 | –0.01 (0.01) | 0.99 | –0.01 (0.01) | 0.99 | ||||
| Recovered | –0.01 (0.01) | 0.99 | –0.01 (0.01) | 0.99 | –0.01 (0.01) | 0.99 | ||||
| Absent | Ref | Ref | Ref | |||||||
| Aβ, Precuneus | Persistent | 402 | –0.01 (0.03) | 0.99 | 402 | –0.01 (0.03) | 0.99 | 359 | –0.02 (0.03) | 0.99 |
| Incident | –0.01 (0.02) | 0.99 | –0.01 (0.02) | 0.99 | –0.02 (0.03) | 0.99 | ||||
| Recovered | –0.01 (0.02) | 0.99 | –0.01 (0.02) | 0.99 | –0.02 (0.02) | 0.99 | ||||
| Absent | Ref | Ref | Ref | |||||||
| Tau, Amygdala | Persistent | 314 | –0.03 (0.03) | 0.99 | 314 | –0.02 (0.03) | 0.99 | 281 | –0.01 (0.03) | 0.99 |
| Incident | 0.00 (0.02) | 0.99 | 0.00 (0.02) | 0.99 | 0.01 (0.03) | 0.99 | ||||
| Recovered | 0.00 (0.02) | 0.99 | –0.01 (0.02) | 0.99 | –0.01 (0.03) | 0.99 | ||||
| Absent | Ref | Ref | Ref | |||||||
| Tau, Entorhinal | Persistent | 314 | –0.02 (0.02) | 0.99 | 314 | –0.02 (0.02) | 0.99 | 281 | –0.03 (0.02) | 0.99 |
| Incident | 0.00 (0.02) | 0.99 | 0.00 (0.02) | 0.99 | 0.00 (0.02) | 0.99 | ||||
| Recovered | 0.00 (0.02) | 0.99 | 0.00 (0.02) | 0.99 | 0.00 (0.02) | 0.99 | ||||
| Absent | Ref | Ref | Ref | |||||||
| Tau, Rhinal | Persistent | 307 | –0.03 (0.02) | 0.99 | 307 | –0.02 (0.02) | 0.99 | 276 | –0.03 (0.03) | 0.99 |
| Incident | 0.01 (0.02) | 0.99 | 0.01 (0.02) | 0.99 | 0.00 (0.01) | 0.99 | ||||
| Recovered | 0.01 (0.02) | 0.99 | 0.01 (0.02) | 0.99 | 0.00 (0.02) | 0.99 | ||||
| Absent | Ref | Ref | Ref | |||||||
| Tau, Inferior Temporal | Persistent | 314 | –0.01 (0.02) | 0.99 | 314 | –0.01 (0.02) | 0.99 | 281 | –0.01 (0.02) | 0.99 |
| Incident | 0.00 (0.01) | 0.99 | 0.00 (0.01) | 0.99 | 0.00 (0.02) | 0.99 | ||||
| Recovered | 0.00 (0.01) | 0.99 | 0.00 (0.01) | 0.99 | –0.01 (0.02) | 0.99 | ||||
| Absent | Ref | Ref | Ref | |||||||
| Tau, Parahippocampus | Persistent | 314 | –0.03 (0.02) | 0.99 | 314 | –0.02 (0.02) | 0.99 | 281 | –0.02 (0.02) | 0.99 |
| Incident | –0.01(0.02) | 0.99 | 0.00 (0.02) | 0.99 | 0.00 (0.02) | 0.99 | ||||
| Recovered | 0.00 (0.01) | 0.99 | 0.00 (0.01) | 0.99 | 0.00 (0.02) | 0.99 | ||||
| Absent | Ref | Ref | Ref | |||||||
| Tau, Precuneus | Persistent | 314 | –0.03 (0.02) | 0.99 | 314 | –0.02 (0.02) | 0.99 | 281 | –0.02 (0.02) | 0.99 |
| Incident | 0.00 (0.01) | 0.99 | 0.00 (0.01) | 0.99 | 0.00 (0.02) | 0.99 | ||||
| Recovered | –0.01 (0.01) | 0.99 | –0.02 (0.01) | 0.99 | –0.02 (0.02) | 0.99 | ||||
| Absent | Ref | Ref | Ref | |||||||
| Tau, Medial Orbitofrontal | Persistent | 314 | –0.02 (0.02) | 0.99 | 314 | –0.02 (0.02) | 0.99 | 281 | –0.01 (0.02) | 0.99 |
| Incident | –0.01 (0.02) | 0.99 | –0.01 (0.02) | 0.99 | 0.00 (0.02) | 0.99 | ||||
| Transient | 0.00 (0.02) | 0.99 | –0.01 (0.02) | 0.99 | 0.00 (0.02) | 0.99 | ||||
| Recovered | Ref | Ref | Ref | |||||||
Aβ, Amyloid-β; FLR, Frontal, lateral parietal and lateral temporal, and retrosplenial cortices. aPredictor: four-level exposure variable, persistent/incident/recovered/absent. bPET measurements provided as Partial-Volume Uncorrected values. cModel 1: Age, age-squared, sex, time interval between loneliness assessment and PET camera (binary variable: HR+vs. Smoothed Discovery GE). dModel 2:+Level of educational achievement (three-level variable). eModel 3:+Modified CES-D (continuous, logarithm of CES-D excluding loneliness item). fFDR-corrected p-value.
Sensitivity and interaction analyses
We observed effect modification of APOE4 status on the association between loneliness and visual network fcMRI connectivity (p = 0.09, Supplementary Table 5). We did not observe significant effect modification of any other networks based on age, sex, or APOE4 status. We observed effect modification by APOE4 status on the association between loneliness and precuneal amyloid (p = 0.07, Supplementary Table 13). APOE4 + individuals were found to have a borderline association of loneliness with less precuneal amyloid deposition; this was not present for APOE4- individuals. No other PET regions demonstrated significant effect modification by age, sex, or APOE4 carrier status.
DISCUSSION
In this cross-sectional study, loneliness was not found to be associated with our primary imaging measures of interest: DMN intra-network connectivity, FLR and precuneal Aβ, and amygdalar, entorhinal, and rhinal tau.
Prior research has suggested that loneliness has a relationship with eventual AD development, [5] with changes present even in middle-aged individuals [20], so our negative results were not expected but could be attributed to several factors. First, loneliness may operate as a modifier of tau deposition rather than as a direct cause. This population of middle- aged individuals are presumably at the beginning stages of tau deposition, and it may be too early to see the modification effects of loneliness. Second, prior research suggests that it may not be mid-life loneliness itself that predisposes to AD, but rather the persistence of loneliness across several years that may predispose to AD [20]. These individuals, who may not yet have been exposed to persistent mid-life loneliness, may not yet show functional or pathological changes associated with AD. There may also be a “sensitive period” in which the brain is particularly susceptible to the effects of loneliness. Such “sensitive periods” for AD neuropathology have been seen with vascular risk factors, with mid-life exposure to vascular risk factors promoting Aβ deposition more so than late-life exposure [31]. Our cohort of individuals may not fall within this sensitive period.
Alternatively, loneliness may operate through more complex pathological mechanisms, which may not be entirely captured through our data. Loneliness-related inflammation has been associated with increased pro-inflammatory cytokines [32], which have in turn been seen to facilitate greater tau phosphorylation [33–36] and greater Aβ deposition [31]. These pathways would not necessarily be well- captured by our chosen imaging modalities.
Few associations reached significance on exploratory analyses. Among APOE4 positive individuals, we observed a borderline negative association between loneliness and precuneal Aβ. While the precuneus has been seen to be an early accumulator of Aβ [37–39], and while APOE4 has been seen to be a potentiator of Aβ deposition [40], we would have expected to see a positive association between loneliness and precuneal Aβ. Increased visual intra-network connectivity was found to correspond with higher conservative loneliness measures, and an interaction was noted between visual network connectivity and APOE4 status [41]. While the visual network is not one typically associated with AD, prior research has similarly demonstrated a positive relationship between visual network activation and loneliness [41, 42] through a mechanism involving increased mirror neuron activation [41]. However, any significant associations seen in our exploratory analyses should be interpreted with caution given our liberal threshold for significance, and given the false discovery rate associated with our many comparisons.
Strengths and limitations
One of our study’s key strengths is inclusion of both the PET and the fcMRI imaging of a single cohort in one study, which may reduce confounding factors in the comparison of PET and fcMRI imaging as factors of loneliness. Additionally, our cohort’s mean age of 58 and composition of middle-aged individuals without dementia or other neurologic conditions allows us to gather information on neuropathology prior to onset of clinical symptoms, and we hope these data will serve as a baseline for follow-up studies of this cohort. Use of fcMRI in a mid-life cohort may also provide information on early network changes, which may be detectable prior to the structural changes seen on standard MRI.
One of our key limitations pertains to the use of the loneliness item of the CES-D, which is one of the most commonly used measures for loneliness in large epidemiologic studies, and which has been applied in both loneliness and AD research [5, 20, 21]. However, multi- item questionnaires, such as the 20-item UCLA Loneliness Scale, are likely more comprehensive than single- item measure of loneliness such as the CES-D. Further, the CES-D loneliness item is a direct measure of loneliness (because it asks about loneliness explicitly), which may introduce bias associated with identifying as “lonely”; the UCLA Loneliness Scale, as an indirect measure of loneliness, may reduce some of these biases [43, 44]. This study may have been underpowered as well, given the small n meeting criteria for loneliness. Further, this study methodology does not give us the opportunity to assess causality; however, the relationship between loneliness and AD imaging findings is not one amenable to randomized controlled trials. Further prospective analysis of this population may provide a suitable alternative by tracking the time course of neuroimaging changes and loneliness ratings. Our exploratory analyses are also limited by our liberal significance threshold and the large number of analyses— while the Benjamini-Hochberg Procedure was used to correct our PET data for multiple analyses, this was not done for fcMRI data.
Conclusion
In this cross-sectional cohort study, there was no association observed between loneliness and fcMRI, Aβ PET, and tau PET neuroimaging markers of AD. This lack of association is possibly due to sample characteristics, complexity of related mechanisms, or observational nature of our study, thus meriting further investigation with prospective study of longitudinal cohorts to clarify loneliness’ relationship with AD pathogenesis.
AUTHOR CONTRIBUTIONS
Amanda Jin Zhao (Conceptualization; Formal analysis; Investigation; Methodology; Resources; Software; Validation; Writing – original draft; Writing – review & editing); Laura Balcer (Funding acquisition; Resources; Supervision; Writing – review & editing); Jayandra J. Himali (Conceptualization; Data curation; Formal analysis; Investigation; Methodology; Resources; Software; Supervision; Writing – review & editing); Adrienne O’Donnell (Conceptualization; Data curation; Formal analysis; Investigation; Methodology; Software; Validation; Writing – review & editing); Yashar Rahimpour (Conceptualization; Formal analysis; Methodology); Charles DeCarli (Conceptualization; Investigation; Methodology; Writing – review & editing); Mitzi M. Gonzales (Conceptualization; Data curation; Formal analysis; Methodology; Writing – review & editing); Hugo Aparicio (Conceptualization; Data curation; Investigation; Methodology; Writing – review & editing); Jaime Ramos-Cejudo (Conceptualization; Formal analysis; Methodology; Writing – review & editing); Rachel Kenney (Formal analysis; Investigation; Methodology; Writing – review & editing); Alexa Beiser (Conceptualization; Data curation; Formal analysis; Funding acquisition; Investigation; Methodology; Project administration; Resources; Software; Supervision; Validation; Writing – review & editing); Sudha Seshadri (Conceptualization; Data curation; Formal analysis; Funding acquisition; Investigation; Methodology; Project administration; Resources; Software; Supervision; Validation; Writing – review & editing); Joel Salinas (Conceptualization; Data curation; Formal analysis; Funding acquisition; Investigation; Methodology; Project administration; Resources; Supervision; Validation; Writing – review & editing).
ACKNOWLEDGMENTS
Dr. Ronald J. Killiany was instrumental in this work, and we deeply appreciate his contributions to the Framingham Heart Study. The authors of this study are grateful to the ongoing support, time, and commitment of the Framingham Heart Study participants who have contributed to the advancement of medical and scientific knowledge.
FUNDING
This research was supported by the Boston University School of Medicine and the New York University Grossman School of Medicine; contracts from the National Heart, Lung, and Blood Institute (N01-HC 25195, HHSN268201500001I, 75N92019D00031); grants from the National Institute on Neurological Disorders and Stroke (NS017950, UH2NS100605, T32NS048005) and National Institute on Aging [AG049505, AG052409, AG054076, AG049607, AG059421, AG079282, K23AG057760]; and the Robert Katzman Research Training Fellowship in Alzheimer’s and Dementia Research cosponsored by the American Academy of Neurology, the American Brain Foundation, and the Alzheimer’s Association.
None of the funding organizations and sponsors had a role in the design and conduct of the study; collection, management, analysis, and interpretation of the data; preparation, review, or approval of the manuscript; and, decision to submit the manuscript for publication.
CONFLICT OF INTEREST
The authors have no conflict of interest to report.
DATA AVAILIBILITY
The FS datasets analyzed for the present study are available through formal data-use agreements. Any investigator may access the data through the process outlined on the FS website (framinghamheartstudy.org).
SUPPLEMENTARY MATERIAL
[1] The supplementary material is available in the electronic version of this article: https://dx.doi.org/10.3233/JAD-231425.
REFERENCES
[1] | Ong AD , Uchino BN , Wethington E ((2016) ) Loneliness and health in older adults: A mini-review and synthesis. Gerontology 62: , 443–449. |
[2] | Kirkland SA , Griffith LE , Oz UE , Thompson M , Wister A , Kadowaki L , Basta NE , McMillan J , Wolfson C , Raina P , Anderson L , Balion C , Costa A , Asada Y , Cossette B , Levasseur M , Hofer S , Paterson T , Hogan D , Liu-Ambrose T , Menec V , St. John P , Mugford G , Gao Z , Taler V , Davidson P , Cosco T , on behalf of the Canadian Longitudinal Study on Aging (CLSA) Team ((2023) ) Increased prevalence of loneliness and associated risk factors during the COVID-19 pandemic: Findings from the Canadian Longitudinal Study on Aging (CLSA). BMC Public Health 23: , 872. |
[3] | McGinty EE , Presskreischer R , Han H , Barry CL ((2020) ) Psychological distress and loneliness reported by US adults in 2018 and April 2020. JAMA 324: , 93–94. |
[4] | Musich S , Wang SS , Hawkins K , Yeh CS ((2015) ) The impact of loneliness on quality of life and patient satisfaction among older, sicker adults. Gerontol Geriatr Med 1: , 2333721415582119. |
[5] | Salinas J , Beiser AS , Samra JK , O’Donnell A , DeCarli CS , Gonzales MM , Aparicio HJ , Seshadri S ((2022) ) Association of loneliness with 10-year dementia risk and early markers of vulnerability for neurocognitive decline. Neurology 98: , e1337–e1348. |
[6] | Donovan NJ , Okereke OI , Vannini P , Amariglio RE , Rentz DM , Marshall GA , Johnson KA , Sperling RA ((2016) ) Association of higher cortical amyloid burden with loneliness in cognitively normal older adults. JAMA Psychiatry 73: , 1230–1237. |
[7] | d’Oleire Uquillas F , Jacobs HIL , Biddle KD , Properzi M , Hanseeuw B , Schultz AP , Rentz DM , Johnson KA , Sperling RA , Donovan NJ ((2018) ) Regional tau pathology and loneliness in cognitively normal older adults. Transl Psychiatry 8: , 282. |
[8] | Kaur B , Himali JJ , Seshadri S , Beiser AS , Au R , McKee AC , Auerbach S , Wolf PA , DeCarli CS ((2014) ) Association between neuropathology and brain volume in the Framingham Heart Study. Alzheimer Dis Assoc Disord 28: , 219–225. |
[9] | Damulina A , Pirpamer L , Seiler S , Benke T , Dal-Bianco P , Ransmayr G , Struhal W , Hofer E , Langkammer C , Duering M , Fazekas F , Schmidt R ((2019) ) White matter hyperintensities in Alzheimer’s disease: A lesion probability mapping study. J Alzheimers Dis 68: , 789–796. |
[10] | Nesteruk M , Nesteruk T , Styczyńska M , Barczak A , Mandecka M , Walecki J , Barcikowska-Kotowicz M ((2015) ) Predicting the conversionof mild cognitive impairment to Alzheimer’s disease based on thevolumetric measurements of the selected brain structures in magnetic resonance imaging. Neurol Neurochir Pol 49: , 349–353. |
[11] | Spreng RN , Dimas E , Mwilambwe-Tshilobo L , Dagher A , Koellinger P , Nave G , Ong A , Kernbach JM , Wiecki TV , Ge T , Li Y , Holmes AJ , Yeo BTT , Turner GR , Dunbar RIM , Bzdok D ((2020) ) The default network of the human brain is associated with perceived social isolation. Nat Commun 11: , 6393. |
[12] | Greicius MD , Srivastava G , Reiss AL , Menon V ((2004) ) Default-mode network activity distinguishes Alzheimer’s disease from healthy aging: Evidence from functional MRI. Proc Natl Acad Sci U S A 101: , 4637–4642. |
[13] | Dennis EL , Thompson PM ((2014) ) Functional brain connectivity using fMRI in aging and Alzheimer’s disease. Neuropsychol Rev 24: , 49–62. |
[14] | Zhou B , Dou X , Wang W , Yao H , Feng F , Wang P , Yang Z , An N , Liu B , Zhang X , Liu Y ((2022) ) Structural and functional connectivity abnormalities of the default mode network in patients with Alzheimer’s disease and mild cognitive impairment within two independent datasets. Methods 205: , 29–38. |
[15] | Ozlen H , Pichet Binette A , Köbe T , Meyer PF , Gonneaud J , St-Onge F , Provost K , Soucy JP , Rosa-Neto P , Breitner J , Poirier J , Villeneuve S ((2022) ) Spatial extent of amyloid-β levels andassociations with tau-PET and cognition. JAMA Neurol 79: , 1025–1035. |
[16] | Ossenkoppele R , Schonhaut DR , Schöll M , Lockhart SN , Ayakta N , Baker SL , O’Neil JP , Janabi M , Lazaris A , Cantwell A , Vogel J , Santos M , Miller ZA , Bettcher BM , Vossel KA , Kramer JH , Gorno-Tempini ML , Miller BL , Jagust WJ , Rabinovici GD ((2016) ) Tau PETpatterns mirror clinical and neuroanatomical variability in Alzheimer’s disease. Brain 139: , 1551–1567. |
[17] | Matsuda H , Shigemoto Y , Sato N ((2019) ) Neuroimaging of Alzheimer’s disease: Focus on amyloid and tau PET. Jpn J Radiol 37: , 735–749. |
[18] | Andersson C , Johnson AD , Benjamin EJ , Levy D , Vasan RS ((2019) ) 70-year legacy of the Framingham Heart Study. Nat Rev Cardiol 16: , 687–698. |
[19] | Veazie S, Gilbert J, Winchell KA, Paynter RA, Guise J-M (2019) Addressing social isolation to improve the health of older adults: A rapid review. (Prepared by Scientific Resource Center under Contract No. 290-2017-00003-C.) AHRQ Publication No. 19-EHC009-EF. Agency for Healthcare Research and Quality (US), Rockville (MD). |
[20] | Akhter-Khan SC , Tao Q , Ang TFA , Itchapurapu IS , Alosco ML , Mez J , Piers RJ , Steffens DC , Au R , Qiu WQ ((2021) ) Associations of loneliness with risk of Alzheimer’s disease dementia in the Framingham Heart Study. Alzheimers Dement 17: , 1619–1627. |
[21] | Donovan NJ , Wu Q , Rentz DM , Sperling RA , Marshall GA , Glymour MM ((2017) ) Loneliness, depression and cognitive function in older U.S. adults. Int J Geriatr Psychiatry 32: , 564–573. |
[22] | Tao Q , Akhter-Khan SC , Ang TFA , DeCarli C , Alosco ML , Mez J , Killiany R , Devine S , Rokach A , Itchapurapu IS , Zhang X , Lunetta KL , Steffens DC , Farrer LA , Greve DN , Au R , Qiu WQ ((2022) ) Different loneliness types, cognitive function, and brain structure in midlife: Findings from the Framingham Heart Study. eClinicalMedicine 53: , 101643. |
[23] | Hu J , Fitzgerald SM , Owen AJ , Ryan J , Joyce J , Chowdhury E , Reid CM , Britt C , Woods RL , McNeil JJ , Freak-Poli R ((2021) ) Social isolation, social support, loneliness and cardiovascular disease risk factors: A cross-sectional study among older adults. Int J Geriatr Psychiatry 36: , 1795–1809. |
[24] | Yu M , Sporns O , Saykin AJ ((2021) ) The human connectome in Alzheimer disease — relationship to biomarkers and genetics. Nat Rev Neurol 17: , 545–563. |
[25] | Fox MD ((2018) ) Mapping symptoms to brain networks with the human connectome. N Engl J Med 379: , 2237–2245. |
[26] | Smith SM , Jenkinson M , Woolrich MW , Beckmann CF , Behrens TEJ , Johansen-Berg H , Bannister PR , De Luca M , Drobnjak I , Flitney DE , Niazy RK , Saunders J , Vickers J , Zhang Y , De Stefano N , Brady JM , Matthews PM ((2004) ) Advances in functional and structural MR image analysis and implementation as FSL. Neuroimage 23: , S208–S219. |
[27] | Woolrich MW , Jbabdi S , Patenaude B , Chappell M , Makni S , Behrens T , Beckmann C , Jenkinson M , Smith SM ((2009) ) Bayesian analysis of neuroimaging data in FSL. Neuroimage 45: , S173–S186. |
[28] | Greve DN , Fischl B ((2009) ) Accurate and robust brain image alignment using boundary-based registration. Neuroimage 48: , 63–72. |
[29] | Gatchel JR , Donovan NJ , Locascio JJ , Schultz AP , Becker JA , Chhatwal J , Papp KV , Amariglio RE , Rentz DM , Blacker D , Sperling RA , Johnson KA , Marshall GA ((2017) ) Depressive symptoms and tau accumulation in the inferior temporal lobe and entorhinal cortex in cognitively normal older adults: A pilot study. J Alzheimers Dis 59: , 975–985. |
[30] | Salinas J , O’Donnell A , Kojis DJ , Pase MP , DeCarli C , Rentz DM , Berkman LF , Beiser A , Seshadri S ((2021) ) Association of social support with brain volume and cognition. JAMA Netw Open 4: , e2121122. |
[31] | Gottesman RF , Schneider AL , Zhou Y , Coresh J , Green E , Gupta N , Knopman DS , Mintz A , Rahmim A , Sharrett AR , Wagenknecht LE , Wong DF , Mosley TH ((2017) ) Association between midlife vascular risk factorsand estimated brain amyloid deposition. JAMA 317: , 1443–1450. |
[32] | Paul E , Bu F , Fancourt D ((2021) ) Loneliness and risk for cardiovascular disease: Mechanisms and future directions. Curr Cardiol Rep 23: , 68. |
[33] | Lee DC , Rizer J , Selenica ML , Reid P , Kraft C , Johnson A , Blair L , Gordon MN , Dickey CA , Morgan D ((2010) ) LPS- induced inflammation exacerbates phospho-tau pathology in rTg4510 mice. J Neuroinflammation 7: , 56. |
[34] | Kitazawa M , Oddo S , Yamasaki TR , Green KN , LaFerla FM ((2005) ) Lipopolysaccharide-induced inflammation exacerbates tau pathology by a cyclin-dependent kinase 5-mediated pathway in a transgenic model of Alzheimer’s disease. J Neurosci. 25: , 8843–8853. |
[35] | Griffin WS , Sheng JG , Roberts GW , Mrak RE ((1995) ) Interleukin-1 expression in different plaque types in Alzheimer’s disease: Significance in plaque evolution. J Neuropathol Exp Neurol 54: , 276–281. |
[36] | Huell M , Strauss S , Volk B , Berger M , Bauer J ((1995) ) Interleukin-6 is present in early stages of plaque formation and is restricted to the brains of Alzheimer’s disease patients. Acta Neuropathol 89: , 544–551. |
[37] | Palmqvist S , Schöll M , Strandberg O , Mattsson N , Stomrud E , Zetterberg H , Blennow K , Landau S , Jagust W , Hansson O ((2017) ) Earliest accumulation of β-amyloid occurs within thedefault-mode network and concurrently affects brain connectivity. Nat Commun 8: , 1214. |
[38] | Yokoi T , Watanabe H , Yamaguchi H , Bagarinao E , Masuda M , Imai K , Ogura A , Ohdake R , Kawabata K , Hara K , Riku Y , Ishigaki S , Katsuno M , Miyao S , Kato K , Naganawa S , Harada R , Okamura N , Yanai K , Yoshida M , Sobue G ((2018) ) Involvement of the precuneus/posterior cingulate cortex is significant for the development of Alzheimer’s disease: A PET (THK5351, PiB) and resting fMRI study. Front Aging Neurosci 10: , 304. |
[39] | Aghakhanyan G , Vergallo A , Gennaro M , Mazzarri S , Guidoccio F , Radicchi C , Ceravolo R , Tognoni G , Bonuccelli U , Volterrani D ((2018) ) The precuneus - a witness for excessive Aβ gathering inAlzheimer’s disease pathology. Neurodegener Dis 18: , 302–309. |
[40] | Therriault J , Benedet AL , Pascoal TA , Mathotaarachchi S , Savard M , Chamoun M , Thomas E , Kang MS , Lussier F , Tissot C , Soucy J-P , Massarweh G , Rej S , Saha-Chaudhuri P , Poirier J , Gauthier S , Rosa-Neto P , for the Alzheimer’s Disease Neuroimaging Initiative ((2021) ) APOEɛ4 potentiates the relationship between amyloid-β and tau pathologies. Mol Psychiatry 26: , 5977–5988. |
[41] | Layden EA , Cacioppo JT , Cacioppo S , Cappa SF , Dodich A , Falini A , Canessa N ((2017) ) Perceived social isolation is associated with altered functional connectivity in neural networks associated with tonic alertness and executive control. Neuroimage 145: , 58–73. |
[42] | Brilliant T D , Takeuchi H , Nouchi R , Yokoyama R , Kotozaki Y , Nakagawa S , Hanawa S , Sekiguchi A , Ikeda S , Sakaki K , Kawata KHdS , Nozawa T , Yokota S , Magistro D , Kawashima R ((2022) ) Loneliness inside of the brain: Evidence from a large dataset of resting-state fMRI in young adult. Sci Rep 12: , 7856. |
[43] | Maes M , Qualter P , Vanhalst J , Van den Noortgate W , Goossens L ((2019) ) Gender differences in loneliness across the lifespan: A meta– analysis. Eur J Pers 33: , 642–654. |
[44] | Borys S , Perlman D ((1985) ) Gender differences in loneliness. Pers Soc Psychol Bull 11: , 63–74. |


