
Reduction in Constitutively Activated Auditory Brainstem Microglia in Aging and Alzheimer’s Disease
Abstract
Background:
Alzheimer’s disease (AD) pathology is considered to begin in the brainstem, and cerebral microglia are known to play a critical role in AD pathogenesis, yet little is known about brainstem microglia in AD. Translocator protein (TSPO) PET, sensitive to activated microglia, shows high signal in dorsal brainstem in humans, but the precise location and clinical correlates of this signal are unknown.
Objective:
To define age and AD associations of brainstem TSPO PET signal in humans.
Methods:
We applied new probabilistic maps of brainstem nuclei to quantify PET-measured TSPO expression over the whole brain including brainstem in 71 subjects (43 controls scanned using 11C-PK11195; 20 controls and 8 AD subjects scanned using 11C-PBR28). We focused on inferior colliculi (IC) because of visually-obvious high signal in this region, and potential relevance to auditory dysfunction in AD. We also assessed bilateral cortex.
Results:
TSPO expression was normally high in IC and other brainstem regions. IC TSPO was decreased with aging (p = 0.001) and in AD subjects versus controls (p = 0.004). In cortex, TSPO expression was increased with aging (p = 0.030) and AD (p = 0.033).
Conclusions:
Decreased IC TSPO expression with aging and AD—an opposite pattern than in cortex—highlights underappreciated regional heterogeneity in microglia phenotype, and implicates IC in a biological explanation for strong links between hearing loss and AD. Unlike in cerebrum, where TSPO expression is considered pathological, activated microglia in IC and other brainstem nuclei may play a beneficial, homeostatic role. Additional study of brainstem microglia in aging and AD is needed.
INTRODUCTION
Microglia, the brain’s resident immune cell, are now recognized as playing a critical, early role in AD pathogenesis [1, 2]. Microglia in an “activated” state, traditionally considered pathological and evidence of neuroinflammation, can be visualized in vivo using positron emission tomography (PET) with radiotracers sensitive to the 18 KDa translocator protein (TSPO.) TSPO PET has demonstrated increased TSPO expression in cortical and subcortical cerebral regions in patients with AD and other disorders, as well as in normal aging [3–10].
Although not typically reported in publications, we have noticed over decades of disease-focused TSPO PET studies that that there is consistent, prominent TSPO PET signal in the brainstem in individual scans from both healthy controls and patients with various disorders. When whole-brain, within-group results are presented, a pattern of TSPO expression extending from diencephalon to brainstem is obvious (e.g., Extended Data Fig. 4 in Pascoal et al. [5]) with especially prominent signal in dorsal midbrain in the region of the inferior colliculi, a critical hub for early auditory processing.
The purpose of this project is to investigate, for the first time, brainstem TPSO PET signal in humans, and its possible associations with age and AD. This is important because the AD disease process is considered to start in the brainstem with tau deposition in locus coeruleus [11–13], so understanding the role of activated microglia in this region would be expected to provide much-needed insight into early AD pathogenesis.
In addition, the apparent location of peak TSPO PET signal in the region of inferior colliculi could be relevant to extremely strong links between auditory dysfunction and AD and other dementias [14–17]. The mechanisms linking hearing loss and AD are considered multifactorial and bi-directional, with social/emotional and biological etiologies, and dysfunction of both peripheral and central auditory systems. Based on the role of activated microglia in mediating neuroplasticity through synaptic stripping and remodeling [18], high TSPO PET signal in IC could reflect a neuroplastic response to peripheral hearing loss, which is inevitable with aging [19–21]. Microglial-mediated changes to central auditory structures in response to altered auditory input have been demonstrated in animal models [22–24].
These currently unlinked lines of evidence: 1) increasing recognition of a critical role for cerebral microglia in AD pathogenesis [1, 2], 2) strong, multifactorial links between auditory dysfunction and AD [14–16], 3) inevitable age-related peripheral auditory dysfunction and animal studies showing microglia involvement in auditory brainstem remodeling required by peripheral changes [22–24] motivated us to examine brainstem TSPO PET signal commonly seen in humans more closely. Specifically, we wanted to clarify the neuroanatomic localization of brainstem TSPO signal using recently-developed probabilistic maps of brainstem nuclei [25–27] and we wanted to assess associations with age and neurodegeneration. To assess age effects, we analyzed a dataset of healthy subjects (n = 43) ranging in age from 23–78 scanned using the first generation TSPO radiotracer 11C-PK11195 (PK). To assess the effect of AD, we analyzed a dataset consisting of age-matched subjects (n = 28) with and without AD scanned using the second generation TSPO radiotracer 11C-PBR28 (PBR28) [5]. We focused on inferior colliculi, a critical hub for early auditory processing. Our tentative hypothesis was that TSPO signal in IC would increase with normal aging and be greater in AD patients as compared to age-matched controls. As a comparator region, we also examined TSPO expression in cortex. Increased cortical TSPO expression is a common (though not universal [7]) finding in TSPO PET studies of aging and AD [5–10]. In exploratory analyses, we quantified age-related and AD vs control differences in TSPO expression and regional volume in all available atlas-defined cerebral and brainstem regions [25–27].
MATERIALS AND METHODS
PK PET subjects
Subjects (n = 43) underwent PK PET as healthy controls for several different studies conducted at Weill Cornell Medicine between 2013 and 2019. All subjects were cognitively normal and free from significant medical or neurologic disease including substance abuse. Common medical conditions in older subjects such as hypertension and hypercholesteremia, and medication to treat these conditions, were not exclusionary. No subjects were taking anti-inflammatory medication. All studies were approved by the Weill Cornel Medicine Institutional Review Board. All subjects provided informed consent to participate in a disease-focused research study and for their data to be included in a registry for future analyses such as this one. Age and sex effects in cerebrum (but not brainstem) in this dataset have been previously reported [3].
PBR28 PET subjects
Subjects (n = 28) underwent PBR28 PET between 2018 and 2019 as part of the Translational Biomarkers of Aging and Dementia (TRIAD) study conducted at McGill University. Subjects consisted of 20 cognitively normal controls and 8 subjects diagnosed with AD by a physician using accepted criteria. AD subjects had a positive amyloid-β PET scan and a CDR score between 0.5 and 2. Cognitively normal subjects had no objective cognitive impairment and a CDR score of 0. All subjects were free from significant medical or neurologic disease (other than AD). No subjects were taking anti-inflammatory medication. All subjects were high affinity binders based on Ala147Thr polymorphism of the TSPO gene (rs6971.) The study was approved by the Douglas Mental Health University Institute Research Ethics Board and written informed consent was obtained from all participants.
PK PET image acquisition
PET images were acquired over 1 h in list mode starting at the time of injection of of ∼500 MBq of 11C-PK11195 on a whole body Siemens Biograph PET-CT scanner. The axial field of view (FOV) was 16.2 cm. Using the ordered subset expectation maximization (OSEM) method provided by the manufacturer, list mode PET data were reconstructed into a 400×400 matrix with a voxel size of 1.02×1.02×2.03 mm3 and binned into 22 frames (four frames of 15 s each, then 4×30 s, 3×60 s, 2×120 s, 8×300 s, and 1×600 s). Reconstruction included attenuation correction based on CT and smoothing using a FWHM 4 mm Gaussian kernel. All frames were used in dynamic analysis. Additional PET acquisition details are available in other publications [3].
PBR28 PET image acquisition
PET images were acquired over 90 min in list mode after injection of ∼370 MBq of 11C-PBR28 on a Siemens high-resolution research tomograph. The axial field of FOV was 25.2 cm. Using the OSEM method provided by the manufacturer, list mode PET data were reconstructed into a 256×256 matrix with a voxel size of 1.22 mm isotropic and binned into 28 frames (4×10 s, 4×20 s, 3×40 s, 3×60 s, 4×120 s, 5×300 s, 5×600 s). Reconstruction included attenuation correction based on a 6-min transmission scan with a rotating 137Cs point source performed at the end of each PET emission acquisition, and smoothing using a FWHM 2 mm Gaussian kernel. Only the last 3 frames corresponding to 60–90 min post-injection were used in analysis. Additional PET acquisition details are available in other publications [5].
MRI acquisition
For the PK PET dataset, three-dimensional volumetric T1 weighted MR images were acquired using a GE Signa or Siemens 3T scanner. For the PBR PET dataset, a Siemens 3T TRIO scanner was used. Additional MRI acquisition details are available in other publications [3, 5].
PK PET image processing
PK PET images were motion corrected and linearly co-registered to MRI using MCFLIRT [28] within FSL [29]. Binding Potential (BPnd) images reflecting the concentration of TSPO expressed by activated microglia, irrespective of tracer delivery/blood flow, were generated from dynamic PET using a multilinear reference tissue model [3, 4, 30] implemented in the freely available software package FireVoxel (https://firevoxel.org.) The reference tissue time-activity curve was identified via optimized supervised cluster analysis (SVCA) [31]. This method identifies gray matter voxels to serve as the reference for modeling, since no brain region is devoid of PK binding to serve as a true anatomic reference region. We recorded the number of voxels in the reference region identified by SVCA for each subject. This is considered the optimal method for analyzing PK PET scans [32]. Each subject’s T1 MRI was linearly co-registered to his/her BPnd image with rigid body transformation in FSL.
PBR28 PET image processing
PBR PET images were processed (motion corrected, co-registered) as described above for PK PET scans. SUVr 60–90 min images were calculated using cerebellar gray matter as a pseudo-reference region. This method for quantifying PBR PET has been shown to provide accurate results as compared to fully quantitative modeling with invasive arterial input function [33].
Normal pattern of TSPO expression
To visualize the normal pattern of TSPO expression, MRI scans were warped to Montreal Neurologic Institute (MNI) standard space using Advanced Neuroimaging Tools [34]. MRI-derived normalization parameters were applied to co-registered PET images to bring them into standard space. Statistical Parametric Mapping [35] (SPM 12) was used to generate images corresponding to average TSPO expression in normal subjects in the PK and PBR28 datasets (separately.)
Regional TSPO PET quantification
TSPO expression (BPnd for PK, SUVr for PBR28) in the bilateral inferior colliculi ROI, as well as in other brainstem regions, was quantified using BrainstemNavigator [25–27], a probabilistic brainstem atlas based on histology (https://www.nitrc.org/projects/brainstemnavig.) Brainstem masks were thresholded at 50%. After warping each subject’s MRI to MNI standard space [34], the inverse warping fields were applied to the masks to quantify TSPO in each subject’s co-registered PET. Individual scans were reviewed in native space to ensure correct localization of brainstem and in particular inferior colliculi masks.
TSPO expression in the bilateral cortical ROI, as well as in other cerebral gray matter regions, was quantified using Freesurfer [36]. ROIs were defined on MRI and transformed to PET space using the inverse transformation matrix from the co-registration step. ROIs were eroded slightly (1 mm in cortex, 2 mm in subcortical regions in 2D) to minimize partial volume effects, in accord with prior studies [37–39].
MRI regional volume calculation
MRI volume of IC (and other brainstem regions) thresholded at 50% were quantified in subjects’ native space using BrainstemNavigator [25–27]. For normalization purposes, total intracranial volume (TICV) was measured using SPM [35].
Statistical methods
Analyses were performed using R and SPSS version 26. For normally-distributed variables (assessed via Shapiro-Wilk test) we assessed correlations using Pearson test and group differences using t-test and analysis of covariance. For non-normally distributed data, we either log-transformed the data or used nonparametric tests (Spearman for correlation; Mann-Whitney for group comparisons). All model assumptions were checked. Results in the inferior colliculi and cortex regions of a priori interest were considered significant at p < 0.05, uncorrected for multiple comparisons.
PK PET analyses
In the PK dataset, we assessed the correlation between age and regional PK BPnd in bilateral inferior colliculi and cortex. Fisher’s z test was used to determine if these correlations differed from each other.
We also assessed age correlations when controlling for potentially relevant biologic and methodologic variables. We performed separate partial correlation analyses controlling for the following variables: body mass index (BMI), a factor previously shown to affect TSPO PET results [10]; MRI-measured volumes (normalized by TICV) of the ROIs, since atrophy/partial volume effects could affect PET results; and the size (number of voxels) of the SVCA-generated reference region used to calculate PK BPnd.
PBR PET analyses
In the PBR dataset, possible age and BMI differences between AD subjects and controls were assessed using t-test.
Separate analyses of (co)variance were used to compare PBR SUVr in bilateral inferior colliculi and cortex between AD subjects and controls.
This group comparison was also performed when covarying for age and for the potentially relevant biologic and methodologic variables described above for PK PET analyses: BMI and MRI-measured regional volume (SVCA was not used for PBR PET).
MRI volumetric analyses
For MRI volumetric analysis, we combined across the two datasets since there were no significant acquisition differences. In normal subjects (n = 63), we assessed the partial correlation (controlling for TICV) between age and inferior colliculi volume (based on 50% thresholded probabilistic mask) and cortex volume. Using ANCOVA we compared inferior colliculi and cortex volume between AD subjects (n = 8) and controls (n = 63) while controlling for age and TICV.
Exploratory analyses in additional brain regions
We report results of exploratory analyses outside the inferior colliculi and cortical ROIs. This includes 39 additional Brainstem Navigator-defined bilateral or midline regions (listed at nitrc.org/projects/brainstemnavig) and 6 Freesurfer-defined bilateral subcortical regions (amygdala, hippocampus, globus pallidus, thalamus, caudate and putamen). Results of exploratory analyses were considered significant at p < 0.05, corrected for multiple comparisons using Bonferroni method.
RESULTS
Subject demographics
Subject demographics are presented in Table 1. In the PBR dataset, AD and control subjects did not differ significantly by age (t = 0.783, p = 0.452) or BMI (t = 0.743, p = 0.464). One AD subject had CDR = 2, three had CDR = 1, and the rest had CDR = 0.5.
Table 1
Subject Demographics
| Age | Sex (% female) | Aβ+ | E4+ | BMI | |
| PK Control (n = 43) | 55.0 (23–78; sd 15.9) | 44% F | Not assessed | Not assessed | 26.7 (18.6–37.5, sd 4.3) |
| PBR28 Control (n = 20) | 73.4 (65.3–85.7; sd 5.5) | 75% F | 2 (10%) | 4 (20%) | 25.8 (17.3–32.8, sd 3.7) |
| PBR28 AD (n = 8) | 71.0 (57.1–78.6; sd 7.8) | 62.5% F | 8 (100%) | 2 (25%) | 24.5 (17.2–31.0, sd 4.5) |
Normal pattern of brainstem TSPO expression
Figure 1 shows the normal, group average pattern of TSPO expression obtained using both PK and PBR28 PET, with prominent signal in dorsal midbrain colliculi. High signal is also present diffusely in brainstem. MNI coordinates of regions of peak signal within these regions are presented in Table 2. Brainstem regions appear to correspond to multiple nuclei of the reticular formation.
Fig. 1
Normal, whole-brain pattern of TSPO expression measured using PET. Group average TSPO PET images in MNI space are overlaid onto T1 template MRI. A) PK PET BPnd in 43 healthy subjects. B) PBR28 PET SUVr in 20 healthy subjects. Note prominent high signal in dorsal midbrain colliculi (circled on sagittal view) using both TSPO tracers. High signal is also visible in thalamus and diffusely in midbrain, pons and medulla. MNI coordinates of regions of peak signal are presented in Table 2. Brainstem regions of high signal appear to correspond to multiple nuclei of the reticular formation.
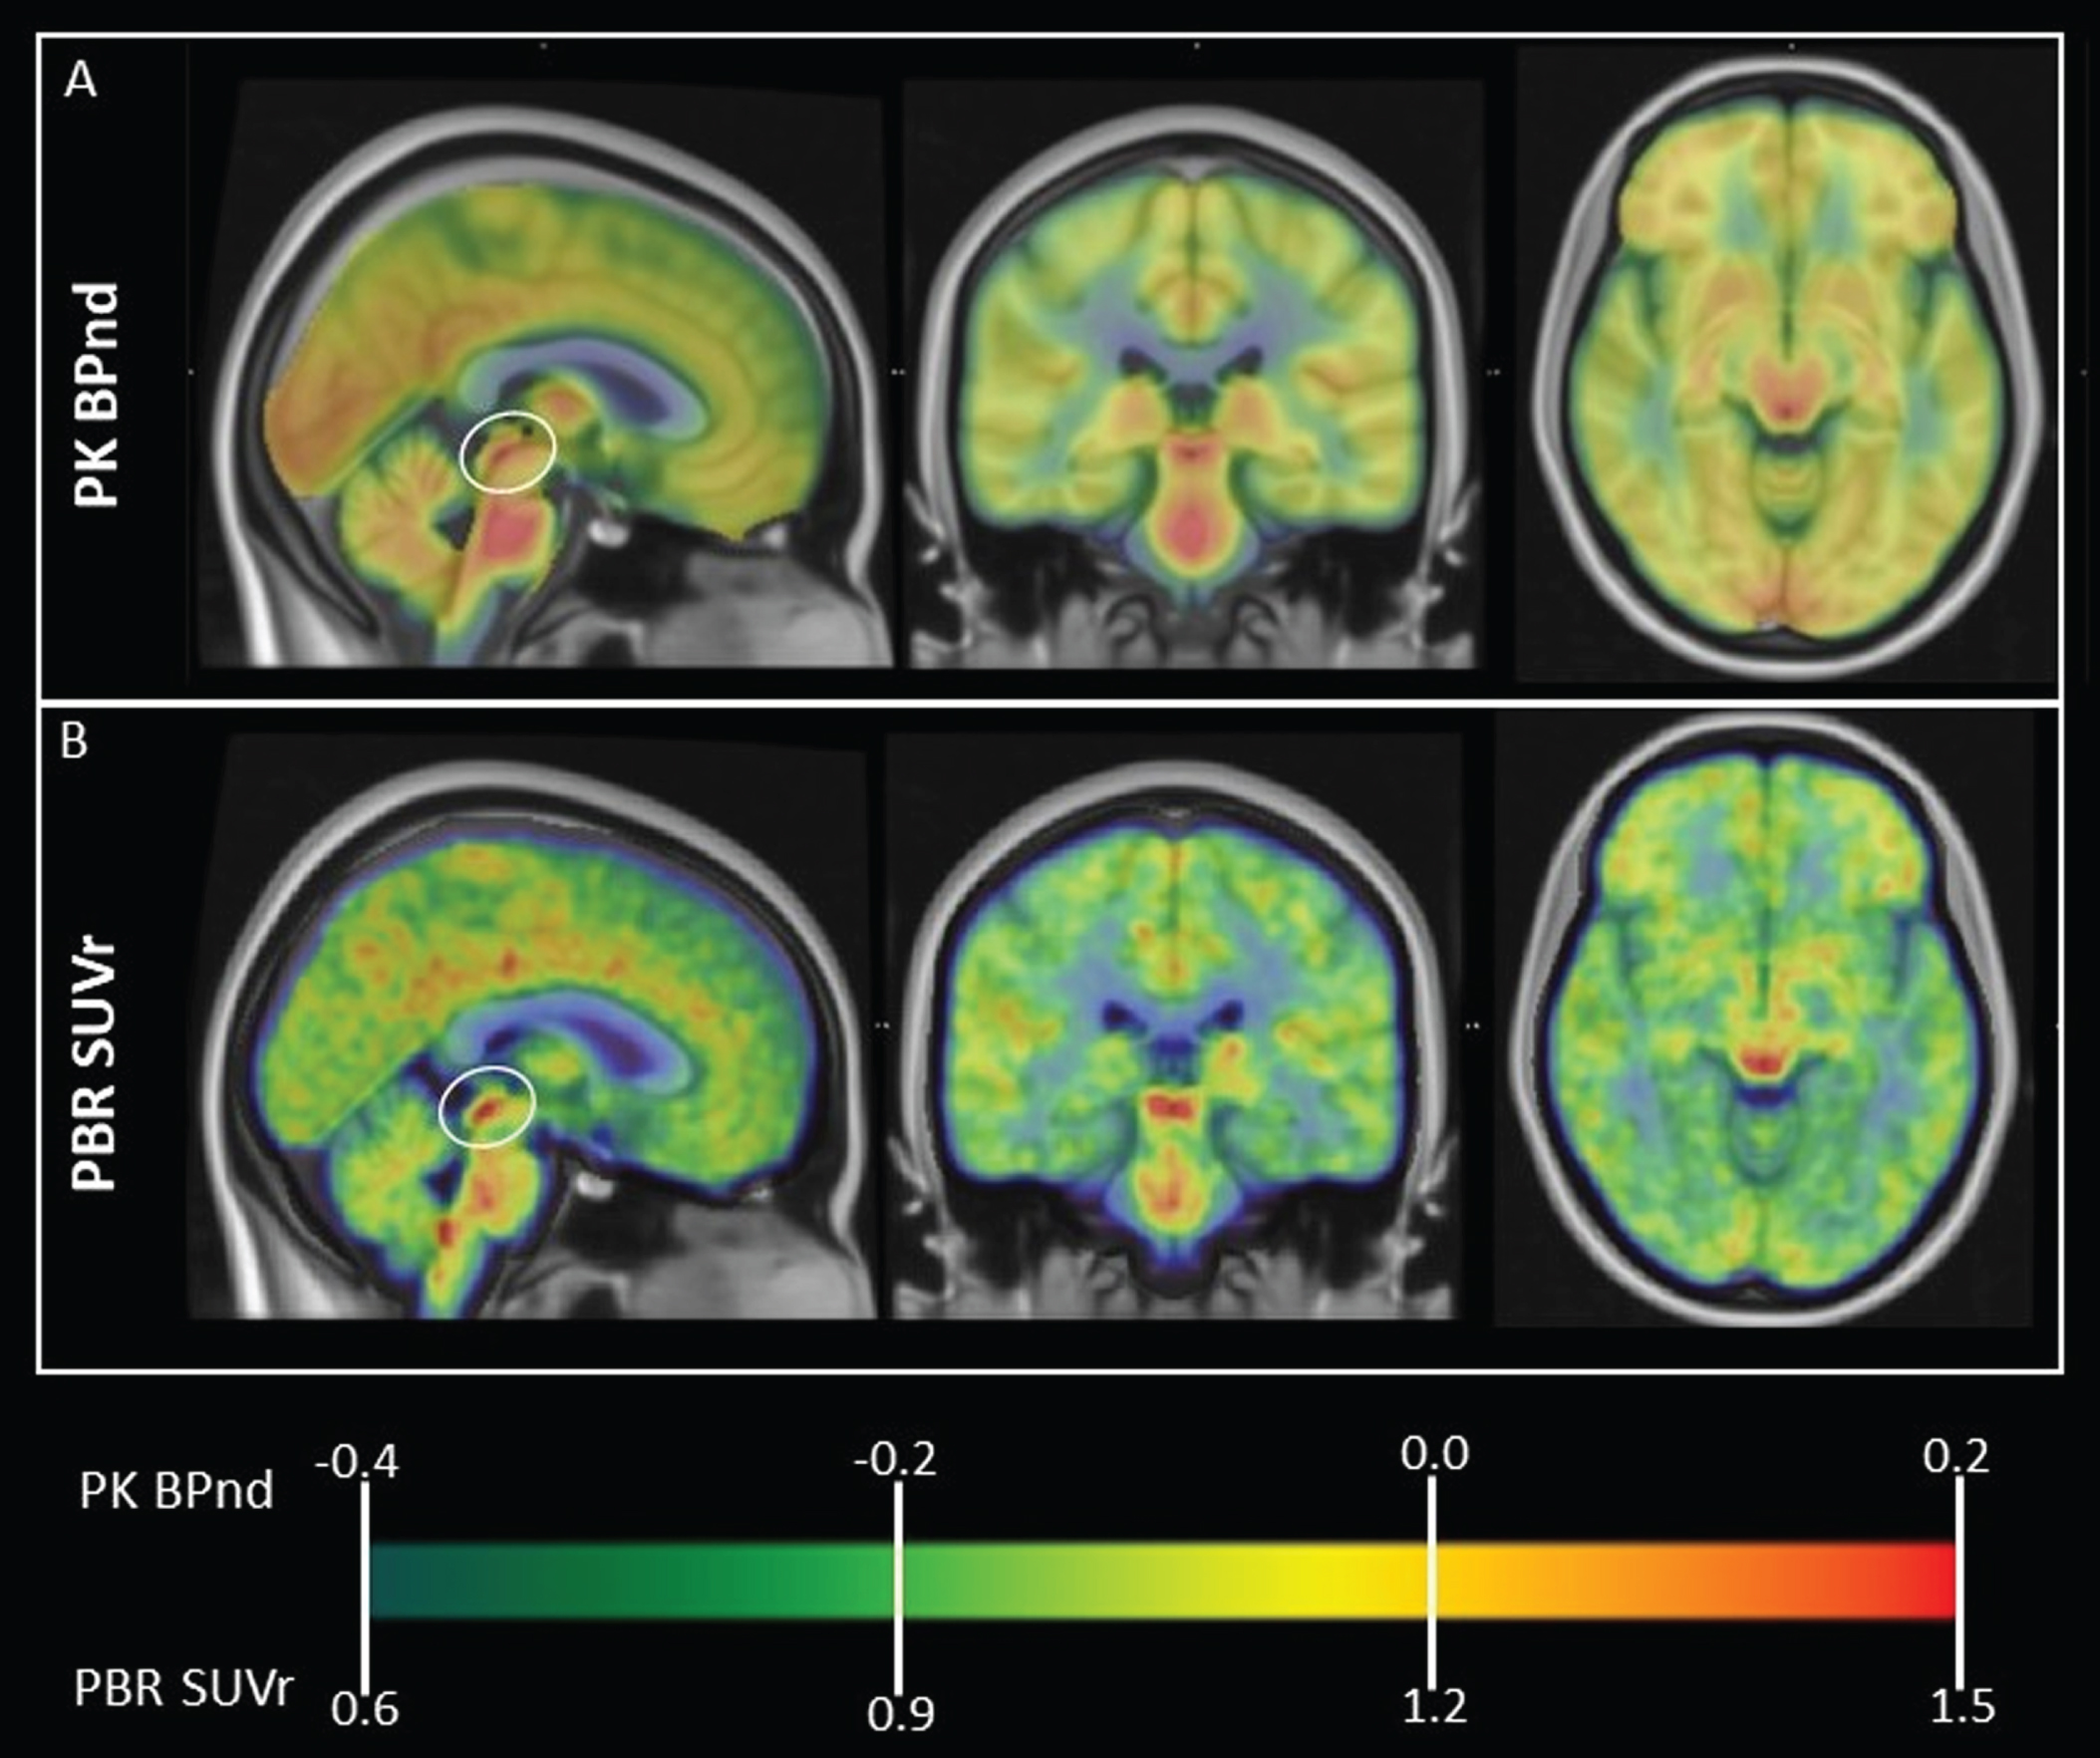
Table 2
Regions of normally high TSPO expression in human brain based on 43 normal subjects scanned using 11C-PK11195 (PK) and 20 normal subjects scanned using 11C-PBR28 (PBR). MNI coordinates of local maxima based on averaged scan data are provided
| Region | MNI coordinates (x,y,z); peak signal value | |
| PK (BPnd) | PBR (SUVr) | |
| midbrain collicular region* | 5 –28 –5; 0.20 | 7 –27 –5; 1.68 |
| pons | 1 –32 –33; 0.27 | 1 –30 –37; 1.51 |
| medulla | # | 2 –43 –44; 1.59 |
| thalami | 12 –16 9; 0.33–12 –20 8; 0.28 | 13 –14 7; 1.63–8 –21 5; 1.63 |
*Signal in this region included superior and inferior colliculi and cuneiform nuclei. Coordinates of peak TSPO PET signal specifically within the inferior colliculi region of interest were x = –4, y = –33, z = –8 (PK) and x = –4, y = –34, z = –9 (PBR.) #No distinct peak in medulla was discernible in the PK dataset, possibly due to lower scan resolution.
TSPO expression in inferior colliculi and cortex: effects of age and AD
PK PET results
In the PK PET dataset, as shown in Fig. 2, TSPO expression (BPnd) decreased with age in inferior colliculi (rho=–0.479, p = 0.001), but increased with age in cortex (rho = 0.331, p = 0.030). Fisher’s Z test showed that these two correlations differed significantly from each other (z = –0.558, p < 0.001).
Fig. 2
Opposite patterns of age-correlated TSPO expression/microglial activation (PK PET BPnd) in inferior colliculi and cortex in 43 healthy subjects. A) TSPO expression in inferior colliculi decreased with increasing age (rho = –0.479, p = 0.001). This is a novel finding. B) TSPO expression in cortex increased with increasing age (rho = 0.331, p = 0.030). This is in accord with multiple prior studies [8–10].
![Opposite patterns of age-correlated TSPO expression/microglial activation (PK PET BPnd) in inferior colliculi and cortex in 43 healthy subjects. A) TSPO expression in inferior colliculi decreased with increasing age (rho = –0.479, p = 0.001). This is a novel finding. B) TSPO expression in cortex increased with increasing age (rho = 0.331, p = 0.030). This is in accord with multiple prior studies [8–10].](https://content.iospress.com:443/media/jad/2024/99-1/jad-99-1-jad231312/jad-99-jad231312-g002.jpg)
Results in IC were unchanged when including BMI (rho = –0.464, p = 0.002), IC volume (rho = –0.477, p = 0.001) or the number of voxels in the SVCA reference region (rho = –0.482, p = 0.001) as covariates.
Results in cortex were similar when including BMI as a covariate (rho = 0.349, p = 0.024) but were weakened when covarying for cortical volume (rho = 0.293, p = 0.059) or the number of voxels in the SVCA reference region (rho = 0.273, p = 0.080). Notably, there was an inverse correlation between subject age and reference region volume such that older subjects had fewer voxels in the reference region (rho = –0.539, p < 0.001).
PBR PET results
In the PBR28 dataset, as shown in Fig. 3, inferior colliculi SUVr (which was non-normally distributed and was log-transformed for analysis) was found to be lower in AD subjects as compared to controls (AD mean = 0.82, sd = 0.18; control mean = 1.15, sd = 0.33; F(1,26) = 9.87, p = 0.004). Cortical SUVr was greater in AD subjects as compared to controls (AD mean = 1.15, sd = 0.094; control mean = 1.08, sd = 0.064; F(1,26) = 5.08, p = 0.033).
Fig. 3
Bar plot showing opposite patterns of TSPO expression/microglial activation (PBR PET SUVr) in inferior colliculi and cerebral cortex in 8 AD subjects versus 20 healthy controls. In inferior colliculi, TSPO expression was lower in AD subjects as compared to controls (p = 0.004). This is a novel finding. In cerebral cortex, TSPO expression was greater in AD subjects as compared to controls (p = 0.04). This is in accord with several prior studies [5–7]. PBR PET SUVr is calculated over bilateral regions. Error bars = 95% confidence intervals.
![Bar plot showing opposite patterns of TSPO expression/microglial activation (PBR PET SUVr) in inferior colliculi and cerebral cortex in 8 AD subjects versus 20 healthy controls. In inferior colliculi, TSPO expression was lower in AD subjects as compared to controls (p = 0.004). This is a novel finding. In cerebral cortex, TSPO expression was greater in AD subjects as compared to controls (p = 0.04). This is in accord with several prior studies [5–7]. PBR PET SUVr is calculated over bilateral regions. Error bars = 95% confidence intervals.](https://content.iospress.com:443/media/jad/2024/99-1/jad-99-1-jad231312/jad-99-jad231312-g003.jpg)
AD versus control differences in IC remained significant when controlling for age (F[1,25] = 9.89, p = 0.004), BMI (F[1,24] = 10.09, p = 0.004), IC volume (F[1,25] = 10.38, p = 0.004) or when one subject with severe dementia (CDR = 2) was excluded (F[1,25] = 10.09, p = 0.004).
Results in cortex were similar when controlling for age (F[1,25] = 4.70, p = 0.040) or BMI (F[1,24] = 5.23, p = 0.03) or excluding the subject with severe dementia (F[1,25] = 6.4, p = 0.018) but were slightly weakened when controlling for cortical volume (F[1,25] = 3.9, p = 0.059).
MRI volumetric results in IC and cortex
IC volume was uncorrelated with age in controls (n = 63; R = –0.132, p = 0.31; analysis controlled for TICV) and did not differ between AD subjects and controls when controlling for age and TICV (AD: 72.38 ml, sd = 13.8; control: 71.94 ml, sd = 10.20; F[1,67] = 0.586, p = 0.45).
Cortical volume was significantly inversely correlated with age in controls (R = –0.639, p < 0.001; analysis controls for ICV) and significantly lower in AD subjects as compared to controls when controlling for age and TICV (AD: 343.17 ml, sd = 79.89; control: 412.68 ml, sd = 46.19; F[1,67] = 44.48, p < 0.001).
Exploratory results in additional brain regions
Table 3 lists additional brain regions in which there was a correlation (positive or negative) between PK PET BPnd and age at an uncorrected p < 0.05 threshold. No results were statistically significant after correction for multiple comparisons. Notably, negative correlations (decreasing TSPO with increasing age) were found in superior colliculi and caudate. Positive correlations were found in hippocampi, globus pallidus and subthalamic nuclei.
Table 3
Results of exploratory analysis showing all brain gray matter regions in which there was a correlation (positive or negative) between TSPO expression/microglial activation (PK PET BPnd) and age in 43 healthy subjects at an uncorrected p < 0.05 threshold
| Region | Spearman rho | p |
| Superior colliculi | –0.426 | 0.004 |
| Cuneiform nuclei# | –0.331 | 0.030 |
| Caudate+ | –0.390 | 0.010 |
| subthalamic nuclei* | 0.334 | 0.029 |
| hippocampi | 0.322 | 0.035 |
| Globus pallidus | 0.360 | 0.018 |
#Cuneiform nuclei, little studied in humans, are small nuclei adjacent and medial to inferior and superior colliculi. Cuneiform PET signal may reflect spillover from strong signal within colliculi. *Similar results were found in subthalamic subregions. Note that subthalamic nuclei are diencephalic regions included in the BrainstemNavigator atlas. +One subject was found to have abnormally high signal in caudate as well as pallidum and putamen (>5 SD above mean.) Excluding this subject did not significantly change results in regions of interest or exploratory regions.
In the AD versus control comparison, one additional region, superior colliculi, showed between-group differences. AD subjects had lower PBR SUVr than controls (AD median = 0.90, control median = 1.17, U = 38.0, uncorrected p = 0.033.) However, this result was not significant after correction for multiple comparisons.
MRI volumetric results in exploratory brainstem and diencephalic regions
Average regional volumes based on 50% probability masks from BrainstemNavigator are presented in Supplementary Table 1.
DISCUSSION
Using TSPO PET sensitive to activated microglia and recently-developed probabilistic maps of brainstem nuclei, we found high TSPO expression in healthy subjects in midbrain inferior colliculi, critical for early auditory sensory processing, as well as in several additional brainstem regions. With aging, and in AD subjects as compared to controls, we found significantly decreased TSPO expression in inferior colliculi. These results remained significant when covarying for MRI-measured IC volume (which was unaffected by age or AD status) indicating that PET results are not due to atrophy/partial volume effects. This first demonstration of abnormal TSPO expression in brainstem auditory nuclei in AD implicates this region in a biological explanation for extremely strong links between hearing loss and AD [14–16], in accord with study hypotheses. Similar results in superior colliculi, important for early visual processing, may be relevant to understanding associations between visual loss and dementia [40].
However, while we confirmed our a priori hypothesis of abnormal microglial activation in inferior colliculi in AD, our results were not in the expected direction. Nearly all prior TSPO PET studies show increased rather than decreased cerebral microglial activation with aging, AD or other disease [3–10]. We also demonstrate this: we found significantly greater TSPO expression in bilateral cortex with aging, and in AD subjects versus controls. Microglia are generally considered to maintain a resting state until activated by damage or other stimuli, and microglial activation/TSPO expression is traditionally viewed as pathological. Current results in cortex (and several subcortical cerebral regions) of increased TSPO expression with increasing age, and in AD subjects versus controls, replicate multiple prior studies [5–10], and can be understood as reflecting/mediating age and disease-related microglial activation and detrimental neuroinflammation. Other studies have directly linked TSPO-PET measured microglial activation and neurodegeneration [5]. However, understanding our finding of normally-high TSPO expression in inferior (and superior) colliculi that is reduced with aging and AD, requires consideration of microglial phenotypic complexity and regional heterogeneity that is beginning to be appreciated based on tissue studies [41–47] but has received little attention in human TSPO PET studies. While microglial phenotypes are often dichotomized into “good” (fighting infection, clearing debris, maintaining homeostasis, mediating neuroplasticity after injury) and “bad” (damaging neurons through inflammatory cytokines, blocking neurogenesis), current results showing opposite patterns of TSPO expression with aging and AD in sensory brainstem nuclei versus cortex add to growing evidence that this dichotomy is a significant oversimplification [2], and highlight increasingly recognized phenotypic and functional heterogeneity in microglia across different brain regions [41–48].
Our demonstration of normal, high levels of TSPO expression in several subcortical and brainstem regions suggests that constitutively activated microglia in these regions is a normal phenomenon, unrelated to damage or disease. High TSPO expression in these brainstem regions is a robust finding that has been observed in individual scans and within-group average images in many prior studies, but to our knowledge has not previously been quantified or interpreted. As shown in Fig. 1, in addition to a prominent focus of high TSPO signal in the midbrain collicular region of interest, high TSPO signal is apparent in bilateral thalami extending diffusely through midbrain, pons and medulla, most prominently in midline, dorsal regions which appear to correspond to multiple nuclei of the reticular formation. The reticular formation is a complex network of nuclei dispersed throughout the brainstem that serves as an integration and relay center for multiple vital brain systems [49]. We did not detect age- or disease-related TSPO alterations in the region of the reticular formation as we did in inferior colliculi and cortex. While this could of course be due to our limited sample size and/or the limited resolution of PET, with different age/disease associations in adjacent small nuclei potentially canceling each other out, an intriguing possibility is that that in humans, as in several animal models [45, 46], constitutively-activated microglia in the evolutionarily-conserved reticular formation (essential for wakefulness, motor, autonomic and other functioning) serve to maintain neuronal circuity essential for survival.
More research into the role of under-studied brainstem microglia in aging and AD is clearly needed to confirm, to extend and to provide a mechanistic explanation for our results. One possible explanation for the unusual pattern of TSPO expression in inferior (and superior) colliculi (normally high expression that decreases with aging and AD) may relate to a relatively unique feature of brainstem sensory nuclei: that that they have prominent perineuronal nets (PNN). PNNs are a specialized part of the extracellular matrix considered neuroprotective [50]. They serve to stabilize synapses and are required for optimal functioning of rapid spiking sensory neurons [51]. They are also protective against protein deposition in AD [52]. PNN increase with age, and while this may protect neurons from oxidative stress and other age-related damage, it has been posited to account for decreasing neuroplasticity with aging [53]. This role of PNN in preserving and stabilizing synapses [18] directly opposes the role of activated microglia in sculpting and stripping synapses to mediate neuroplasticity [18–21], and there is evidence for a reciprocal relationship between microglia and PNN in AD: activated microglia cause PNN loss in late stages of AD [54, 55], and PNN components may inhibit microglial functioning in the earliest stages of AD [56]. It is plausible that our finding of reduced microglial activation in brainstem sensory nuclei with aging and AD reflects dysregulated PNN/microglia interactions in these regions and contributes to a biologic explanation for strong associations between auditory (and visual) impairments and AD. It is also possible that dysregulated PNN-microglial interactions in sensory nuclei may be relevant to AD pathogenesis more broadly. Specifically, we wonder if dysregulated PNN-microglial interactions in sensory nuclei with strong PNN may prevent microglia from their critical job clearing debris, amyloid and tau [1], allowing these toxic proteins to begin accumulation in adjacent, non-sensory midbrain nuclei lacking PNN. In particular, the nearby locus coeruleus lacks a PNN, and this is considered an explanation for its early vulnerability to tau accumulation that starts the course of AD [52].
Although not statistically significant after correction for multiple comparisons, exploratory results showing increasing TSPO expression with increasing age in globus pallidus, subthalamic nuclei and hippocampi match the pattern seen in cortex, and are broadly in accord with prior studies [5–10]. Our finding of decreasing TSPO expression with aging in caudate was unexpected, and requires replication. However, it does fit with a recent, also unexpected finding that activated microglia in caudate in human autopsy specimens were associated with preserved cognition and less AD neuropathology, an opposite pattern than seen in cortex [48], again emphasizing the importance of regional heterogeneity in microglia phenotype and function in aging and AD.
Limitations
A limitation of this study is that we do not have information about auditory function in these subjects beyond knowing that their hearing was adequate for verbal communication. Future studies assessing TSPO expression within brain auditory networks longitudinally and in association with carefully measured hearing and perhaps brainstem auditory evoked responses will be important to clarify the mechanisms and significance of our finding of aberrant microglial activation in inferior colliculi in association with aging and AD.
Studying brainstem nuclei using PET is challenging. Many brainstem structures are below the resolution of PET. We used new probabilistic brainstem masks based on histology [25–27] to identify inferior colliculi (and other brainstem nuclei), and visually inspected mask accuracy in individual subjects. We thresholded masks at 50%, which is stricter than used in other studies [57] and helped to minimize partial volume effects, allowing sampling of a small but anatomically accurate core of the region. Including the volume of the IC (which did not differ between AD subjects and controls) as a covariate in analysis did not affect our results, further decreasing the likelihood that partial volume effects drove our results. Still, additional investigation using brainstem-focused neuroimaging, high resolution scanners [58], animal models and/or human tissue will be needed to increase confidence in localization of TSPO signal within the brainstem.
Our sample size, especially for AD subjects, is quite small, and we do not have any AD subjects scanned using the PK radiotracer. We were not able to combine the two TSPO PET datasets analyzed in this study due to different tracer properties, scanner acquisition parameters and (necessarily) different image processing/analysis methods. The limitations of small sample size and different methodologies are related: if methods analogous to the centilloid scale for amyloid PET could be developed for TSPO PET, this would allow larger scale studies that could improve understanding of the role of activated microglia in aging and AD.
Our use of the first generation TSPO radiotracer PK11195, with lower signal-to-noise properties than second generation tracers [7] can be considered a limitation. Because there is no brain region devoid of PK binding under normal conditions, the optimal method for analyzing PK PET requires a statistically-defined (rather than anatomic) reference region to quantify TSPO expression as BPnd [32]. We found that the number of voxels in this reference region was affected by age, with significantly smaller reference regions in older subjects. Although not previously reported, this correlation is not unexpected, as brain inflammation/TSPO expression is known to increase diffusely with aging, reducing the amount of “normal” brain available to serve as a reference region. Still, a smaller reference region in older subjects has the potential to affect results, and in fact we found that including the volume of the reference region as a covariate in analysis weakened results in cortex. This methodologic issue will be important to consider in future studies of aging using SVCA for PET analysis. However, the novel result of this study—the inverse correlation of age with inferior colliculus PK BPnd—was robust and not affected by the size of the reference region (nor by IC volume or subject BMI). In addition, convergent results using two different TSPO tracers supports reliability of results in this study.
It is a limitation of this and all TSPO PET studies that TSPO is expressed by several cell types in the brain in addition to microglia. This includes astrocytes, endothelial cells in blood vessels, infiltrating macrophages and possibly neurons [59]. TSPO PET cannot differentiate among these cell types. Newer, non-TSPO microglial tracers under development may in the future clarify the cellular source of the TSPO signal in vivo in humans. Ultimately, neuropathological investigation of human tissue is needed to confirm and extend our results in terms of the cellular source of PET signal, as well the precise neuroanatomic localization within the brainstem. We hope that current results will motivate greater attention to inferior colliculi and other brainstem regions in human tissue studies of aging and AD.
Conclusion
We demonstrate using PET that TSPO expression, considered to reflect activated microglia, is normally high in several brainstem regions, and decreases significantly with aging and AD in midbrain inferior colliculi. These results implicate aberrant microglial functioning in auditory brainstem in a biological explanation for extremely strong links between hearing loss and AD [14–16]. Similar results in superior colliculi, important for early visual processing, may be relevant to understanding associations between visual loss and dementia [40]. Because auditory and visual impairments are inevitable with aging, but often remediable, understanding these links could have near-term relevance for AD prevention and treatment strategies.
Our novel finding of normal, constitutive TSPO expression in brainstem, with age- and AD-related decreases in sensory nuclei, contrasts with our (expected) findings in cortex, where microglial activation increased with aging and AD, in accord with multiple prior TSPO PET studies [5–10]. These results highlight complexities and regional heterogeneity in microglial phenotype that are beginning to be studied in animal models and ex vivo tissue studies [41–47], but have not previously been considered in human TSPO PET imaging studies.
This first demonstration of age and AD-related microglial abnormalities in brainstem, in combination with longstanding evidence that AD pathology may begin in the brainstem (with tau deposition in locus coeruleus [11, 13]) and mounting evidence that microglial dysfunction in cortex and hippocampus is pathophysiologically critical in AD [1, 2], provides strong motivation for additional study of brainstem microglia in aging and AD. Future studies in animal models and human tissue could investigate the intriguing possibility that dysregulated interactions between microglia and strong extracellular matrix PNN surrounding and protecting brainstem sensory nuclei underly both early sensory dysfunction in AD, and the inception of the AD pathogenic process in adjacent brainstem nuclei whose lack of PNN make them highly vulnerable to protein deposition [52].
AUTHOR CONTRIBUTIONS
Tracy Butler (Conceptualization; Formal analysis; Funding acquisition; Methodology; Writing – original draft; Writing – review & editing); Xiuyuan Wang (Formal analysis; Methodology; Writing – review & editing); Gloria Chiang (Writing – review & editing); Ke Xi (Formal analysis; Methodology; Writing – review & editing); Lidia Glodzik (Writing – review & editing); Liangdong Zhou (Formal analysis; Methodology; Writing – review & editing); Yi Li (Writing – review & editing); Qolamreza Ray Razlighi (Formal analysis; Methodology; Writing – review & editing); Seyed Hani Hojjati (Writing – review & editing); Ilker Ozsahin (Writing – review & editing); Sumit Niogi (Writing – review & editing); Xiangling Mao (Data curation; Project administration; Writing – review & editing); Thomas Maloney (Data curation; Project administration; Writing – review & editing); Emily Tanzi (Data curation; Writing – review & editing); Nesrine Rahmouni (Data curation; Writing – review & editing); Cécile Tissot (Data curation; Writing – review & editing); Firoza Lussier (Data curation; Writing – review & editing); Sudhin Shah (Writing – review & editing); Dikoma Shungu (Data curation; Funding acquisition; Project administration; Writing – review & editing); Ajay Gupta (Data curation; Funding acquisition; Writing – review & editing); Mony De Leon (Writing – review & editing); P. David Mozley (Data curation; Funding acquisition; Writing – review & editing); Tharick Pascoal (Data curation; Writing – review & editing); Pedro Rosa-Neto (Data curation; Funding acquisition; Writing – review & editing).
ACKNOWLEDGMENTS
The authors have no acknowledgments to report.
FUNDING
Research at Weill Cornell was supported by the following National Institutes of Health grants: K23NS057579, R01AG057681, R01NS092802, R01AG072753, R56AG064873, U54NS105541 and U.S. Department of Defense grant W81XWH-15-1-0437.
TRIAD is supported by the Weston Brain Institute, Canadian Institutes of Health Research (CIHR) [MOP-11-51-31; RFN 152985, 159815, 162303], Canadian Consortium of Neurodegeneration and Aging (CCNA; MOP-11-51-31 -team 1), the Alzheimer’s Association [NIRG-12-92090, NIRP-12-259245], Brain Canada Foundation (CFI Project 34874; 33397), the Fonds de Recherche du Qu bec – Sant (FRQS; Chercheur Boursier, 2020-VICO-279314). Colin J. Adair Charitable Foundation.
CONFLICT OF INTEREST
The authors report no conflicts of interest.
DATA AVAILABILITY
The data supporting the findings of this study are available on request from the corresponding author and execution of a data transfer agreement with the authors’ institutions. The data are not publicly available due to privacy or ethical restrictions.
SUPPLEMENTARY MATERIAL
[1] The supplementary material is available in the electronic version of this article: https://dx.doi.org/10.3233/JAD-231312.
REFERENCES
[1] | Leng F , Edison P ((2021) ) Neuroinflammation and microglial activation in Alzheimer disease: Where do we go from here? Nat Rev Neurol 17: , 157–172. |
[2] | Salter MW , Stevens B ((2017) ) Microglia emerge as central players in brain disease. Nat Med 23: , 1018–1027. |
[3] | Butler T , Glodzik L , Wang XH , Xi K , Li Y , Pan H , Zhou L , Chiang GC , Morim S , Wickramasuriya N , Tanzi E , Maloney T , Harvey P , Mao X , Razlighi QR , Rusinek H , Shungu DC , de Leon M , Atwood CS , Mozley PD ((2022) ) Positron emission tomography reveals age-associated hypothalamic microglial activation in women. Sci Rep 12: , 13351. |
[4] | Butler T , Li Y , Tsui W , Friedman D , Maoz A , Wang X , Harvey P , Tanzi E , Morim S , Kang Y , Mosconi L , Talos D , Kuzniecky R , Vallhabjosula S , Thesen T , Glodzik L , Ichise M , Silbersweig D , Stern E , de Leon MJ , French J ((2016) ) Transient and chronic seizure-induced inflammation in human focal epilepsy. Epilepsia 57: , e191–194. |
[5] | Pascoal TA , Benedet AL , Ashton NJ , Kang MS , Therriault J , Chamoun M , Savard M , Lussier FZ , Tissot C , Karikari TK ((2021) ) Microglial activation and tau propagate jointly across Braak stages. Nat Med 27: , 1592–1599. |
[6] | Cagnin A , Brooks DJ , Kennedy AM , Gunn RN , Myers R , Turkheimer FE , Jones T , Banati RB ((2001) ) In-vivo measurement of activated microglia in dementia. Lancet 358: , 461–467. |
[7] | Kreisl WC , Kim MJ , Coughlin JM , Henter ID , Owen DR , Innis RB ((2020) ) PET imaging of neuroinflammation in neurological disorders. Lancet Neurol 19: , 940–950. |
[8] | Kumar A , Muzik O , Shandal V , Chugani D , Chakraborty P , Chugani HT ((2012) ) Evaluation of age-related changes in translocator protein (TSPO) in human brain using (11)C-[R]-PK11195 PET. J Neuroinflammation 9: , 232. |
[9] | Paul S , Gallagher E , Liow JS , Mabins S , Henry K , Zoghbi SS , Gunn RN , Kreisl WC , Richards EM , Zanotti-Fregonara P , Morse CL , Hong J , Kowalski A , Pike VW , Innis RB , Fujita M ((2019) ) Building a database for brain 18kDa translocator protein imaged using [(11)C]PBR28 in healthy subjects. J Cereb Blood Flow Metab 39: , 1138–1147. |
[10] | Tuisku J , Plavén-Sigray P , Gaiser EC , Airas L , Al-Abdulrasul H , Brück A , Carson RE , Chen M-K , Cosgrove KP , Ekblad L ((2019) ) Effects of age, BMI and sex on the glial cell marker TSPO—A multicentre [11 C] PBR28 HRRT PET study. Eur J Nucl Med Mol Imaging 46: , 2329–2338. |
[11] | Braak H , Thal DR , Ghebremedhin E , Del Tredici K ((2011) ) Stages of the pathologic process in Alzheimer disease: Age categories from 1 to 100 years. J Neuropathol Exp Neurol 70: , 960–969. |
[12] | Parvizi J , Van Hoesen GW , Damasio A ((2001) ) The selective vulnerability of brainstem nuclei to Alzheimer’s disease. Ann Neurol 49: , 53–66. |
[13] | Rub U , Stratmann K , Heinsen H , Turco DD , Seidel K , Dunnen W , Korf HW ((2016) ) The brainstem tau cytoskeletal pathology of Alzheimer’s disease: A brief historical overview and description of its anatomical distribution pattern, evolutional features, pathogenetic and clinical relevance. Curr Alzheimer Res 13: , 1178–1197. |
[14] | Johnson JCS , Marshall CR , Weil RS , Bamiou DE , Hardy CJD , Warren JD ((2021) ) Hearing and dementia: From ears to brain. Brain 144: , 391–401. |
[15] | Griffiths TD , Lad M , Kumar S , Holmes E , McMurray B , Maguire EA , Billig AJ , Sedley W ((2020) ) How can hearing loss cause dementia? . Neuron 108: , 401–412. |
[16] | Gates GA , Anderson ML , McCurry SM , Feeney MP , Larson EB ((2011) ) Central auditory dysfunction as a harbinger of Alzheimer dementia. Arch Otolaryngol Head Neck Surg 137: , 390–395. |
[17] | Livingston G , Huntley J , Sommerlad A , Ames D , Ballard C , Banerjee S , Brayne C , Burns A , Cohen-Mansfield J , Cooper C , Costafreda SG , Dias A , Fox N , Gitlin LN , Howard R , Kales HC , Kivimaki M , Larson EB , Ogunniyi A , Orgeta V , Ritchie K , Rockwood K , Sampson EL , Samus Q , Schneider LS , Selbaek G , Teri L , Mukadam N ((2020) ) Dementia prevention, intervention, and care: 2020 report of the Lancet Commission. Lancet 396: , 413–446. |
[18] | Crapser JD , Arreola MA , Tsourmas KI , Green KN ((2021) ) Microglia as hackers of the matrix: Sculpting synapses and the extracellular space. Cell Mol Immunol 18: , 2472–2488. |
[19] | Janz P , Illing RB ((2014) ) A role for microglial cells in reshaping neuronal circuitry of the adult rat auditory brainstem after its sensory deafferentation. J Neurosci Res 92: , 432–445. |
[20] | Milinkeviciute G , Henningfield CM , Muniak MA , Chokr SM , Green KN , Cramer KS ((2019) ) Microglia regulate pruning of specialized synapses in the auditory brainstem. Front Neural Circuits 13: , 55. |
[21] | Baizer JS , Wong KM , Manohar S , Hayes SH , Ding D , Dingman R , Salvi RJ ((2015) ) Effects of acoustic trauma on the auditory system of the rat: The role of microglia. Neuroscience 303: , 299–311. |
[22] | Syka J ((2002) ) Plastic changes in the central auditory system after hearing loss, restoration of function, and during learning. Physiol Rev 82: , 601–636. |
[23] | Caspary DM , Ling L , Turner JG , Hughes LF ((2008) ) Inhibitory neurotransmission, plasticity and aging in the mammalian central auditory system. J Exp Biol 211: , 1781–1791. |
[24] | Rosskothen-Kuhl N , Hildebrandt H , Birkenhäger R , Illing R-B ((2018) ) Astrocyte hypertrophy and microglia activation in the rat auditory midbrain is induced by electrical intracochlear stimulation. Front Cell Neurosci 12: , 43. |
[25] | Singh K , Garcia-Gomar MG , Bianciardi M ((2021) ) Probabilistic atlas of the mesencephalic reticular formation, isthmic reticular formation, microcellular tegmental nucleus, ventral tegmental area nucleus complex, and caudal-rostral linear raphe nucleus complex in living humans from 7 Tesla magnetic resonance imaging. Brain Connect 11: , 613–623. |
[26] | Bianciardi M , Toschi N , Edlow BL , Eichner C , Setsompop K , Polimeni JR , Brown EN , Kinney HC , Rosen BR , Wald LL ((2015) ) Toward an in vivo neuroimaging template of human brainstem nuclei of the ascending arousal, autonomic, and motor systems. Brain Connect 5: , 597–607. |
[27] | Garcia-Gomar MG , Strong C , Toschi N , Singh K , Rosen BR , Wald LL , Bianciardi M ((2019) ) In vivo probabilistic structural atlas of the inferior and superior colliculi, medial and lateral geniculate nuclei and superior olivary complex in humans based on 7 Tesla MRI. Front Neurosci 13: , 764. |
[28] | Jenkinson M , Bannister P , Brady M , Smith S ((2002) ) Improved optimization for the robust and accurate linear registration and motion correction of brain images. Neuroimage 17: , 825–841. |
[29] | Smith SM , Jenkinson M , Woolrich MW , Beckmann CF , Behrens TE , Johansen-Berg H , Bannister PR , De Luca M , Drobnjak I , Flitney DE , Niazy RK , Saunders J , Vickers J , Zhang Y , De Stefano N , Brady JM , Matthews PM ((2004) ) Advances in functional and structural MR image analysis and implementation as FSL. Neuroimage 23: (Suppl 1), S208–219. |
[30] | Ichise M , Liow JS , Lu JQ , Takano A , Model K , Toyama H , Suhara T , Suzuki K , Innis RB , Carson RE ((2003) ) Linearized reference tissue parametric imaging methods: Application to [11C]DASB positron emission tomography studies of the serotonin transporter in human brain. J Cereb Blood Flow Metab 23: , 1096–1112. |
[31] | Schubert J , Tonietto M , Turkheimer F , Zanotti-Fregonara P , Veronese M ((2021) ) Supervised clustering for TSPO PET imaging. Eur J Nucl Med Mol Imaging 49: , 257–268. |
[32] | Wimberley C , Lavisse S , Hillmer A , Hinz R , Turkheimer F , Zanotti-Fregonara P ((2021) ) Kinetic modeling and parameter estimation of TSPO PET imaging in the human brain. Eur J Nucl Med Mol Imaging 49: , 246–256. |
[33] | Lyoo CH , Ikawa M , Liow J-S , Zoghbi SS , Morse CL , Pike VW , Fujita M , Innis RB , Kreisl WC ((2015) ) Cerebellum can serve as a pseudo-reference region in Alzheimer disease to detect neuroinflammation measured with PET radioligand binding to translocator protein. J Nucl Med 56: , 701–706. |
[34] | Avants BB , Tustison NJ , Song G , Cook PA , Klein A , Gee JC ((2011) ) A reproducible evaluation of ANTs similarity metric performance in brain image registration. Neuroimage 54: , 2033–2044. |
[35] | Penny WD , Friston KJ , Ashburner JT , Kiebel SJ , Nichols TE (2011) Statistical parametric mapping: The analysis of functional brain images, Elsevier. |
[36] | Fischl B , Salat DH , Busa E , Albert M , Dieterich M , Haselgrove C , van der Kouwe A , Killiany R , Kennedy D , Klaveness S , Montillo A , Makris N , Rosen B , Dale AM ((2002) ) Whole brain segmentation: Automated labeling of neuroanatomical structures in the human brain. Neuron 33: , 341–355. |
[37] | Carlson ML , Toueg TN , Khalighi MM , Castillo J , Shen B , Azevedo EC , DiGiacomo P , Mouchawar N , Chau G , Zaharchuk G ((2021) ) Hippocampal subfield imaging and fractional anisotropy show parallel changes in Alzheimer’s disease tau progression using simultaneous tau-PET/MRI at 3T. Alzheimers Dement (Amst) 13: , e12218. |
[38] | Laaksonen S , Saraste M , Sucksdorff M , Nylund M , Vuorimaa A , Matilainen M , Heikkinen J , Airas L ((2023) ) Early prognosticators of later TSPO-PET-measurable microglial activation in multiple sclerosis. Mult Scler Relat Disord 75: , 104755. |
[39] | Mosconi L ((2005) ) Brain glucose metabolism in the early and specific diagnosis of Alzheimer’s disease. FDG-PET studies in MCI and AD. Eur J Nucl Med Mol Imaging 32: , 486–510. |
[40] | Hwang PH , Longstreth WT , Jr. , Thielke SM , Francis CE , Carone M , Kuller LH , Fitzpatrick AL ((2022) ) Longitudinal changes in hearing and visual impairments and risk of dementia in older adults in the United States. JAMA Netw Open 5: , e2210734. |
[41] | Grabert K , Michoel T , Karavolos MH , Clohisey S , Baillie JK , Stevens MP , Freeman TC , Summers KM , McColl BW ((2016) ) Microglial brain region-dependent diversity and selective regional sensitivities to aging. Nat Neurosci 19: , 504–516. |
[42] | Tan YL , Yuan Y , Tian L ((2020) ) Microglial regional heterogeneity and its role in the brain. Mol Psychiatry 25: , 351–367. |
[43] | Bottcher C , Schlickeiser S , Sneeboer MAM , Kunkel D , Knop A , Paza E , Fidzinski P , Kraus L , Snijders GJL , Kahn RS , Schulz AR , Mei HE , Psy NBB , Hol EM , Siegmund B , Glauben R , Spruth EJ , de Witte LD , Priller J ((2019) ) Human microglia regional heterogeneity and phenotypes determined by multiplexed single-cell mass cytometry. Nat Neurosci 22: , 78–90. |
[44] | Sankowski R , Böttcher C , Masuda T , Geirsdottir L , Sindram E , Seredenina T , Muhs A , Scheiwe C , Shah MJ , Heiland DH ((2019) ) Mapping microglia states in the human brain through the integration of high-dimensional techniques. Nat Neurosci 22: , 2098–2110. |
[45] | Wu S , Nguyen LTM , Pan H , Hassan S , Dai Y , Xu J , Wen Z ((2020) ) Two phenotypically and functionally distinct microglial populations in adult zebrafish. Sci Adv 6: , eabd1160. |
[46] | Mendes MS , Majewska AK ((2021) ) An overview of microglia ontogeny and maturation in the homeostatic and pathological brain. Eur J Neurosci 53: , 3525–3547. |
[47] | Zats LP , Ahmad L , Casden N , Lee MJ , Belzer V , Adato O , Bar Cohen S , Ko SB , Filbin MG , Unger R , Lauffenburger DA , Segal RA , Behar O ((2022) ) An affinity for brainstem microglia in pediatric high-grade gliomas of brainstem origin. Neurooncol Adv 4: , vdac117. |
[48] | Winfree RL , Seto M , Dumitrescu L , Menon V , De Jager P , Wang Y , Schneider J , Bennett DA , Jefferson AL , Hohman TJ ((2023) ) TREM2 gene expression associations with Alzheimer’s disease neuropathology are region-specific: Implications for cortical versus subcortical microglia. Acta Neuropathol 145: , 733–747. |
[49] | Faraguna U , Ferrucci M , Giorgi FS , Fornai F (2019) The functional anatomy of the reticular formation. Frontiers Media SA, p. 55. |
[50] | Wen TH , Binder DK , Ethell IM , Razak KA ((2018) ) The perineuronal ‘safety’ net? Perineuronal net abnormalities in neurological disorders. Front Mol Neurosci 11: , 270. |
[51] | Balmer TS ((2016) ) Perineuronal nets enhance the excitability of fast-spiking neurons. eNeuro 3: , ENEURO.0112-16.2016. |
[52] | Morawski M , Bruckner G , Jager C , Seeger G , Arendt T ((2010) ) Neurons associated with aggrecan-based perineuronal nets are protected against tau pathology in subcortical regions in Alzheimer’s disease. Neuroscience 169: , 1347–1363. |
[53] | Mafi AM , Hofer LN , Russ MG , Young JW , Mellott JG ((2020) ) The density of perineuronal nets increases with age in the inferior colliculus in the Fischer Brown Norway rat.. Front Aging Neurosci 12: , 27. |
[54] | Crapser JD , Spangenberg EE , Barahona RA , Arreola MA , Hohsfield LA , Green KN ((2020) ) Microglia facilitate loss of perineuronal nets in the Alzheimer’s disease brain. EBioMedicine 58: , 102919. |
[55] | Arreola MA , Soni N , Crapser JD , Hohsfield LA , Elmore MR , Matheos DP , Wood MA , Swarup V , Mortazavi A , Green KN ((2021) ) Microglial dyshomeostasis drives perineuronal net and synaptic loss in a CSF1R+/–mouse model of ALSP, which can be rescued via CSF1R inhibitors. Sci Adv 7: , eabg1601. |
[56] | Stoyanov S , Sun W , Dusedau HP , Cangalaya C , Choi I , Mirzapourdelavar H , Baidoe-Ansah D , Kaushik R , Neumann J , Dunay IR , Dityatev A ((2021) ) Attenuation of the extracellular matrix restores microglial activity during the early stage of amyloidosis. Glia 69: , 182–200. |
[57] | Singh K , Cauzzo S , Garcia-Gomar MG , Stauder M , Vanello N , Passino C , Bianciardi M ((2022) ) Functional connectome of arousal and motor brainstem nuclei in living humans by 7 Tesla resting-state fMRI. Neuroimage 249: , 118865. |
[58] | Zeng X , Wang Z , Tan W , Petersen E , Cao X , LaBella A , Boccia A , Franceschi D , de Leon M , Chiang GC , Qi J , Biegon A , Zhao W , Goldan AH ((2023) ) Imaging neuroinflammation with TSPO: A new perspective on the cellular sources and subcellular localization. Pharmacol Ther 234: , 108048. |
[59] | Guilarte TR , Rodichkin AN , McGlothan JL , Acanda De La Rocha AM , Azzam DJ ((2022) ) Imaging neuroinflammation with TSPO: A new perspective on the cellular sources and subcellular localization. Pharmacol Ther 234: , 108048. |


