
Neural Computation-Based Methods for the Early Diagnosis and Prognosis of Alzheimer’s Disease Not Using Neuroimaging Biomarkers: A Systematic Review
Abstract
Background:
The growing number of older adults in recent decades has led to more prevalent geriatric diseases, such as strokes and dementia. Therefore, Alzheimer’s disease (AD), as the most common type of dementia, has become more frequent too.
Background:
Objective: The goals of this work are to present state-of-the-art studies focused on the automatic diagnosis and prognosis of AD and its early stages, mainly mild cognitive impairment, and predicting how the research on this topic may change in the future.
Methods:
Articles found in the existing literature needed to fulfill several selection criteria. Among others, their classification methods were based on artificial neural networks (ANNs), including deep learning, and data not from brain signals or neuroimaging techniques were used. Considering our selection criteria, 42 articles published in the last decade were finally selected.
Results:
The most medically significant results are shown. Similar quantities of articles based on shallow and deep ANNs were found. Recurrent neural networks and transformers were common with speech or in longitudinal studies. Convolutional neural networks (CNNs) were popular with gait or combined with others in modular approaches. Above one third of the cross-sectional studies utilized multimodal data. Non-public datasets were frequently used in cross-sectional studies, whereas the opposite in longitudinal ones. The most popular databases were indicated, which will be helpful for future researchers in this field.
Conclusions:
The introduction of CNNs in the last decade and their superb results with neuroimaging data did not negatively affect the usage of other modalities. In fact, new ones emerged.
INTRODUCTION
As the world population ages and its number increases, so does the prevalence of chronic diseases. Dementia is an example, deemed one of the socio-sanitary challenges that societies need to tackle.
Dementia is diagnosed when more than one cognitive or behavioral symptoms linked with gradual impairment of intellectual function happen and, at the same time, this impairment must interfere with daily activities [1, 2]. Although other health problems and diseases must be excluded before [3, 4]. The most common irreversible dementia is Alzheimer’s disease (AD), accounting for 70% of the cases [1]. Prevalence of AD is higher in population above 65 years old, nearly doubling every five years after that age [1, 2]. Onset and deterioration in AD are gradual: memory loss worsens over time and since the beginning whereas coordination, motor and sensory impairments appear years later [1, 4]. These clinical features are used for the Diagnosis of Dementia, which is especially challenging in the early stages.
On the other hand, mild cognitive impairment (MCI) is a construct that has been considered, in terms of cognitive impairment, an intermediate stage between cognitively normal (CN) and AD and that, unlike AD, it does not negatively affect routine daily activities [2, 5]. Researchers have further grouped MCI subjects: early mild cognitive impairment (EMCI), late mild cognitive impairment (LMCI), “reverters” (cognitive impairment and diagnostic label improved between several consecutive visits) and “converters” (the opposite case, such as progressive mild cognitive impairment (pMCI) subjects that went from MCI to AD).
AD has no cure as of the second semester of 2023. Current treatments may help with the symptoms but cannot slow down or reverse AD progression [1].
High is not only the prevalence of AD, approximately 5.7 million people in the US had AD in 2018 [6], but also its socioeconomic costs for health systems, ranging from $6,757 to $43,680 depending on the country [7]. Also, caregivers of these patients suffer from several mental and physical health problems, and even psychotropic medicines abuse [8].
In [3] it is indicated that diagnosing dementia is challenging because of the difficulty in distinguishing it from other illnesses with similar symptoms. Early application of treatments is beneficial in order to keep most of the patient’s quality of life, albeit, for this to occur, diagnosis should be early too. Unfortunately, current treatments cannot make dementia stop or recede, only help with the symptoms. The annual cost per patient with dementia, which is country-dependent, is around $44,000 [7]. It is common that the physical and mental health of caregivers of patients with dementia get affected [8].
Dementia is currently not so well understood in several aspects such as risk factors, preventive strategies, and ante-mortem diagnosis. Due to this, further research in these aspects needs to be carried out to fight dementia and, particularly, AD [9]. Considering the high complexity of AD diagnosis (detection of the disease, patient may have it now) and prognosis (predicting the disease, patient may have it in the future), a vast quantity of research based on artificial intelligence (AI) methodologies has been published. The majority of them utilized non-neural approaches such as support vector machine (SVM) [10–13] and ensembles of AI models [14–16].
To our knowledge, the current work is the first review focused on cross-sectional and longitudinal studies based on shallow or deep artificial neural networks (ANNs) for the early diagnosis or prognosis of AD, and whose input data did not originate from neuroimaging techniques nor brain signals. That is, studies included in this review did not make use of data obtained with structural magnetic resonance imaging (sMRI), functional magnetic resonance imaging (fMRI), positron emission tomography (PET), single-photon emission computed tomography (SPECT), computed tomography (CT), diffusion tensor imaging (DTI), functional near-infrared spectroscopy (fNIRS), optical coherence tomography angiography (OCTA), electroencephalography (EEG), or magnetoencephalography (MEG).
Related works
Many similar reviews and surveys have been published, principally focused on cross-sectional studies. Those that also included prognosis-related works were scarce [17–19]. Reviews differed in the illnesses that were studied, the families of computational methodologies that were included, and the modality of the data that was utilized.
Regarding illnesses, almost all of these reviews were confined to AD-related works [20–31]. Some included both AD and non-AD dementia works [32–34]. A small number of them were not limited to dementia alone but studied a wide variety of diseases [35–40]. Cognitive impairment detection was analyzed in [41, 42].
Regarding the computational methodologies, reviews focused on deep learning (DL) studies were popular [19, 23, 27, 30, 35–38]. A significant number of reviews included works with methods belonging to wider families, whether AI [18, 25, 26, 33, 34, 39] or machine learning (ML) [17, 20, 28, 32, 40, 42]. Shastry et al. [31] compared deep neural networks (DNNs) with other ML approaches and modular systems with at least one DL based module. Qu et al. [29] only included studies whose DL methods were based on generative adversarial network (GAN). The importance of transfer learning for DNNs was confirmed in [40].
Finally, according to the modality, most reviews only discussed neuroimaging-related works [19, 21, 23, 24, 28, 38, 40, 42]. Papers that utilized the broader medical imaging group were reviewed in [27, 32, 35, 36]. A few reviews also included works where neuroimaging was combined with other modalities [28] or mixed different imaging modalities [18]. On the contrary, works that used multimodality of any type were analyzed in [20]. Several reviews examined narrow sets of papers as they only included those that made use of magnetic resonance imaging (MRI) [26, 37, 39] or sMRI [25]. In [17] only studies that utilized EEG were reviewed. Research works in the review of Pulido et al. [22] were those that performed automatic speech analysis.
METHODS
This work reviews the state of the art on diagnosis and prognosis of AD and MCI which was based on ANN methods. Its two objectives are:
1. Reviewing the variety of neural techniques and clinical criteria that have been utilized for the diagnosis and prognosis of AD and MCI.
2. Assessing the differences in performance yielded by different combinations of clinical criteria and ANN families, so the most appropriate ones for a particular problem are found.
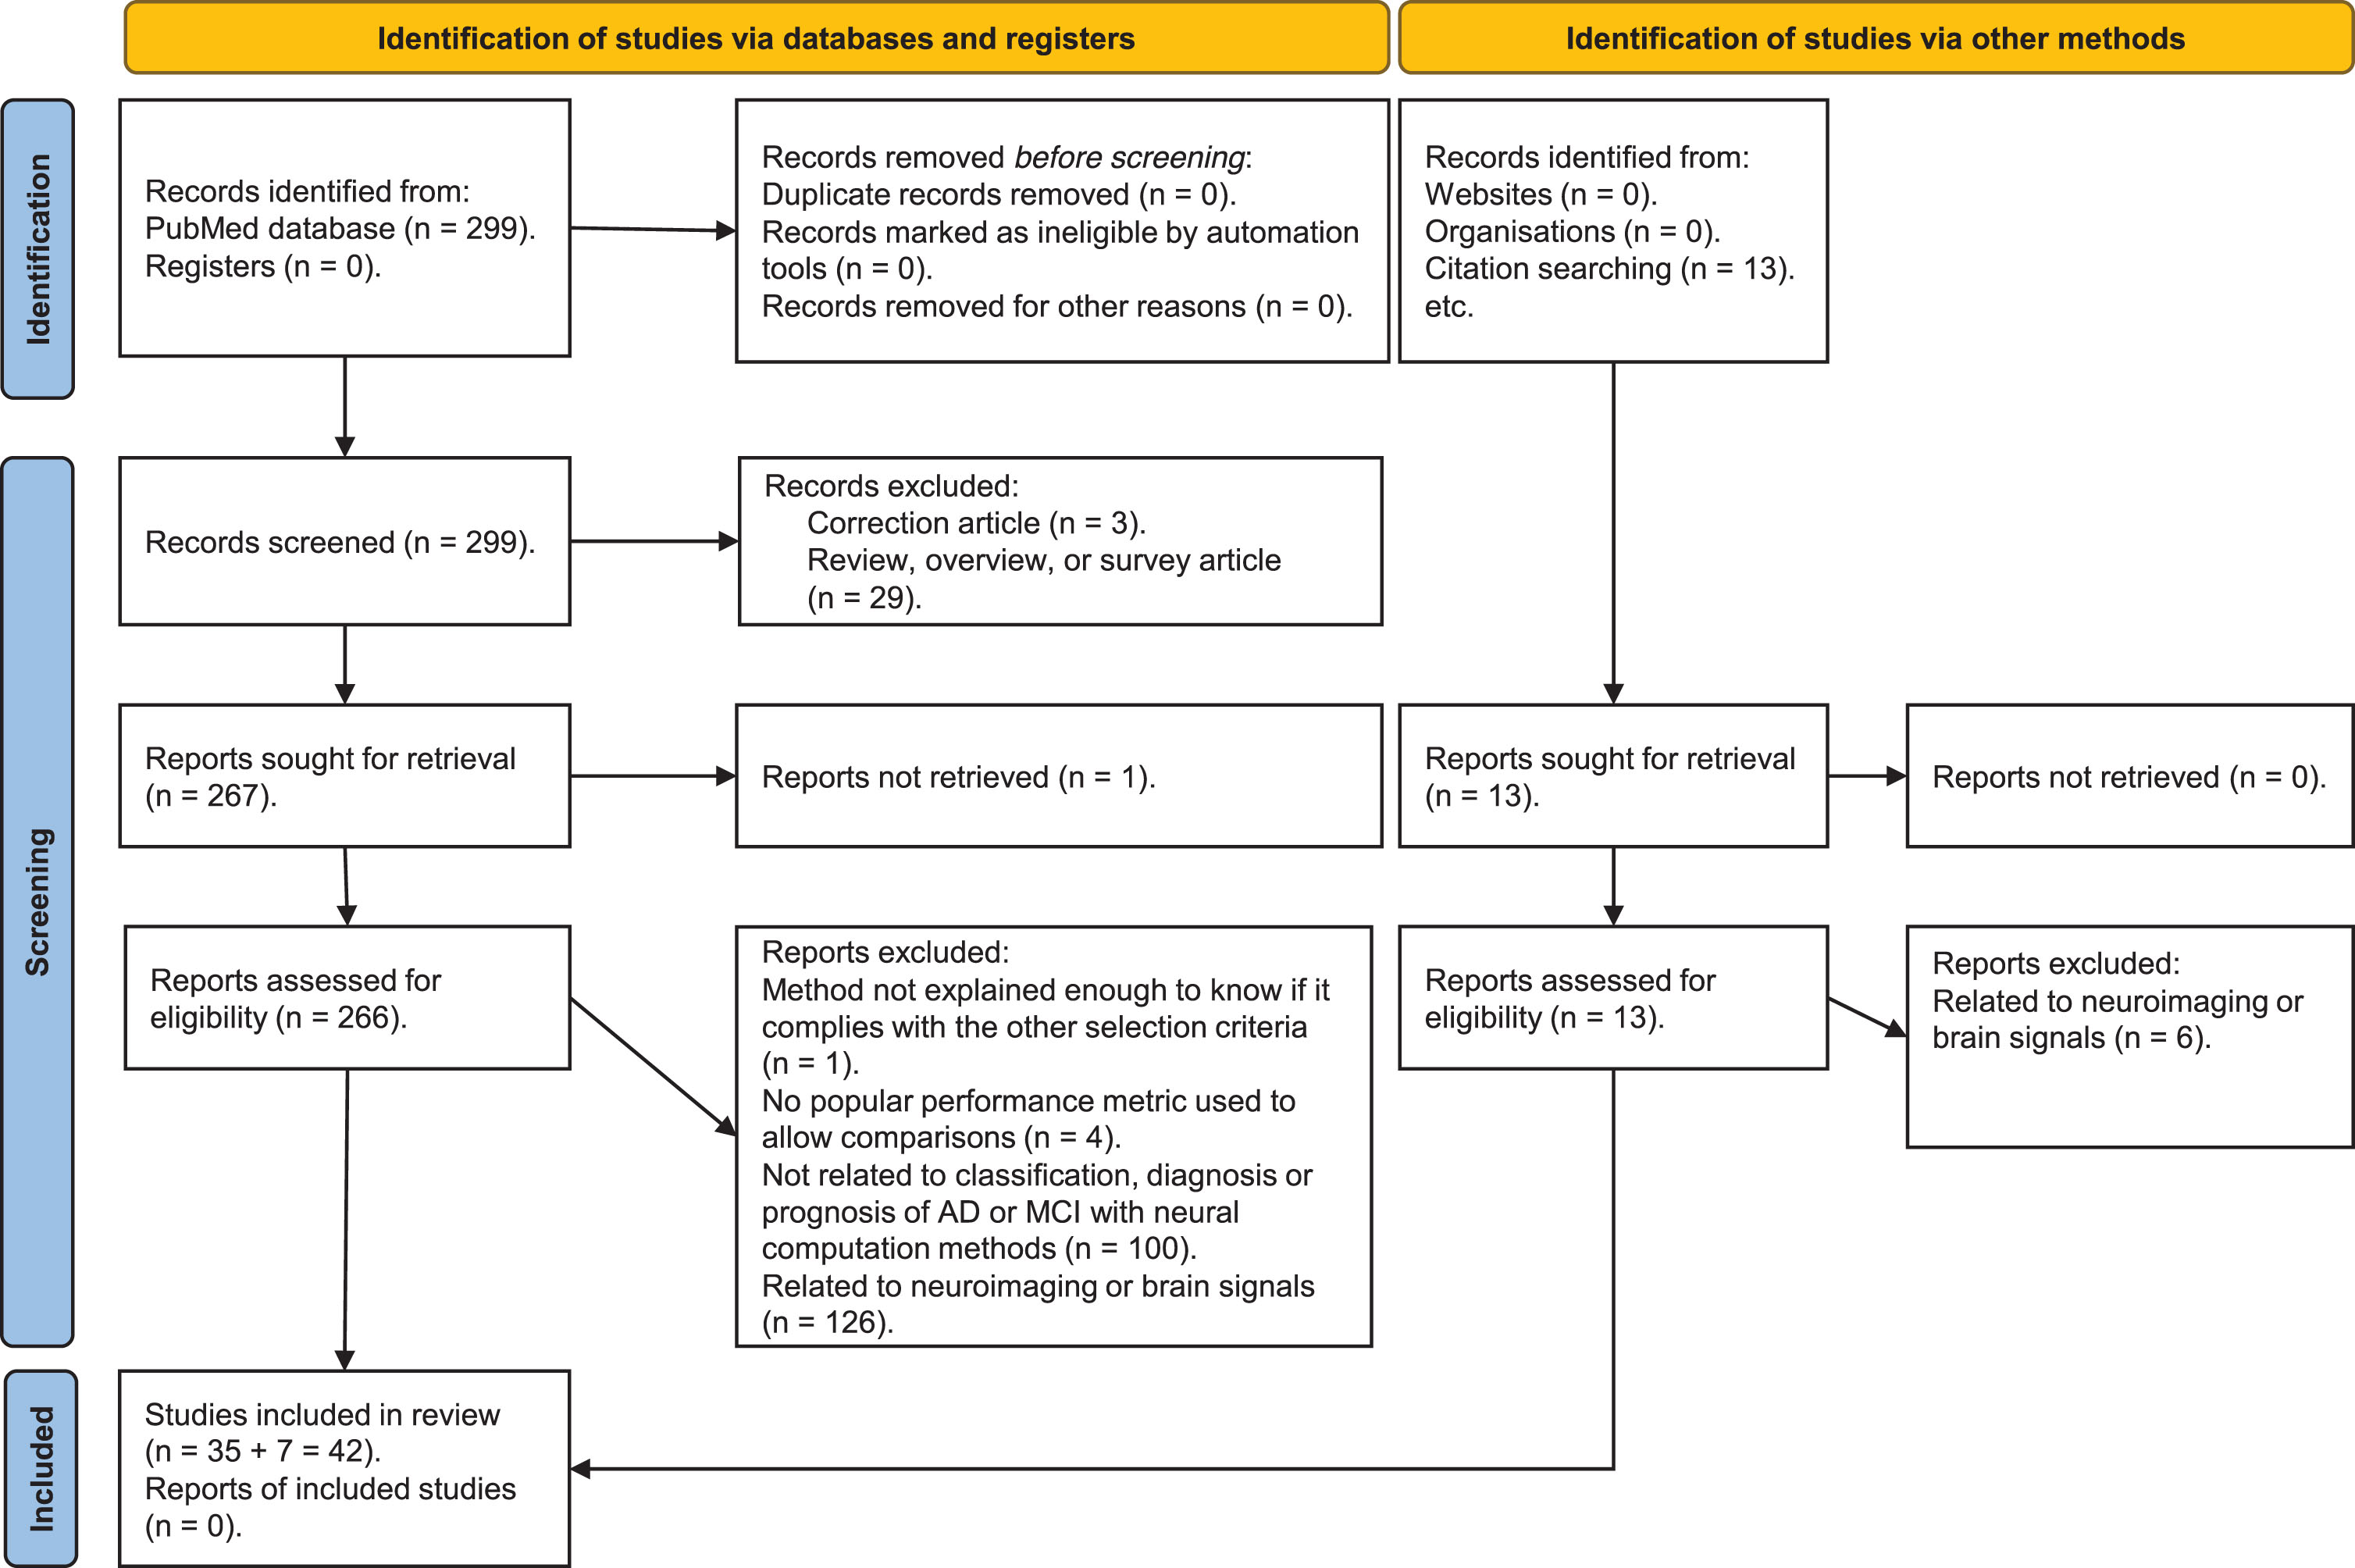
In Fig. 1, a PRISMA diagram showing the search methodology of the literature review that was followed is exposed. Throughout this section the search strategy, selection criteria and data analysis are further described.
Fig. 1
PRISMA diagram showing the search methodology used for this literature review.
Search strategy: databases and coverage of search
Articles were retrieved from PubMed, a database with more than 34 million publications connected with life sciences and biomedical research. Additionally, some papers were manually extracted from IEEE Xplore and ScienceDirect databases.
After several iterative modifications of the search terms, especially by means of adding more exclusion criteria so that the results became increasingly more interesting for the goals of this review, this final combination of search terms was found: (alzheimer OR alzheimer’s OR alzheimers OR “mild cognitive”) AND (“neural network” OR “neural networks” OR “deep learning” OR “deep neural”) AND (detect OR detection OR diagnostic OR diagnosis OR prognostic OR prognosis OR classify OR classification) NOT (animal OR animals OR mice OR mouse OR monkey OR ape OR apes) NOT (“in silico” OR “ex vivo” OR “in vitro”) NOT (acupuncture OR cancer).
Study selection criteria
The next inclusion and exclusion criteria were required to be met by the publications extracted from the indicated databases in order to be selected for this review:
• Cross-sectional and longitudinal articles related to AD or MCI diagnosis or prognosis were accepted for inclusion. Also, they were included if they studied their degree of severity. Conversely, they were discarded if they were focused on non-AD dementia or mental diseases.
• Neural methods, whether ANNs or DNNs, must have been used in those articles. Both comparisons or modular systems where one of the methods or modules fulfilled the previous condition were also accepted.
• Only peer-reviewed articles and conference papers written in English and whose content was accessible with our credentials, including open-access ones, were admitted. Reviews were studied only for comparisons with the current work in section Introduction.
• Date of publication must have been between January 2012 and December 2022, inclusive.
• In order to allow benchmarking articles in a fair way, values for one or more of the commonly used performance metrics indicated in subsubsection Performance metrics should have been utilized. Class distribution and number of subjects were also considered in such comparisons.
• Simulations of AD in biological neural networks (BNNs), in vitro experiments, and studies with animals or ex-vivo tissues were left out.
• Articles whose methods were not presented with an adequate level of detail as to determine if they met this selection criteria were discarded.
• Duplicate articles, if any, were deleted.
As indicated in Fig. 1 and the previous selection criteria, an elimination process occurred while screening the works identified in the database. A single-blind selection was performed: neither the names or affiliations of the authors of any of the articles were used to decide whether to include or exclude an article.
Almost 38% of the 266 articles assessed for eligibility that were identified from the PubMed database were disregarded due to not complying with the first two selection criteria. More than 47% of those 266 articles were discarded because they made use of data related to neuroimaging or brain signals.
The final 42 “selected articles” were those that met the previous selection criteria and where data not originated from brain signals nor neuroimaging techniques were utilized, whether alone or combined with other modalities.
As an article may deal with several classification tasks, it will appear in the same table more than once, in the sections inside the table with the most similar classification task. Taken this into account, from the 42 “selected articles” that were analyzed, there will be a total of 49 cross-sectional and longitudinal studies included in the tables and graphics in subsection Data analysis and the subsections in the Results section where cross-sectional and longitudinal studies are analyzed.
Data analysis
The 42 selected publications were later compiled and some considerations, including several statistics on the articles and the performance metrics, arose from the derived 49 cross-sectional and longitudinal studies grouped by classification problem.
Statistics on the articles. In Fig. 2, it is shown that the quantity of cross-sectional studies on this topic that fulfill the selection criteria has almost multiplied by 5 in the last two years. In this period of time there has been almost the same quantity of studies based on shallow and deep ANNs. Blood or genes has become more frequently used by ANN-based methods in that period too. On the other hand, in the last decade modalities has changed, with new ones being introduced while others stabilized.
Fig. 2
Number of cross-sectional studies that used data not from neuroimaging per year, grouped by modality and neural family.
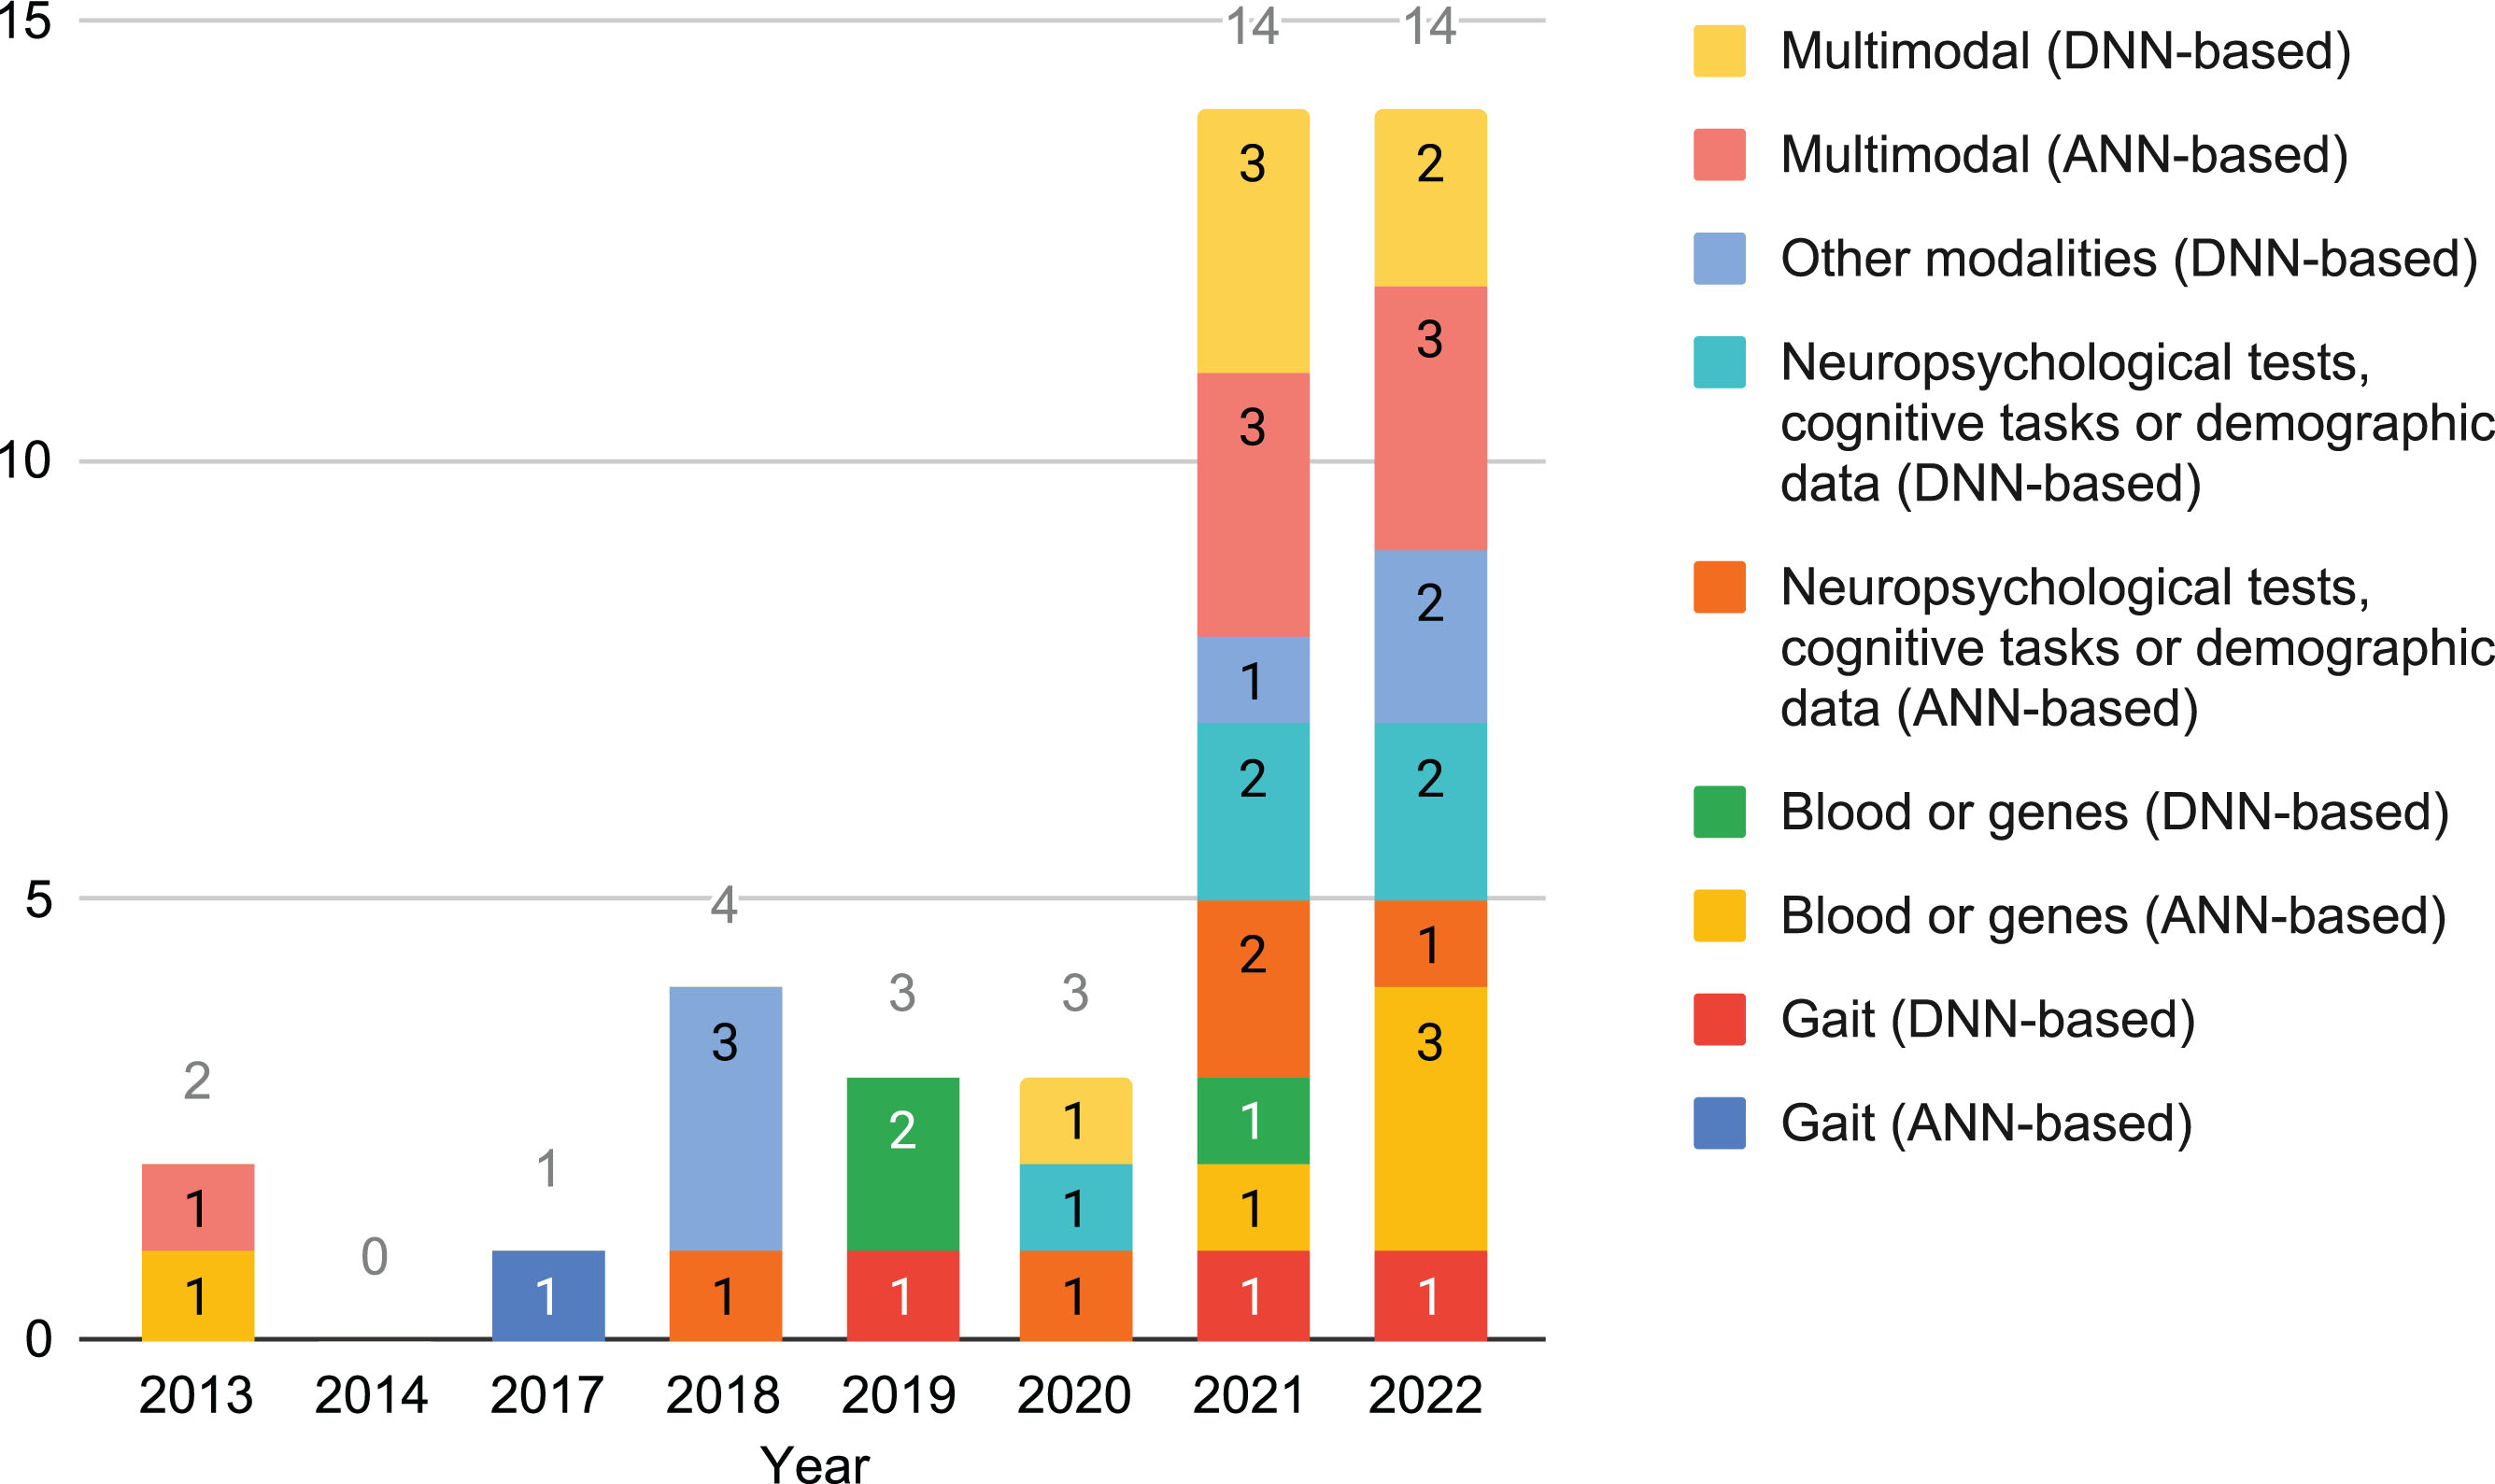
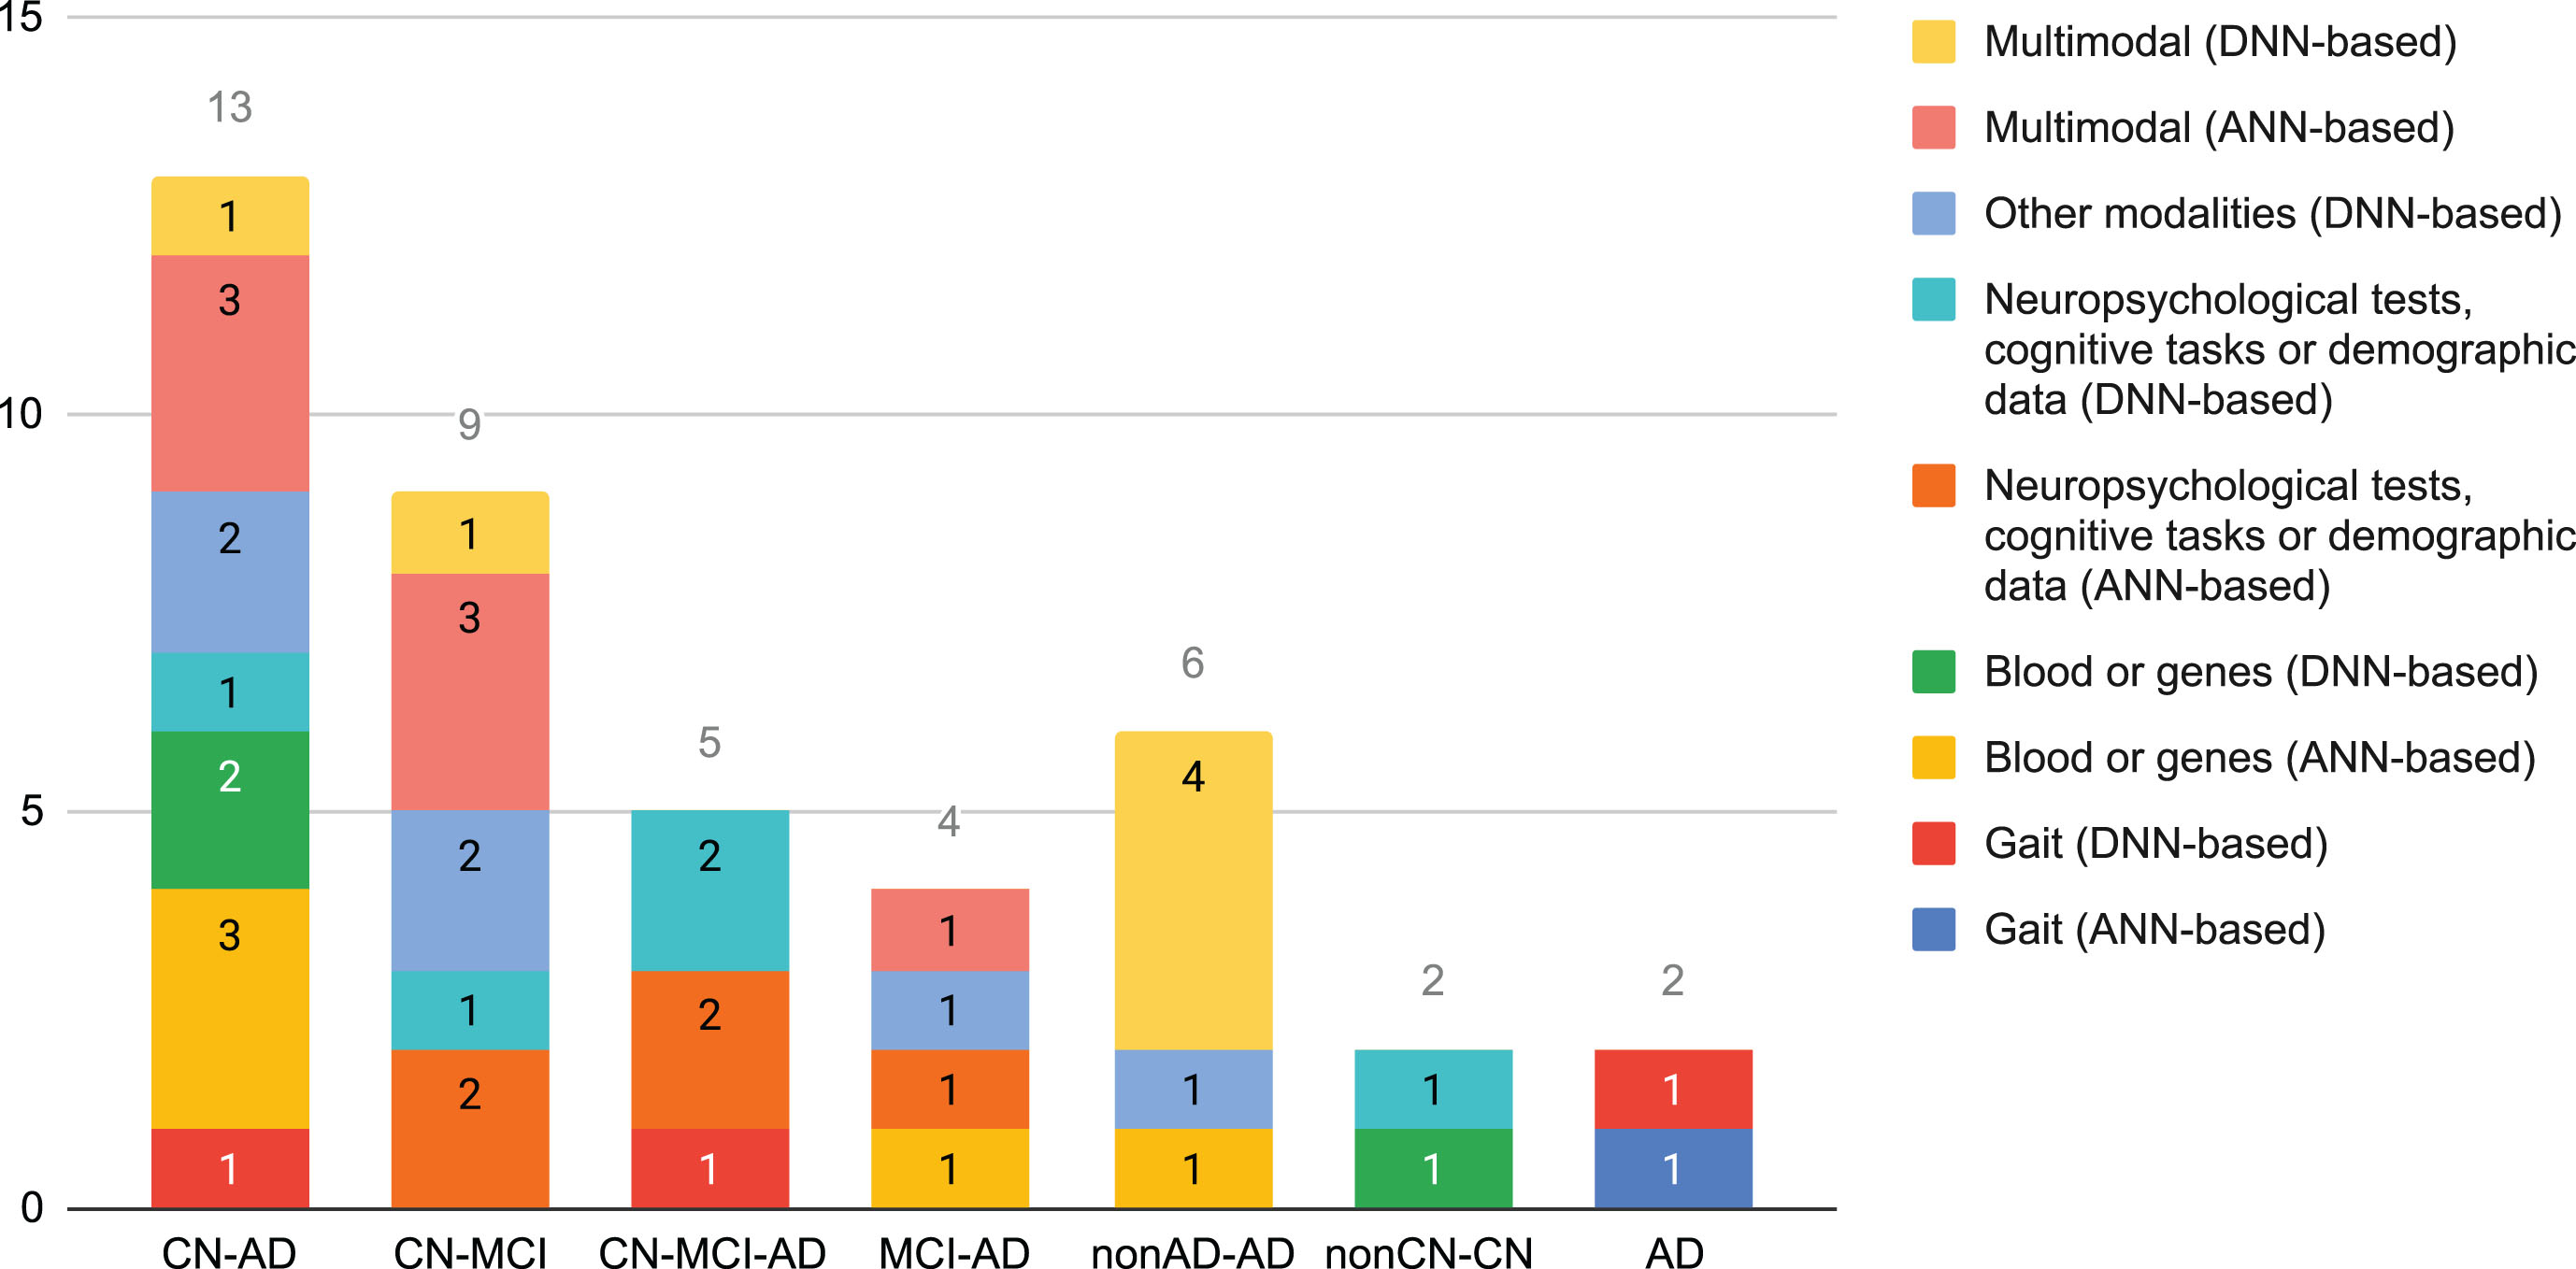
Figure 3 shows how common the different classification tasks have been in the selected cross-sectional studies. Almost 54% correspond to the CN-AD and CN-MCI classification tasks. Multimodality, which accounted almost 32% of the cross-sectional studies, was more common with shallow ANNs or for tackling binary classification problems. None of the selected studies based on DNNs tackled MCI-AD.
Fig. 3
Number of cross-sectional studies that used data different to neuroimaging per classification task, grouped by modality and neural family.
Performance metrics. In order to allow or ease the comparison of their work with others, researchers frequently make use of well-known performance measurements, such as accuracy, balanced accuracy, specificity, sensitivity, area under the curve (AUC), receiver operating characteristic (ROC) curves, precision, and F1 score [43–51]. Moreover, researchers almost always present results using several performance metrics because they have different advantages and disadvantages, or they measure distinct aspects.
Time-related and resource-consuming metrics can be used to further compare systems with similar results for other performance measurements. Examples: training time, number of parameters, network bandwidth, and disk space.
Non-neuroimaging biomarkers and diagnosis criteria in AD
Despite being more difficult and usually having lower accuracy [52], the sooner AD is diagnosed, the better [53, 54]. Also, the earlier some treatments and therapies are applied to an AD patient, the higher their effectiveness are [53, 55].
A biological marker, usually known as biomarker, is any measurable substance or characteristic obtained from a patient that is common to the illness but infrequent in healthy subjects, hence allowing its diagnosis or prognosis. Currently no specific biomarker for AD exists. A postmortem autopsy is deemed the only definitive diagnosis [56]. Galasko et al. [52] experimentally confirmed that CN subjects had significantly higher Amyloid-β (Aβ) and lower tau concentrations in cerebrospinal fluid (CSF) than AD patients.
In the last decades researchers have proposed many diagnostic tools for the early diagnosis of AD [57–59]. The majority of current diagnostic techniques for AD are expensive, time-consuming (even more when several repetitions are needed), pose a risk to the patient or are invasive, or need to be done manually. Novel criteria and potential biomarkers that avoid such nuisances are being studied [53, 55, 60], such as blood [60–62], genome [62] and vascular disorders [63].
It should be noted that biomarkers are considered clinically useful when they yield values of sensitivity, specificity, precision, and Negative Predictive Value above 0.9 [62].
Neuropsychological tests. Many neuropsychological assessments have been utilized in dementia research [64], especially for initial repetitive testing. Sometimes they are also used to obtain the “gold standard” category of the patient, which is most adequately given by autopsies. The main advantages of neuropsychological tests are their low price, accessibility for non-specialized practitioners, and non-reliance on advanced and expensive hospital equipment. Several research works have indicated that their final scores may be influenced by several actions or characteristics of the patient such as age, level of education, lack of motivation, malingering and rumination [54, 65]. The existence of some physical impairment may render impossible to answer some questions in the way expected by the test creator, which may affect the final score too, so the clinician should take this into account. Most neuropsychological tests have good sensitivity and specificity in patients with moderate dementia but behave worst in those with earlier stages [54, 64].
These assessments cover different domains and subdomains of neuropsychological functioning and several of those that were used in the selected bibliography will be indicated:
• Functional domain refers to how well the patient is able to do daily-living activities and how independent the patient is doing them. Some of these activities are: eating, showering, shopping, dressing, using public transport. Functional Activities Questionnaire (FAQ) is an example of test specialized in this domain [66, 67]. Others are Katz’s index [68], Barthel’s index [69], and Lawton-Brody’s index [70].
• Cognitive domain includes several subdomains [65, 71, 72] such as memory, language, executive function, visual motor ability, attention, social cognition, recall, orientation, and calculation, among others. Speech and language are some of the areas that are negatively affected by dementia [12]. Difficulties in verbal fluency and word retrieval are some of the linguistic impairments found on both MCI and AD subjects [11]. Examples of cognitive tests are Mini-Mental State Examination (MMSE) [73], Montreal Cognitive Assessment (MoCA) [74], and Rey Auditory Verbal Learning Test (RAVLT) [75]. Neuropsychological tests may specialize in one or more cognitive subdomains.
• Behavioral domain stands for changes in mood and conduct. Depression, aggressiveness, or anxiety are some of the elements that are assessed by tests in this group. Geriatric Depression Scale (GDS) is specialized in depression detection within geriatric environments [76]. Neuropsychiatric Inventory (NPI) is able to detect 10 different behavioral problems [77, 78]. A shorter variant is the Neuropsychiatric Inventory Questionnaire (NPI-Q) [79].
Some neuropsychological assessments are prepared to test multiple domains: cognitive and functional, such as Cognitive-Functional Composite (CFC) [80] or Everyday Cognition (ECog) [81]; and cognitive and behavioral, for example Alzheimer’s Disease Assessment Scale (ADAS) [82]. Special mention is Clinical Dementia Rating (CDR), another multiple domain— cognitive and functional— neuropsychological test, utilized for staging dementia [83]. Values go from 0 for CN subjects to 3 for those with severe dementia. The variant called Clinical Dementia Rating Scale Sum of Boxes (CDR-SB) seems to be useful for early stages [84].
Some neuropsychological tests may need up to 30 min each, albeit simplified and faster versions of some of them have been developed. MMSE and MoCA, the most popular ones, require around 10 min per session. Besides, there are very brief but not so popular tests, whose scores may be obtained just after a couple of minutes [64, 85]. Generally, in order to monitor disease progression in different domains each patient is examined with several tests and on a regular basis, so their times add up and become large in the long run. An approach to diminish the administration, scoring, interpretation, and documentation times of neuropsychological tests is the usage of computerized or digital cognitive tests [86]. In that recent systematic review those authors found out that almost 60% were mobile-based screening tests; near 3 out of 10, desktop-based; and the rest, web-based. Additionally, these digital versions ease remote and self-administration. However, due to the different way the neuropsychological test is conducted, results for the paper and digital versions of the same test may differ [86].
Cerebrospinal fluid. CSF is a colorless biofluid in the brain and spinal cord. It is obtained from the subarachnoid space by lumbar puncture, a quite invasive method where a needle is inserted between certain lumbar vertebrae. Its main functions are [87, 88]: physical support and hydromechanical protection of the nervous system, excretion, nourishment, intracerebral transport of substances (such as hormone-related and neuroactive ones), and regulation of the chemical environment within the central nervous system. Malfunctioning of the excretion function may produce accumulation of brain metabolism waste products and other unnecessary substances. This affects the correct functioning of the brain, and it is commonly seen in several neurodegenerative diseases and aging [88]. Some biomarkers of interest for dementia diagnosis can be found in CSF, such as Aβ42, the ratio Aβ42:Aβ40, total tau, and hyperphosphorylated tau [89]. Apolipoprotein E (APOE) may be extracted via CSF, and the most important allele for AD is ɛ4. According to [62], the combination of some CSF-derived biomarkers for initial screening is potentially optimal because it has high sensitivity, but should be followed by using biomarkers with higher specificity.
Human gait. Several health problems, such as stroke, Parkinson’s disease and cerebral palsy, affect patients’ ability to keep certain posture and to control some of their body parts, even impeding it. In the last years it has been found that gait problems are generally common, albeit to varying degrees, in cognitively impaired and demented patients too. Gait becomes slower with increasing cognitive impairment [58]. Analyzing gait while performing another motor or cognitive task at the same time may be better than analyzing gait alone because it may help detecting gait problems which will stay unnoticed if only one task is performed [58].
Many types of sensors and methodologies have been used to analyze human gait, posture and movement of some body parts [90], such as eye-trackers, accelerometers, gyroscopes, video analysis, and photogrammetry. Unlike a few decades ago, some of these sensors are nowadays economical and viable options for researchers thanks to the wide availability of webcams, Bluetooth devices and smartphones.
The main handicap of these systems is that sometimes they might require much more detailed motion capture sessions in controlled environments. Also, patients or caregivers might need to learn how to properly set up the motion capture devices when no supervision or aid is available (for example, at home).
Speech. Cognition is one of the domains negatively affected by AD. As a direct and unavoidable result of cognitive decline, language is deteriorated too [22]. Hence, speech and writing, as complex cognitive and physiological processes, also become impaired: subjects are not able to understand others or express themselves.
Speech is mostly affected in a steady increasing way. During the early stages of AD, having difficulties with word recalling, a lack of verbal fluency and using word fillers are frequent. In moderate stages, it is common the repetition and incorrect usage of words, sometimes being unable to follow a conversation. In severe stages, subjects are unable to produce coherent speech, repeating what others say, using illogical or unrelated words and sentences. Among others [11], changes in the percentage of voice breaks, the quantity of periods of voice and the number of voice breaks can be used to distinguish between AD, MCI, and CN subjects [91]. Increase in reading and phonation times have been reported too, apparently parallel to the cognitive decline [92].
Blood. Blood-based biomarkers for AD are the most novel diagnostic tool of those that have been reported in the selected bibliography. Serum Aβ load and APOE may be obtained with the less invasive and cheaper blood extraction than with CSF. Different combinations of plasma-based biomarkers are recommended depending on the AD stage [60]: for preclinical AD, plasma P-tau217 combined with Aβ42/40 or glial fibrillary acidic protein; for prodromal AD, plasma P-tau217 and cognitive tests; and for AD dementia, plasma P-tau217 alone is enough. Leuzy et al. [60] considered that blood-based ones might be sufficient to improve diagnosis in a primary care setting. These authors concluded that more studies about the combination of blood-based biomarkers with other cost-effective and accessible measures, such as neuropsychological tests and MRI, are necessary.
Neural computation methods: artificial neural networks and deep neural networks
A system is considered truly intelligent if it can observe its environment and learn from it. True intelligence consists in adapting, having the capacity to integrate new knowledge, solving new problems, and learning from mistakes. “Learning” can be defined as the ability of a system to acquire information from the environment without external programming. “Artificial intelligence” can be defined as the intelligence-related capabilities found on computers, robots, and computer programs. “Machine learning” is a subgroup of the AI methods where a system can learn from data and generalize to unseen data, without being explicitly instructed on how to work with the unseen data.
All the studies included in this review are based on ANNs, a wide and diverse family of ML methodologies. The intelligence found in systems based on ANNs is related to the expression “computational intelligence”, and it emerges from the complex behavior of interconnected processing units working in parallel. It is driven by learning (whose dynamic is inspired by biological processes).
Kohonen [93] defined ANNs as parallel networks of massively interconnected and hierarchically organized simple elements that interact with the environment similar to how the BNNs do. Hence, ANNs are inspired by BNNs (mainly the human brain), the biological neurons that principally constitute any BNN, and their synapsis (biologically speaking, a specialization and where the neurons interconnect). Parallel processing, robustness to incomplete or noisy data, neurons and network fault tolerance and generalization are some of the advantages of the ANNs.
Rumelhart [94] proposed eight elements to define a general framework of an ANN: a set of processing units with local memory; a state of activation of each of them; an output function for each of these units; a pattern of connectivity among the units; a propagation rule or network function that defines how the activity patterns propagate and is based on the connectivity pattern; an activation rule for combining the state of a neuron with the inputs that arrive to it and produce a new activation of that unit; a learning rule that indicates how the connectivity patterns change based on experience; and representation of the environment in which the ANN works (a local and a global information setting exist) [95].
Artificial neurons, a.k.a. nodes or processing units, are the basic component of any ANN. Their shape and behavior are inspired by their biological version: receive weighted inputs (comparable to the postsynapsis in the dendrites), process them mathematically (normally a sum of the weighted inputs passed through the activation function), and produce an output (analogous to the action potential transmitted through the axon).
Artificial neurons are characterized by several functions that define their behavior: activation (computes the neuron state based on the previous neuron state, some fixed threshold, and the network input; examples: linear, logistic, ReLU, radial \dots), output (computes the output from the activation; usually the identity function), and propagation (computes the input from the outputs and a bias value).
Connectivity topology indicates the shape in which the artificial neurons are interconnected, frequently grouped in layers [95]. Generally, the basic structure of an ANN consists of three layers: one that receives the input data (hence called “input layer”), a “hidden layer” where the processing of the input data is done, and the “output layer” that provides the output of the ANN. Each of these layers can connect to the others, frequently to the nearest one: to the next layer (feed-forward), previous layer (feed-back), or even with themselves (lateral connections). The most common type is the feedforward connection to the nearest next layer. DNNs differs from shallow ANNs in the number of hidden layers, which is above one, thanks to which they can tackle more difficult tasks, usually needing little to no external preprocessing of the input data and feature ranking. However, this increased quantity of hidden layers brings along greater training times and number of hyperparameters of the network.
Not only the direction of the connections (that is, the information flow direction) but also the connectivity density may be defined: fully or partially connected [95].
Connections between neurons are typically weighted, that is, they have a weight associated with it. This weight is a number that indicates the strength of the connection or the correlation degree between the neurons of that connection.
The network neurodynamic describes how the processing units process the local information [95]. It can be expressed by time-continuous or discrete functions, the latter case requiring to know when to calculate the outputs of the processing units [45]. These changes can be made whether asynchronously or synchronously. Among the most common forms of asynchronous methods there is the random one, in which the processing unit that computes its output is randomly chosen. Another very common way is following the topological order imposed by the connections, where the computations are performed synchronously layer by layer, from the ones next to the inputs to the output one. On the other hand, these changes can occur between all or only part of the network elements [45].
In ANNs the learning process occurs when they are trained with data by following a learning algorithm. This way, the parameters of the network (generally, the weights of the connections) change iteratively (often after an input sample is used for learning) and, finally, get optimized so that the error made by the network is minimized, principally trying to reduce the difference between the expected output and the one obtained by the network. Depending on the level of tutoring for each input data, three different paradigms exist [95]: supervised (desired output is also provided to the ANN), reinforcement (only the correctness is indicated), and unsupervised (the ANN self-organizes based on the structures and redundancy found in the input data).
To sum up, unlike other ML methods, neural computation ones are characterized by a distributed, parallel and adaptive computing performed by 3D modular architectures [95]. These architectures are formed by multiple and highly interconnected processing elements, which are organized in layers [95].
Usage of ANNs in the fields of health and psychiatric disorders is not new, especially for their diagnosis [96]. The most popular ANNs and DNNs in the articles selected for this review are outlined in the next subsections.
Multilayer perceptrons. Backpropagation algorithm
A multilayer perceptron (MLP) is an ANN with feed-forward connections between successive layers [95]. This means that there are no recurrent units in the network, that is, all the information goes from the input to the output layers and not the opposite way (the so-called feedback connections). MLPs are based on the perceptron algorithm [97], a single-layer network that is deemed the simplest ANN. MLPs are usually built by combining many perceptrons in three or more layers: input, hidden (one or more), and output. Unlike perceptrons, MLPs can separate non-linear data (i.e., data that cannot be separated with a straight line) when non-linear activation functions are used. The rest of its neurodynamic is the same as in the perceptron [95]. Its most common learning algorithm is called “backpropagation” [95]: weights are updated first in the output layer and these changes are passed backward to previous layers. Multilayer perceptrons can tackle both classification and regression problems [98].
Recurrent neural networks
The main characteristic of recurrent neural networks (RNNs) is the presence of feedback connections. In RNNs the input data flows bidirectionally: not only from input to output layer as in feed-forward ANNs but also backward from output to input. The output from some neurons is utilized to affect the subsequent input to those neurons. Jentzen et al. [99] indicated that RNNs can be seen as applying the same parametric function to both a new input sample and a partial output from the previous application of that parametric function. Conversely, feed-forward ANNs were referred as successively applying different parametric functions [99].
As with transformers, RNNs are quite suitable to model temporal or ordinal behaviors because the output depends on previous calculations. Examples of topics where this happens and RNNs are good at are language translation, speech recognition, natural language processing (NLP), and image captioning. RNNs are able to perform these tasks efficiently because they have a “memory”, their internal state.
Connections in a RNN can be seen as a directed graph throughout a sequence.
Unlike transformers, RNNs are prone to performance degradation over long sentences as words at the end of a sentence are given more importance whereas the importance of earlier words are attenuated.
Gradient explosion (i.e., tend to infinity) and vanishing gradient (i.e., tend to zero) problems are their main disadvantages. More powerful and complex RNNs do not have these shortcomings, due to the usage of “gated states” to control what the network remembers and forgets: long short-term memory (LSTM) networks [100] and gated recurrent unit (GRU) [101]. Unlike GRU, LSTM has more parameters as it has an “output gate”, which controls which information are going to be considered as the output of the neuron. Both LSTM and GRU have increased the popularity of RNNs.
Transformers
Initially proposed in [102], transformers are a family of DNNs with an encoder-decoder structure. They are based on attention mechanisms and do not use any type of convolution or recursion. Thanks to these attention mechanisms, transformers can determine the importance of all the words in a sentence for the encoding of each of these words. Unlike RNNs, transformers process all the input sequence at the same time instead of one word at a time, hence avoiding performance degradation over long sentences. Together with not having any recurrent units, both characteristics allow for faster training times and more parallelization capabilities than RNNs. Therefore, popular large language models (LLMs) based on transformers have been developed, such as Bidirectional Encoder Representations from Transformers (BERT), Copilot, and the Generative pre-trained transformers (GPT) series (Ex.: GPT-2, GPT-3 and ChatGPT). These LLMs are frequently pretrained with huge online-based language datasets. The size of the training data (above 450 GB), the quantity of network’s parameters (hundreds of billions) and the high training costs are their main disadvantages.
As with RNNs, they are specialized in processing sequential data. Transformers have yielded very good results in NLP and related tasks such as document generation, machine translation, video understanding, and document summarization.
Computer vision, image segmentation, autonomous driving, and audio processing are other fields where transformers have deemed to be efficient. Vision transformer (ViT) is one architecture used for these tasks. ViT computes relationship of pixels in some small portions of an image instead of every pair of pixels in an image, which will be much more computationally intensive.
Convolutional neural networks
CNNs, also known as “ConvNets”, “Shift Invariant ANNs”, or “Space Invariant ANNs”, are regularized feed-forward DNNs where a convolution operation is carried out [99].
CNNs were inspired by the animal visual cortex. Individual neurons in this cortex only respond to particular stimuli in a small region (receptive field), and neurons in next layers use broader regions and respond to more complex stimuli. That is, simple patterns are detected by the first layers, while the last layers are specialized in the most complex ones. There is a relationship between the speed of an object being seen and the size of the receptive fields: fast moving objects require greater receptive fields. The whole visual field is covered by partially overlapped receptive fields.
The topology of a CNN is like that of a MLP but usually with much more hidden layers, and these layers have heterogeneous capabilities. The main layers that can be found in CNNs are: the convolution layers (where a learnable convolution kernel or filter is applied to all the data, so feature maps invariant to translation are obtained), the pooling layers (akin to a non-linear down-sampling: reducing the size of the data by selecting part of it; for example, the maximum value when using “max pooling”), and the fully connected layers (equivalent to a MLP).
Due to the higher complexity of CNNs brought along by the numerous layers, connections and neurons, the concept of “building block”, which already existed in monolithic, hybrid, modular or ensembles of shallow ANNs, became more popular. A building block is a combination of layers, connections, and neurons with a particular functionality. This way, CNNs could be built by combining different building blocks with heterogeneous characteristics and capabilities.
Multiple CNN variants have been developed such as LeNet, Visual Geometry Group (VGG), GoogLeNet, Residual Network (ResNet) and U-Net [103]. Among their differences: usage of building blocks with advanced characteristics, dissimilar network structure, connections, quantity of parameters, neurons, or layers, etc.
Due to the presence of fully connected layers, which are prone to overfitting data, regularization methods are often utilized, such as dropout [104] (temporarily ignoring neurons), DropConnect [105] (each connection can be dropped temporarily), and weight decay parameters.
CNNs are quite robust to translations, rotations and scaling of the input data, a characteristic very useful for image and video recognition, and image classification. Pooling layers located after the convolutional ones are the main reason for this robustness. Due to the huge quantity of hyperparameters that these DNNs have and the common lack of enough training samples, augmentation methods, especially for images, are almost always required.
Conversely and unlike other ML approaches, they frequently require less data preprocessing as some preprocessing tasks, such as feature extraction, are automatically done by themselves (in this case, filter optimization is learnt) instead of requiring hand-made filters or prior knowledge. Thanks to this, CNNs are especially suitable to process data with a spatial structure [99], and with a high degree of autonomy.
Autoencoders
Autoencoders (AEs) are unsupervised ANNs.
The topology of AEs comprises two parts [106]: the encoder, which transforms the input data by mapping them with a lower-dimensional code, and the decoder, which reconstructs the input data from its encoded version. Albeit AEs with more layers— and, hence, more powerful— exist, these parts are usually integrated into three layers [106]: input, one or more hidden layers, and output (with the same dimensions as the input one). Among the hidden layers there is the “bottleneck layer”, which has less neurons than the input or output layers. This way, this hidden layer prevents one-to-one mapping of the input into the output by forcing the compression of the input data with minimal loss of information [106].
Variations, such as Convolutional Autoencoder (CAE), Stacked Autoencoder (SAE), and Variational Autoencoder (VAE), provides additional capabilities to the original AE.
AEs are commonly utilized for dimensionality reduction because the encoder part can learn an optimal and compressed representation of the input data due to using a code with fewer dimensions than the input data.
More recently, AEs have also been used for data augmentation.
Neural ensembles
Several ML methods may be grouped, and their decisions be combined in order to achieve a better performance than each of them individually. One way of combining models is through “ensemble learning” [107], where each of them is called a “weak classifier” as it does not require to be the most optimal one.. When one or more of these weak classifiers are based on ANNs or DNNs it is called a “neural ensemble”. The idea behind ensembles is that each weak classifier will train with a smaller and probably easier subset of the input data [95].
Two strategies are required to construct an ensemble [95, 107]: combination strategy, and weak classifiers’ selection strategy.
Regarding the first strategy, the main goal is to cancel out incorrect decisions while endorsing correct ones. A simple or weighted voting scheme is frequently utilized to combine the outputs of all the weak classifiers when a non-trainable combination strategy is used. In the weighted case, less importance is given to the decisions made by bad classifiers, whereas in the simple case, all have the same.
Regarding the second strategy, the performance of an ensemble is usually better when its weak classifiers make dissimilar errors, that is, they are diverse. Several ensemble strategies have been proposed in the literature to increase diversity such as bagging [108], boosting (among others, Adaptive Boosting (AdaBoost) [109] and Extreme Gradient Boosting (XGBoost) [110]), and Random Forest (RF) [111]. A RF is a special case of non-neural ensemble learning where the weak classifiers are, generally binary, decision trees (DTs) that are trained with random partition of the input data. A DT is a ML method, often used in business and industry due to its simplicity and intelligibility. A DT is made of nodes and branches. A node can be internal (where a decision is made according to the values of an attribute of the input data) or leaf (in the last level; indicates the final output of the DT after all attributes were considered). A branch is the path connecting two nodes, and it indicates the outcome of the decision made in the higher-level node).
RESULTS
Two different families of studies have been located in current research works related to AD, MCI, ANNs, and DNNs: cross-sectional and longitudinal. In the first one, also known as transverse or prevalence studies, there are systems for the diagnosis of MCI or AD in actual patients, frequently distinguishing them from CN subjects. Several severity degrees of AD or MCI might be used instead, such as mild AD, severe dementia, EMCI and LMCI, among others. The second family includes studies that use, unlike the previous one, repeated observations of both the same clinical criteria and subjects over a period of time, normally months apart. Prognostic studies might be included in this family too. Prognostic and longitudinal studies will be analyzed in the next section.
The selected articles have been categorized, firstly, by the family of studies they belong to, cross-sectional or longitudinal. Due to the large number of cross-sectional articles, these works were directly grouped according to the type of the input data, multimodality ones having their own subsection. Longitudinal studies, as there were fewer, did not require this grouping. In each modality works were commented according to the deepness of the winner neural method that was used, shallow or deep ANNs.
In the summary tables included in this section after the Databases subsection, the selected articles were grouped according to the deepness of the winner neural model and also by the classification task they tackled. In each of these subgroups they were sorted first by year and then by the first author’s last name. Besides, when a comparison between different methods was conducted, only results for the best method (highlighted in bold in the “Methods” column) have been indicated. In that same column, modular methods will be denoted with “+” symbols between their modules.
Databases
Knowing the characteristics of the currently available data repositories is key for researchers, especially for new ones on the topic. Therefore, the most used non-private databases found in works mentioned throughout the next two sections are described in Table 1, whose second part contains other non-private databases not found in our selected literature.
Table 1
Non-private databases with AD, MCI or CN subjects that were used by more than one of the selected articles, sorted by popularity. In the lower part of the table, other similar non-private databases but that were not used in the selected literature
NS, Neuropsychological scales; NI, Neuroimaging; G, Genetic; BS, Biospecimens or biological samples; M/S, Human gait, movements, or speech; N/A, Not Available.
According to the reviewed articles, AD-related databases can be grouped by its data accessibility: public and private. The main advantages of using public databases are: reproducibility of the experiments, probably high quality as they are built by clinicians and other medical experts, big number of patients, generally multisite, and, as they are already built, other researchers do not need to build one on their own. More often than not, public databases require that researchers comply with some norms and accept some sort of Data Use Agreement or similar legal documents before having access to the data, while using them and before publishing related works. In Table 1, such databases have been indicated by the word “Authorization” in the “Access” column. Alzheimer’s Disease Neuroimaging Initiative (ADNI) and Open Access Series of Imaging Studies (OASIS), the most popular public databases in AD diagnosis when neuroimaging data are used, are good examples of these requirements. Privacy of the patients is frequently safeguarded by anonymizing their identification data.
Fig. 4
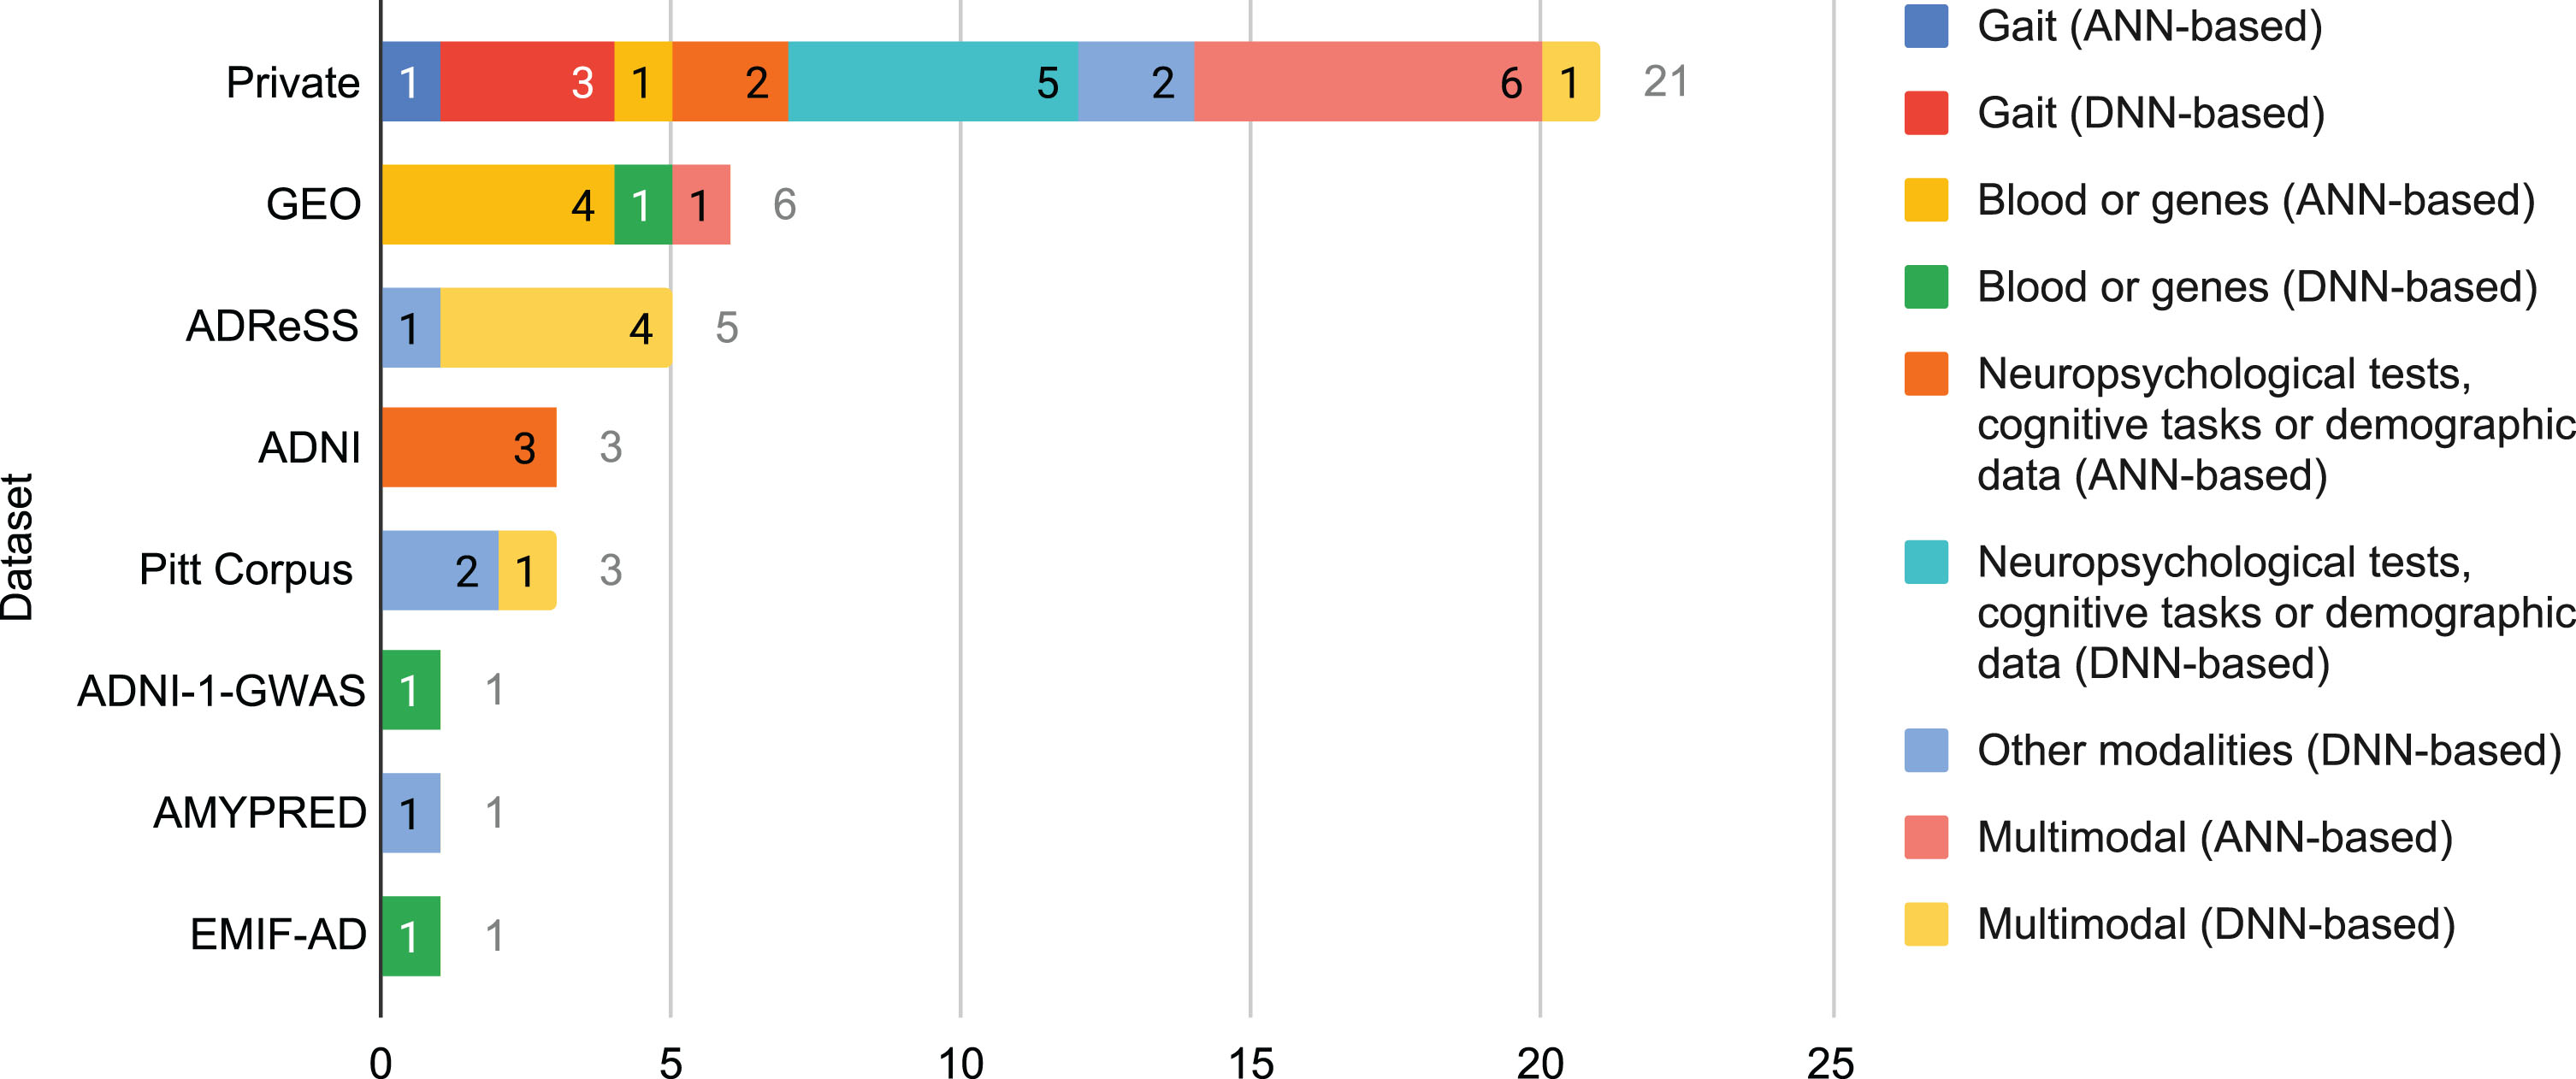
Number of times that a database was used in the selected literature for each combination of modality and neural family.
On the other hand, private databases are built by certain researchers with data from patients with whom they have direct contact in real life, often in hospitals and nursing homes. They are rarely multi-site because building a database is a time-consuming, sometimes expensive, process. Unlike public databases, they are usually inaccessible to external researchers. Customization is their main advantage as every property of the database can be selected by those who build it, such as the clinical assessments that are carried out, the technologies and equipment that are used, the quantity and characteristics of the subjects, and the type of study, among others. Unfortunately, a high customization may reduce the generalization power of the findings of the research works based on such private databases.
In the selected literature, Fig. 4, private databases were utilized the most (over 52% of the times a database was used), followed by far by Gene Expression Omnibus (GEO) and ADReSS (almost 15% and over 12%, respectively). ADNI and Pitt Corpus stay far behind them with above 7% each. Reasons for such results might be deduced from the aforementioned characteristics of public and private databases.
Cross-sectional studies based on neuropsychological tests, cognitive tasks, and demographic data
In Table 2, it can be noted that the selected studies based on DL only made use of a single scale, unlike ANN-based ones, where several scales or combining scales and demographic data were common. About the origin of the input data, private datasets were the most common with both neural families. ADNI was also used with shallow ANNs.
Table 2
Summary of the selected cross-sectional studies whose method was based on shallow or deep ANNs and only used neuropsychological scales or cognitive tasks and demographic data. When a comparison between different methods is conducted, only results for the best method (in bold) are indicated. Modular methods are indicated with “+” symbols between their modules in the “Methods” column
| Reference | Dataset | Features | Methods | Results |
| Based on Artificial Neural Networks | ||||
| CN-MCI | ||||
| [113] | ADNI: 166 CN, 159 EMCI, 137 LMCI | 3 scales, 2 demographic | CPN; DT; RF; SVM; NB; MLP; ensembles | CN-EMCI-LMCI 0.58 ac, 0.78 AUC |
| [118] | ADNI: 203 CN, 128 MCI | 3 scales, 2 demographic | CPN | 0.87 ac, 0.9 se, 0.85 sp, 0.95 AUC |
| CN-MCI-AD | ||||
| [115] | Private: 41 CN, 8 MCI, 8 AD | 1 cognitive task, 8 scales | MLP; SVM; RF; AB; GB | 0.93 ac, 0.94 se, 0.93 sp |
| [119] | Private: 1227 CN, 300 MCI, 227 AD | 62 items from 4 scales, 8 demographic | ANN; LR; SVM; RF; XGBoost; LASSO; Best subset | 0.89 ac, 0.6 se, 0.94 sp, 0.92 AUC |
| MCI-AD | ||||
| [56] | ADNI-2 : 150 AD, 345 MCI | 6 items from 3 scales | MyGNG (GNG + perceptron) | 0.81 ac, 0.89 se, 0.95 AUC |
| Based on Deep Neural Networks | ||||
| CN-AD | ||||
| [122] | Private: 59 CN, 59 MCI, 30 AD | 1 scale | CNN | CN-AD 0.89 ac, 0.82 se, 0.95 sp, 0.94 AUC |
| CN-MCI | ||||
| [122] | Private: 59 CN, 59 MCI, 30 AD | 1 scale | CNN | CN-MCI 0.88 ac, 0.85 se, 0.91 sp, 0.91 AUC |
| CN-MCI-AD | ||||
| [120] | Private: 535 CN, 1687 MCI, 678 very mild dementia, 1812 mild dementia, 1309 moderate dementia, 680 severe dementia | 1 scale | DNN; MLP; GCForest; RF; AdaBoost; LogitBoost; NB; SVM | 0.88 ac, 0.85 F1 |
| [121] | Private: 1649 CN, 453 MCI, 107 AD | 1 scale | CNN | 0.88 ac, 0.78 se, 0.78 AUC |
| nonCN-CN | ||||
| [121] | Private: 1296 CN, 913 non-CN | 1 scale | CNN | 0.86 ac, 0.85 se, 0.85 AUC |
Artificial neural network approaches. Based on the findings (mainly, that using oversampling and not using the volume of the hippocampus were considered optimal) of their previous research [112], another work from these authors compared counterpropagation networks (CPNs) with other ML systems [113]. Class balancing techniques were analyzed by comparing the performance values when the classifiers were trained with the original unbalanced data, with one where an undersampling technique was applied, and with another one balanced with the oversampling method called Synthetic Minority Oversampling Technique (SMOTE) [114]. A CPN achieved 0.8 AUC for CN-MCI, whereas a RF, an ensemble of decision trees (DTs), was the best classifier for CN-EMCI-LMCI, 0.78 AUC. In both classification tasks the oversampling variant outperformed the others. In CN-EMCI-LMCI, the ensembles family, such as RFs, committees, or other mixes of classifiers, finished among the ten best configurations for any of the dataset variants.
Almubark et al. [115] found that combining “Spatial Inhibition of Return”, a 5-minute cognitive task, with some neuropsychological scales was optimal. This cognitive task comprised three visual stimuli, two cues and a target, presented serially and the patient needed press the button corresponding to the target stimuli. SMOTE [114], an oversampling technique that augments the minority class, was used. A fully connected MLP outperformed the rest of ML algorithms, including several ensembles methods: RF, AdaBoost and Gradient Boosting (GB). However, sensitivity dropped to 0.67 when this winning system was further tested with an independent dataset, where subjects were demographically different from those in the main dataset. A Modular Hybrid Growing Neural Gas (MyGNG) is a novel neural approach where a Growing Neural Gas (GNG) [116] is used for clustering the input data, whereas a perceptron, for labeling [56]. Fast Correlation-Based Filter (FCBF) was used for feature ranking and selection [117]. Neuropsychological tests (some subscales of MMSE and its total score, a subtest of ADAS, and a subscale of FAQ) and a demographic data (patient’s age) as input yielded high AUC scores. Some of these authors deepened in their previous works with CPNs and tested this neural network even more [118]. A similarly high performance was achieved with different scales and demographic data: the total scores of FAQ, MMSE, and GDS, age and years of education. By means of a wrapper method and grid search they found out that the best combination of features was age, MMSE and FAQ.
Seventy non-imaging features were extracted from two different private datasets in [119]. The ANN that was tested, which was the best in validation with 0.94 AUC, was a feedforward neural network with a single layer of hidden neurons and L1 weight regularization. However, in testing, the winner model was a SVM with polynomial kernel.
Deep neural network approaches. Few researchers made use of DNNs together with solely demographic data, cognitive tasks, or neuropsychological scales (Table 2).
Surprisingly, utilizing just one informant-based questionnaire, the History-based Artificial Intelligent Clinical Dementia Diagnosis System (HAICDDS) scale, Zhu et al. [120] obtained good results in a multi-class problem. Although these authors did not describe it deeply, HAICDDS consists of 50 questions in 7 domains, including memory, language and some related to daily activities. Information gain was used for feature selection. They enrolled a very large number of participants, which is uncommon in the overall selected literature. Their winner classifier, a DNN, was a multi-hidden layer feedforward neural network.
The “Rey Complex Figure” scale comprises drawing a difficult set of figures, whether with a tablet or pen and paper. This test was used by Simfukwe et al. [121] as the input for their DL solution. As two different types of classification problems were dealt with, two datasets were built: 1,296 CN and 913 non-CN subjects for the first study, whereas 1,649 CN, 453 MCI, and 107 AD patients for the second one.
This same assessment but referred to as the “Rey Osterrieth Complex Figure” was used by Cheah et al. [122]. In order to keep the dataset class balanced, only 30 CN subjects were used for the CN-AD classification problem. The delayed recall task discriminated the different classes of subjects better than the copy or the immediate recall tasks.
Cross-sectional studies based on gait
Only private datasets were utilized by researchers working with gait data, which may also explain the low number of subjects included in each study (Table 3). CNNs and MLPs (shallow or deep) were the most optimal methods.
Table 3
Summary of the selected cross-sectional studies whose method was based on shallow or deep ANNs and only used data not related to neuropsychological scales, cognitive tasks, or demographics (according to the studies selected in this work, that means gait, blood, genes, eye, transcripts, and speech). When a comparison between different methods is conducted, only results for the best method (in bold) are indicated. Modular methods are indicated with “+” symbols between their modules in the “Methods” column
| Reference | Dataset | Features | Methods | Results |
| Based on Artificial Neural Networks | ||||
| CN-AD | ||||
| [128] | Private: 23 CN, 14 non-AD dementia, 33 AD | Blood | BPN; NB | 0.86 ac, 0.83 se, 0.88 sp |
| [130] | GEO: 248 CN, 293 AD | Blood | RF + ANN | 0.86 AUC |
| [131] | GEO: 359 CN, 305 AD | Blood | RF + ANN | 0.85 AUC |
| CN-MCI-AD | ||||
| [129] | GEO: 238 CN, 189 MCI, 284 AD | Blood | SVM; Adaboost; RF; MLP | 0.92 ac |
| nonAD-AD | ||||
| [127] | GEO: 90 AD, 90 non-AD | Blood | MLP; LR; LDA; DT; NB; kNN; RF; SVM | 0.89 ac, 0.95 se, 0.93 AUC, 0.90 F1, 0.86 pr |
| AD | ||||
| [123] | Private: 7 early AD, 18 middle AD, 10 late AD | Gait | MLP; DT; SVM; RF | 0.83 ac |
| Based on Deep Neural Networks | ||||
| CN-AD | ||||
| [130] | Pitt Corpus: 99 CN, 99 AD | Transcripts | DNNLM; D2NNLM | 0.83 AUC |
| [128] | EMIF-AD: 242 CN, 115 AD | Blood | DL; XGBoost; RF | 0.88 AUC |
| [129] | GEO: 74 CN, 87 AD | Gene expressions | AE + IDBN | mRmR-WPSO-AE + IDBN: 0.97 ac, 0.95 se, 0.96 sp, 0.95 F1 |
| [120] | Private: 100 CN, 100 AD | Gait | CNN | 0.6 se, 0.75 F1, 1 pr |
| [133] | Private: 102 CN, 108 AD | Eye | CNN + FCN + FCN; kNN; SVM; VGG; ResNet | 0.85 ac, 0.89 se, 0.98 AUC, 0.88 F1, 0.87 pr |
| CN-MCI | ||||
| [130] | Pitt Corpus: 19 CN, 19 MCI | Transcripts | DNNLM; D2NNLM | 0.8 AUC |
| [131] | Private: 30 CN, 25 MCI | Speech | Multilayer network; Deep multilayer network | 0.75 ac, 0.49 se, 0.65 F1, 1 pr |
| CN-MCI-AD | ||||
| [119] | Private: 80 CN, 54 MCI, 19 AD | Gait | MLP DNN; CNN | CN-MCI-AD 0.86 se, 0.87 F1, 0.88 pr |
| AD | ||||
| [118] | Private: 7 early AD, 18 middle AD, 10 late AD | Gait | CNN; MLP; SVM, RF; RT | 0.91 ac (total) |
| MCI-AD | ||||
| [134] | AMYPRED: 71 CN, 62 nonCN | Speech | ParaBLEU | MCI-mildAD 0.65 se, 0.95 sp, 0.85 AUC |
| nonAD-AD | ||||
| [132] | ADReSS: 78 AD, 78 non-AD | Speech | VGGish + DemCNN; VGGish + SVM; VGGish + kNN; VGGish + MLP; VGGish + Perceptron | 0.63 ac, 0.63 se, 0.63 F1, 0.63 pr |
| nonCN-CN | ||||
| [127] | ADNI-1-GWAS: 280 CN, 528 non-CN | Gene array genotyping data | VAE + SVM + RNN; VAE + SVM + DNN; VAE + SVM + CNN; VAE + SVM + LR; VAE + SVM + SVM; VAE + SVM + RF | 0.6 AUC |
Artificial neural network approaches. In [123], of the 35 AD subjects, 7 were early AD; 18, middle-stage AD; and 10, late-stage AD, all of them from a daycare center. Gait was captured via Android smartphones’ accelerometers. Although categorizing different severity levels of AD is a rather difficult classification task, their system performed well.
Deep neural network approaches. As with shallow ANNs, private datasets were the most frequent when gait data was required [124–126]. In the first work, built-in sensors of cell phones were utilized to obtain the gait data whereas different in-home sensors were preferred in the latter two works.
Accelerometers from Android devices were utilized to monitor the gait of 7 early AD, 18 middle-stage AD and 10 late-stage AD in a daycare center in [124]. Although a CNN achieved the best overall classification results, an MLP surpassed it for early and middle stages.
“TraMiner” is a novel trajectory mining system to be used in smart homes where sensor infrastructures exist [125]. Both trajectory and speed images were analyzed, and several time intervals between consecutive sensor activations were proved (from 30 s to 180 s). Combining both trajectory and speed images with an interval of 120 s was considered optimal.
The lack of proper data induced Oliveira et al. [126] to fabricate the wandering and normal movement paths required for their research, which simulate the real world. In a future work these authors will validate their system with data collected from real patients.
Cross-sectional studies based on blood biomarkers and genes
Compared to neuroimaging and neuropsychological tests, the usage of blood biomarkers can be considered a novel approach in the AD field. Genes from blood samples provided good results in different articles (Table 3). For example, in [127] a SVM trained with data obtained from genes from blood samples was marginally better than a MLP, yet they both yielded the same AUC. Among the datasets utilized by the selected articles within this group, the GEO one was the most popular.
Artificial neural network approaches. Blood serum molecules have been researched when looking for a reliable biomarker [128]. A Backpropagation Network (BPN) of 15 and 13 neurons in their first and second hidden layers, respectively, was the optimal ANN: 0.71 accuracy, 0.83 sensitivity and 0.63 specificity. However, a Naïve Bayes (NB) outperformed it: 0.86 accuracy, 0.83 sensitivity and 0.88 specificity. Despite the small dataset, it included non-AD dementia, which was infrequent in the selected literature.
Sh et al. [129] extracted individualized blood messenger ribonucleic acid (mRNA) expression data from the GEO database. These data were analyzed with the xCell webtool, which can be found at https://comp health.ucsf.edu/app/xcell, to get blood cell composition and quantitative data. They discovered that 355 out of 5,625 mRNA features were optimal. These authors concluded, first, that one of the reasons for AD might be the homeostasis of granulocyte macrophage progenitor, and second, that there might be a relation between AD and the homeostasis of natural killer T cell.
Three articles included in this review utilized a RF for feature selection and an ANN with only 5 hidden neurons for classification [130–132]. According to the descriptions and figures with the ANN diagrams in those articles and after checking the documentation of the R package that they used for ML, either those figures were incorrect, or those authors have erroneously used the word “layers” instead of “neurons”. He et al. [130] concluded that, after screening seven hub genes from AD-related differentially expressed genes, hub genes are key in the immune microenvironment. The RF in [131] was able to screen six important genes, critical for separating AD and normal samples. The article by Wang et al. [132] will be described in subsection Cross-sectional studies based on multimodal data as multimodal data were used.
Deep neural network approaches. The genome-wide association study (GWAS) of the ADNI dataset has hardly ever been used in the selected literature. Maj et al. [133] did use it in order to study multi-tissue imputed transcriptomic profiles. A combination of a VAE and a SVM was used for feature selection: the activations of the hidden layer of the VAEs were the input to 42 SVMs, one per tissue. Each SVM predicted whether the sample input to the VAE belonged to a specific tissue. A RNN, built with 2 LSTM and a dense layer, was better than 2 CNNs and 2 Dense Neural Networks. Other ML algorithms were also tested but obtained inferior classification results.
The European Medical Information Framework for AD (EMIF-AD) dataset was used in [134]. Unfortunately, no design nor parameters of the classifiers— a DNN, a XGBoost and a RF— were indicated in this short report. These authors found out that using plasma metabolites not only gave better performance than using CSF measures of Aβ, p-tau and t-tau, but also it is less invasive.
An Improved Deep Belief Network (IDBN) was developed and yielded good performance in [135]. The most relevant features were selected by combining the minimum Redundancy and maximum Relevance (mRmR) method, a Wrapper-based Particle Swarm Optimization (WPSO), and an AE.
Cross-sectional studies based on other modalities
In Table 3, several studies that could not be grouped in previous modalities are shown. That is, among the articles selected for inclusion in this review, those that only made use of data from speech, speech transcripts or eye tracking while performing a visual task. These studies were based on DL methods as no works based on shallow ANNs were found in the literature. Conversely, several works based on both neural families were found where some of these modalities were used in combination with others. These studies, as they are based on multimodal data, are analyzed in subsection Cross-sectional studies based on multimodal data.
Deep neural network approaches. Orimaye et al. [136] analyzed the effectiveness of two DNNs: the Deep Neural Networks Language Model (DNNLM), a deeper version of the NNLM with more than one hidden layer with nonlinear activations, and the Deep-Deep Neural Networks Language Models (D2NNLM), that combines higher order n-grams and the DNNLM. Only the transcripts of verbal interviews and not the speech version were utilized. In order to keep the datasets class-balanced, 198 subjects were selected for CN-AD, whereas 38 for the CN-MCI classification problem (that is, an undersampling method was applied to the CN class).
Between 1 and 10 hidden layers had the MLP used by Themistocleous et al. [137] in their speech-based diagnostic system. Models with 6 and more hidden layers performed better and more stable, especially when crossvalidation and not a training-testing data partition was used.
Also working with speech data were Chlasta et al. [138], who tested several combinations of “VGGish”, a pretrained model based on VGG that was used as a feature extractor, and different families of classifiers. The winner classifier, DemCNN, was a custom raw-waveform-based CNN.
Fristed et al. [139] developed a mobile app that made use of the Automatic Story Recall Task (ASRT), a remotely self-administered task about recalling a short story (that is, recorded speech analysis). Patients were obtained from the Amyloid Prediction in Early-Stage Alzheimer’s Disease From Acoustic and Linguistic Patterns of Speech (AMYPRED). Both short and long ASRT triplets were used as input and immediate and delayed recalls were analyzed. Similar results were yielded with both long and short ASRT triplets by the “edit encoder” of the ParaBLEU model, a DNN of the transformers family, that they utilized.
Proposed in [140], the “NeAE-Eye” model consisted of three main modules: an “inner autoencoder” (built with a shallow convolutional network with 8-layers), an “outer autoencoder” (with a fully connected neural network, FCN), and a “classifier” (3-layers fully connected network). Using eye-tracking data, this nested AE model surpassed the other methods on a 3D Visual Paired Comparison task.
Cross-sectional studies based on multimodal data
There are differences between the modalities utilized in the articles where a shallow ANN was used and those in the DL ones (Table 4). Almost all works from the latter group made use of speech and transcripts derived from speech, whereas in the first group the modalities were more diverse.
Table 4
Summary of the selected cross-sectional studies whose method was based on shallow or deep ANNs and used multimodal input data. When a comparison between different methods is conducted, only results for the best method (in bold) are indicated. Modular methods are indicated with “+” symbols between their modules in the “Methods” column
| Reference | Dataset | Features | Methods | Results |
| Based on Artificial Neural Networks | ||||
| CN-AD | ||||
| [141] | Private: 60 CN, 60 AD | Blood, 1 scale, 1 demographic | BPN | 0.93 ac, 0.90 se, 0.95 sp, 0.93 AUC |
| [142] | Private: 37 CN, 22 MCI, 37 AD | Gait, Eye | SVM; DT; MLP | 0.78 ac, 0.71 se, 0.84 sp, 0.78 AUC |
| [132] | GEO: 302 CN, 323 AD | Blood, Genes | RF + ANN | 1 AUC |
| CN-MCI | ||||
| [142] | Private: 37 CN, 22 MCI, 37 AD | Gait, Eye | SVM; DT; ML | 0.77 ac, 0.57 se, 0.9 sp, 0.74 AUC |
| [143] | Private: 18 CN, 22 MCI | Speech, Transcripts | MLP; DT; SVM; RF | 0.9 ac |
| [144] | Private: 28 CN, 21 MCI | Gait, Behavior | Fuzzy ARAM; SVM; DT; MLP; CNN; LSTM | 0.80 ac, 0.80 se, 0.80 sp, 0.76 F1, 0.73 pr |
| MCI-AD | ||||
| [142] | Private: 37 CN, 22 MCI, 37 AD | Eye, Hand | SVM; DT; MLP | 0.61 ac, 0.39 se, 0.75 sp, 0.66 AUC |
| Based on Deep Neural Networks | ||||
| CN-AD | ||||
| [150] | Pitt Corpus: 243 CN, 307 AD | Speech, Transcripts | Siamese BERT + SVM; Siamese BERT + MLP; Siamese BERT + RF; Siamese BERT + kNN | 0.78 ac, 0.79 se, 0.76 F1, 0.73 pr |
| CN-MCI | ||||
| [145] | Private: 12 CN, 11 MCI | Transcripts, Keystrokes | CNN + LR; CNN + RF; CNN + kNN | 0.80 ac, 0.60 se, 0.90 sp, 0.75 AUC |
| nonAD-AD | ||||
| [146] | ADReSS: 78 AD, 78 non-AD | Speech, Transcripts | LDA; kNN; DT; SVM; RF; LSTM; CNN | 0.85 ac |
| [147] | ADReSS: 82 AD, 82 non-AD | Speech, Transcripts | CNN + LSTM | 0.73 ac |
| [148] | ADReSS: 78 AD, 78 non-AD | Speech, Transcripts | MobileNet; YAMNet; Mockingjay; BERT | Audio: 0.66 ac; Text: 0.82 ac; Audio + Text: 0.83 ac |
| [149] | ADReSS: 78 AD, 78 non-AD | Speech, Transcripts | BERT + ViT + Co-attention | 0.9 ac, 0.89 se, 0.91 sp, 0.9 F1, 0.91 pr |
Artificial neural network approaches. A multimodal approach where different mixtures of blood measurements, patient’s history and demographic data were tested was found [141]. Using just scores of activities of daily living, creatinine, 5-hydroxytryptamine, age, dopamine and aluminum allowed a BPN to yield the best performance results.
Staal et al. concluded that the proposed eye-hand coordination task may assess well the patient’s visuomotor performance, which has the potential to become a helpful approach to distinguish CN from MCI or early AD [142].
On the other hand, speech was much less used with shallow ANNs than with their deep counterparts. Voice commands for Alexa, Amazon’s virtual assistant, were preprocessed, and features were extracted and fed to different families of classifiers [143]. Their 2-layer ANN was third, 0.78 classification accuracy, after DT and RF, which obtained values of up to 0.9 and 0.8, respectively, although with different combination of features. These authors concluded that using Voice-Assistant Systems might be helpful for future home-based cognitive assessments.
In Teh et al.’s work [144], a Fuzzy Adaptive Resonance Associative Memory (Fuzzy ARAM) was used to classify CN and MCI patients via in-home motion sensors, contact sensors and wearable sensors for measuring gait and behavior. These behavior features included heart rate, sleep duration, TV daily usage, frequency of forgetting keys, wallet and medicine, steps, number of outings and time away from home. Fuzzy ARAM is a variant of ARAM, a predictive self-organizing neural network, that is able to deal with missing values. It is built as a pair of overlapping Adaptive Resonance Theory (ART) networks which share a single category field. Rules were extracted from the Fuzzy ARAM network, and several rule pruning techniques were compared. Antecedent pruning was the best, both with and without missing values (49 and 25 subjects, respectively). As expected, missing values degraded the performance: 0.67 versus 0.8 accuracy, 0.57 versus 0.8 sensitivity, 0.75 versus 0.8 specificity, 0.6 versus 0.76 F1, and 0.63 versus 0.73 precision.
Combining a RF for feature selection and an ANN with 5 hidden neurons (as already mentioned in subsection Blood biomarkers and genes for other articles, the authors used the word “layers” instead of “neurons” or the figures were incorrect) for classification, Wang et al. [132] identified 12 ferroptosis-related genes and built a new diagnostic model of high predictive value for AD. Although only patients from the GEO database were utilized, genes indicated by the FerrDB database, which includes ferroptosis regulators and ferroptosis-disease associations, were extracted and analyzed.
Deep neural network approaches. Ntracha et al. [145] utilized a private dataset that combined both linguistic features and keystroke dynamics in order to perform an analysis of data related to fine motor impairment and spontaneous written speech. Features for spontaneous written speech were extracted through NLP, and measured the lexical diversity, richness, and syntactical complexity of the texts. Keystroke dynamics were associated with bradykinesia, rigidity, and alternate finger tapping.
The “Cookie Theft Picture” from the ADReSS Challenge from the Pitt Corpus was the most popular dataset among the group of works where data from speech were used [138, 146–149] (Tables 3 and 4). Both the speech and the transcripts were generally exploited. Differences between those works are mostly related to the method used, where the usage of transformers was common.
Something uncommon happened in Haulcy et al. [146], where both ML approaches outperformed the DNNs.
Zhu et al. [148] analyzed different families of transfer learning models depending on the domain of the initial input data that were used for pre-training: MobileNet (image), YAMNet (audio), Mockingjay (speech), and BERT (text). The models were later fine-tuned with speech and transcripts data. Fusing text and audio features yielded slightly improved performance results. These authors also found that applying transfer learning was beneficial for most models’ performances.
Ilias et al. [149] combined a BERT with a ViT and Co-attention to successfully fulfill an AD-nonAD classification task.
Longitudinal studies
Compared to cross-sectional studies, significantly fewer articles related to prognosis, conversion or longitudinal data were found in the selected literature (Table 5). For this reason, longitudinal studies were not separated by modality into different subsections as previously done with the cross-sectional ones.
Table 5
Summary of the selected prognosis or longitudinal studies whose method was based on DNNs and did not use neuroimaging data (monomodality or multimodality). When a comparison between different methods is conducted, only results for the best method (in bold) are indicated. Modular methods are indicated with “+” symbols between their modules in the “Methods” column
| Reference | Dataset | Features | Methods | Results |
| CN-AD | ||||
| [152] | NHIS-HEALS: 452565 CN, 12516 AD, 27280 dementia | 3 past medical history, 46 psychiatric disorder, 39 neurological disorders, 9 demographic | LSTM; Cox proportional hazards | CN-AD 0.79 ac, 0.88 se, 0.79 sp, 0.91 AUC |
| [152] | NHIS-HEALS: 452565 CN, 12516 AD, 27280 dementia | 3 past medical history, 46 psychiatric disorder, 39 neurological disorders, 9 demographic | LSTM; Cox proportional hazards | CN-dementia 0.8 ac, 0.84 se, 0.8 sp, 0.9 AUC |
| nonCN-CN | ||||
| [154] | ADNI-1, ADNI GO, ADNI-2 : 36 CN, 30 nonCN | 5 scales | LSTM + MLP | 0.79 ac |
| Prognosis or conversion prediction | ||||
| [151] | MCSA: 2707 CN, 558 MCI | 8 diseases, 11 neuropsychiatric symptoms, 9 ADL, 3 demographic, 6 others | LSTM; RF | CN to MCI conversion 0.71 ac, 0.76 se, 0.75 AUC, 0.46 F1, 0.33 pr |
| [153] | ADNI GO, ADNI-2 : 221 CN, 334 MCI, 94 AD | Blood | MT-CAE; MT-LSTMAE; CNN; LSTM; Bi-LSTM; CNN + LSTM; AE + LSTM | CN to MCI conversion 1 AUC |
| [153] | ADNI GO, ADNI-2 : 221 CN, 334 MCI, 94 AD | Blood | MT-CAE; MT-LSTMAE; CNN; LSTM; Bi-LSTM; CNN + LSTM; AE + LSTM | MCI to AD conversion 0.79 AUC |
| Conversion time prediction | ||||
| [154] | ADNI-1, ADNI GO, ADNI-2 : 36 CN, 30 nonCN | 5 scales | LSTM + MLP | Prediction at month 72 0.83 ac |
| [155] | Private: 135 AD, 89 MCI | Scales, demographic | CNN + LSTM | Prediction at month 6 0.85 AUC |
Only supervised methods were found, and none of the articles were based on shallow ANNs. Models from the LSTM family were the most common.
A varied set of databases were used in the selected prognosis and longitudinal articles. ADNI was the most common by a small margin.
Fouladvand et al. [151] extracted their longitudinal input data from Electronic Health Records, for a period of 5 years and each separated 15 months. These records were related to participants from the Mayo Clinic Study of Aging (MCSA) database. Among others, diverse demographic and clinical data and Activities of Daily Living (ADL) were used in their comparison between different methods for CN to MCI progression prediction. A Denoising AE was used for representing the patient data. Applying oversampling techniques was beneficial, especially for the winner method, an LSTM. The RF was more affected by the class imbalance of the input data.
The National Health Insurance Service-Health Screening Cohort (NHIS-HEALS) dataset, built from different databases so it is extremely huge in terms of sample size, clinical variables, and time-series data, was utilized by Kim et al. [152] for their AD and dementia prediction studies. Patients in this database had different duration of the follow-up and number of periodic health examinations. In this article they differentiated between the concepts of AD and all-cause dementia. Two statistical methods, Cox proportional hazards regression models whether with baseline data or repeated measurements, could not outperform the DL approach with repeated measurements.
Two types of conversions, CN to MCI and MCI to AD, were studied in [153]. As ADNI is originally partitioned in different subsets, currently ADNI-1, ADNI GO, ADNI-2, and ADNI-3, these authors trained their model with one of these subsets while validated or tested it with another one. These authors proposed two AE-like models: the Multi-Task Convolutional AutoEncoder (MT-CAE) and the Multi-Task Long Short-Term Memory AutoEncoder (MTLSTMAE). Both consist of an encoder and a decoder. The goal of the encoder was to learn the compressed feature representation that captures the spatial and temporal information from the temporal DNA methylation profiles. On the other hand, the decoder aimed to reconstruct the temporal DNA methylation profiles based on the compressed feature representation. This feature representation was also utilized as the model input for a classifier to predict AD progression. MT-CAE and MT-LSTMAE were the best models in each conversion task dealt with, which these authors attributed to the multi-task learning characteristic: simultaneously learn the compressed feature representation and use it for the prediction. Best results were yielded when beta values, which were used to measure the DNA methylation level, were unscaled.
Mukherji et al. [154] utilized longitudinal data from the baseline, months 6, 12, 24, 36, 48, 60, and 72 to train a combination of cascaded LSTMs (one per scale) and a MLP. Input for each LSTM was data from the current time point and the output from the previous LSTM. The MLP later combined the outputs from all the last LSTMs. Their combined model had more accuracy predicting cognitive abnormality in the next 4 years than in 2 (0.83 versus 0.79), whereas the opposite happened when predicting cognitive normality (0.83 versus 0.87). In diagnosis, the model at month 48 achieved better accuracy values than at 72 : 0.79 versus 0.78.
Zheng et al. [155] investigated if the prediction of cognition improved or not after 3 or 6 months. Unlike other works, only demographic data, clinical features, and time dependent neuropsychological scales were used with their modular models. Two versions, both built with a CNN followed by a LSTM, were tested, one of them with a “withdrawal procedure” that simulated a missing follow-up. Impact of the withdrawal of data on the AUC was moderate. At 6 months the mean AUC was far superior to at 3 months: 0.85 versus 0.74.
DISCUSSION
After collating, summarizing, and analyzing all the bibliography that met our selection criteria, several considerations and recommendations arise, which will be discussed below. Similarly, some possible future research directions could be inferred from our investigation. Several conclusions and future works are indicated at the end of this section.
Type of study
Cross-sectional studies were five times more common than longitudinal ones: 41 versus 8.
The number of cross-sectional studies found in the selected articles drastically increased in the last two years (Fig. 2).
Neural computation methods
Except with the “Other modalities” group, where only DL approaches were found, the number of cross-sectional studies based on ANNs or DNNs was generally similar, even year after year.
Conversely, only longitudinal studies based on DNNs were discovered in the selected articles, where the most common method was the RNN family.
Usage of transformers was much more common in these works not based in neuroimaging due to their ample popularity in studies based on textual information and Natural Language Processing.
The CNN family was not as popular as when utilizing data obtained with neuroimaging techniques. However, it was frequently found in this review in combination with other methods (modular methods), or when neuropsychological scales or gait data were utilized.
Computational costs and neural network optimization. Transfer learning. Compared to most ANNs, DL methods suffer from extremely high computational costs, mainly due to the greater number of layers, the quantity of neurons per layer and the numerous variables that each neuron or synapse come with. Moreover, these characteristics increase the complexity of DNNs, complicating their configuration so that they perform optimally in the desired task. “Transfer learning” is a method whose main purpose is to reduce the training times by using the weights of a DNN pretrained on a dataset and for a task as the initial weights of another DNN aimed to work in a different yet related task. Parameter tuning and better performance results are common when using transfer learning. The main risk of this method is wrongly considering both tasks as similar.
Regarding computational costs, network optimization and transfer learning, authors in this review rarely reported the training time and number of parameters of their models. Mentions to transfer learning were scarce too, probably on account of the reduced usage of CNNs, compared to what happens when neuroimaging data are used.
Clinical criteria. Multimodality
Clinical criteria utilized in the selected articles were heterogeneous. Neuropsychological scales were used in all but two longitudinal articles. Multimodality was the most common approach in cross-sectional ones. The most frequent one was combining speech with transcripts.
Novel approaches were also found, such as those based on human gait, speech, and blood biomarkers. Indeed, in this review blood and genes-based studies were frequent. Several gait studies, whether alone or combined with other modalities (eye or behavior), were discovered in the selected literature. These and other novel criteria will certainly be further explored in the future so that other non-expensive, easy to use and useful criteria are found.
Classification tasks
Binary classification problems have been much more prevalent than multiclass ones in the selected literature. The variety in the former was quite wide, from the easiest and also the most common classification task, CN-AD, to a difficult and infrequent one, severity of AD.
CN-AD was the most popular classification problem, followed by CN-MCI and nonAD-AD. CN-MCI-AD was the most popular multiclass task.
Characteristics of the dataset
Research works are extremely dependent on the used dataset as it enables or hampers the tasks to be done. When shallow ANNs are used, several preprocessing stages are almost always required to become useful. Some characteristics of the datasets that investigators must consider are indicated below.
Database. Above 51% of the cross-sectional studies made use of data from a private database, 14.63% used the Gene Expression Omnibus database; 12.2%, the ADReSS one; 7.32%, ADNI or the Pitt Corpus; and 2.44%, ADNI-1-GWAS, AMYPRED, or EMIF-AD.
Half of the longitudinal studies made use of data from ADNI; 25%, NHIS-HEALS; and 12.5% private or MCSA.
GEO was very popular in studies within the “blood and genes” group.
Similarly, the ADReSS challenge database was common in speech and transcripts-based studies.
ADNI was the most utilized database when shallow ANNs and neuropsychological tests were used. On the contrary, in that modality private ones were the most frequent in articles related to DNNs.
Class distribution. Class balancing methods. In order to avoid that a classifier focuses on the majority class (that with the most samples) and ignores the minority and underrepresented classes, class balancing techniques are usually applied. This way, the ratio between all the classes nears 1 : 1. These methods can be divided into oversampling and undersampling, whether they increase the minority class or reduce the majority one, respectively. Examples of oversampling techniques are SMOTE [108] and Sanger Network-Based Extended Oversampling Method (SNEOM), a neural-based one [156].
In this review most of the studies were characterized by highly class unbalanced datasets. Although in the majority of articles the unbalanced classes problem was not tackled, several of them utilized undersampling techniques, especially when more than one study was done in an article.
Size of the dataset. Data augmentation techniques. As we have observed, the size of the dataset— in our case, the total number of patients in a study— have been quite variable: from a few dozens to thousands. Private datasets are almost always much smaller than some of the most popular multisite databases. As it happens in other areas, the more samples the dataset used has, not only the higher quality the research should be but also the more generalist their findings and conclusions should be.
Unlike what is common when using neuroimaging data, there was no usage of data augmentation techniques in the selected articles. The purpose of such methods is to fabricate new input data by introducing changes in the original samples. They increase data diversity and, at the same time, decrease overfitting too due to the big differences between the number of parameters of the model and the quantity of samples.
Missing values. Imputation methodologies. Missing values, more often than not, hamper many preprocessing, classification, regression and clustering methodologies. Therefore, this is a delicate issue that researchers should tackle. Many imputation methods can be found in the literature [157, 158], being the simplest one to just ignore any sample with missing values, which may have an important negative impact in the final number of samples that are usable, key in clinical research.
Authors of the selected articles rarely mentioned the existence of missing values in the used datasets. Two reasons might explain this: or the problem did not exist in the original dataset or samples with missing values were simply ignored and, hence, probably not reported by those authors. A few articles utilized imputation methods based on substituting with a meaningful value for the class of the sample with missing values.
Performance metrics
Using accuracy as the evaluation metric is problematic, especially with unbalanced data, a quite frequent situation in clinical studies. Accuracy tends to be over-optimistic in such cases. Consequently, we recommend choosing AUC, or the combination of sensitivity— also known as true positive rate or recall— with either specificity or precision, as they allow direct comparisons between the performance results of different research. If classes are imbalanced another interesting metric is the “balanced accuracy”, which also works with multiclass classification and, unlike F-score, does consider the quantity of true negatives.
Most research works included in this review published their results in two or more of these performance measurements, as we have shown in most tables throughout this article.
Unlike with what has been frequently found when neuroimaging was used, no clear advantage of DNNs over ANNs in terms of performance metrics’ values has been found.
Limitations of the selected studies
In general, the selected studies are characterized by several limitations, affecting the reproducibility of their experiments: using private databases (occurred in more than half of the selected studies), the specific development environment (such as software versions) is sometimes not mentioned, few articles did not indicate the values of the ANN hyperparameters that were utilized, and some of them only made use of one performance metric (even sometimes using not the most appropriate one due to working with class unbalanced datasets).
Conclusions and future works
For this review we have collected and studied the modalities that have been used in the last years for the diagnosis and prognosis of AD and its early stages, principally MCI. Forty-two cross-sectional and longitudinal articles complied with our selection criteria. The final number of studies included in this systematic review increased to 49 when the different classification tasks tackled in each of the articles were used to separate them so that fairer comparisons between similar ones could be carried out. Works from January 2012 to the end of 2022 were selected in order to check if the introduction of CNNs combined with neuroimaging data, which happened in that period and became the state-of-the-art, had a negative impact on the usage of modalities different to medical imaging. We found that such situation did not happen because, especially in the last 2 years, the quantity of articles increased, and even other modalities popularized or began being utilized. The number of studies based on shallow ANNs was similar to that of DNNs. Almost 32% of the cross-sectional studies utilized multimodal data, being more common in binary classification problems or with shallow ANNs. Usage of data from gait and eye movements explains the ample use of private databases in cross-sectional studies. As in longitudinal ones these modalities were not used, non-private databases were more common. Almost 54% of the cross-sectional studies included in this review focused on separating AD patients from healthy ones or the latter from MCI subjects.
There are two major limitations of our review process that could be addressed in future works. First, in this review only the PubMed database was used, whereas only a limited manual citation searching in other databases was done. Second, discarding non-English works probably reduced the number of studies to be analyzed. A solution for both limitations is to use less restrictive exclusion criteria on more databases.
Researchers from many fields will continue investigating AD and other dementia, even after their cures are found. Future works will find new AI techniques more convenient than current DNNs, even though some of them have yielded superb results when combined with neuroimaging data. Works with the previous characteristics will become even more common than nowadays are. RNNs and transformers will increase their popularity and effectiveness in the future works based on speech and longitudinal data. Modular approaches and ensembles will provide a big increase in performance, possibly due to some of their components being based on DL. Approaches based on ontogenetic ANNs will again demonstrate that good performance results can be yielded in complex classification tasks despite using non-neuroimaging data. Although works with modalities different to medical imaging are currently not as popular as the latter, the usage of multimodality will spread, probably combining both neuroimaging and non-neuroimaging data. This will be especially interesting with the appearance of novel biomarkers, which should be characterized by not being invasive nor expensive while providing good diagnostic power. On the other hand, efforts will be made to build an international and multisite database, which will include multimodal data from cognitively normal subjects and patients with different AD severity levels including prodromal stages. This huge database will be non-private, and all participating sites will use the same protocols. This database will boost and have a positive impact on AD research, especially in terms of easier access to medical data and better reproducibility. Finally, future works should be focused on determining a biological and cognitive signature of AD that would increase the prognostic and diagnostic ease of this pathology, using methods based on self-organizing systems for the detection of patterns leading to the discovery of the sought-after signature.
AUTHOR CONTRIBUTIONS
Ylermi Cabrera-León (Data curation; Investigation; Methodology; Visualization; Writing – original draft); Patricio García Báez (Conceptualization; Writing – review & editing); Pablo Fernández-López (Supervision; Writing – review & editing); Carmen Paz Suárez-Araujo (Conceptualization; Funding acquisition; Project administration; Supervision; Writing – review & editing).
ACKNOWLEDGMENTS
We would like to thank the Editors and Reviewers for their valuable comments and suggestions, which helped us to improve the quality and usefulness of this systematic review.
FUNDING
This work was funded by the Consejería de Vicepresidencia Primera y de Obras Públicas, Infraestructuras, Transporte y Movilidad del Cabildo de Gran Canaria under Grant Number “23/2021”. The funding agency had no role in the design of the study; in the collection, analyses, or interpretation of data; in the writing of this manuscript, or in the decision to publish the results.
CONFLICT OF INTEREST
The authors have no conflict of interest to report.
DATA AVAILABILITY
Data sharing is not applicable to this article because no datasets were created or used during this work.
REFERENCES
[1] | Korolev IO ((2014) ) Alzheimer’s disease: A clinical and basic science review. Med Stud Res J 04: , 24–33. |
[2] | McKhann GM , Knopman DS , Chertkow H , Hyman BT , Jack CR Jr , Kawas CH , Klunk WE , Koroshetz WJ , Manly JJ , Mayeux R , Mohs RC , Morris JC , Rossor MN , Scheltens P , Carrillo MC , Thies B , Weintraub S , Phelps CH ((2011) ) The diagnosis of dementia due to Alzheimer’s disease: Recommendations from the National Institute on Aging-Alzheimer’s Association workgroups on diagnostic guidelines for Alzheimer’s disease. Alzheimers Dement 7: , 263–269. |
[3] | Alberca Serrano R , López-Pousa S (2011)Enfermedad de Alzheimer y otras Demencias, Editorial Médica Panamericana. |
[4] | McKhann G , Drachman D , Folstein M , Katzman R , Price D , Stadlan EM ((1984) ) Clinical diagnosis of Alzheimer’s disease: Report of the NINCDS-ADRDA Work Group under the auspices of department of health and human services task force on Alzheimer’s disease. Neurology 34: , 939–944. |
[5] | Petersen RC ((2004) ) Mild cognitive impairment as a diagnostic entity. J Intern Med 256: , 183–194. |
[6] | Alzheimer’s Association ((2018) ) 2018 Alzheimer’s disease facts and figures. Alzheimers Dement 14: , 367–429. |
[7] | Wimo A , Guerchet M , Ali GC , Wu YT , Prina AM , Winblad B , Jönsson L , Liu Z , Prince M ((2017) ) The worldwide costs of dementia 2015 and comparisons with 2010. Alzheimers Dement 13: , 1–7. |
[8] | Prieto Jurczynska C , Eimil Ortiz M , López de Silanes de Miguel C , Llanero Luque M (2011) Impacto Social de la Enfermedad de Alzheimer y otras demencias 2011. |
[9] | Hampel H , Prvulovic D , Teipel S , Jessen F , Luckhaus C , Frölich L , Riepe MW , Dodel R , Leyhe T , Bertram L , Hoffmann W , Faltraco F ((2011) ) The future of Alzheimer’s disease: The next 10 years. Prog Neurobiol 95: , 718–728. |
[10] | Golbabaei S , Vahid A , Hatami J , Soltanian-Zadeh H (2016) Classification of Alzheimer’s disease and mild cognitive impairment: Machine learning applied to rsfMRI brain graphs. In 2016 23rd Iranian Conference on Biomedical Engineering and 2016 1st International Iranian Conference on Biomedical Engineering (ICBME), pp. 35-40. |
[11] | Gosztolya G , Vincze V , Tóth L , Pákáski M , Kálmán J , Hoffmann I ((2019) ) Identifying mild cognitive impairment and mild Alzheimer’s disease based on spontaneous speech using ASR and linguistic features. Comput Speech Lang 53: , 181–197. |
[12] | König A , Satt A , Sorin A , Hoory R , Toledo-Ronen O , Derreumaux A , Manera V , Verhey F , Aalten P , Robert PH , David R ((2015) ) Automatic speech analysis for the assessment of patients with predementia and Alzheimer’s disease. Alzheimers Dement (Amst) 1: , 112–124. |
[13] | Morra JH , Zhuowen Tu , Apostolova LG , Green AE , Toga AW , Thompson PM ((2010) ) Comparison of AdaBoost and support vector machines for detecting Alzheimer’s disease through automated hippocampal segmentation. IEEE Trans Med Imaging 29: , 30–43. |
[14] | Ebadi A , Dalboni da Rocha JL , Nagaraju DB , Tovar-Moll F , Bramati I , Coutinho G , Sitaram R , Rashidi P ((2017) ) Ensemble classification of Alzheimer’s disease and mild cognitive impairment based on complex graph measures from diffusion tensor images. Front Neurosci 11: , 56. |
[15] | Falahati F , Westman E , Simmons A ((2014) ) Multivariate data analysis and machine learning in Alzheimer’s disease with a focus on structural magnetic resonance imaging. J Alzheimers Dis 41: , 685–708. |
[16] | Farhan S , Fahiem MA , Tauseef H ((2014) ) An ensemble-of-classifiers based approach for early diagnosis of Alzheimer’s disease: Classification using structural features of brain images. Comput Math Methods Med 2014: , 862307. |
[17] | Cassani R , Estarellas M , San-Martin R , Fraga FJ , Falk TH ((2018) ) Systematic review on resting-state EEG for Alzheimer’s disease diagnosis and progression assessment. Dis Markers 2018: , 5174815. |
[18] | Liu X , Chen K , Wu T , Weidman D , Lure F , Li J ((2018) ) Use of multimodality imaging and artificial intelligence for diagnosis and prognosis of early stages of Alzheimer’s disease. Transl Res 194: , 56–67. |
[19] | Jo T , Nho K , Saykin AJ ((2019) ) Deep learning in Alzheimer’s disease: Diagnostic classification and prognostic prediction using neuroimaging data. Front Aging Neurosci 11: , 220. |
[20] | Alberdi A , Aztiria A , Basarab A ((2016) ) On the early diagnosis of Alzheimer’s Disease from multimodal signals: A survey. Artif Intell Med 71: , 1–29. |
[21] | Rathore S , Habes M , Iftikhar MA , Shacklett A , Davatzikos C ((2017) ) A review on neuroimaging-based classification studies and associated feature extraction methods for Alzheimer’s disease and its prodromal stages. Neuroimage 155: , 530–548. |
[22] | Pulido MLB , Hernández JBA , Ballester MÁF , González CMT , Mekyska J , Smékal Z ((2020) ) Alzheimer’s disease and automatic speech analysis: A review. Expert Syst Appl 150: , 113213. |
[23] | Logan R , Williams BG , Ferreira da Silva M , Indani A , Schcolnicov N , Ganguly A , Miller SJ ((2021) ) Deep convolutional neural networks with ensemble learning and generative adversarial networks for Alzheimer’s disease image data classification. Front Aging Neurosci 13: , 720226. |
[24] | Zeng HM , Han HB , Zhang QF , Bai H ((2021) ) Application of modern neuroimaging technology in the diagnosis and study of Alzheimer’s disease. Neural Regen Res 16: , 73–79. |
[25] | Zhao X , Ang CKE , Acharya UR , Cheong KH ((2021) ) Application of artificial intelligence techniques for the detection of Alzheimer’s disease using structural MRI images. Biocybern Biomed Eng 41: , 456–473. |
[26] | Frizzell TO , Glashutter M , Liu CC , Zeng A , Pan D , Hajra SG , D’Arcy RCN , Song X ((2022) ) Artificial intelligence in brain MRI analysis of Alzheimer’s disease over the past 12 years: A systematic review. Ageing Res Rev 77: , 101614. |
[27] | Gao S , Lima D ((2022) ) A review of the application of deep learning in the detection of Alzheimer’s disease. Int J Cogn Comput Eng 3: , 1–8. |
[28] | Mirzaei G , Adeli H ((2022) ) Machine learning techniques for diagnosis of Alzheimer disease, mild cognitive disorder, and other types of dementia. Biomed Signal Process Control 72: , 103293. |
[29] | Qu C , Zou Y , Ma Y , Chen Q , Luo J , Fan H , Jia Z , Gong Q , Chen T ((2022) ) Diagnostic performance of generative adversarial network-based deep learning methods for Alzheimer’s disease: A systematic review and meta-analysis. Front Aging Neurosci 14: , 841696. |
[30] | Saleem TJ , Zahra SR , Wu F , Alwakeel A , Alwakeel M , Jeribi F , Hijji M ((2022) ) Deep learning-based diagnosis of Alzheimer’s disease. J Pers Med 12: , 815. |
[31] | Shastry KA , Vijayakumar V , V MKM , B A M , B N C ((2022) ) Deep learning techniques for the effective prediction of Alzheimer’s disease: A comprehensive review. Healthcare (Basel) 10: , 1842. |
[32] | Zheng C , Xia Y , Pan Y , Chen J ((2015) ) Automated identification of dementia using medical imaging: A survey from a pattern classification perspective. Brain Inform 3: , 17–27. |
[33] | Battineni G , Chintalapudi N , Hossain MA , Losco G , Ruocco C , Sagaro GG , Traini E , Nittari G , Amenta F ((2022) ) Artificial intelligence models in the diagnosis of adult-onset dementia disorders: A review. Bioengineering (Basel) 9: , 370. |
[34] | Li R , Wang X , Lawler K , Garg S , Bai Q , Alty J ((2022) ) Applications of artificial intelligence to aid early detection of dementia: A scoping review on current capabilities and future directions. J Biomed Inform 127: , 104030. |
[35] | Litjens G , Kooi T , Bejnordi BE , Setio AAA , Ciompi F , Ghafoorian M , van der Laak JAWM , van Ginneken B , Sánchez CI ((2017) ) A survey on deep learning in medical image analysis. Med Image Anal 42: , 60–88. |
[36] | Goceri E , Goceri N (2017) Deep learning in medical image analysis: Recent advances and future trends. In International Conference Big Data Analytics, Data Mining and Computational Intelligence 2017, Portugal, pp. 305-310. |
[37] | Noor MBT , Zenia NZ , Kaiser MS , Mamun SA , Mahmud M ((2020) ) Application of deep learning in detecting neurological disorders from magnetic resonance images: A survey on the detection of Alzheimer’s disease, Parkinson’s disease and schizophrenia. Brain Inform 7: , 11. |
[38] | Zhang L , Wang M , Liu M , Zhang D ((2020) ) A survey on deep learning for neuroimaging-based brain disorder analysis. Front Neurosci 14: , 779. |
[39] | Zhang Z , Li G , Xu Y , Tang X ((2021) ) Application of artificial intelligence in the MRI classification task of human brain neurological and psychiatric diseases: A scoping review. Diagnostics 11: , 1402. |
[40] | Ardalan Z , Subbian V ((2022) ) Transfer learning approaches for neuroimaging analysis: A scoping review. Front Artif Intell 5: , 780405. |
[41] | Fei Z , Yang E , Li D , Butler S , Ijomah W , Mackin N (2017) A survey of the state-of-the-art techniques for cognitive impairment detection in the elderly. In Advanced Computational Methods in Life System Modeling and Simulation Springer Nature Singapore, pp. 143-161. |
[42] | Pellegrini E , Ballerini L , Hernandez M del CV , Chappell FM , González-Castro V , Anblagan D , Danso S , Muñoz-Maniega S , Job D , Pernet C , Mair G , MacGillivray TJ , Trucco E , Wardlaw JM ((2018) ) Machine learning of neuroimaging for assisted diagnosis of cognitive impairment and dementia: A systematic review. Alzheimers Dement (Amst) 10: , 519–535. |
[43] | Akobeng AK ((2007) ) Understanding diagnostic tests 1: Sensitivity, specificity and predictive values. Acta Paediatr 96: , 338–341. |
[44] | Akobeng AK ((2007) ) Understanding diagnostic tests 3: Receiver operating characteristic curves. Acta Paediatr 96: , 644–647. |
[45] | Cabrera León Y (2015) Análisis del Uso de las Redes Neuronales Artificiales en el Diseño de Filtros Antispam: Una Propuesta Basada en Arquitecturas Neuronales No Supervisadas. |
[46] | Fan J , Upadhye S , Worster A ((2006) ) Understanding receiver operating characteristic (ROC) curves. CJEM 8: , 19–20. |
[47] | Fawcett T ((2004) ) ROC graphs: Notes and practical considerations for researchers. Mach Learn 31: , 1–38. |
[48] | Kumar R , Indrayan A ((2011) ) Receiver Operating Characteristic (ROC) curve for medical researchers. Indian Pediatr 48: , 277–287. |
[49] | Park SH , Goo JM , Jo CH ((2004) ) Receiver Operating Characteristic (ROC) Curve: Practical review for radiologists. Korean J Radiol 5: , 11–18. |
[50] | Swets JA ((1988) ) Measuring the accuracy of diagnostic systems. Science 240: , 1285–1293. |
[51] | Zweig MH , Campbell G ((1993) ) Receiver-operating characteristic (ROC) plots: A fundamental evaluation tool in clinical medicine. Clin Chem 39: , 561–577. |
[52] | Galasko D , Chang L , Motter R , Clark CM , Kaye J , Knopman D , Thomas R , Kholodenko D , Schenk D , Lieberburg I , Miller B , Green R , Basherad R , Kertiles L , Boss MA , Seubert P ((1998) ) High cerebrospinal fluid tau and low amyloid β42 levels in the clinical diagnosis of Alzheimer disease and relation to Apolipoprotein E genotype. Arch Neurol 55: , 937–945. |
[53] | Scinto LFM , Daffner KR ,eds. (2000) Early Diagnosis of Alzheimer’s Disease, Humana Press. |
[54] | Boller F , Barba GD ((2001) ) Neuropsychological tests in Alzheimer’s disease. Aging Clin Exp Res 13: , 210–220. |
[55] | Bagyinszky E , Youn YC , An SSA , Kim S ((2014) ) Diagnostic methods and biomarkers for Alzheimer’s disease. Toxicol Environ Health Sci 6: , 133–147. |
[56] | Sosa-Marrero A , Cabrera-León Y , Fernández-López P , García-Báez P , Navarro-Mesa JL , Suárez-Araujo CP (2021) Detection of Alzheimer’s disease versus mild cognitive impairment using a new modular hybrid neural network. In Advances in Computational Intelligence, Rojas I, Joya G, Catala A, eds. Springer International Publishing, Cham, pp. 223-235. |
[57] | Frisoni GB , Boccardi M , Barkhof F , Blennow K , Cappa S , Chiotis K , Démonet J-F , Garibotto V , Giannakopoulos P , Gietl A , Hansson O , Herholz K , Jack CR , Nobili F , Nordberg A , Snyder HM , Ten Kate M , Varrone A , Albanese E , Becker S , Bossuyt P , Carrillo MC , Cerami C , Dubois B , Gallo V , Giacobini E , Gold G , Hurst S , Lönneborg A , Lovblad KO , Mattsson N , Molinuevo JL , Monsch AU , Mosimann U , Padovani A , Picco A , Porteri C , Ratib O , Saint-Aubert L , Scerri C , Scheltens P , Schott JM , Sonni I , Teipel S , Vineis P , Visser PJ , Yasui Y , Winblad B ((2017) ) Strategic roadmap for an early diagnosis of Alzheimer’s disease based on biomarkers. Lancet Neurol 16: , 661–676. |
[58] | Laske C , Sohrabi HR , Frost SM , López-de-Ipiña K , Garrard P , Buscema M , Dauwels J , Soekadar SR , Mueller S , Linnemann C , Bridenbaugh SA , Kanagasingam Y , Martins RN , O’Bryant SE ((2015) ) Innovative diagnostic tools for early detection of Alzheimer’s disease. Alzheimers Dement 11: , 561–578. |
[59] | Reitz C , Mayeux R ((2014) ) Alzheimer disease: Epidemiology, diagnostic criteria, risk factors and biomarkers. Biochem Pharmacol 88: , 640–651. |
[60] | Leuzy A , Mattsson-Carlgren N , Palmqvist S , Janelidze S , Dage JL , Hansson O ((2022) ) Blood-based biomarkers for Alzheimer’s disease. EMBO Mol Med 14: , e14408. |
[61] | DeMarshall CA , Nagele EP , Sarkar A , Acharya NK , Godsey G , Goldwaser EL , Kosciuk M , Thayasivam U , Han M , Belinka B , Nagele RG ((2016) ) Detection of Alzheimer’s disease at mild cognitive impairment and disease progression using autoantibodies as blood-based biomarkers. Alzheimers Dement (Amst) 3: , 51–62. |
[62] | Huynh RA , Mohan C ((2017) ) Alzheimer’s disease: Biomarkers in the genome, blood, and cerebrospinal fluid. Front Neurol 8: , 102. |
[63] | Mantzavinos V , Alexiou A ((2017) ) Biomarkers for Alzheimer’s disease diagnosis. Curr Alzheimer Res 14: , 1149–1154. |
[64] | Tsoi KK , Chan JY , Hirai HW , Wong SY , Kwok TC ((2015) ) Cognitive tests to detect dementia: A systematic review and meta-analysis. JAMA Intern Med 175: , 1450–1458. |
[65] | Kessels RPC , Hendriks MPH (2016) Neuropsychological Assessment. In Encyclopedia of Mental Health Elsevier, pp. 197-201. |
[66] | Pfeffer RI , Kurosaki TT , Harrah CH , Chance JM , Filos S ((1982) ) Measurement of functional activities in older adults in the community. J Gerontol 37: , 323–329. |
[67] | Teng E , Becker BW , Woo E , Knopman DS , Cummings JL , Lu PH ((2010) ) Utility of the functional activities questionnaire for distinguishing mild cognitive impairment from very mild Alzheimer’s disease. Alzheimer Dis Assoc Disord 24: , 348–353. |
[68] | Katz S , Ford AB , Moskowitz RW , Jackson BA , Jaffe MW ((1963) ) Studies of illness in the aged: The index of ADL: A standardized measure of biological and psychosocial function. JAMA 185: , 914–919. |
[69] | Mahoney FI , Barthel DW ((1965) ) Functional evaluation: The Barthel Index. Md State Med J 14: , 61–65. |
[70] | Lawton MP , Brody EM ((1969) ) Assessment of older people: Self-maintaining and instrumental activities of daily living. Gerontologist 9: , 179–186. |
[71] | Liepelt-Scarfone I , Jamour M , Maetzler W ((2012) ) Co-occurrence of parkinsonism and dementia in clinical practice: Relevant differential diagnoses. Z Gerontol Geriatr 45: , 23–33. |
[72] | Srulijes K , Maetzler W (2015) Progressive supranuclearpalsy and dementia. In Diet and Nutrition in Dementia and Cognitive Decline, Elsevier, pp. 147-157. |
[73] | Folstein MF , Folstein SE , McHugh PR ((1975) ) “Mini-mental state”. A practical method for grading the cognitive state of patients for the clinician. J Psychiatr Res 12: , 189–198. |
[74] | Nasreddine ZS , Phillips NA , Bédirian V , Charbonneau S , Whitehead V , Collin I , Cummings JL , Chertkow H ((2005) ) The Montreal Cognitive Assessment, MoCA: A brief screening tool for mild cognitive impairment. J Am Geriatr Soc 53: , 695–699. |
[75] | Rosenberg SJ , Ryan JJ , Prifitera A ((1984) ) Rey auditory-verbal learning test performance of patients with and without memory impairment. J Clin Psychol 40: , 785–787. |
[76] | Yesavage JA , Sheikh JI ((1986) ) Geriatric Depression Scale (GDS): Recent evidence and development of a shorter version. Clin Gerontol 5: , 165–173. |
[77] | Cummings JL , Mega M , Gray K , Rosenberg-Thompson S , Carusi DA , Gornbein J ((1994) ) The Neuropsychiatric Inventory: Comprehensive assessment of psychopathology in dementia. Neurology 44: , 2308–2308. |
[78] | Cummings JL ((1997) ) The neuropsychiatric inventory assessing psychopathology in dementia patients. Neurology 48: , S10–S16. |
[79] | Kaufer DI , Cummings JL , Ketchel P , Smith V , MacMillan A , Shelley T , Lopez OL , DeKosky ST ((2000) ) Validation of the NPI-Q, a brief clinical form of the Neuropsychiatric Inventory. J Neuropsychiatry Clin Neurosci 12: , 233–239. |
[80] | Jutten RJ , Harrison J , Lee Meeuw Kjoe PR , Opmeer EM , Schoonenboom NSM , de Jong FJ , Ritchie CW , Scheltens P , Sikkes SAM ((2018) ) A novel cognitive-functional composite measure to detect changes in early Alzheimer’s disease: Test-retest reliability and feasibility. Alzheimers Dement (Amst) 10: , 153–160. |
[81] | Farias ST , Mungas D , Reed BR , Cahn-Weiner D , Jagust W , Baynes K , DeCarli C ((2008) ) The Measurement of Everyday Cognition (ECog): Scale development and psychometric properties. Neuropsychology 22: , 531–544. |
[82] | Rosen WG , Mohs RC , Davis KL ((1984) ) A new rating scale for Alzheimer’s disease. Am J Psychiatry 141: , 1356–1364. |
[83] | Hughes CP , Berg L , Danziger WL , Coben LA , Martin RL ((1982) ) A new clinical scale for the staging of dementia. Br J Psychiatry 140: , 566–572. |
[84] | Cedarbaum JM , Jaros M , Hernandez C , Coley N , Andrieu S , Grundman M , Vellas B ;Alzheimer’s Disease Neuroimaging Initiative((2013) ) Rationale for use of the clinical dementia rating sum of boxes as a primary outcome measure for Alzheimer’s disease clinical trials. Alzheimers Dement 9: , S45–S55. |
[85] | Ronson CE (2011) Alzheimer’s Diagnosis, Nova Science Publishers. |
[86] | Amanzadeh M , Hamedan M , Mohammadnia A , Mahdavi A ((2023) ) Digital cognitive tests for dementia screening: A systematic review. Shiraz E-Med J 24: , 1–11. |
[87] | Vernau W , Vernau KA , Sue Bailey C (2008)Cerebrospinal fluid. In Clinical Biochemistry of Domestic Animals, Elsevier, pp. 769-819. |
[88] | Telano LN , Baker S (2022) Physiology, cerebral spinal fluid. In StatPearls, StatPearls Publishing, Treasure Island (FL). |
[89] | Lleó A , Cavedo E , Parnetti L , Vanderstichele H , Herukka SK , Andreasen N , Ghidoni R , Lewczuk P , Jeromin A , Winblad B , Tsolaki M , Mroczko B , Visser PJ , Santana I , Svenningsson P , Blennow K , Aarsland D , Molinuevo JL , Zetterberg H , Mollenhauer B ((2015) ) Cerebrospinal fluid biomarkers in trials for Alzheimer and Parkinson diseases. Nat Rev Neurol 11: , 41–55. |
[90] | Wong WY , Wong MS , Lo KH ((2007) ) Clinical applications of sensors for human posture and movement analysis: A review. Prosthet Orthot Int 31: , 62–75. |
[91] | Meilán JJG , Martínez-Sánchez F , Carro J , López DE , Millian-Morell L , Arana JM ((2014) ) Speech in Alzheimer’s disease: Can temporal and acoustic parameters discriminate dementia? Dement Geriatr Cogn Disord 37: , 327–334. |
[92] | Ivanova O , Meilán JJG , Martínez-Sánchez F , Martínez-Nicolás I , Llorente TE , González NC ((2022) ) Discriminating speech traits of Alzheimer’s disease assessed through a corpus of reading task for Spanish language. Comput Speech Lang 73: , 101341. |
[93] | Kohonen T ((1988) ) An introduction to neural computing. Neural Netw 1: , 3–16. |
[94] | Rumelhart DE , Hinton GE , McClelland JL (1986) A general framework for parallel distributed processing. In Parallel distributed processing, MIT Press, Cambridge, MA, USA, pp. 45-76. |
[95] | Suárez Araujo CP , García Báez P , Hernández Trujillo Y (2010)Neural computation methods in the determination of fungicides. In Fungicides, INTECH Open Access Publisher. |
[96] | Galletly CA , Clark CR , McFarlane AC ((1996) ) Artificial neural networks: A prospective tool for the analysis of psychiatric disorders. J Psychiatry Neurosci 21: , 239–247. |
[97] | Rosenblatt F (1961) Principles of Neurodynamics. Perceptrons and the Theory of Brain Mechanisms, Cornell Aeronautical Lab Inc, Buffalo, New York. |
[98] | Murtagh F ((1991) ) Multilayer perceptrons for classification and regression. Neurocomputing 2: , 183–197. |
[99] | Jentzen A , Kuckuck B , von Wurstemberger P (2023) Mathematical introduction to deep learning: Methods, implementations, and theory. arXiv, arXiv:2310.20360 |
[100] | Hochreiter S , Schmidhuber J ((1997) ) Long short-term memory. Neural Comput 9: , 1735–1780. |
[101] | Cho K , van Merrienboer B , Gulcehre C , Bahdanau D , Bougares F , Schwenk H , Bengio Y (2014) Learning phrase representations using RNN encoder-decoder for statistical machine translation. ArXiv, arXiv:1406.1078. |
[102] | Vaswani A , Shazeer N , Parmar N , Uszkoreit J , Jones L , Gomez AN , Kaiser L , Polosukhin I (2017) Attention is all you need. arXiv, arXiv:1706.03762 |
[103] | Alzubaidi L , Zhang J , Humaidi AJ , Al-Dujaili A , Duan Y , Al-Shamma O , Santamaría J , Fadhel MA , Al-Amidie M , Farhan L ((2021) ) Review of deep learning: Concepts, CNN architectures, challenges, applications, future directions. J Big Data 8: , 53. |
[104] | Srivastava N , Hinton G , Krizhevsky A , Sutskever I , Salakhutdinov R ((2014) ) Dropout: A simple Way to prevent neural networks from overfitting. J Mach Learn Res 15: , 1929–1958. |
[105] | Wan L , Zeiler M , Zhang S , LeCun Y , Fergus R (2013) Regularization of neural networks using DropConnect. In Proceedings of the 30th International Conference on Machine Learning, Atlanta, Georgia (USA), pp. 1058-1066. |
[106] | Kramer MA ((1992) ) Autoassociative neural networks. Comput Chem Eng 16: , 313–328. |
[107] | Polikar R ((2006) ) Ensemble based systems in decision making. IEEE Circuits Syst Mag 6: , 21–45. |
[108] | Breiman L ((1996) ) Bagging predictors. Mach Learn 24: , 123–140. |
[109] | Schapire RE (2013) XGBoost: A Scalable Tree Boosting System. In Proceedings of the 22nd ACM SIGKDD International Conference on Knowledge Discovery and Data Mining - KDD ’16 ACM Press, San Francisco, California, USA, pp. 785-794. |
[110] | Chen T , Guestrin C (2016)XGBoost: A Scalable Tree Boosting System. In Proceedings of the 22nd ACM SIGKDD International Conference on Knowledge Discovery and Data Mining - KDD ’16 ACM Press, San Francisco, California, USA, pp. 785-794. |
[111] | Breiman L ((2001) ) Random forests. Mach Learn 45: , 5–32. |
[112] | Suárez-Araujo CP , Cabrera-León Y , Fernández-Viadero C , Rodríguez-Espinosa N , Báez PG ((2018) ) Solución computacional para la detección del DCL y del DCL temprano basada en el aprendizaje automático.í . a Gerontol 53: , 57–57. |
[113] | Cabrera-León Y , Báez PG , Ruiz-Alzola J , Suárez-Araujo CP (2018) Classification of mild cognitive impairment stages using machine learning methods. In 2018 IEEE 22nd International Conference on Intelligent Engineering Systems (INES) IEEE, Las Palmas de Gran Canaria, Spain, pp. 67-72. |
[114] | Chawla NV , Bowyer KW , Hall LO , Kegelmeyer WP (2011) SMOTE: Synthetic Minority Over-sampling Technique. arXiv, arXiv:1106.1813. |
[115] | Almubark I , Chang LC , Shattuck KF , Nguyen T , Turner RS , Jiang X ((2020) ) A 5-min cognitive task with deep learning accurately detects early Alzheimer’s disease. Front Aging Neurosci 12: , 603179. |
[116] | Fritzke B (1995) A growing neural gas network learns topologies. Adv Neural Inf Process Syst, pp. 625-632. |
[117] | Yu L , Liu H (2003) Feature selection for high-dimensional data: A fast correlation-based filter solution. In Proceedings of the Twentieth International Conference onMachine Learning (ICML 2003), Washington, DC, pp. 856-863. |
[118] | Suárez-Araujo CP , García Báez P , Cabrera-León Y , Prochazka A , Rodríguez Espinosa N , Fernández Viadero C ,For The Alzheimer’s Disease Neuroimaging Initiative 7 ((2021) ) A real-time clinical decision support system, for mild cognitive impairment detection, based on a hybrid neural architecture. Comput Math Methods Med 2021: , 5545297. |
[119] | Wang H , Sheng L , Xu S , Jin Y , Jin X , Qiao S , Chen Q , Xing W , Zhao Z , Yan J , Mao G , Xu X ((2022) ) Develop a diagnostic tool for dementia using machine learning and non-imaging features. Front Aging Neurosci 14: , 945274. |
[120] | Zhu F , Li X , Mcgonigle D , Tang H , He Z , Zhang C , Hung GU , Chiu PY , Zhou W ((2020) ) Analyze informant-based questionnaire for the early diagnosis of senile dementia using deep learning. IEEE J Transl Eng Health Med 8: , 2200106. |
[121] | Simfukwe C , An SS , Youn YC ((2021) ) Comparison of RCF scoring system to clinical decision for the Rey complex figure using machine-learning algorithm. Dement Neurocognitive Disord 20: , 70–79 . |
[122] | Cheah WT , Hwang JJ , Hong SY , Fu LC , Chang YL , Chen TF , Chen IA , Chou CC ((2022) ) A digital screening system for Alzheimer disease based on a neuropsychological test and a convolutional neural network: System development and validation. JMIR Med Inform 10: , e31106. |
[123] | Nieto-Reyes A , Duque R , Montaña J , Lage C ((2017) ) Classification of Alzheimer’s patients through ubiquitous computing. Sensors (Basel) 17: , 1679. |
[124] | Bringas S , Salomón S , Duque R , Montaña JL , Lage C (2019) A convolutional neural network-based method for human movement patterns classification in Alzheimer’s disease. In 13th International Conference on Ubiquitous Computing and Ambient Intelligence MDPI, pp. 1-9. |
[125] | Zolfaghari S , Khodabandehloo E , Riboni D ((2021) ) TraMiner: Vision-based analysis of locomotion traces for cognitive assessment in smart-homes. Cogn Comput 14: , 1549–1570. |
[126] | Oliveira R , Feres R , Barreto F , Abreu R ((2022) ) CNN for elderly wandering prediction in indoor scenarios. SN Comput Sci 3: , 230. |
[127] | Chiricosta L , D’Angiolini S , Gugliandolo A , Mazzon E ((2022) ) Artificial intelligence predictor for Alzheimer’s disease trained on blood transcriptome: The role of oxidative stress. Int J Mol Sci 23: , 5237. |
[128] | Biella G , Franceschi M , Rino FD , Davin A , Giacalone G , Bountris P , Haritou M , Magnani G , Boneschi FM , Albani D ((2013) ) Multiplex assessment of a panel of 16 serum molecules for the differential diagnosis of Alzheimer’s disease. Am J Neurodegener Dis 2: , 40–45. |
[129] | Sh Y , Liu B , Zhang J , Zhou Y , Hu Z , Zhang X ((2021) ) Application of artificial intelligence modeling technology based on fluid biopsy to diagnose Alzheimer’s disease. Front Aging Neurosci 13: , 768229. |
[130] | He Y , Cong L , He Q , Feng N , Wu Y ((2022) ) Development and validation of immune-based biomarkers and deep learning models for Alzheimer’s disease. Front Genet 13: , 968598. |
[131] | Sun D , Peng H , Wu Z ((2022) ) Establishment and analysis of a combined diagnostic model of Alzheimer’s disease with random forest and artificial neural network. Front Aging Neurosci 14: , 921906. |
[132] | Wang X , Tian Y , Li C , Chen M ((2022) ) Exploring the key ferroptosis-related gene in the peripheral blood of patients with Alzheimer’s disease and its clinical significance. Front Aging Neurosci 14: , 970796. |
[133] | Maj C , Azevedo T , Giansanti V , Borisov O , Dimitri GM , Spasov S ;Alzheimer’s Disease Neuroimaging Initiative, Lió P , Merelli I ((2019) ) Integration of machine learning methods to dissect genetically imputed transcriptomic profiles in Alzheimer’s disease. Front Genet 10: , 726. |
[134] | Stamate D , Kim M , Proitsi P , Westwood S , Baird A , Nevado-Holgado A , Hye A , Bos I , Vos SJB , Vandenberghe R , Teunissen CE , Kate MT , Scheltens P , Gabel S , Meersmans K , Blin O , Richardson J , De Roeck E , Engelborghs S , Sleegers K , Bordet R , Ramit L , Kettunen P , Tsolaki M , Verhey F , Alcolea D , Lléo A , Peyratout G , Tainta M , Johannsen P , Freund-Levi Y , Frölich L , Dobricic V , Frisoni GB , Molinuevo JL , Wallin A , Popp J , Martinez-Lage P , Bertram L , Blennow K , Zetterberg H , Streffer J , Visser PJ , Lovestone S , Legido-Quigley C ((2019) ) A metabolite-based machine learning approach to diagnose Alzheimer-type dementia in blood: Results from the European Medical Information Framework for Alzheimer disease biomarker discovery cohort. Alzheimers Dement Transl Res Clin Interv 5: , 933–938. |
[135] | Mahendran N , Vincent PMDR , Srinivasan K , Chang CY ((2021) ) Improving the classification of Alzheimer’s disease using hybrid gene selection pipeline and deep learning. Front Genet 12: , 784814. |
[136] | Orimaye SO , Wong JS , Wong CP ((2018) ) Deep language space neural network for classifying mild cognitive impairment and Alzheimer-type dementia. PLoS One 13: , e0205636. |
[137] | Themistocleous C , Eckerström M , Kokkinakis D ((2018) ) Identification of mild cognitive impairment from speech in Swedish using deep sequential neural networks. Front Neurol 9: , 975. |
[138] | Chlasta K , Wołk K ((2021) ) Towards computer-based automated screening of dementia through spontaneous speech. Front Psychol 11: , 623237. |
[139] | Fristed E , Skirrow C , Meszaros M , Lenain R , Meepegama U , Cappa S , Aarsland D , Weston J ((2022) ) A remote speech-based AI system to screen for early Alzheimer’s disease via smartphones. Alzheimers Dement (Amst) 14: , 12366. |
[140] | Sun J , Liu Y , Wu H , Jing P , Ji Y ((2022) ) A novel deep learning approach for diagnosing Alzheimer’s disease based on eye-tracking data. Front Hum Neurosci 16: , 972773. |
[141] | Tang J , Wu L , Huang H , Feng J , Yuan Y , Zhou Y , Huang P , Xu Y , Yu C ((2013) ) Back propagation artificial neural network for community Alzheimer’s disease screening in China. Neural Regen Res 8: , 270–276. |
[142] | Staal J , Mattace-Raso F , Daniels HAM , van der Steen J , Pel JJM ((2021) ) To explore the predictive power of visuomotor network dysfunctions in mild cognitive impairment and Alzheimer’s disease. Front Neurosci 15: , 654003. |
[143] | Liang X , Batsis JA , Zhu Y , Driesse TM , Roth RM , Kotz D , MacWhinney B ((2022) ) Evaluating voice-assistant commands for dementia detection. Comput Speech Lang 72: , 101297. |
[144] | Teh SK , Rawtaer I , Tan AH ((2022) ) Predictive self-organizing neural networks for in-home detection of mild cognitive impairment. Expert Syst Appl 205: , 117538. |
[145] | Ntracha A , Iakovakis D , Hadjidimitriou S , Charisis VS , Tsolaki M , Hadjileontiadis LJ ((2020) ) Detection of mild cognitive impairment through natural language and touchscreen typing processing. Front Digit Health 2: , 567158. |
[146] | Haulcy R , Glass J ((2021) ) Classifying Alzheimer’s disease using audio and text-based representations of speech. Front Psychol 11: , 624137. |
[147] | Mahajan P , Baths V ((2021) ) Acoustic and language based deep learning approaches for Alzheimer’s dementia detection from spontaneous speech. Front Aging Neurosci 13: , 623607. |
[148] | Zhu Y , Liang X , Batsis JA , Roth RM ((2021) ) Exploring deep transfer learning techniques for Alzheimer’s dementia detection. Front Comput Sci 3: , 624683. |
[149] | Ilias L , Askounis D ((2022) ) Multimodal deep learning models for detecting dementia from speech and transcripts. Front Aging Neurosci 14: , 830943. |
[150] | Santander-Cruz Y , Salazar-Colores S , Paredes-García WJ , Guendulain-Arenas H , Tovar-Arriaga S ((2022) ) Semantic feature extraction using SBERT for dementia detection. Brain Sci 12: , 270. |
[151] | Fouladvand S , Mielke MM , Vassilaki M , St. Sauver J , Petersen RC , Sohn S (2019) Deep learning prediction of mild cognitive impairment using electronic health records. In 2019 IEEE International Conference on Bioinformatics and Biomedicine (BIBM), pp. 799-806. |
[152] | Kim WJ , Sung JM , Sung D , Chae MH , An SK , Namkoong K , Lee E , Chang HJ ((2019) ) Cox proportional hazard regression versus a deep learning algorithm in the prediction of dementia: An analysis based on periodic health examination . JMIR Med Inform 7: , e13139. |
[153] | Chen L , Saykin AJ , Yao B , Zhao F ((2022) ) Multi-task deep autoencoder to predict Alzheimer’s disease progression using temporal DNA methylation data in peripheral blood. Comput Struct Biotechnol J 20: , 5761–5774. |
[154] | Mukherji D , Mukherji M , Mukherji N ((2022) ) Early detection of Alzheimer’s disease using neuropsychological tests: A predict-diagnose approach using neural networks. Brain Inform 9: , 23. |
[155] | Zheng Y , Liu Y , Wu J , Xie Y , Yang S , Li W , Sun H , He Q , Wu T ((2022) ) Predicted cognitive conversion in guiding early decision-tailoring on patients with cognitive impairment. Front Aging Neurosci 13: , 813923. |
[156] | Martínez-García JM , Suárez-Araujo CP , Báez PG (2012) SNEOM: A Sanger network based extended oversampling method. Application to imbalanced biomedical datasets. In Neural Information Processing Springer Berlin Heidelberg, Berlin, Heidelberg, pp. 584-592. |
[157] | Campos S , Pizarro L , Valle C , Gray KR , Rueckert D , Allende H (2015) Evaluating imputation techniques for missing data in ADNI: A patient classification study. In Progress in Pattern Recognition, Image Analysis, Computer Vision, and Applications, Pardo A, Kittler J, eds. Springer International Publishing, Cham, pp. 3-10. |
[158] | García-Laencina PJ , Sancho-Gómez JL , Figueiras-Vidal AR ((2010) ) Pattern classification with missing data: A review. Neural Comput Appl 19: , 263–282. |

