
Assessing Quality of Life, Economic Burden, and Independence Across the Alzheimer’s Disease Continuum Using Patient-Caregiver Dyad Surveys
Abstract
Background:
Alzheimer’s disease (AD) and mild cognitive impairment (MCI) have negative quality of life (QoL) and economic impacts on patients and their caregivers and may increase along the disease continuum from MCI to mild, moderate, and severe AD.
Objective:
To assess how patient and caregiver QoL, indirect and intangible costs are associated with MCI and AD severity.
Methods:
An on-line survey of physician-identified patient-caregiver dyads living in the United States was conducted from June–October 2022 and included questions to both patients and their caregivers. Dementia Quality of Life Proxy, the Care-related Quality of Life, Work Productivity and Activity Impairment, and Dependence scale were incorporated into the survey. Regression analyses investigated the association between disease severity and QoL and cost outcomes with adjustment for baseline characteristics.
Results:
One-hundred patient-caregiver dyads were assessed with the survey (MCI, n = 27; mild AD, n = 27; moderate AD, n = 25; severe AD, n = 21). Decreased QoL was found with worsening severity in patients (p < 0.01) and in unpaid (informal) caregivers (n = 79; p = 0.02). Dependence increased with disease severity (p < 0.01). Advanced disease severity was associated with higher costs to employers (p = 0.04), but not with indirect costs to caregivers. Patient and unpaid caregiver intangible costs increased with disease severity (p < 0.01). A significant trend of higher summed costs (indirect costs to caregivers, costs to employers, intangible costs to patients and caregivers) in more severe AD was observed (p < 0.01).
Conclusions:
Patient QoL and functional independence and unpaid caregiver QoL decrease as AD severity increases. Intangible costs to patients and summed costs increase with disease severity and are highest in severe AD.
INTRODUCTION
Over 55 million people worldwide live with dementia, with a staggering proportion (∼75% globally) remaining undiagnosed [1]. Alzheimer’s disease (AD) is the leading cause of dementia and may contribute to 60 to 70% of all cases [2]. In the United States (US) alone, an estimated 6.7 million people aged 65 years and older are living with AD in 2023, and this estimate, driven by population aging, is projected to more than double to 13.9 million by 2060 [3, 4]. Similarly, the estimated number of people living with mild cognitive impairment (MCI) due to any cause is projected to rise sharply from 13.5 to 21.6 million over the same time frame [3].
Patients with AD experience a high burden of disease including impaired cognitive function, worsening psychological, physical, and social/relational well-being, as well as declining function and independence [5]. Declining mental and physical health may negatively impact quality of life (QoL) in patients with dementia [6]. Even individuals with MCI who, by definition, do not have dementia and associated functional impairment, may experience diminished QoL compared to individuals without cognitive impairment [7].
Beyond the clinical burden of disease, AD is associated with considerable economic burden [4]. The Alzheimer’s Association estimates that the total cost of care (not including informal caregiving cost) for AD and other dementias in the US to be $345 billion dollars in 2023 [4]. Estimates of direct healthcare costs (e.g., physician office visits, hospitalizations, emergency services, skilled nursing care, and medications) underestimate total cost burden as they do not account for the indirect and intangible cost burden from lost work productivity, negative QoL impacts, informal/unpaid caregiving, or impact on caregivers [8, 9]. In the US, approximately 70% to 75% of people living with dementia receive support from family or friend caregivers who fulfill their roles in an “informal” or unpaid capacity [10, 11]. Caregiving for dementia encompasses a broad spectrum of tasks that span various aspects of care including providing aid with basic activities of daily living (ADL) such as bathing, dressing, grooming, feeding, walking, and using the restroom [4]. Additionally, caregiving may involve assisting with instrumental ADL such as managing household tasks, meal preparation, transportation, shopping, addressing financial and legal matters, and making necessary phone calls. Caregivers also play a critical role in influencing overall therapeutic management and improving medication adherence, managing behavioral symptoms such as wandering and anxiety, addressing other coexisting health conditions, offering emotional support and a sense of security, as well as arranging for paid care or supervised assistance when needed [4]. Notably, unpaid/informal caregiving (e.g., by family and friends) in the US was estimated to total 18 billion hours in 2022—valued at $339.5 billion dollars and approaching the 2023 estimate for direct cost [4]. Preceding investigations have similarly found that the magnitude of informal caregiving costs in dementia approach the direct disease costs [12, 13]. Even among patients with MCI or mild dementia due to AD, caregiving time has been found to be the greatest overall cost driver [14]. The costs of AD/dementia care are projected to surge in the upcoming decades due to factors such as the aging of the US population and increasing costs of care [4, 12, 13, 15].
The dynamic nature of care and support required for individuals afflicted by AD evolves in lockstep with the progression of the disease itself, a phenomenon well-acknowledged in the literature [16]. This characteristic underscores the importance of comprehensively studying the multifaceted impacts of AD. Concurrently, the QoL impacts and the economic and clinical consequences of indirect and intangible costs represent a progressive outcomes trajectory over the AD spectrum, as patients transition from MCI to varying levels of dementia severity. Considering this context, there are compelling reasons to use surveys in AD research. Surveys play a crucial role in helping clarify the complex links between AD severity, QoL, and costs.
The indirect costs of AD in the US have not been addressed across the full spectrum of disease [14]. Intangible costs of AD in the US have not been assessed as these costs are difficult to quantify [17, 18]. Herein we surveyed patient-caregiver dyads in the US with the aim to assess QoL impacts and to estimate indirect and intangible costs along the spectrum of AD. The outcome of this investigation holds the potential to provide insights with practical implications beyond academic exploration. It could lead to improved care management, support systems, and strategies for handling the full range of experiences from MCI to different levels of AD severity. By combining scientific rigor with practical benefits, our efforts aim to advance knowledge and make a real difference in the lives of both patients and caregivers in the complex management of dementia care.
METHODS
Study design and data source
An online survey was conducted from June to October 2022 among physician-identified patient-caregiver dyads living in the US. The survey included tailored inquiries designed to separately collect demographic and contextual details of the patients and their caregivers. Complementing the tailored inquiries, four validated questionnaires were integrated into the survey framework, and encompassed: 1) the Dementia Quality of Life Proxy Questionnaire (DEMQOL-Proxy) [19–21], 2) the Care-related Quality of Life-7 dimensions instrument (CarerQoL-7D) [22, 23], 3) the Dependence Scale (DS) questionnaire [24, 25], and 4) the Work Productivity and Activity Impairment (WPAI) questionnaire [26].
Supplementary Table 1 delineates which survey questions/components were for patients versus caregivers. If a patient was unable to respond to their survey inquiries (e.g., owing to their medical condition), the caregiver was solicited to provide responses on behalf of the patient.
Study population
Patients were identified/recruited by physicians providing community- and/or hospital-based care to patients with MCI or AD in the US. These physicians (including general practitioners, geriatricians, and neurologists) were identified using third-party entities (M3 Global Research Fort Washington, Pennsylvania, US, in partnership with Food & Drug Research, Stamford, Connecticut, US). The selection process entailed screening existing Health Care Provider panels to locate non-retired physicians boasting a minimum of three years of professional practice. Specifically, physicians currently engaged in treating more than four patients diagnosed with MCI or AD in the preceding three months were approached to participate in identifying and recruiting patient and caregiver participants for the ongoing survey. Importantly, the identities of physicians, patients, and caregivers remained concealed from both the study sponsors and investigators, ensuring a blinded approach throughout the process.
Inclusion criteria
Patients were required to have either MCI or AD that had been diagnosed by their treating physician at least 3 months prior to their participation in the survey.
Criteria for diagnosis of MCI were either a specialist physician’s diagnosis, a clinical dementia rating (CDR) total score of 0.5 [27], or a Mini-Mental State Examination (MMSE) of > 24 [28]. Criteria for diagnoses of mild, moderate, or severe AD were MMSE scores of 21–24, 11–20, or≤10 respectively [29] or CDR total scores of 1, 2, or 3, respectively [27, 30].
Patients were required to have a caregiver (i.e., a family member, other informal caregiver, or formal caregiver) who was primarily responsible for their care for at least 3 months prior to the survey. Physicians sent an online survey link to patients/caregivers who fulfilled the study criteria. A similar distribution of patients across the 4 disease categories (i.e., MCI, mild AD, moderate AD, severe AD) was sought by requesting a quota of n = 25 per disease category as an initial guide.
Ethical considerations
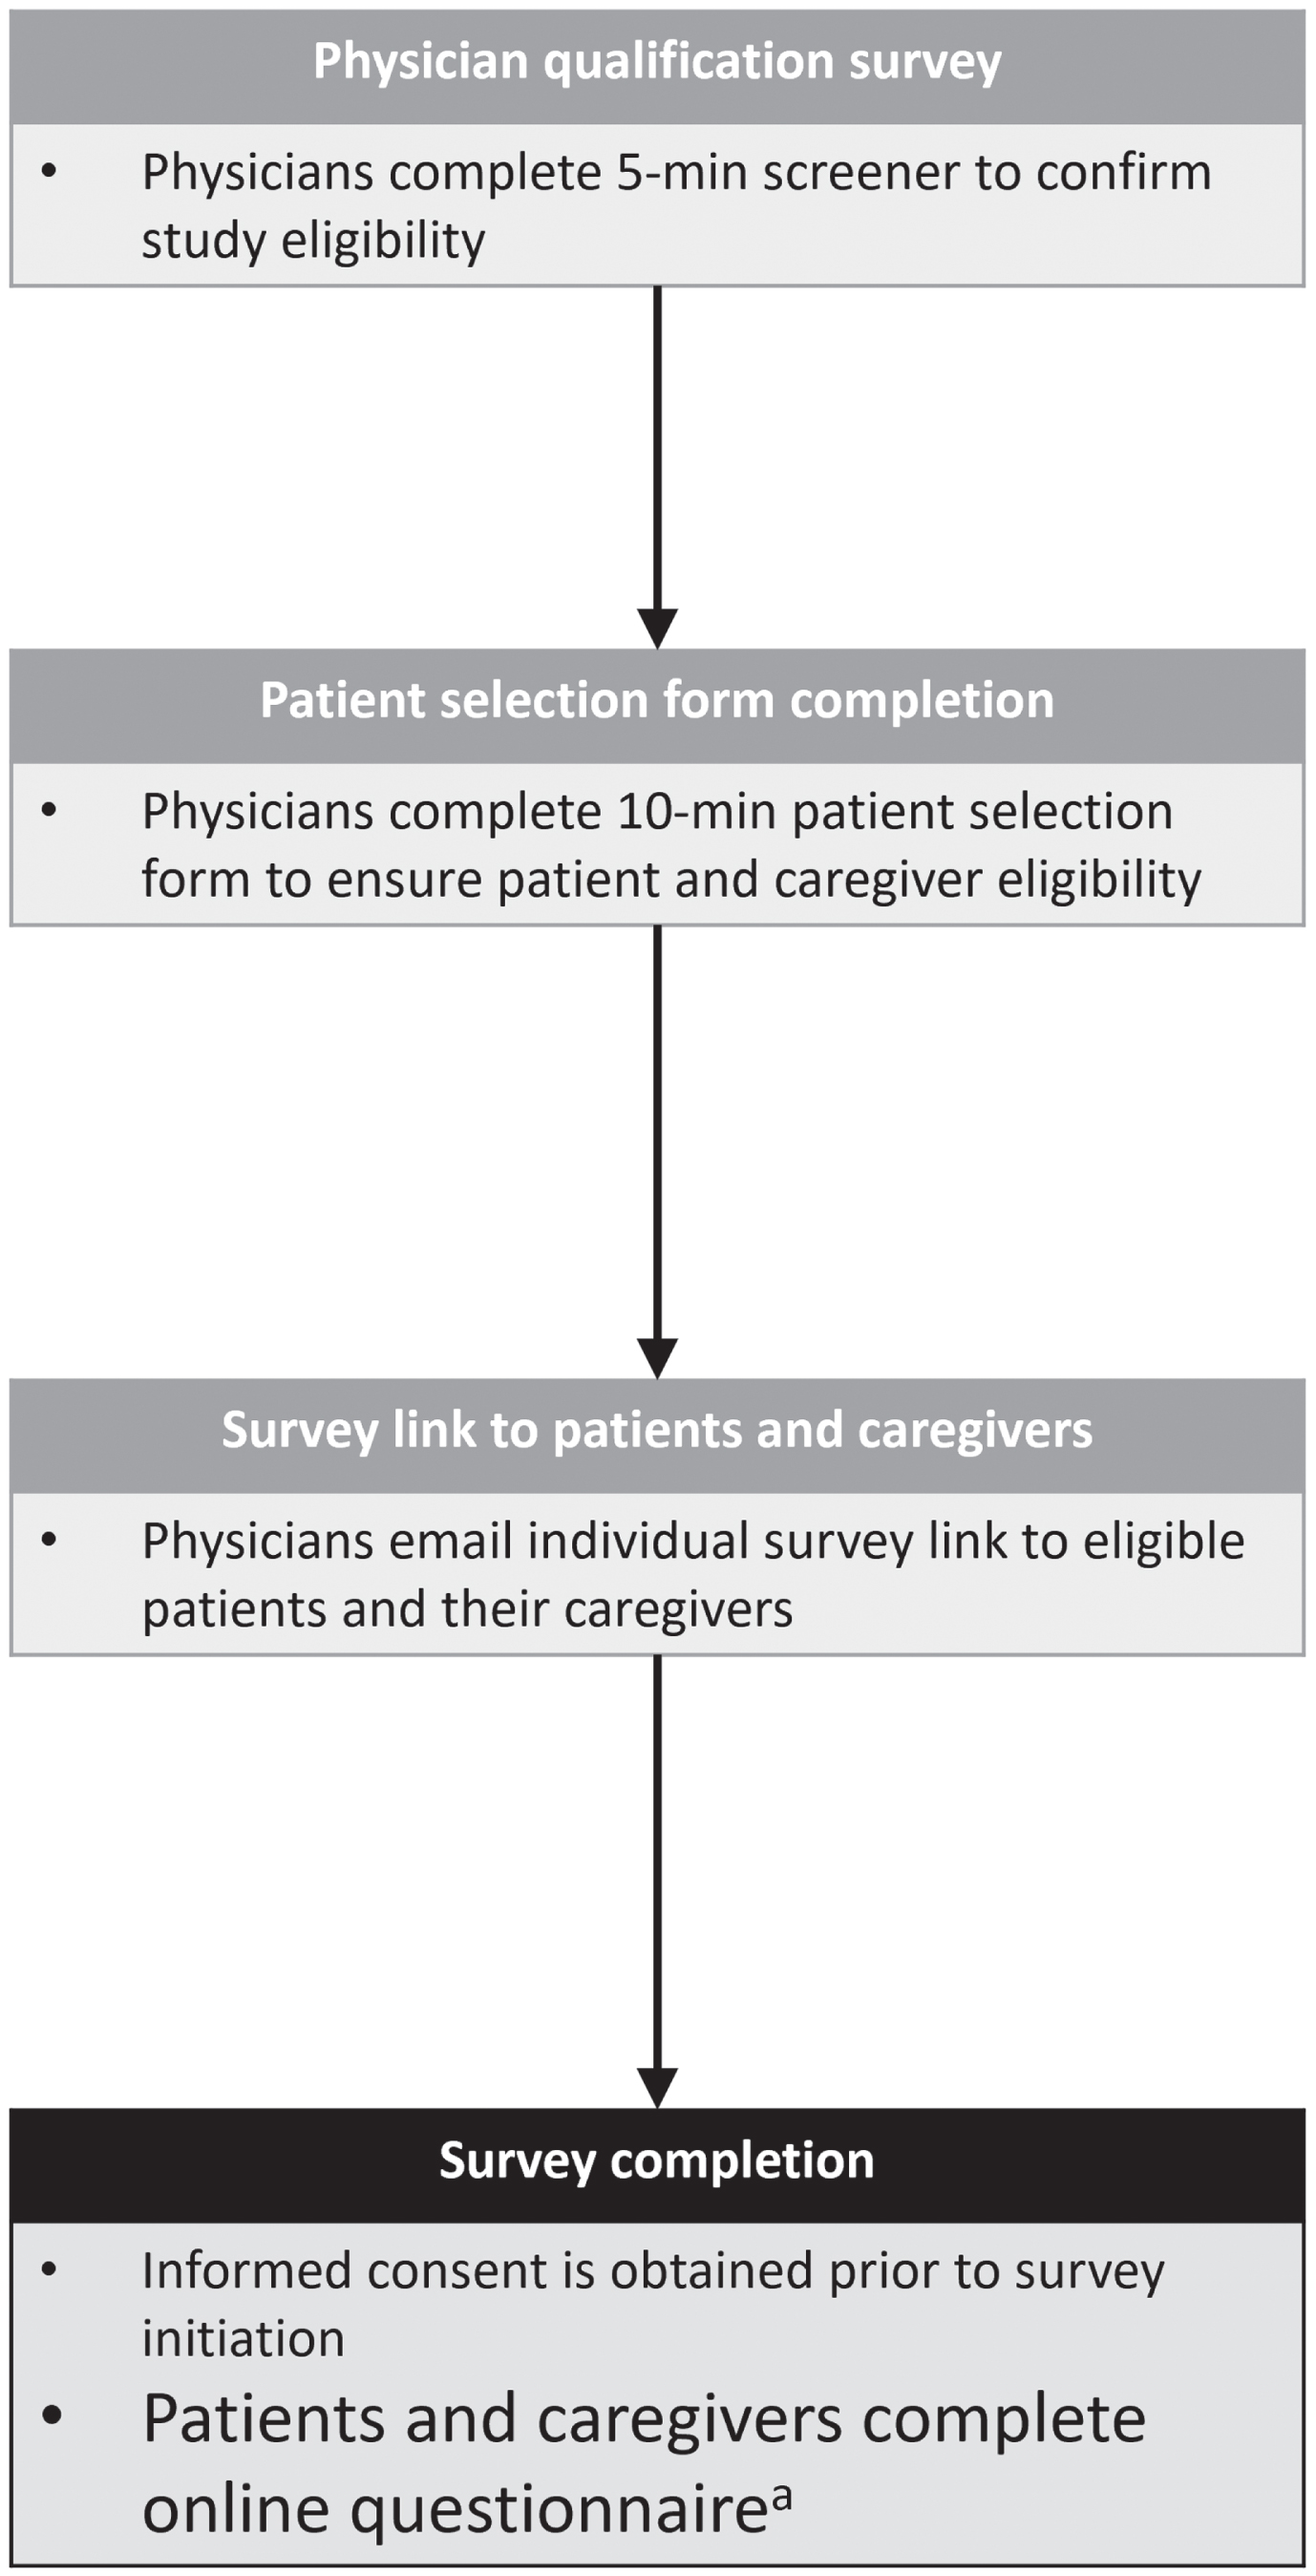
The study conformed with the Declaration of Helsinki and was approved by the Western Institutional Review Board (WIRB)-Copernicus Group Institutional Review Board (WCG IRB) in May 2022. Participants (patients and caregivers) were asked to consent online, prior to commencing the survey. Only participants who provided informed consent were prompted to answer survey questions. Figure 1 provides an overview of the survey methodology.
Fig. 1
Survey methodology. aPatient questionnaire time ∼30 minutes; caregiver questionnaire time ∼45 minutes.
Study measures
Baseline demographics
Baseline demographic data and pertinent contextual features, including the length of diagnosis, presence of comorbidities, and the estimated Charlson Comorbidity Index (CCI) score were summarized by disease severity (i.e., MCI and AD stages). A CCI score was derived from a list of questions on comorbid conditions based on the approach outlined by Habbous and colleagues (2013) [31].
Employment and productivity
Employment and productivity-related questions included weekly earnings derived from sources such as full- or part-time employment, gratuities, bonuses, social security disbursements, rental income, pension, annuities, and insurance remittances. Additionally, employment status, changes in employment conditions for both patients and caregivers, work replacement dynamics, and the WPAI questionnaire, which specifically collected data regarding missed workdays (applicable to caregivers only), were included in the assessment.
Quality of life and dependence
Instruments measuring quality of life (QoL) and patient dependence were completed by caregivers and included the following:
Health-Related QoL for Dementia Patients: This was evaluated through DEMQOL-Proxy scores, ranging from 31 to 124. Higher scores indicated enhanced QoL for patients [19–21].
Care-Related Quality of Life for Caregivers: The CarerQoL-7D instrument consisted of seven questions that gauged two positive dimensions (fulfillment and support) and five problem dimensions (relational challenges, mental health, difficulties in daily activities, financial concerns, and physical health), with three response categories (‘no’, ‘some’, ‘a lot’). Additionally, a visual analogue scale (VAS) was utilized to quantify the caregiver’s happiness, with scores ranging from 0 to 10. Elevated scores on the VAS corresponded to heightened levels of happiness [22, 23].
Patient Caregiving Needs and Dependence Levels: This dimension was evaluated via the DS, spanning scores from 0 to 15. Here, higher scores signified greater levels of dependence for patients [24, 25].
The outcomes from both the QoL evaluations were transformed into utilities [32, 33], representing the poorest to the perfect health status, corresponding to utilities of 0 to 1 respectively for the DEMQOL-Proxy and 0 to 100 for the CarerQoL-7D.
Costs
Cost-related measures were calculated per patient per month. Indirect costs to caregivers were defined as the costs for unpaid (informal) caregiving services and calculated using the opportunity cost method: for each caregiver, the time of providing unpaid caregiving services was considered as a missed opportunity of working for pay [34]. Thus, for caregivers who had jobs/employment, the costs for unpaid caregiver services were calculated by multiplying the average hourly income of the caregiver (using the weekly income and assuming a standard 35-hours work week) with the total number of monthly hours that the caregiver provided unpaid help to the patient; the assumed hourly average gross national wage was 33.88 US dollars (USD) for part-time employees as well as in cases where income was not provided [35]. For caregivers who did not have jobs/employment, the value of lost leisure was calculated by multiplying 35% of the average hourly income of the caregiver with the total number of monthly hours that the caregiver provided unpaid help to the patient (average gross national daily wage was used if income was not provided). Costs to employers were defined as costs incurred due to absenteeism and having to replace workers. The absenteeism costs assumed a standard 35-hour work week and were calculated by multiplying the reported number of workdays missed, acquired from the caregiver’s responses to the WPAI instrument [26], with the average daily income [36]. The methodology considered the caregiver’s number of workdays missed in the past week due to health-related concerns. Calculation of patients’ or caregivers’ replacement cost involved doubling the total income earned in the preceding year, provided a replacement at work had been made; this value was divided by 24 to obtain monthly replacement costs [37].
Intangible costs are not well characterized in the literature. We attempted to attach a monetary value to QoL impacts and thus defined intangible costs to patients and caregivers as costs attributed to loss in QoL. These intangible costs were calculated using the utility values derived from the DEMQOL-Proxy for patients [32] and the CarerQoL-7D for caregivers [33]. The health utility value of the patient or caregiver was subtracted from the age-standardized health utility value from the general US population [38] to derive the estimate of utility reduction arising from the disease or the caregiving role, respectively. Intangible costs were calculated using the upper limit of the Institute for Clinical and Economic Review’s 2023 willingness to pay threshold of $150,000 for one quality-adjusted life year gained [39, 40].
The sum of all costs assessed in this analysis (i.e., indirect costs to caregivers, costs to employers, intangible costs to patients and to caregivers) are referred to as “summed costs”.
Statistical analyses
Baseline characteristics of the patients and caregivers were summarized using descriptive statistics, using number of observations (n) and percentage (%) for categorical variables and n, mean with standard deviation (SD), and median with interquartile range (IQR) for summarizing continuous variables.
The association of between patient disease severity and QoL or costs was assessed using multivariable linear regression analysis. The influence of other baseline patient or caregiver characteristics on QoL/costs was first explored using univariable linear regression models, and select interactions were investigated. Variables from these univariable analyses were then included in a full model if p-values were < 0.1; additional variables with the highest p-values were subsequently eliminated to derive the final model. The association between disease severity and each of the various QoL/cost parameters in the final multivariable linear regression model was considered significant if the Wald’s Chi-squared test p-value was < 0.05. As a supportive analysis, the association between patients’ direct answers to 8 bespoke QoL-related survey questions and DEMQOL-Proxy scores (i.e., caregiver-reported patient QoL) was assessed using linear regression models. Patients’ answers to QoL questions and DEMQOL-Proxy scores were designated as independent and dependent variables, respectively. For the association analysis, patients’ answers were treated as continuous variables (1=“totally agree”, 2=“somewhat agree”, 3=“neither agree or disagree”, 4=“somewhat disagree”, 5=“totally disagree”).
Additionally, an analysis of caregiver QoL and cost impacts was conducted in the subgroup of unpaid/informal caregivers. Unpaid/informal caregivers were defined as caregivers who identified themselves as a spouse, other relative, or friend, but not as “paid caregivers”.
All statistical analyses were conducted using SAS (version 9.4 TS1M5).
RESULTS
Recruiting physicians
Over 200 physicians (all specialties) were approached, of which 21 agreed to participate in recruitment for the survey. A total of 15 physicians provided links to the online survey to at least 1 patient-caregiver dyad (corresponding to a response rate < 7.5%). These 15 physicians included 12 primary care physicians (80.0%), 2 neurologists (13.3%), and 1 geriatrician (6.7%). Most of the recruiting physicians were based in the Northeast (8) US region, followed by the Southeast (3), Midwest (2) and 1 each in the Southwest and West.
Overview of survey respondents
Survey links were shared to 119 patients and 115 caregivers, ultimately resulting in participation of 100 patient-caregiver dyads who completed the survey (with a response rate of 100/119 (84.0%) for patients and 100/115 (86.9%) for caregivers). There were 27 patient-caregiver dyads for MCI and 27, 25, and 21 dyads for mild, moderate, and severe AD, respectively. Whether responses to the patient survey were provided by patients or their proxies/caregivers is summarized in Supplementary Table 2, showing an increased proportion of proxy response with increasing disease severity. The geographic distribution of patient-caregiver dyads is summarized in Supplementary Table 3.
Patient and caregiver characteristics
Socio-demographic characteristics and other clinical/caregiving background data collected from patients and their caregivers are summarized in Table 1 and Supplementary Table 4, respectively. More patients in the AD group were aged≥75 years (46.5%) than in the MCI group (29.6%). Across all surveyed patient groups, most patients were female, White, had at least a high school education, and were married. Approximately one-third (33.3%) of patients with MCI and half (53.4%) with AD reported a fall within the preceding 3 months. More patients with mild to moderate AD reporting fall-related hospitalization (40.0–50.0%) than those with severe AD (7.1%).
Table 1
Background characteristics of patients
| MCI | Mild AD | Moderate AD | Severe AD | Total AD | |
| N = 27 | N = 27 | N = 25 | N = 21 | N = 73 | |
| Age (y) | |||||
| 60–64 | 5 (18.5%) | 1 (3.7%) | 3 (12.0%) | 4 (19.0%) | 8 (11.0%) |
| 65–69 | 7 (25.9%) | 8 (29.6%) | 6 (24.0%) | 5 (23.8%) | 19 (26.0%) |
| 70–74 | 7 (25.9%) | 1 (3.7%) | 7 (28.0%) | 4 (19.0%) | 12 (16.4%) |
| 75–79 | 4 (14.8%) | 15 (55.6%) | 5 (20.0%) | 3 (14.3%) | 23 (31.5%) |
| 80–84 | 4 (14.8%) | 2 (7.4%) | 4 (16.0%) | 3 (14.3%) | 9 (12.3%) |
| 85+ | 0 (0.0%) | 0 (0.0%) | 0 (0.0%) | 2 (9.5%) | 2 (2.7%) |
| Gender | |||||
| Female | 16 (59.3%) | 12 (44.4%) | 10 (40.0%) | 13 (61.9%) | 35 (47.9%) |
| Race/ethnicity: | |||||
| White | 20 (74.1%) | 12 (44.4%) | 15 (60.0%) | 18 (85.7%) | 45 (61.6%) |
| Black | 4 (14.8%) | 7 (25.9%) | 5 (20.0%) | 2 (9.5%) | 14 (19.2%) |
| Asian | 2 (7.4%) | 2 (7.4%) | 1 (4.0%) | 0 (0.0%) | 3 (4.1%) |
| Hispanic | 1 (3.7%) | 6 (22.2%) | 4 (16.0%) | 1 (4.8%) | 11 (15.1%) |
| Highest educational level | |||||
| Less than high school | 1 (3.7%) | 1 (3.7%) | 1 (4.0%) | 1 (4.8%) | 3 (4.1%) |
| High school | 11 (40.7%) | 10 (37.0%) | 7 (28.0%) | 7 (33.3%) | 24 (32.9%) |
| Some college | 6 (22.2%) | 7 (25.9%) | 9 (36.0%) | 11 (52.4%) | 27 (37.0%) |
| College graduate | 8 (29.6%) | 9 (33.3%) | 8 (32.0%) | 2 (9.5%) | 19 (26.0%) |
| Post college | 1 (3.7%) | 0 (0.0%) | 0 (0.0%) | 0 (0.0%) | 0 (0.0%) |
| Marital status | |||||
| Married/Civil partnership | 16 (59.3%) | 18 (66.7%) | 18 (72.0%) | 15 (71.4%) | 51 (69.9%) |
| Never married | 0 (0.0%) | 1 (3.7%) | 0 (0.0%) | 0 (0.0%) | 1 (1.4%) |
| Widowed | 10 (37.0%) | 7 (25.9%) | 5 (20.0%) | 5 (23.8%) | 17 (23.3%) |
| Separated/Divorced | 1 (3.7%) | 0 (0.0%) | 2 (8.0%) | 1 (4.8%) | 3 (4.1%) |
| Prefer not to say/unknown | 0 (0.0%) | 1 (3.7%) | 0 (0.0%) | 0 (0.0%) | 1 (1.4%) |
| Living situation | |||||
| With family members or friends in own home | 20 (74.1%) | 25 (92.6%) | 20 (80.0%) | 18 (85.7%) | 63 (86.3%) |
| Alone in own home | 3 (11.1%) | 1 (3.7%) | 1 (4.0%) | 0 (0.0%) | 2 (2.7%) |
| Residential care setting (assisted living facility) | 4 (14.8%) | 0 (0.0%) | 2 (8.0%) | 2 (9.5%) | 4 (5.5%) |
| Nursing home | 0 (0.0%) | 1 (3.7%) | 2 (8.0%) | 1 (4.8%) | 4 (5.5%) |
| Ever admitted to a nursing home | |||||
| Yes | 1 (3.7%) | 3 (11.1%) | 3 (12.0%) | 3 (14.3%) | 9 (12.3%) |
| No | 26 (96.3%) | 24 (88.9%) | 22 (88.0%) | 18 (85.7%) | 64 (87.7%) |
| Time since receiving diagnosis of MCI or AD (y), mean ± SD | 2.3±2.3 | 2.2±1.5 | 2.8±1.7 | 2.8±1.9 | 2.6±1.7 |
| In the last 3 months, have you had a fall? | |||||
| Yes | 9 (33.3%) | 10 (37.0%) | 15 (60.0%) | 14 (66.7%) | 39 (53.4%) |
| No | 18 (66.7%) | 17 (63.0%) | 10 (40.0%) | 7 (33.3%) | 34 (46.6%) |
| If yes, indicate whether you were hospitalized due to the fall(s) | |||||
| Yes | 2 (22.2%) | 5 (50.0%) | 6 (40.0%) | 1 (7.1%) | 12 (30.8%) |
| No | 7 (77.8%) | 5 (50.0%) | 9 (60.0%) | 13 (92.9%) | 27 (69.2%) |
| Derived Charlson comorbidity indexa, mean ± SD | 1.8±1.7 | 2.5±1.6 | 2.5±1.8 | 1.8±1.0 | 2.3±1.5 |
| Comorbiditiesb | |||||
| Mental health disorder (depression, anxiety) | 15 (55.6%) | 13 (48.1%) | 11 (44.0%) | 7 (33.3%) | 31 (42.5%) |
| Heart attack (myocardial infarction) | 4 (14.8%) | 7 (25.9%) | 5 (20.0%) | 5 (23.8%) | 17 (23.3%) |
| A stroke/mini-stroke | 3 (11.1%) | 1 (3.7%) | 2 (8.0%) | 2 (9.5%) | 5 (6.8%) |
| Urinary tract infection | 14 (51.9%) | 12 (44.4%) | 8 (32.0%) | 5 (23.8%) | 25 (34.2%) |
| Diabetes | 10 (37.0%) | 9 (33.3%) | 7 (28.0%) | 3 (14.3%) | 19 (26.0%) |
| High blood pressure | 10 (37.0%) | 15 (55.6%) | 16 (64.0%) | 9 (42.9%) | 40 (54.8%) |
| Cancer | 5 (18.5%) | 0 (0.0%) | 0 (0.0%) | 0 (0.0%) | 0 (0.0%) |
Values are expressed as n (%) unless otherwise noted. AD, Alzheimer’s disease; MCI, mild cognitive impairment. aThe Charlson comorbidity index was derived from a list of questions on comorbidities as in Habbous et al. 2013 [31] bComorbidities tested in the model.
Across all surveyed caregiver groups, over half were younger than 65 years, female, White, had at least a college education, and were either married or in a civil partnership. As AD severity increased from mild to severe, the proportion of caregivers who were spouses or other relatives decreased from 92.6% to 52.3%, while the proportion of paid caregivers rose from 3.7% to 47.6%. As AD severity increased from mild to severe, the proportion of caregivers living with patients declined from 85.2% to 38.1%. Caregivers reported dedicating an average of approximately 50 hours per week (MCI, mild AD, moderate AD) to almost 65 hours per week (severe AD). Notably, more than 70% of caregivers remained unpaid across the AD continuum.
Employment and productivity
Employment-related data for patients and caregivers are summarized in Table 2. Weekly income was generally between $500–$1999 for caregivers of patients with MCI or mild AD and $500–$1499 for caregivers of patients with moderate and severe AD. No patients reported full-time employment. Part-time employment was reported by less than 10% of patients with MCI, mild or moderate AD, and none with severe AD. Most patients (>60%) across all categories self-reported as retired. Caregivers reported varying degrees of employment across all patient categories, with no consistent pattern. A change in employment status was reported by 25% of patients since receiving their diagnosis and by 34% of caregivers due to caregiver duties, with early retirement emerging as the most commonly reported change.
Table 2
Patient and caregiver employment- and productivity-related data
| MCI | Mild AD | Moderate AD | Severe AD | Total AD | |
| N = 27 | N = 27 | N = 25 | N = 21 | N = 73 | |
| Patients | |||||
| Weekly incomea | |||||
| under $500 | 3 (11.1%) | 1 (3.7%) | 7 (28.0%) | 1 (4.8%) | 9 (12.3%) |
| $500 –$999 | 7 (25.9%) | 11 (40.7%) | 14 (56.0%) | 9 (42.9%) | 34 (46.6%) |
| $1000 –$1499 | 8 (29.6%) | 6 (22.2%) | 2 (8.0%) | 5 (23.8%) | 13 (17.8%) |
| $1500 –$1999 | 5 (18.5%) | 3 (11.1%) | 1 (4.0%) | 2 (9.5%) | 6 (8.2%) |
| $2000 or over | 0 (0.0%) | 3 (11.1%) | 0 (0.0%) | 0 (0.0%) | 3 (4.1%) |
| Prefer not to say | 4 (14.8%) | 3 (11.1%) | 1 (4.0%) | 4 (19.0%) | 8 (11.0%) |
| Current employment status | |||||
| Full-time employed/self-employed (35 h/week or more) | 0 (0.0%) | 0 (0.0%) | 0 (0.0%) | 0 (0.0%) | 0 (0.0%) |
| Part-time employed (less than 35 h/week) | 2 (7.4%) | 2 (7.4%) | 1 (4.0%) | 0 (0.0%) | 3 (4.1%) |
| Unemployed | 1 (3.7%) | 1 (3.7%) | 5 (20.0%) | 0 (0.0%) | 6 (8.2%) |
| Retired | 17 (63.0%) | 24 (88.9%) | 18 (72.0%) | 16 (76.2%) | 58 (79.5%) |
| Homemaker | 7 (25.9%) | 0 (0.0%) | 1 (4.0%) | 5 (23.8%) | 6 (8.2%) |
| Change of employment status since diagnosis with MCI or AD | |||||
| No change | 21 (77.8%) | 21 (77.8%) | 14 (56.0%) | 19 (90.5%) | 54 (74.0%) |
| Changed jobs | 1 (3.7%) | 0 (0.0%) | 0 (0.0%) | 0 (0.0%) | 0 (0.0%) |
| Family/medical leave | 0 (0.0%) | 0 (0.0%) | 1 (4.0%) | 0 (0.0%) | 1 (1.4%) |
| Leave of absence | 0 (0.0%) | 1 (3.7%) | 0 (0.0%) | 0 (0.0%) | 1 (1.4%) |
| Early retirement | 3 (11.1%) | 5 (18.5%) | 8 (32.0%) | 2 (9.5%) | 15 (20.5%) |
| Quit job | 1 (3.7%) | 0 (0.0%) | 2 (8.0%) | 0 (0.0%) | 2 (2.7%) |
| Other | 1 (3.7%) | 0 (0.0%) | 0 (0.0%) | 0 (0.0%) | 0 (0.0%) |
| Caregivers | |||||
| Weekly incomea | |||||
| under $500 | 2 (7.4%) | 0 (0.0%) | 2 (8.0%) | 0 (0.0%) | 2 (2.7%) |
| $500 –$999 | 5 (18.5%) | 10 (37.0%) | 13 (52.0%) | 9 (42.9%) | 32 (43.8%) |
| $1000 –$1499 | 10 (37.0%) | 5 (18.5%) | 6 (24.0%) | 8 (38.1%) | 19 (26.0%) |
| $1500 –$1999 | 5 (18.5%) | 5 (18.5%) | 2 (8.0%) | 2 (9.5%) | 9 (12.3%) |
| $2000 or over | 0 (0.0%) | 2 (7.4%) | 2 (8.0%) | 0 (0.0%) | 4 (5.5%) |
| Prefer not to say | 5 (18.5%) | 5 (18.5%) | 0 (0.0%) | 2 (9.5%) | 7 (9.6%) |
| Current employment status | |||||
| Full-time employed/self-employed (35 h/week or more) | 8 (29.6%) | 2 (7.4%) | 12 (48.0%) | 11 (52.4%) | 25 (34.2%) |
| Part-time employed (less than 35 h/week) | 5 (18.5%) | 3 (11.1%) | 4 (16.0%) | 2 (9.5%) | 9 (12.3%) |
| Unemployed | 2 (7.4%) | 1 (3.7%) | 0 (0.0%) | 0 (0.0%) | 1 (1.4%) |
| Retired | 10 (37.0%) | 17 (63.0%) | 6 (24.0%) | 7 (33.3%) | 30 (41.1%) |
| Homemaker | 2 (7.4%) | 4 (14.8%) | 3 (12.0%) | 1 (4.8%) | 8 (11.0%) |
| Change of employment status since diagnosis with MCI or AD of the patient caring for due to caregiving duties | |||||
| No change | 17 (63.0%) | 18 (66.7%) | 16 (64.0%) | 15 (71.4%) | 49 (67.1%) |
| Changed jobs | 1 (3.7%) | 0 (0.0%) | 1 (4.0%) | 0 (0.0%) | 1 (1.4%) |
| Family/medical leave | 2 (7.4%) | 2 (7.4%) | 3 (12.0%) | 0 (0.0%) | 5 (6.8%) |
| Leave of absence | 0 (0.0%) | 1 (3.7%) | 0 (0.0%) | 0 (0.0%) | 1 (1.4%) |
| Early retirement | 5 (18.5%) | 5 (18.5%) | 3 (12.0%) | 5 (23.8%) | 13 (17.8%) |
| Quit job | 1 (3.7%) | 1 (3.7%) | 0 (0.0%) | 0 (0.0%) | 1 (1.4%) |
| Other | 1 (3.7%) | 0 (0.0%) | 2 (8.0%) | 1 (4.8%) | 3 (4.1%) |
| Replacement at work due to inability to work due to caregiving responsibilities since the diagnosis with MCI or AD of the patient caring for | |||||
| Yes | 2 (7.4%) | 6 (22.2%) | 2 (8.0%) | 1 (4.8%) | 9 (12.3%) |
| No | 15 (55.6%) | 10 (37.0%) | 14 (56.0%) | 12 (57.1%) | 36 (49.3%) |
| Not applicable | 7 (25.9%) | 11 (40.7%) | 9 (36.0%) | 7 (33.3%) | 27 (37.0%) |
| Not known | 3 (11.1%) | 0 (0.0%) | 0 (0.0%) | 1 (4.8%) | 1 (1.4%) |
Values are expressed as n (%). AD, Alzheimer’s disease; MCI, mild cognitive impairment. aWeekly income includes full-time or part-time wages, tips, bonuses, social security checks, rents, pension, annuity and insurance payments.
Quality of life
Patient QoL
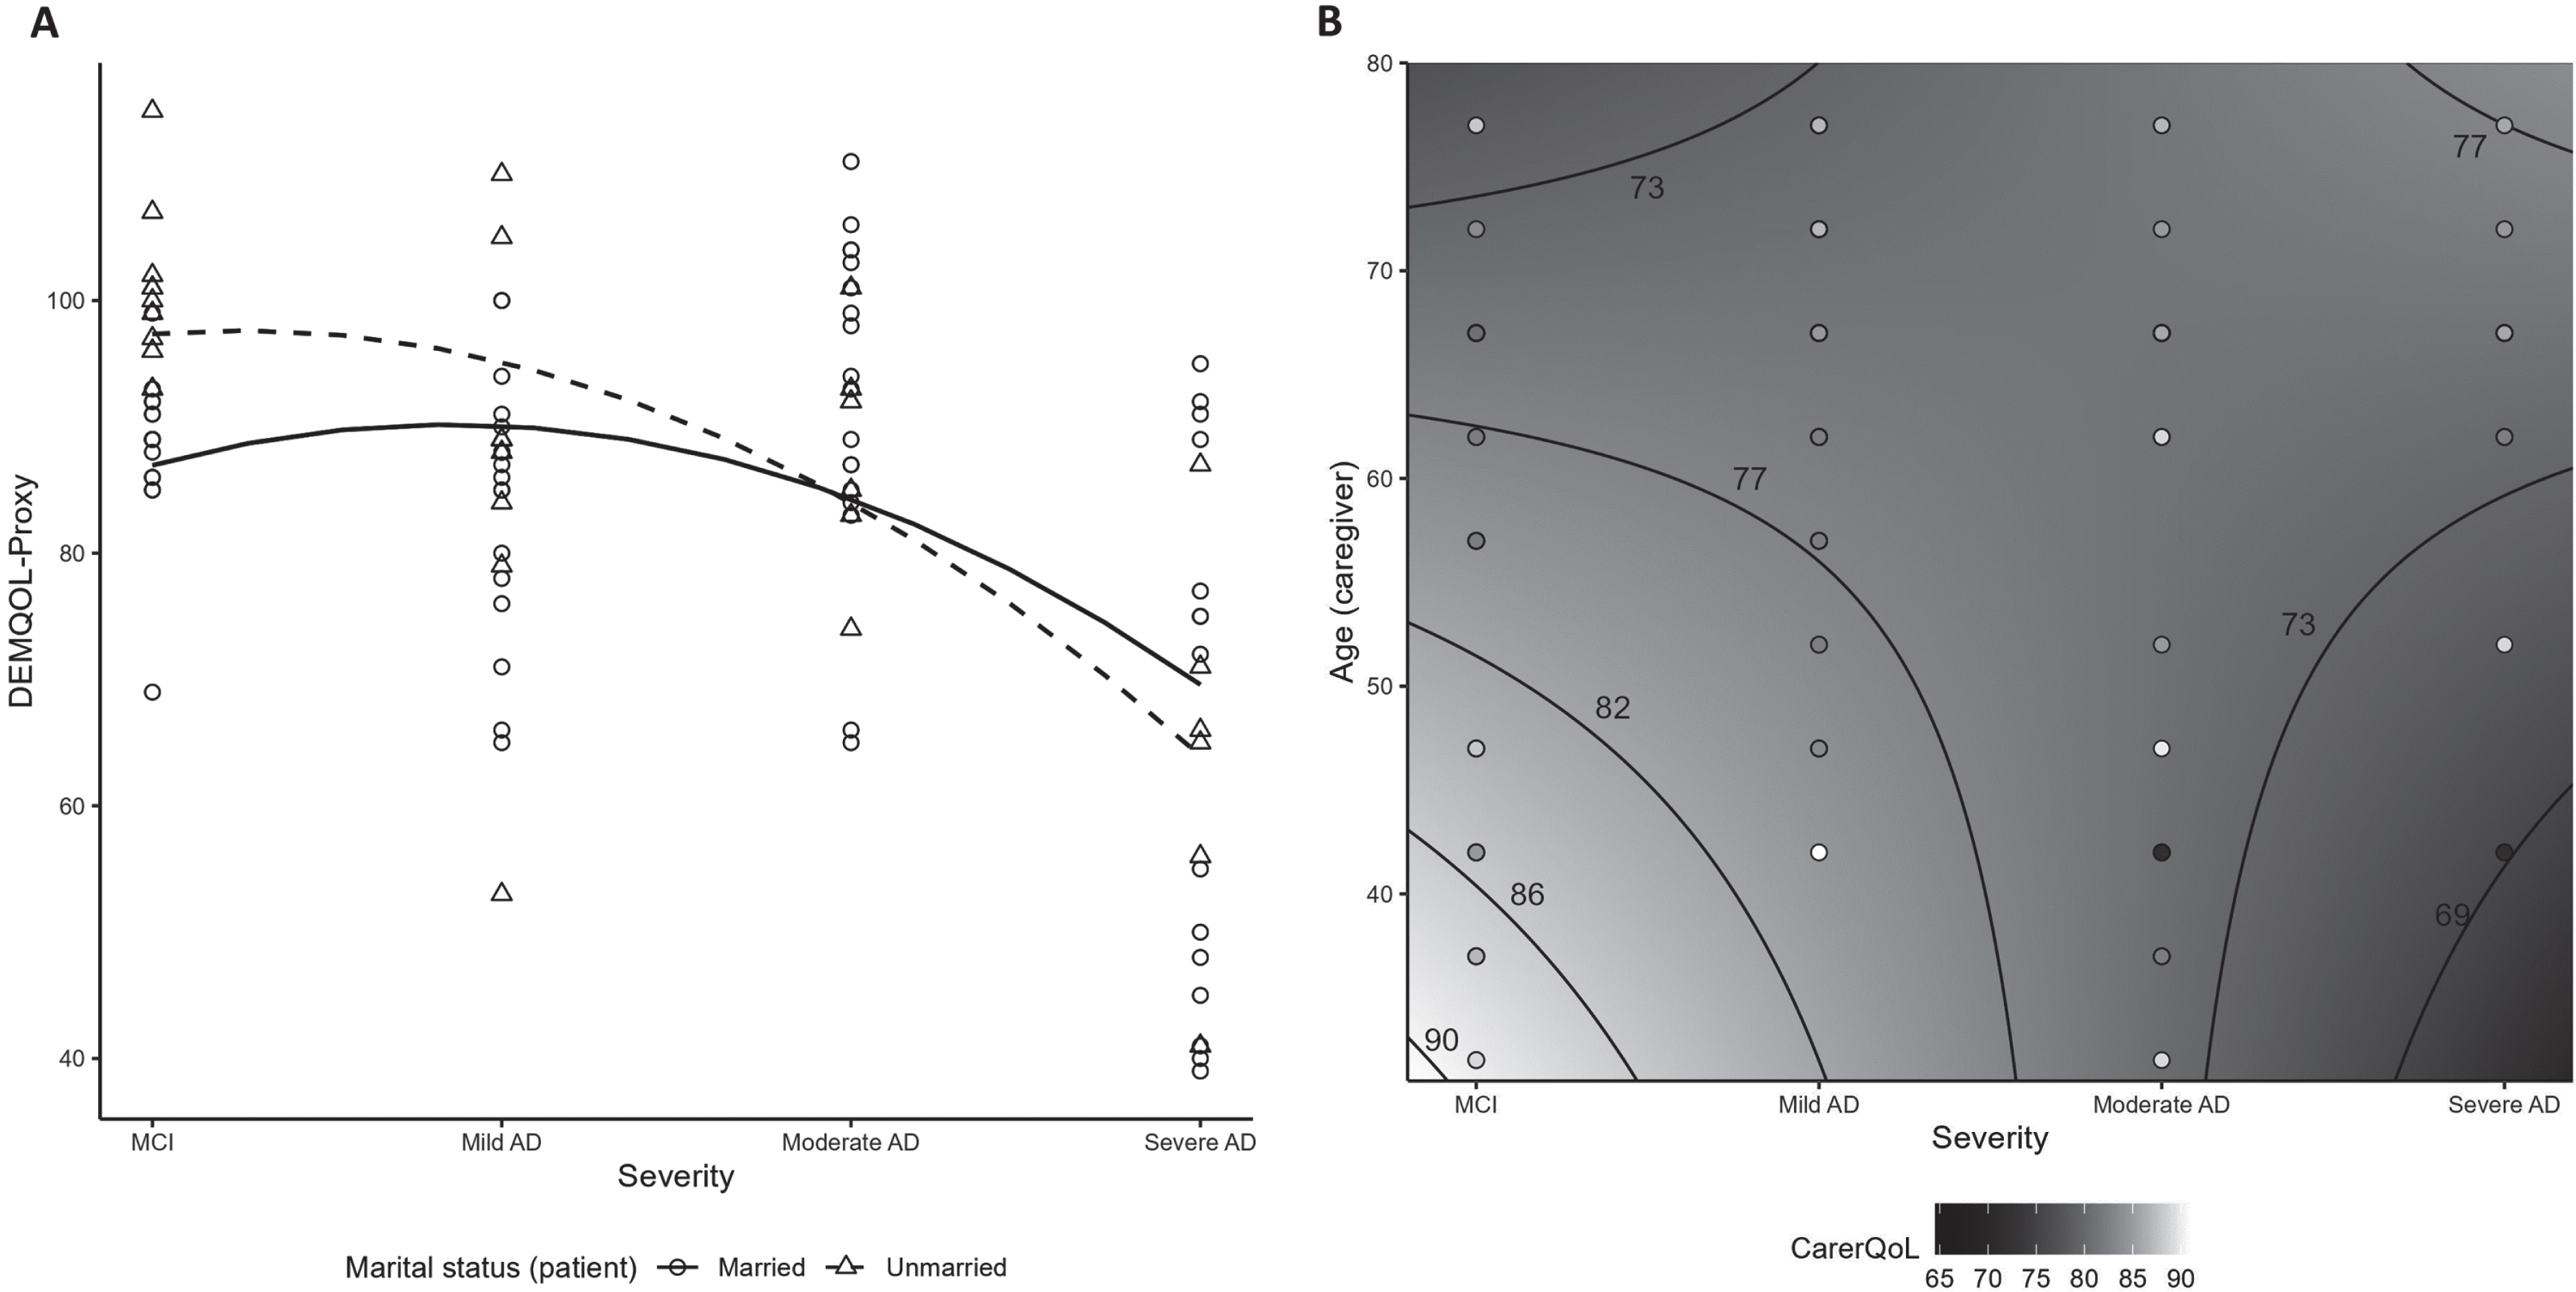
Among all patients, their health-related QoL, as reported by caregivers using DEMQOL-Proxy, exhibited its lowest level with severe AD at 65.2±19.2 and ranged from 85.3–93.3 with MCI, mild and moderate AD (Table 3). Overall, patient QoL adjusted for baseline characteristics was lower from MCI to more advanced disease stages, with a more pronounced decrease after mild AD (p < 0.01; Supplementary Table 5 and Fig. 2A). Compared to unmarried patients, patient QoL for married patients was worse over MCI and mild AD, but better over moderate and severe AD stages (p = 0.03; Supplementary Table 5 and Fig. 2A). A directionally consistent association was found between all 8 patient QoL questions and DEMQOL-Proxy scores with significant (p < 0.02) associations for 6 of the questions (Supplementary Table 6).
Table 3
Quality of life scores of patients and caregivers
| MCI | Mild AD | Moderate AD | Severe AD | Total AD | |
| N = 27 | N = 27 | N = 25 | N = 21 | N = 73 | |
| DEMQOL-Proxy score | 93.3±8.6 | 85.3±12.2 | 91.2±11.7 | 65.2±19.2 | 81.5±17.8 |
| CarerQoL-7D utility score | 80.8±9.1 | 74.2±12.0 | 77.7±12.8 | 78.9±11.9 | 76.7±12.3 |
| DS | 6.7±2.9 | 6.4±2.6 | 7.4±3.5 | 11.8±2.7 | 8.3±3.7 |
Values are expressed as mean±standard deviation. Note: DEMQOL-Proxy can range from 31 to 124, with higher scores indicating enhanced patient QoL. CarerQoL-7D utility scores can range from 0 to 100, with higher scores indicating enhanced caregiver QoL. The DS can range from 0 to 15, with higher scores indicating greater levels of patient dependence. AD, Alzheimer’s disease; DEMQOL, Dementia Quality of Life; DS, dependence scale; CarerQoL-7D, Care-related Quality of Life –7 dimensions; MCI, mild cognitive impairment.
Fig. 2
Quality of life scores by AD disease severity: signficant interactions (A) Patient QoL measured by DEMQOL-Proxy (interaction between severity and patient marital status); (B) CarerQoL-7D utility among unpaid/informal caregivers (contour plot illustrating interaction between severity and caregiver age). AD, Alzheimer’s disease; DEMQOL, Dementia Quality of Life; CarerQoL-7D, Care-related Quality of Life –7 dimensions; MCI, mild cognitive impairment.
Caregiver QoL
Among all caregivers, care-related QoL, measured using the CarerQoL-7D utility scores, ranged from 74.2–80.8, on average, with no significant association with disease severity (Table 3; Supplementary Table 5). In the subgroup of unpaid/informal caregivers (n = 79), care-related QoL ranged from 73.9–79.8 on average and decreased with disease severity (p = 0.02; Supplementary Tables 7 and 8). Additionally, in this unpaid subgroup, older caregiver age and more advanced patient severity were associated with poorer caregiver QoL (p = 0.03; Fig. 2B, Supplementary Table 8). An outlying observation was that younger caregiver age and severe AD were also associated with lower QoL.
Patient dependence
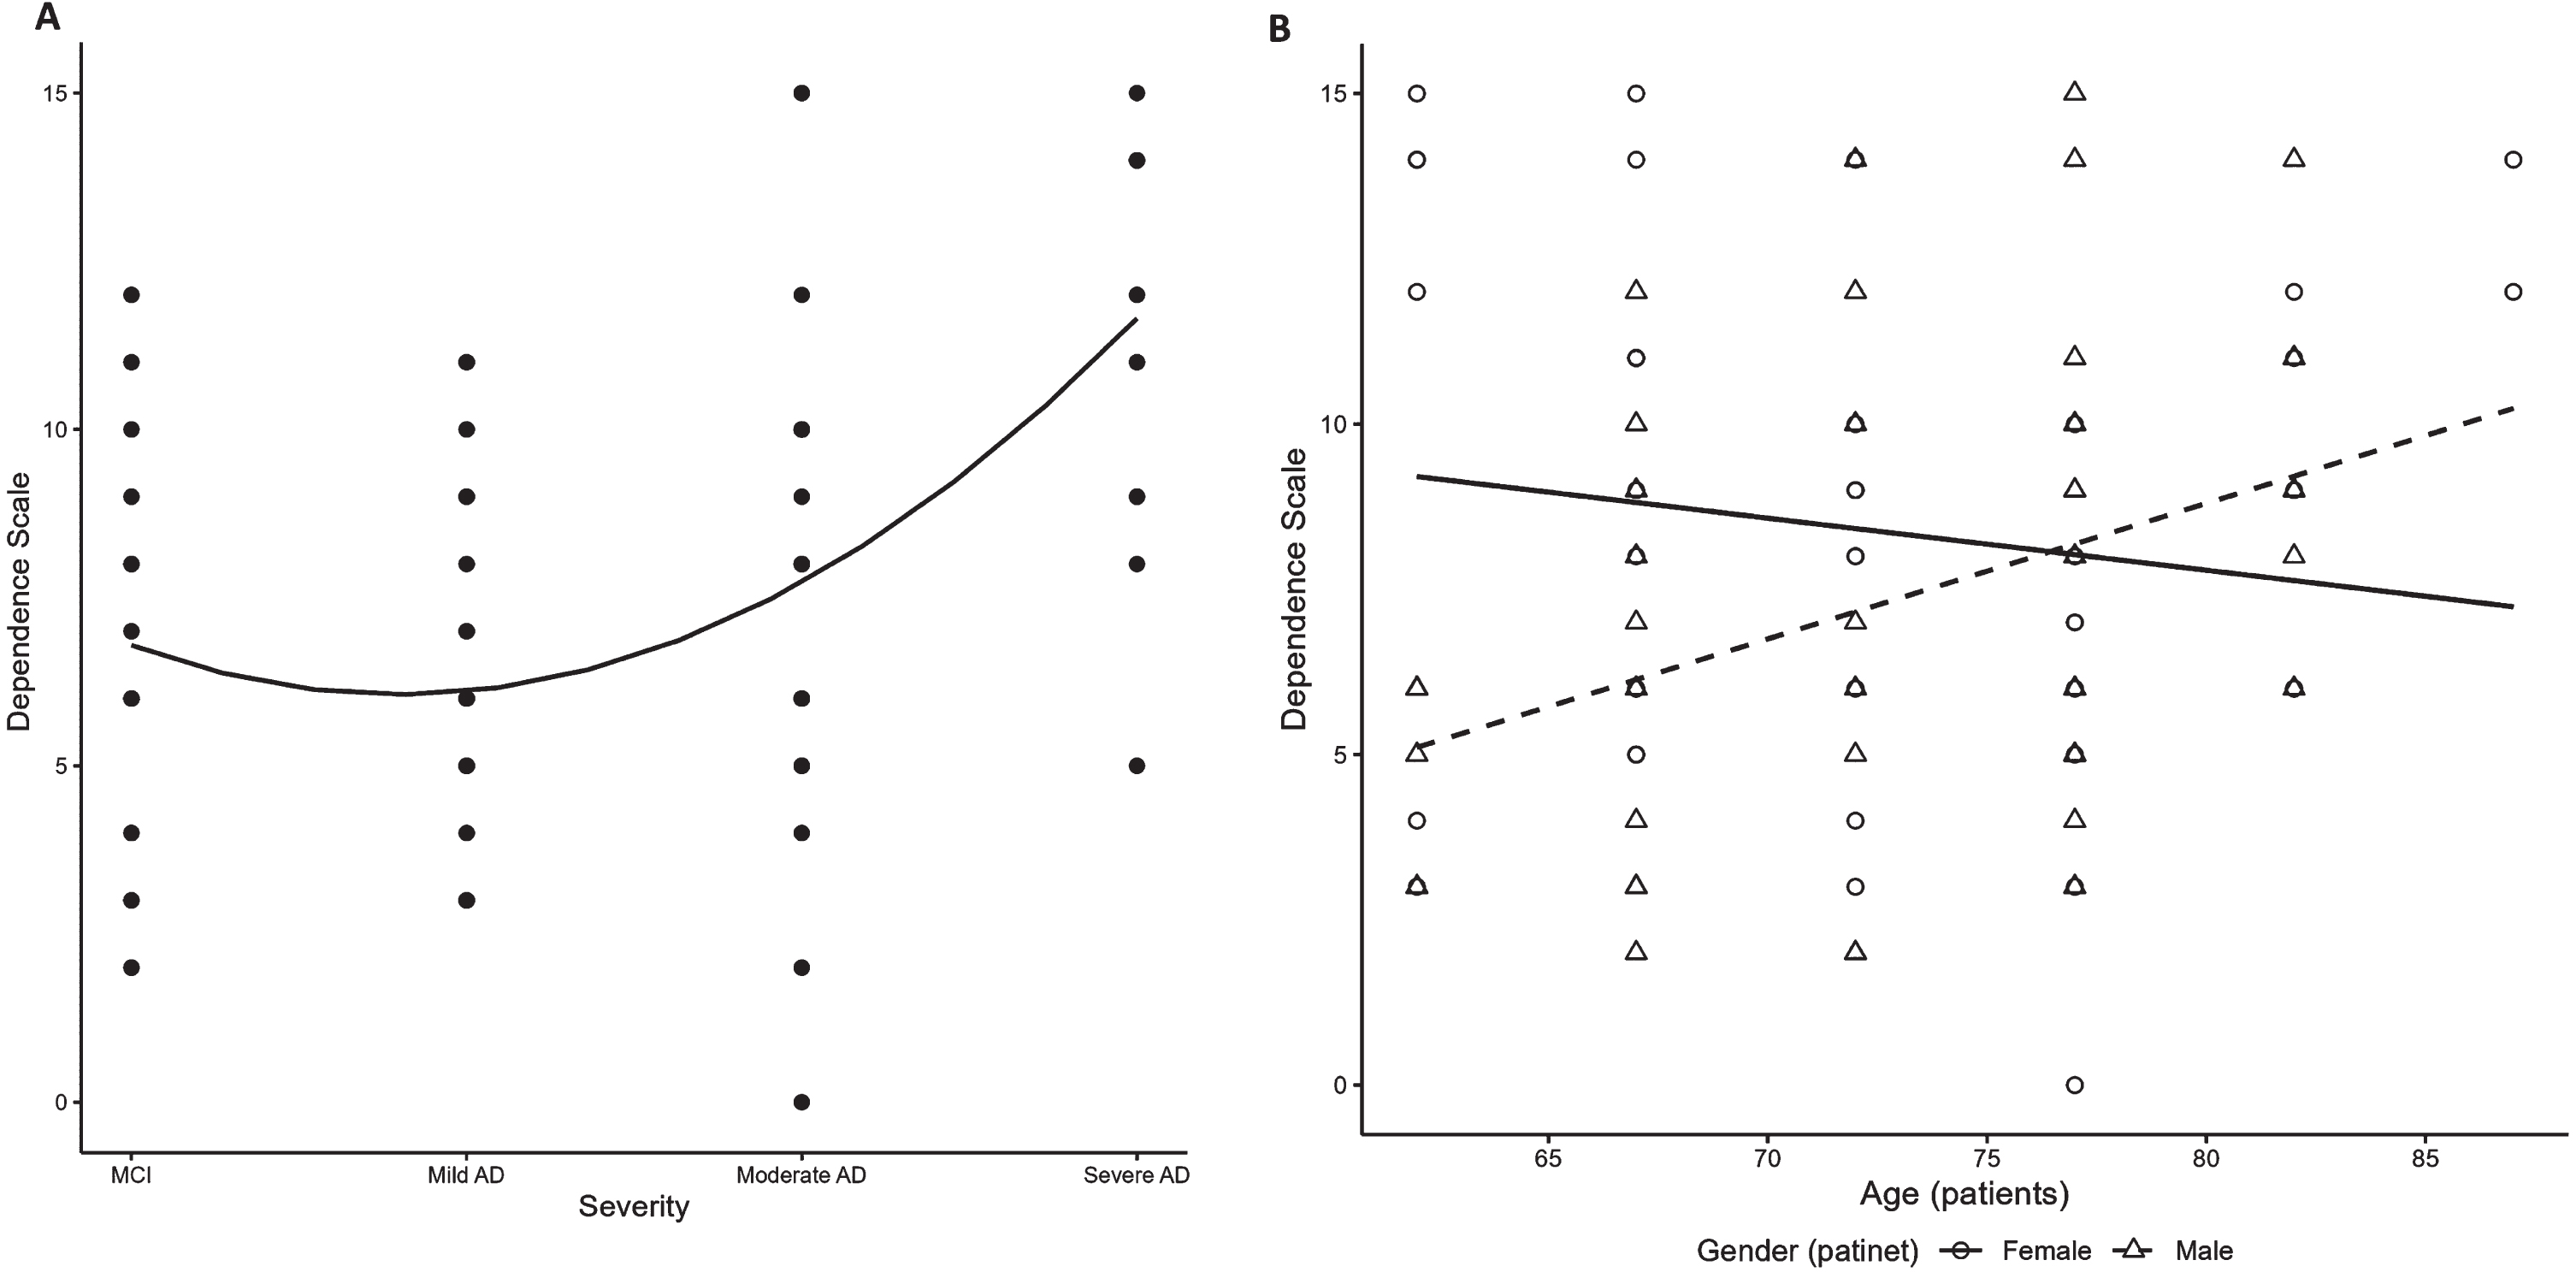
Dependence of patients, as reported by caregivers and measured by DS scores, was generally higher in patients with more severe AD: overall scores were 6.7±2.9 for MCI, and 6.4±2.6, 7.4±3.5 and 11.8±2.7 for mild, moderate, and severe AD, respectively (Table 3). A significant positive association of DS with disease severity was observed (p < 0.01; Fig. 3A, Supplementary Table 5). Regardless of severity, among males with AD, dependence increased with older age; in contrast, dependence among females was fairly stable, and even slightly decreased, with older age (p = 0.01; Fig. 3B, Supplementary Table 5).
Fig. 3
Patient dependence by AD disease severity. (A) DS (overall finding); (B) DS (interaction between age and patient sex). AD, Alzheimer’s disease; DS, dependence scale; MCI, mild cognitive impairment.
Costs
Indirect costs to caregivers
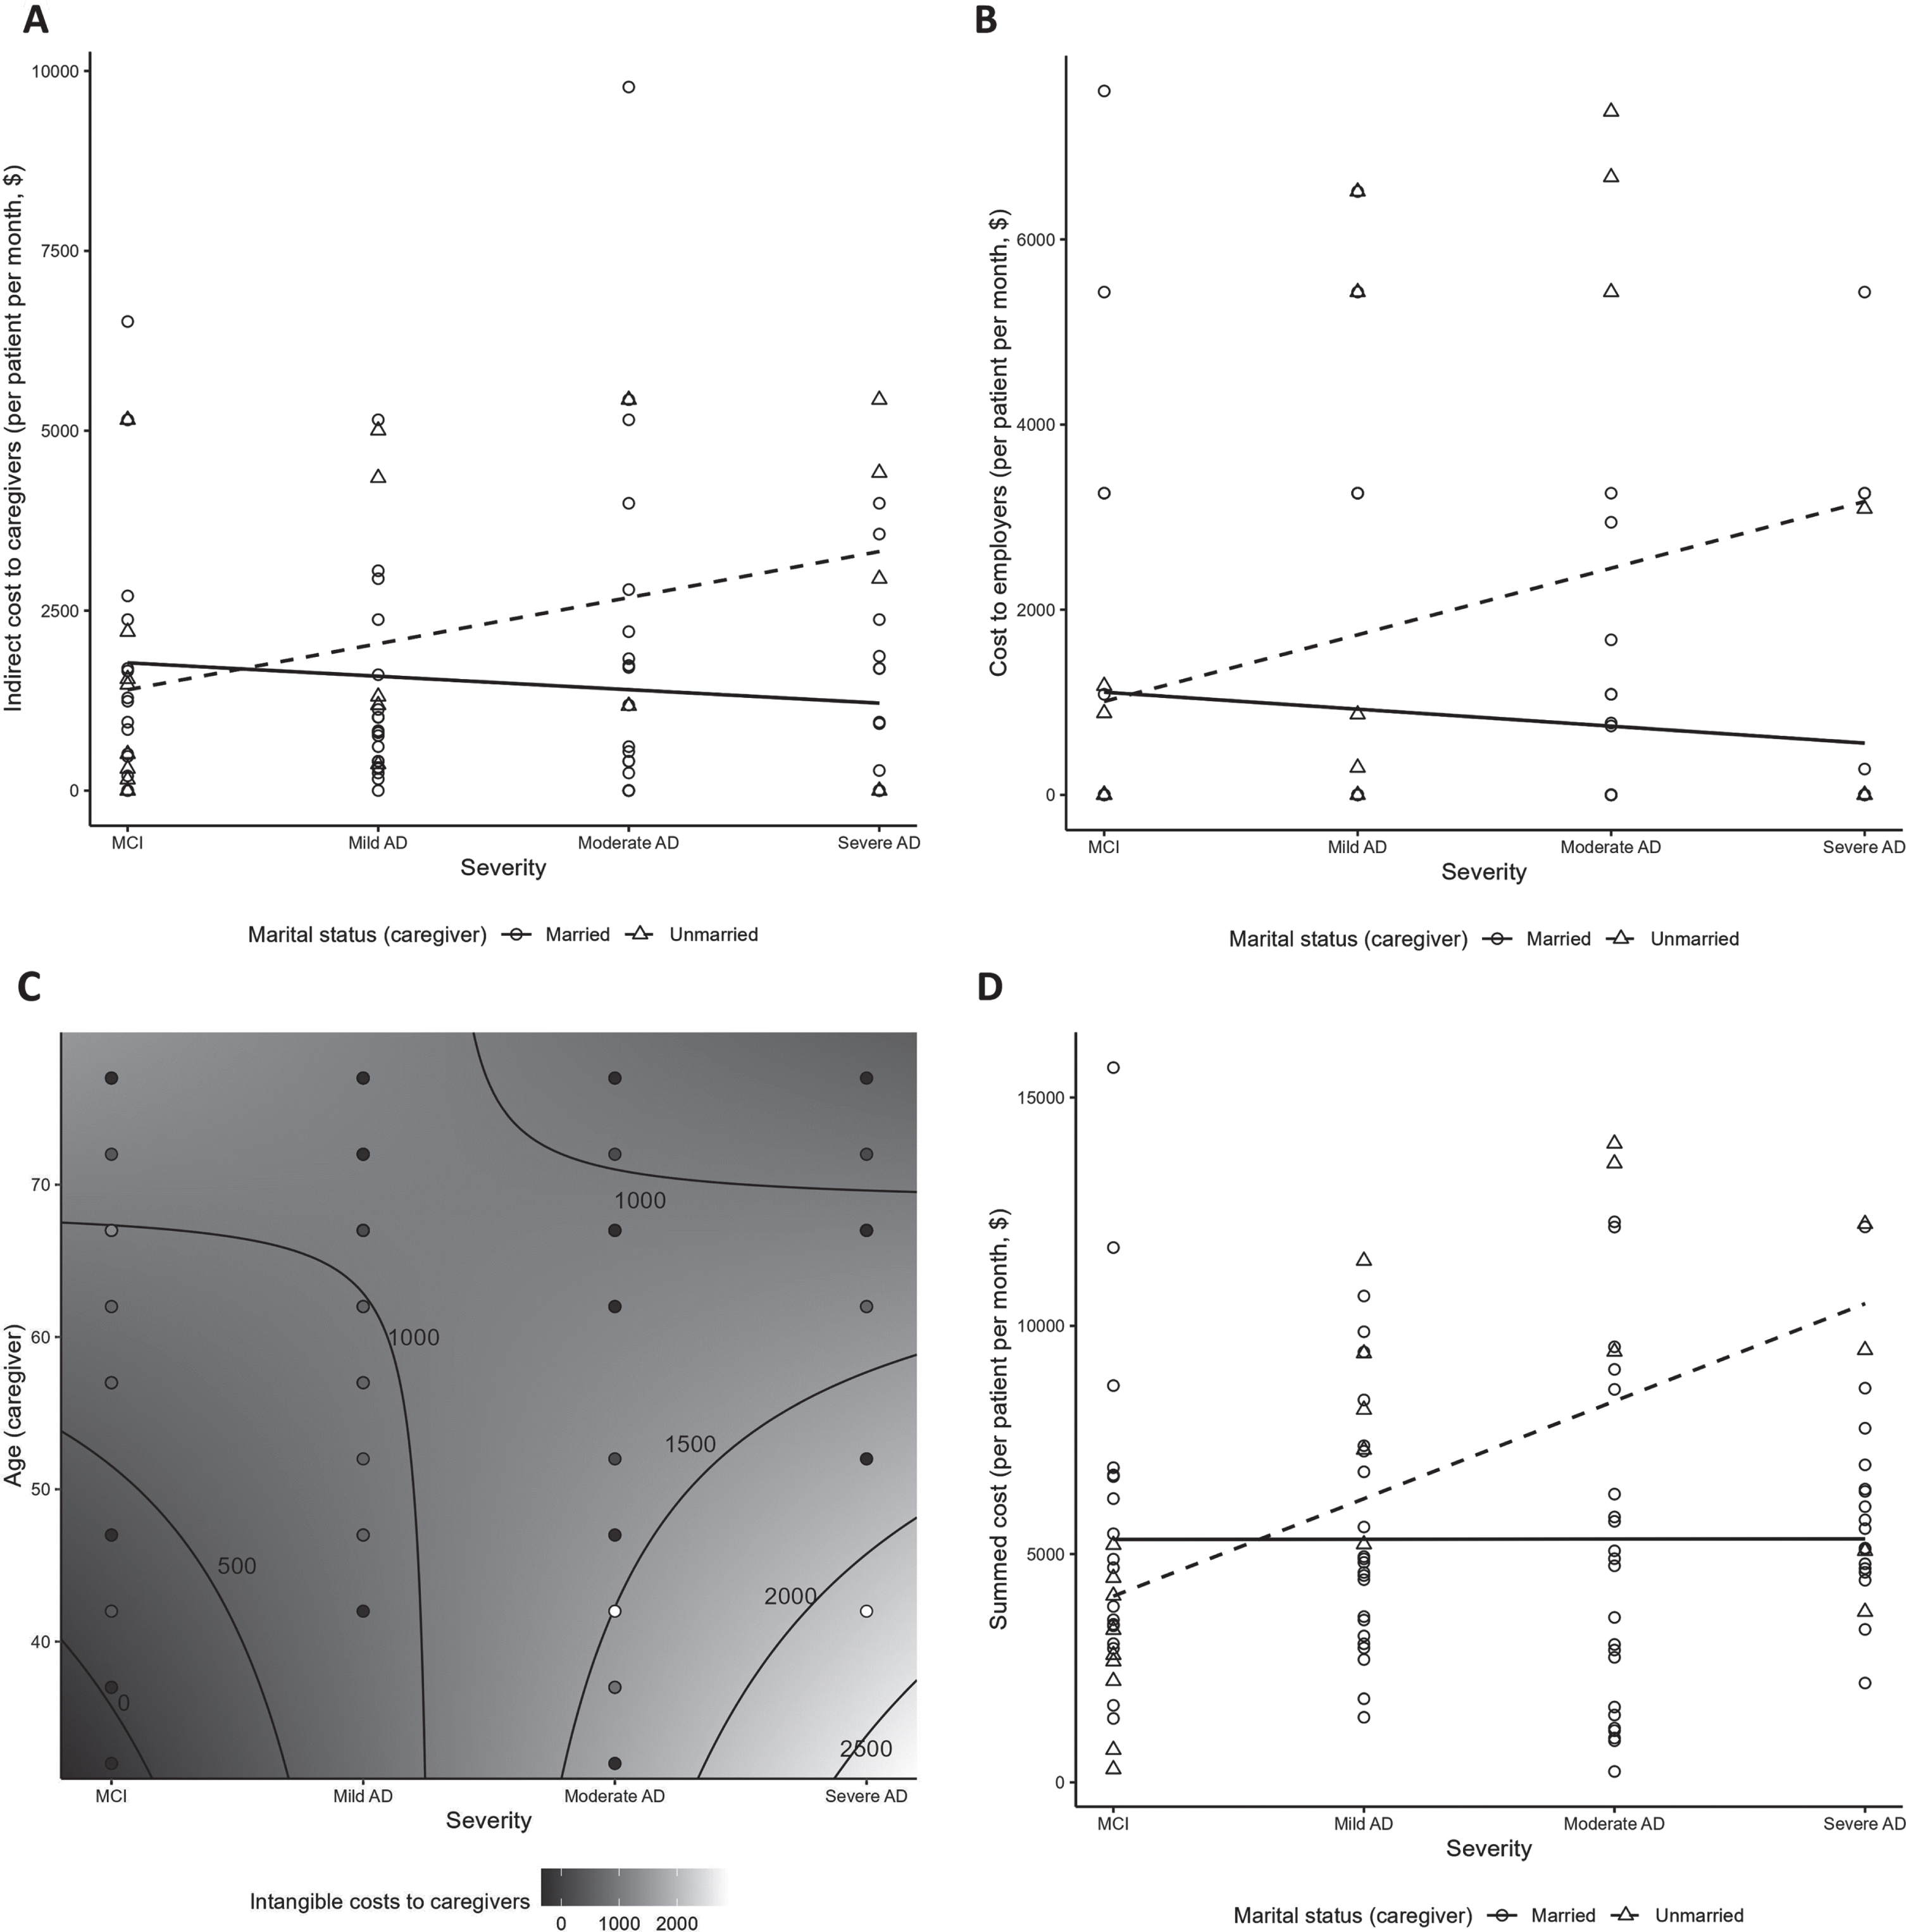
Indirect costs per person per month (PPPM) to caregivers from unpaid caregiving time ranged from $1,393.1 to $1,833.0, with no clear pattern across severity categories (Table 4). No significant relationship between indirect costs to caregivers (overall or unpaid subgroup) and disease severity was observed (Supplementary Tables 5 and 8). Indirect costs were higher among caregivers who were employed and those who provided more caregiving hours (both p < 0.01; Supplementary Table 5). Non-spousal caregivers were more likely to incur greater indirect costs with more advanced disease severity (p = 0.01; Fig. 4A, Supplementary Table 5). Among unpaid caregivers, indirect costs increased with higher age and employment (both p < 0.01; Supplementary Table 8).
Fig. 4
Costs by disease severity: significant interactions. (A) Indirect costs to caregivers (interaction between severity and caregiver marital status); (B) costs to employers (interaction between severity and caregiver marital status); (C) Intangible costs to unpaid/informal caregivers (contour plot illustrating interaction between severity and caregiver age); (D) Summed costsa (interaction between severity and caregiver marital status). aSummed costs include the indirect costs to caregivers, costs to employers, and intangible costs to patients and caregivers. AD, Alzheimer’s disease; MCI, mild cognitive impairment.
Costs to employers
Costs to employers from absenteeism of caregivers and replacement of patients and caregivers at work were highest in the mild and moderate AD groups (range $1242.3–$1290.3) (Table 4). A significant positive association of costs to employers with disease severity was observed (p < 0.05; Supplementary Table 5). Costs to employers increased with severity for unmarried caregivers (p = 0.03; Fig. 4B, Supplementary Table 5).
Intangible costs to patients
Intangible costs to patients were highest in patients with severe AD ($3,195.8±1351.9) and ranged from $1,496.3 to $1,958.3 for MCI to moderate AD (Table 4). Intangible costs to patients increased with disease severity (p < 0.01; Supplementary Table 5).
Intangible costs to caregivers
Intangible costs to caregivers were lowest for caregivers of patients with MCI at ($606.9±729.0) and highest for caregivers of patients with mild AD ($1187.0±1201.5) (Table 4). There was a trend for intangible costs to caregivers being associated with higher education and increased severity (p = 0.06; Supplementary Table 5). In the subgroup of 79 unpaid/informal caregivers, intangible costs ranged $636.5–$1,294.3 (Supplementary Table 7) and increased with younger caregiver age and advanced disease severity (p = 0.02; Fig. 4C, Supplementary Table 8), with disease severity being the main driver of cost (p < 0.01; Supplementary Table 8).
Additional details on the derivation of costs are included in Supplementary Table 9.
Table 4
Costs per person per month by disease severity
| Costs per person per month, $ | MCI N = 27 | Mild AD N = 27 | Moderate AD N = 25 | Severe AD N = 21 | Total AD N = 73 |
| Indirect costs to caregivers | 1,751.4±1,957.6 | 1,393.1±1,463.6 | 1,833.0±2,417.9 | 1,516.4±1,697.8 | 1,579.2±1,886.7 |
| Costs to employers | 840.8±1,889.5 | 1,290.3±2,250.8 | 1,242.3±2,194.1 | 729.5±1,568.5 | 1,112.6±2,044.0 |
| Intangible costs to patients | 1,496.3±1227.5 | 1,958.3±1339.1 | 1,571.5±1096.0 | 3,195.8±1351.9 | 2,181.8±1,415.5 |
| Intangible costs to caregivers | 606.9±729.0 | 1187.0±1201.5 | 993.5±1249.6 | 768.5±1192.7 | 1,000.3±1,210.7 |
| Summed costsa | 4,695.4±3,303.9 | 5,828.8±2,790.7 | 5,640.3±4,305.6 | 6,210.3±2,610.8 | 5,874.0±3,307.3 |
Values are expressed as mean±standard deviation. AD, Alzheimer’s disease; MCI, mild cognitive impairment. aSummed costs include indirect costs to caregivers, costs to employers, and intangible costs to patients and to caregivers.
Summed costs
Summed costs in this analysis (i.e., sum of indirect costs to caregivers, costs to employers, intangible costs to patients, and intangible costs to caregivers) were generally higher in more severe AD: $4,695.4±3,303.9 for patients with MCI, and $5,828.8±2,790.7, $5,640.3±4,305.6 and $6,210.3±2,610.8 for those with mild, moderate, and severe AD, respectively (Table 4). A significant positive association between the summed costs from this analysis and disease severity was observed (p < 0.01; Supplementary Table 5). Summed costs appeared to be increased with disease severity among unmarried, but not married caregivers (p < 0.01; Fig. 4D).
DISCUSSION
The impact of AD disease severity on QoL and indirect/intangible cost across the disease continuum from MCI to severe AD was examined using an on-line survey of 100 physician-identified patient-caregiver dyads living in the US. Disease severity was found to have a negative impact on patient QoL and dependence, and on QoL in the subgroup of unpaid caregivers. A consistent relationship was not found between disease severity and indirect costs to caregivers; however, a discernible relationship was observed between disease severity and costs to employers. Higher disease severity was associated with higher intangible costs, which we defined as costs attributed to loss in QoL, to patients and unpaid caregivers. Overall, higher disease severity was associated with significantly higher summed costs.
Given that increases in AD severity are associated with lower patient ability to perform everyday activities/ADLs [4, 16], the association between disease severity and higher patient dependence was expected. Our finding that dependence increased with age among males, but was stable with age among females has not been reported previously, and may suggest that older females are more self-reliant. As noted, increased AD severity was associated with lower QoL in patients, but not with lower QoL in caregivers overall; however, when we examined the subgroup of unpaid/informal caregivers, who represented almost 80% of the caregivers surveyed, we found a significant association between higher severity and lower caregiver QoL. This finding is not unexpected given research suggesting that informal (family) caregivers generally perceive a greater burden relative to professional caregivers [41]. We speculate that the QoL for unpaid caregivers may often be more impaired due to financial strain, demands on energy and personal time, career impact, potential health consequences, and future financial insecurity. The absence of compensation and support can exacerbate the challenges caregivers face in providing essential care, impacting their overall well-being and quality of life. For instance, unpaid caregivers may have little time for themselves, which can lead to decreased opportunities for self-care and leisure activities as well as feelings of loneliness/social isolation [42, 43]. Many unpaid caregivers must reduce their working hours or even leave their jobs to provide care. This can have long-term financial consequences, affecting their retirement savings and future employability. Moreover, unpaid caregivers may jeopardize their own financial security by diverting resources and time away from their own careers and financial well-being.
Findings from prior investigations exploring the relationship between AD disease severity and QoL are inconsistent, as evident in the literature [44–48]. Of interest, a multicenter European prospective community-based cohort study of 616 patient-caregiver dyads did not find a significant change in self-reported QoL over time by AD severity for either patients or caregivers [49]. Similarly, a longitudinal multicenter UK cohort study of 145 patients (community dwelling and institutionalized) with possible/probable AD and their caregivers found that the impact of disease severity on QoL was not clear or consistent; the investigators speculated that the potential impacts of increasing dependence/worsening disease severity may be “buffered” by other factors (e.g., psychological, social, environmental) [44]. These studies differ notably from the current investigation. While the cohort studies were longitudinal, examining change in QoL over time, our survey was cross-sectional, and focused on whether QoL differed between disease stages from MCI to severe AD. Other investigations have reported association between AD severity and worsening QoL of patients [46–48] and caregivers [48].
We found that in early disease (MCI, mild AD), being unmarried was associated with better QoL, whereas in later stages (moderate/severe AD), being married was associated with better QoL. Existing literature regarding marital status and AD suggests that being unmarried may be a risk factor for dementia [50, 51], being divorced/widowed at older ages may be a risk factor for cognitive impairment and progression to dementia [52], and, likewise, living alone with AD has been associated with receiving less optimal AD-related healthcare and increased use of antidepressants and other psychotropic drugs [53].
Our finding that more severe disease was associated with higher intangible costs to patients as well as to unpaid/informal caregivers represents a significant contribution to the existing body of evidence. This is particularly noteworthy as intangible costs are difficult to measure and have not frequently been subject to in-depth investigation [17, 54]. The formulation of intangible costs is novel and relies on the reduction of patient or caregiver QoL as compared to the general US population of the same age, quantified as health utilities. This is then multiplied by the widely adopted willingness-to-pay threshold of $150,000 for each quality-adjusted life year, a standard parameter commonly employed in health economic evaluations within the US [39].
Many previous investigations have explored the relationship between AD severity and direct and/or indirect costs [14, 46, 55–57]. A meta-analysis of 9 studies including 3,569 patients with AD from the US and Europe [55] reported that increased AD severity was associated with increased total costs. Also of interest, an Ireland-based longitudinal study of 72 community-dwelling patients with MCI and AD found that costs rose over 2 years, primarily due to increased informal care costs as patients had worsening dependence, function, and cognitive impairment [56]. We did not find a clear impact of higher disease severity on indirect costs, which was unexpected given previous findings that the contribution of indirect costs increases as AD progresses in community settings [58]. We speculate that the indirect cost value was lower in our severe AD group since 1) indirect costs were primarily based on unpaid caregiving time and 2) our severe AD group had a high proportion of caregivers reporting full-time employment, suggesting they were likely formal/professional caregivers (i.e., who therefore would have had few unpaid working hours, if any), and 3) some of the surveyed patients were in residential care/nursing homes, which has been associated with decreased indirect costs [58].
Limitations
Survey data are based on self-report and subject to recall bias; however, a strength of this study is that the MCI and AD diagnosis classifications were identified/confirmed by the physicians caring for the surveyed patients. There was potential for selection bias since patients were required to have caregivers; this was particularly a concern in the MCI group, as these patients may not typically require caregivers, thus this group may not be as representative of the general MCI population. We did not identify a consistent negative impact of higher disease severity on all the QoL and cost measures assessed. While such inconsistency has been found in the literature, the relatively small sample sizes in our survey of ∼25 patient-caregiver dyads per disease severity category may also have been a contributing factor. Another consideration is that discordance between clinician’s assessments of AD severity and cognitive test-based assessments has been documented and may differ by clinician types [59], thus there may be some variability in MCI and AD severity classifications. We did not require AD biomarker testing, therefore it is possible that some patients in the MCI group had MCI due to causes other than AD; this may impact findings as there is data supporting that amyloid-positive MCI is associated with decreased QoL vs amyloid-negative MCI [45]. Additionally, the DEMQOL-Proxy was used for QoL assessments, and discrepancies between QoL ratings by patients with dementia and their proxies have been well documented, especially with increasing disease severity [60–62]. Nonetheless, based on our supportive correlation analysis, patient answers to QoL questions were directionally consistent with DEMQOL-Proxy scores. From prior research we recognize that the burden of AD can impact a broad range of areas including psychological well-being, social/relational well-being, physical well-being, function and independence, and cognition; our patient QoL questions touched on several of these areas [5]. Due to the limited sample size in our survey, disease severity was treated as a continuous variable in our models, which might not be adequate given that AD does not progress linearly, but this approach is still valid for identifying trends in the data. Finally, our findings may not be generalizable to the overall AD population in the US.
Conclusions
This survey of 100 physician-identified patient-caregiver dyads in the US found that increasing AD severity has a negative impact on patient QoL and independence, as well as on QoL in unpaid caregivers. While indirect costs to caregivers were comparable across the spectrum of MCI/AD severities, costs to employers were highest in mild and moderate AD. In our novel analysis of intangible healthcare costs, we found that patients with clinically diagnosed MCI and AD and unpaid caregivers incurred substantial intangible costs that were highest in severe AD. The summed costs in this analysis significantly increased for more severe AD. These findings underscore the need for effective clinical interventions that prevent or slow the progression of AD. This survey-driven study reflects a dedicated attempt not only to grasp the AD progression-related challenges deeply, but also to pave the way for better interventions, ultimately creating a stronger and more effective care environment. This, in turn, forms a strong basis for making informed decisions, allocating resources wisely, and creating targeted policies in the care of patients with MCI and AD.
AUTHOR CONTRIBUTIONS
Amir Abbas Tahami Monfared (Conceptualization; Methodology; Writing – original draft; Writing – review & editing); Artak Khachatryan (Methodology; Writing – original draft; Writing – review & editing); Noemi Hummel (Formal analysis; Methodology; Project administration; Writing – original draft; Writing – review & editing); Agnieszka Kopiec (Data curation; Formal analysis; Methodology; Writing – original draft; Writing – review & editing); Marta Martinez (Methodology; Writing – original draft; Writing – review & editing); Raymond Zhang (Methodology; Writing – original draft; Writing – review & editing); Quanwu Zhang (Conceptualization; Methodology; Writing – original draft; Writing – review & editing).
ACKNOWLEDGMENTS
Editorial assistance and medical writing support were provided by Kulvinder Katie Singh, PharmD of KK Singh, LLC (Branchburg, NJ, USA) and funded by Eisai, Inc (Nutley, NJ, USA). Identification of physicians and collection of online surveys was done by M3 Global Research Fort Washington, Pennsylvania, US, in partnership with Food & Drug Research, Stamford, Connecticut, US.
FUNDING
This survey was funded by Eisai, Inc (Nutley, NJ, USA). Participating physicians were compensated for their time by M3 Global Research.
CONFLICT OF INTEREST
Amir Abbas Tahami Monfared is an employee of Eisai Inc. He serves as Associate Editor for the Journal of Alzheimer’s Disease but was not involved in the peer-review process nor had access to any information regarding its peer-review. Quanwu Zhang and Raymond Zhang are employees of Eisai Inc. Noemi Hummel, Artak Khachatryan, Agnieszka Kopiec and Marta Martinez are employees of Certara, which is a paid consultant to Eisai. Kulvinder K Singh received funding from Eisai for providing medical writing support.
DATA AVAILABILITY
The analytic dataset supporting the findings of this study can be made available upon editorial request.
SUPPLEMENTARY MATERIAL
[1] The supplementary material is available in the electronic version of this article: https://dx.doi.org/10.3233/JAD-231259.
REFERENCES
[1] | Gauthier S , Webster C , Servaes S , Morais J , Rosa-Neto P World Alzheimer Report 2022: Life after diagnosis: Navigating treatment, care and support, Alzheimer’s Disease International, https://www.alzint.org/u/World-Alzheimer-Report-2022.pdf, Accessed August 15, 2023. |
[2] | WHO, Dementia fact sheet, https://www.who.int/newsroom/fact-sheets/detail/dementia, Accessed August 14, 2023. |
[3] | Rajan KB , Weuve J , Barnes LL , McAninch EA , Wilson RS , Evans DA ((2021) ) Population estimate of people with clinical Alzheimer’s disease and mild cognitive impairment in the United States (2020-2060). Alzheimers Dement 17: , 1966–1975. |
[4] | Alzheimer’s Association ((2023) ) 2023 Alzheimer’s disease facts and figures. Alzheimers Dement 19: , 1598–1695. |
[5] | Tahami Monfared AA , Stern Y , Doogan S , Irizarry M , Zhang Q ((2022) ) Stakeholder insights in Alzheimer’s disease: Natural languageprocessing of social media conversations. J Alzheimers Dis 89: , 695–708. |
[6] | Martyr A , Nelis SM , Quinn C , Wu YT , Lamont RA , Henderson C , Clarke R , Hindle JV , Thom JM , Jones IR , Morris RG , Rusted JM , Victor CR , Clare L ((2018) ) Living well with dementia: A systematic review andcorrelational meta-analysis of factors associated with quality oflife, well-being and life satisfaction in people with dementia. Psychol Med 48: , 2130–2139. |
[7] | Bárrios H , Narciso S , Guerreiro M , Maroco J , Logsdon R , deMendonca A ((2013) ) Quality of life in patients with mildcognitive impairment. Aging Ment Health 17: , 287–292. |
[8] | Skaria AP ((2022) ) The economic and societal burden of Alzheimerdisease: Managed care considerations. Am J Manag Care 28: , S188–s196. |
[9] | Aranda MP , Kremer IN , Hinton L , Zissimopoulos J , Whitmer RA , Hummel CH , Trejo L , Fabius C ((2021) ) Impact of dementia: Health disparities, population trends, care interventions, and economic costs. J Am Geriatr Soc 69: , 1774–1783. |
[10] | Friedman EM , Shih RA , Langa KM , Hurd MD ((2015) ) US prevalence and predictors of informal caregiving for dementia. Health Aff (Millwood) 34: , 1637–1641. |
[11] | Kasper JD , Freedman VA , Spillman BC , Wolff JL ((2015) ) The disproportionate impact of dementia on family and unpaid caregiving to older adults. Health Aff (Millwood) 34: , 1642–1649. |
[12] | Hurd MD , Martorell P , Langa KM ((2013) ) Monetary costs of dementia in the United States. N Engl J Med 369: , 489–490. |
[13] | Zissimopoulos J , Crimmins E , St Clair P ((2014) ) The value of delaying Alzheimer’s disease onset. Forum Health Econ Policy 18: , 25–39. |
[14] | Robinson RL , Rentz DM , Andrews JS , Zagar A , Kim Y , Bruemmer V , Schwartz RL , Ye W , Fillit HM ((2020) ) Costs of early stage Alzheimer’sdisease in the United States: Cross-sectional analysis of aprospective cohort study (GERAS-US). J Alzheimers Dis 75: , 437–450. |
[15] | Tahami Monfared AA , Byrnes MJ , White LA , Zhang Q ((2022) ) The humanistic and economic burden of Alzheimer’s disease. Neurol Ther 11: , 525–551. |
[16] | Deb A , Thornton JD , Sambamoorthi U , Innes K ((2017) ) Direct and indirect cost of managing alzheimer’s disease and related dementias in the United States. Expert Rev Pharmacoecon Outcomes Res 17: , 189–202. |
[17] | Colucci L , Bosco M , Fasanaro AM , Gaeta GL , Ricci G , Amenta F ((2014) ) Alzheimer’s disease costs: What we know and what we should take intoaccount. J Alzheimers Dis 42: , 1311–1324. |
[18] | El-Hayek YH , Wiley RE , Khoury CP , Daya RP , Ballard C , Evans AR , Karran M , Molinuevo JL , Norton M , Atri A ((2019) ) Tip of the iceberg:Assessing the global socioeconomic costs of Alzheimer’s disease andrelated dementias and strategic implications for stakeholders. J Alzheimers Dis 70: , 323–341. |
[19] | Smith SC , Lamping DL , Banerjee S , Harwood RH , Foley B , Smith P , Cook JC , Murray J , Prince M , Levin E , Mann A , Knapp M ((2007) ) Development of a new measure of health-related quality of life for people with dementia: DEMQOL. Psychol Med 37: , 737–746. |
[20] | Farina N , Feeney Y , Huges L , Banerjee S Excel calculator for the DEMQOL, DEMQOL-Proxy and DEMQOL-CH patient reported output measure, https://sussex.figshare.com/articles/online_resource/Excel_calculator_for_the_DEMQOL_DEMQOL-Proxy_and_DEMQOL-CH_patient_rep_orted_output_measure_/14199326/1, Accessed August 15, 2023. |
[21] | DEMQOL: Dementia quality of life measure, Brighton and Sussex Medical School, https://www.bsms.ac.uk/research/neuroscience/cds/research/demqol.aspx, Accessed August 15, 2023. |
[22] | Hoefman RJ , van Exel NJ , Looren de Jong S , Redekop WK , Brouwer WB ((2011) ) A new test of the construct validity of the CarerQolinstrument: Measuring the impact of informal care giving. QualLife Res 20: , 875–887. |
[23] | Brouwer WB , van Exel NJ , van Gorp B , Redekop WK ((2006) ) The CarerQolinstrument: A new instrument to measure care-related quality of lifeof informal caregivers for use in economic evaluations. QualLife Res 15: , 1005–1021. |
[24] | Stern Y , Albert SM , Sano M , Richards M , Miller L , Folstein M , Albert M , Bylsma FW , Lafleche G ((1994) ) Assessing patient dependence in Alzheimer’s disease.M. J Gerontol 49: , 216–222. |
[25] | Zhu CW , Bruinsma BG , Stern Y ((2018) ) Utility of the Dependence Scalein dementia: Validity, meaningfulness, and health economicconsiderations. Alzheimers Res Ther 10: , 78. |
[26] | Reilly MC , Zbrozek AS , Dukes EM ((1993) ) The validity and reproducibility of a work productivity and activity impairment instrument. Pharmacoeconomics 4: , 353–365. |
[27] | Huang HC , Tseng YM , Chen YC , Chen PY , Chiu HY ((2021) ) Diagnostic accuracy of the Clinical Dementia Rating Scale for detecting mild cognitive impairment and dementia: A bivariate meta-analysis. Int J Geriatr Psychiatry 36: , 239–251. |
[28] | Zhang S , Qiu Q , Qian S , Lin X , Yan F , Sun L , Xiao S , Wang J , Fang Y , Li X ((2021) ) Determining appropriate screening tools and cutoffs for cognitive impairment in the Chinese elderly. Front Psychiatry 12: , 773281. |
[29] | Yan X , Li F , Chen S , Jia J ((2019) ) Associated factors of total costsof Alzheimer’s disease: A cluster-randomized observational study inChina. J Alzheimers Dis 69: , 795–806. |
[30] | Williams MM , Storandt M , Roe CM , Morris JC ((2013) ) Progression of Alzheimer’s disease as measured by Clinical Dementia Rating Sum of Boxes scores. Alzheimers Dement 9: , S39–44. |
[31] | Habbous S , Chu KP , Harland LT , La Delfa A , Fadhel E , Sun B , Xu W , Wong A , Howell D , Ringash J , Waldron J , O’Sullivan B , Goldstein D , Huang SH , Liu G ((2013) ) Validation of a one-page patient-reported Charlson comorbidity index questionnaire for upper aerodigestive tract cancer patients. Oral Oncol 49: , 407–412. |
[32] | Mulhern B , Rowen D , Brazier J , Smith S , Romeo R , Tait R , Watchurst C , Chua KC , Loftus V , Young T , Lamping D , Knapp M , Howard R , Banerjee S ((2013) ) Development of DEMQOL-U and DEMQOL-PROXY-U:Generation of preference-based indices from DEMQOL and DEMQOL-PROXYfor use in economic evaluation.v-xv. Health Technol Assess 17: , v-xv, 1–140. |
[33] | Hoefman RJ , van Exel J , Brouwer WBF ((2017) ) Measuring care-related quality of life of caregivers for use in economic evaluations: CarerQol tariffs for Australia, Germany, Sweden UK, and US. Pharmacoeconomics 35: , 469–478. |
[34] | Hoefman R , Van Exel N , Brouwer W iMTA Valuation of Informal Care Questionnaire (iVICQ). Version 1.1 (May 2013), iBMG / iMTA, https://www.imta.nl/assets/uploads/2022/01/iVICQ_UK_version_1.1.doc, Accessed August 15, 2023. |
[35] | Social Security Administration, Average Wage Index (AWI), https://www.ssa.gov/oact/cola/awidevelop.html, Accessed August 15, 2023. |
[36] | Nagata T , Mori K , Ohtani M , Nagata M , Kajiki S , Fujino Y , Matsuda S , Loeppke R ((2018) ) Total health-related costs due to absenteeism, presenteeism, and medical and pharmaceutical expenses in Japanese employers. J Occup Environ Med 60: , e273–e280. |
[37] | Koppel R Alzheimer’s Disease: The Costs to U.S. Businesses in 2002, Alzheimer’s Association, https://www.alz.org/national/documents/report_alzcosttobusiness.pdf, Accessed August 16, 2023. |
[38] | Jiang R , Janssen MFB , Pickard AS ((2021) ) US population norms for the EQ-5D-5L and comparison of norms from face-to-face and online samples. Qual Life Res 30: , 803–816. |
[39] | ICER, Value Assessment Framework, Updated September 25, 2023, Institute for Clinical and Economic Review, https://icer.org/wp-content/uploads/2023/09/ICER_2023_VAF_For-Publication_092523.pdf, Accessed October 18, 2023. |
[40] | Vanness DJ , Lomas J , Ahn H ((2021) ) A health opportunity cost threshold for cost-effectiveness analysis in the United States. Ann Intern Med 174: , 25–32. |
[41] | Seidel D , Thyrian JR ((2019) ) Burden of caring for people with dementia –comparing family caregivers and professional caregivers. A descriptive study. J Multidiscip Healthc 12: , 655–663. |
[42] | Victor CR , Rippon I , Quinn C , Nelis SM , Martyr A , Hart N , Lamont R , Clare L ((2021) ) The prevalence and predictors of loneliness incaregivers of people with dementia: Findings from the IDEALprogramme. Aging Ment Health 25: , 1232–1238. |
[43] | Lee J , Baik S , Becker TD , Cheon JH ((2022) ) Themes describing social isolation in family caregivers of people living with dementia: A scoping review. Dementia (London) 21: , 701–721. |
[44] | Trigg R , Jones RW , Knapp M , King D , Lacey LA ((2015) ) The relationshipbetween changes in quality of life outcomes and progression ofAlzheimer’s disease: Results from the dependence in AD in England 2longitudinal study. Int J Geriatr Psychiatry 30: , 400–408. |
[45] | Mank A , Rijnhart JJM , van Maurik IS , Jönsson L , Handels R , Bakker ED , Teunissen CE , van Berckel BNM , van Harten AC , Berkhof J , van der Flier WM ((2022) ) A longitudinal study on quality of life along the spectrum of Alzheimer’s disease. Alzheimers Res Ther 14: , 132. |
[46] | Ashizawa T , Igarashi A , Sakata Y , Azuma M , Fujimoto K , Kobayashi T , Takase Y , Ikeda S ((2021) ) Impact of the severity of Alzheimer’s disease on the quality of life, activities of daily living, and caregiving costs for institutionalized patients on anti-alzheimer medications in Japan. J Alzheimers Dis 81: , 367–374. |
[47] | Heßmann P , Seeberg G , Reese JP , Dams J , Baum E , Müller MJ , Dodel R , Balzer-Geldsetzer M ((2016) ) Health-related quality of life in patients with Alzheimer’s disease in different German health care settings. J Alzheimers Dis 51: , 545–561. |
[48] | Montgomery W , Goren A , Kahle-Wrobleski K , Nakamura T , Ueda K ((2018) ) Alzheimer’s disease severity and its association with patient andcaregiver quality of life in Japan: Results of a community-basedsurvey. BMC Geriatr 18: , 141. |
[49] | Froelich L , Lladó A , Khandker RK , Pedrós M , Black CM , Sánchez Díaz EJ , Chekani F , Ambegaonkar B ((2021) ) Quality oflife and caregiver burden of Alzheimer’s disease among communitydwelling patients in Europe: Variation by disease severity andprogression. J Alzheimers Dis Rep 5: , 791–804. |
[50] | Liu H , Zhang Z , Choi SW , Langa KM ((2020) ) Marital status anddementia: Evidence from the Health and Retirement Study. JGerontol B Psychol Sci Soc Sci 75: , 1783–1795. |
[51] | Sundström A , Westerlund O , Kotyrlo E ((2016) ) Marital status andrisk of dementia: A nationwide population-based prospective study from Sweden. BMJ Open 6: , e008565. |
[52] | Liu H , Zhang Y , Burgard SA , Needham BL ((2019) ) Marital status andcognitive impairment in the United States: Evidence from theNational Health and Aging Trends Study. Ann Epidemiol 38: , 28–34.e22. |
[53] | Cermakova P , Nelson M , Secnik J , Garcia-Ptacek S , Johnell K , Fastbom J , Kilander L , Winblad B , Eriksdotter M , Religa D ((2017) ) Livingalone with Alzheimer’s disease: Data from SveDem, the Swedish Dementia Registry. J Alzheimers Dis 58: , 1265–1272. |
[54] | Garrison L , Baumgart M , El-Hayek Y , Holzapfel D , Leibman C (2021) Defining elements of value in Alzheimer’s disease. Value & Outcomes Spotlight, ISPOR, pp. S7–S11. |
[55] | Maresová P , Dolejs J , Mohelska H , Bryan LK ((2019) ) Cost oftreatment and care for people with Alzheimer’s disease: Ameta-analysis. Curr Alzheimer Res 16: , 1245–1253. |
[56] | Gillespie P , O’Shea E , Cullinan J , Buchanan J , Bobula J , Lacey L , Gallagher D , Mhaolain AN , Lawlor B ((2015) ) Longitudinal costs of caring for people with Alzheimer’s disease. Int Psychogeriatr 27: , 847–856. |
[57] | Olazarán J , Agüera-Ortiz L , Argimón JM , Reed C , Ciudad A , Andrade P , Dilla T ((2017) ) Costs and quality of life in community-dwelling patients with Alzheimer’s disease in Spain: Results from the GERAS II observational study. Int Psychogeriatr 29: , 2081–2093. |
[58] | Kosaner Kließ M , Martins R , Connolly MP ((2021) ) Major costdrivers in assessing the economic burden of Alzheimer’s disease: Astructured, rapid review. J Prev Alzheimers Dis 8: , 362–370. |
[59] | Morin P , Li M , Wang Y , Aguilar BJ , Berlowitz D , Tahami Monfared AA , Irizarry M , Zhang Q , Xia W ((2022) ) Clinical staging of Alzheimer’sdisease: Concordance of subjective and objective assessments in theVeteran’s Affairs Healthcare System. Neurol Ther 11: , 1341–1352. |
[60] | Hounsome N , Orrell M , Edwards RT ((2011) ) EQ-5D as a quality of lifemeasure in people with dementia and their carers: Evidence and keyissues. Value Health 14: , 390–399. |
[61] | Orgeta V , Edwards RT , Hounsome B , Orrell M , Woods B ((2015) ) The use of the EQ-5D as a measure of health-related quality of life in people with dementia and their carers. Qual Life Res 24: , 315–324. |
[62] | Landeiro F , Mughal S , Walsh K , Nye E , Morton J , Williams H , Ghinai I , Castro Y , Leal J , Roberts N , Wace H , Handels R , Lecomte P , Gustavsson A , Roncancio-Diaz E , Belger M , Jhuti GS , Bouvy JC , Potashman MH , Tockhorn-Heidenreich A , Gray AM ((2020) ) Health-relatedquality of life in people with predementia Alzheimer’s disease, mildcognitive impairment or dementia measured with preference-basedinstruments: A systematic literature review. Alzheimers ResTher 12: , 154. |


