
FTIR Spectroscopy and Blood-Derived Extracellular Vesicles Duo in Alzheimer’s Disease
Abstract
Background:
Alzheimer’s disease (AD) diagnosis is difficult, and new accurate tools based on peripheral biofluids are urgently needed. Extracellular vesicles (EVs) emerged as a valuable source of biomarker profiles for AD, since their cargo is disease-specific and these can be easily isolated from easily accessible biofluids, as blood. Fourier Transform Infrared (FTIR) spectroscopy can be employed to analyze EVs and obtain the spectroscopic profiles from different regions of the spectra, simultaneously characterizing carbohydrates, nucleic acids, proteins, and lipids.
Objective:
The aim of this study was to identify blood-derived EVs (bdEVs) spectroscopic signatures with AD discriminatory potential.
Methods:
Herein, FTIR spectra of bdEVs from two biofluids (serum and plasma) and distinct sets of Controls and AD cases were acquired, and EVs’ spectra analyzed.
Results:
Analysis of bdEVs second derivative peaks area revealed differences between Controls and AD cases in distinct spectra regions, assigned to carbohydrates and nucleic acids, amides, and lipids.
Conclusions:
EVs’ spectroscopic profiles presented AD discriminatory value, supporting the use of bdEVs combined with FTIR as a screening or complementary tool for AD diagnosis.
INTRODUCTION
Alzheimer’s disease (AD) is the most common form of dementia worldwide, expected to exponentially increase in the upcoming years [1, 2]. Despite efforts of the last decades, AD pathophysiology is not completely understood and no effective cure able to revert cognitive decline was identified thus far. Likewise, no general blood-based diagnostic tool has been approved for clinical use [3, 4]. Diagnosing AD is challenging since clinical symptoms arise decades after onset of neuropathological alterations and may overlap with other dementia types. Currently, the gold standard molecular AD diagnostic tool available is the cerebrospinal fluid (CSF)-based neurochemical diagnosis that monitors amyloid-β (Aβ), tau, and phospho-tau 181. However, CSF collection involves a lumbar puncture, an invasive outpatient procedure [5, 6]. Ideally, CSF results are combined with brain imaging techniques and cognitive tests to establish a more accurate AD diagnosis [7, 8]. Neuroimaging techniques are useful to assess brain structure or track amyloid deposition but imaging equipment is expensive, limiting its wide access [9]. Therefore, a test based on blood biomarkers, would be ideal to diagnose AD, representing a less invasive and more accessible tool. Several relevant biomarker candidates have been tested in blood, among them Aβ and tau species [10–14] but none have been introduced in routine clinical practice. This is mainly due to their low abundance, which require the use of expensive highly sensitive methodologies, and to some data discrepancies between studies.
Fourier Transform Infrared (FTIR) spectroscopy is a technique often employed in disease diagnosis, highly reproducible, easy to perform and possible to run with small sample volumes. The obtained infrared spectrum provides, simultaneously, metabolic information on carbohydrates, nucleic acids, proteins and lipids, being particularly useful for multifactorial diseases, among them cancer and neurodegenerative conditions [15–19]. The value of FTIR in AD diagnosis has been explored, by analyzing blood or CSF spectral signatures associated to proteins, lipids and nucleic acids, which exhibited good to high disease discriminatory potential [18, 20–25]. However, the use of extracellular vesicles (EVs) isolated from peripheral biofluids can be advantageous. In a previous study from our group, FTIR spectra of serum and serum-derived EVs with exosome-like characteristics, of non-demented Controls and AD cases from two cohorts, were obtained and analyzed in the spectroscopic region of 1200–900 cm–1. Results showed that EVs spectra presented a higher discriminatory potential for AD than serum per se. This spectroscopic region corresponds mainly to carbohydrates and nucleic acids absorbances [26], supporting the relevance of those biomolecules in AD diagnosis. Herein, these pilot data were confirmed in EVs obtained from a distinct biofluid (plasma) and different participants groups, and innovatively other FTIR spectra regions were likewise analyzed in the context of AD.
This study aims to compare and assess the diagnostic potential of FTIR and blood-derived EVs (bdEVs), isolated either from serum or plasma, as an AD discriminatory tool. Spectra of bdEVs from Controls and ADs were analyzed through both multivariate and direct spectral analysis. Three FTIR spectral regions were studied: 1200–900 cm–1, 1720–1490 cm–1, and 3050–2800 cm–1 in serum- and plasma-derived EVs of two independent sample groups, reinforcing the value of this approach for AD diagnosis.
MATERIALS AND METHODS
Study groups
Serum and plasma samples were obtained from the biobank at the Universität Medizin Göttingen and their use was approved by the ethics committee of this institution (9/2/16). Two distinct sets of individuals were studied, each one comprising non-demented Controls and individuals diagnosed with AD. The serum group comprised 12 Controls and 12 AD cases and the plasma group included 14 Controls and 14 AD cases. Demographics and clinical data of both groups is available in the Supplementary Table 1. AD diagnosis was established following the 2011 McKhann criteria, namely cognitive tests, supported by CSF-neurochemical diagnosis (total-tau, phospho-tau 181, and Aβ1 - 42/1 -40) and/or PET imaging [27, 28]. All procedures were run in accordance with the Declaration of Helsinki and all individuals give informed consent before collection of samples.
Blood collection, extracellular vesicles isolation, and characterization
Blood samples from Controls and AD cases were collected in gel-free or EDTA gel tubes, centrifuged at 2000 g, for 10 min, to obtain serum or plasma, respectively. Further, these samples were aliquoted and frozen at –80°C. Both serum and plasma samples were used for isolation of EVs with exosome like-characteristics, using a precipitation-based methodology and following the protocol previously described [26]. In brief, 125μL of serum or plasma was centrifuged, further, supernatant was mixed with ExoQuick Serum Exosome Precipitation Solution (System Biosciences), incubated at 4°C during 30 min, and centrifuged to obtain EV pellets. These were resuspended in PBS, for EVs characterization by transmission electron microscopy (TEM) and nanoparticle tracking analysis (NTA), or lysed in RIPA buffer (Sigma-Aldrich) with protease inhibitors for FTIR spectroscopy analysis and western blot. EVs suspensions were aliquoted and frozen prior to analyses. TEM and NTA analysis also followed procedures previously described by the group [26, 29]. TEM images were obtained using a STEM Hitachi HD 2700 microscope at 100 kV. NTA analyses of all samples were performed using the NanoSight NS300 (Malvern Instruments) and video analysis was performed with NTA software version 3.2. Particle concentrations obtained were multiplied by the dilution factor, prior to statistical analysis.
Protein concentrations of plasma-derived EVs samples lysed in RIPA were determined by BCA protein assay and 50μg of total protein was loaded for each sample in a 5–20% SDS-PAGE, followed by protein transfer to nitrocellulose membranes. Membranes were blocked with 5% non-fat dry milk and incubated with anti-CD63 (1 : 500) (sc-5275; Santa Cruz Biotechnology), anti-RAB11 (1 : 500) (610657; BD Transduction Laboratories) and anti-Calnexin (1 : 200) (ADI-SPA-860-J; Enzo). Further, membranes were incubated with anti-mouse IgG, HRP-linked antibody (1 : 2000) (7076 S; Cell Signaling Technology) or anti-rabbit IgG, HRP-linked antibody (7074 S; Cell Signaling Technology). Protein bands were detected using the chemiluminescence reagent ECL Select (GE Healthcare Life Sciences™) and images were captured with the ChemiDoc™ gel imaging system (Bio-Rad).
FTIR spectra acquisition and pre-processing
FTIR spectra of bdEVs were acquired in mid-infrared range (4000–600 cm–1), using Alpha Platinum ATR FTIR spectrometer and OPUS 7 software (Bruker Corporation), as previously described [26]. The resolution used was 8 cm–1 with 64 co-added scans. Five microliters of EVs were placed on diamond crystal, air dried for 20 min and spectra acquisition was performed at 23°C and 35% humidity, as described in [22]. Three replicates from each EV sample were acquired and background measurements were performed with empty crystal between samples FTIR spectra acquisition.
Unscrambler X v10.4 (CAMO) software was used to pre-process and analyze spectra. Spectra were divided in 3050–2800 cm–1, 1720–1490 cm–1 and 1200–900 cm–1 regions and, further, baseline corrected, and area normalized. Second derivative was calculated for these regions using Savitzky-Golay algorithm with 3 smoothing points. The use of second derivative is crucial for resolving peaks in complex blood or EVs samples.
Peak area analysis
Second derivatives of EVs spectra were factored by –1 [30, 31] and peak area calculated, using peak analyzer tool of Origin 2017 software (OriginLab Corporation). A schematic representation of the procedures employed is presented in Fig. 1.
Fig. 1
Workflow for FTIR analysis of serum- and plasma-derived EVs. EVs were isolated from serum or plasma of two distinct sets of individuals (Controls and AD cases). Blood-derived EVs were characterized by transmission electron microscopy (TEM), nanoparticle tracking analysis (NTA) and western blot (WB) analysis. FTIR spectra was acquired from serum- and plasma-derived EVs and pre-processed in the 1200–900 cm–1, 1720–1490 cm–1 and 3050–2800 cm–1 regions. A univariate analysis consisting in the calculation of the second derivative peak area was carried out. Serum-derived EVs characterization and univariate analysis results for the 1200–900 cm–1 spectral region, mainly assigned to carbohydrates and nucleic acids have been previously published by us [26]. AD, Alzheimer’s disease; C, controls; EVs, extracellular vesicles; FTIR, Fourier Transform Infrared; NTA, nanoparticle tracking analysis; TEM, transmission electron microscopy; WB, western blot.
![Workflow for FTIR analysis of serum- and plasma-derived EVs. EVs were isolated from serum or plasma of two distinct sets of individuals (Controls and AD cases). Blood-derived EVs were characterized by transmission electron microscopy (TEM), nanoparticle tracking analysis (NTA) and western blot (WB) analysis. FTIR spectra was acquired from serum- and plasma-derived EVs and pre-processed in the 1200–900 cm–1, 1720–1490 cm–1 and 3050–2800 cm–1 regions. A univariate analysis consisting in the calculation of the second derivative peak area was carried out. Serum-derived EVs characterization and univariate analysis results for the 1200–900 cm–1 spectral region, mainly assigned to carbohydrates and nucleic acids have been previously published by us [26]. AD, Alzheimer’s disease; C, controls; EVs, extracellular vesicles; FTIR, Fourier Transform Infrared; NTA, nanoparticle tracking analysis; TEM, transmission electron microscopy; WB, western blot.](https://content.iospress.com:443/media/jad/2024/98-3/jad-98-4-jad231239/jad-98-jad231239-g001.jpg)
Statistical analysis
Statistical analysis was performed using GraphPad 9 software. Shapiro-Wilk was used to evaluate data distribution. EVs particles size or concentrations were compared using the unpaired t-test. Non-parametric Mann-Whitney test was applied to compare peak area between Controls and AD cases. All spectra replicates (3 technical replicates for each EVs samples) were considered for the statistical analysis of peaks area and represented on graphs. Only p-values≤0.05 were considered significant.
RESULTS
Blood-derived EVs characterization
Serum and plasma-derived EVs were isolated from Controls and AD cases and the nature of these EVs preparations, with exosome-like characteristics, was evaluated by TEM, NTA and Western blot (Supplementary Figure 1 and previous work [26]). TEM analysis revealed the presence of small EVs with round-shape. Both TEM and NTA detected the presence of nanovesicles with a diameter mode of around 110 nm, as expected. No significant differences were found between the particle concentration or diameter mode between Controls and AD. To further assess the nature of the nanovesicles, western blot analysis was performed using pools of EVs samples isolated from Controls or AD cases. EV markers CD63 and RAB11 were detected in the nanovesicles isolated while the negative exosome marker calnexin was not detected.
Comparative analysis of serum- and plasma-derived EVs spectra
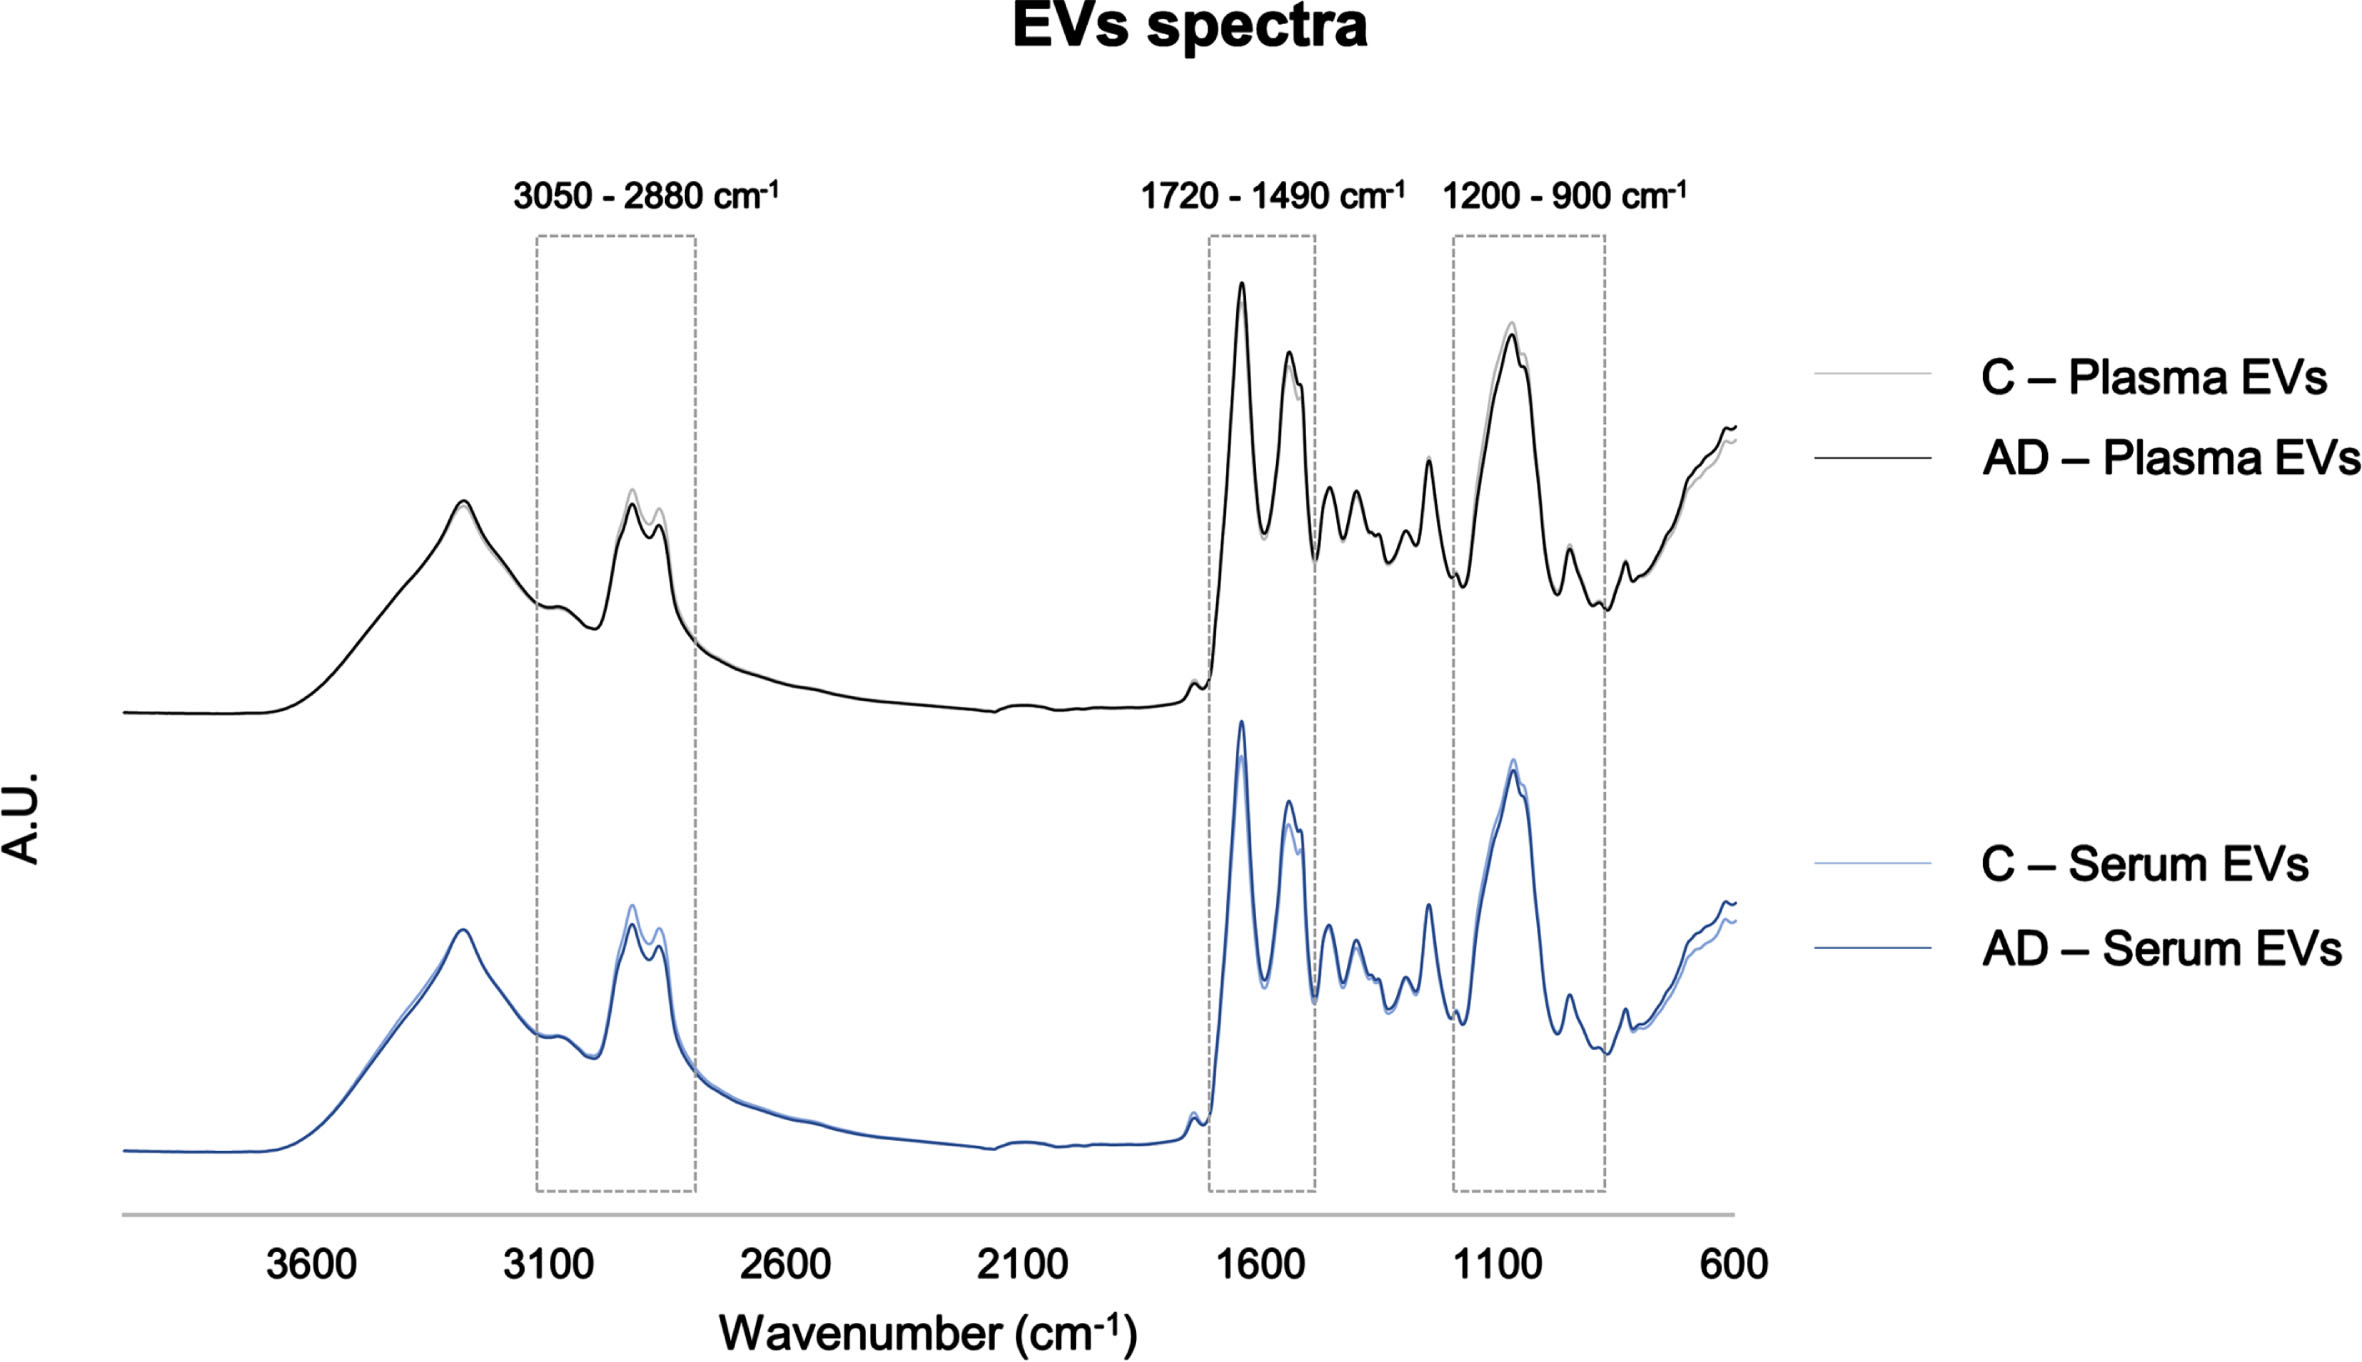
FTIR spectra of serum- and plasma-derived EVs were compared and their potential for AD discrimination from Control individuals evaluated. The FTIR spectroscopic regions analyzed were 1200–900 cm–1, mainly assigned to carbohydrates and nucleic acids [16, 22, 26, 32–34], 1720–1490 cm–1 associated to the content and conformation in proteins [16, 22, 32, 35], and 3000–2800 cm–1, 1770–1720 cm–1 and 1490–1430 cm–1 mainly assigned to lipids [16, 22, 32–35]. In general, spectra profile of serum- and plasma-derived EVs were similar, sharing the same peaks (Fig. 2). However, when comparing absorbances between spectra of Controls and AD cases some distinct patterns could be found at distinct spectra regions (1200–900 cm–1, 1720–1490 cm–1, 3050–2800 cm–1) and these were here further analyzed.
Fig. 2
Serum- and plasma-derived EVs FTIR spectra. Average pre-processed spectra of the 4000–600 cm–1 region. Boxes highlight the regions analyzed: 3050–2800 cm–1, 1720–1490 cm–1, 1200–900 cm–1. AD, Alzheimer’s disease; A.U., arbitrary units; C, controls; EVs, extracellular vesicles.
Analysis of peak area in 1200–900 cm–1 spectroscopic region
The spectroscopic 1200–900 cm–1 region is mainly assigned to carbohydrates and nucleic acids. Our group had previously reported differences in this region for serum and serum-derived EVs [26]. In the present study, the diagnostic potential of EVs and FTIR duo were evaluated by univariate analysis, including another biofluid, the plasma, and a new set of samples from distinct individuals. Second derivative of plasma-derived EVs spectra was obtained and the area of 4 peaks was calculated, 3 of which identified in the previous study [26], and an additional peak herein identified: 1011 cm–1 (ν(C–O) in osidic and protein structures; νs of dianionic phosphate monoester (nucleic acids, DNA)) [22], 1039 cm–1 (ν(C–O) in ribose in RNA) [33], 1064 cm–1 (symmetric stretching vibration (νs) (C–O–C) of ester (phospholipids); ν(C–O) in ribose (nucleic acids)) [22] and 1146 cm–1 (Glycogen; stretching vibration (ν)(C–O) and ν(C–C); C–O–H deformation (carbohydrates)) [33]. Among these, 3 peaks area (1039 cm–1, 1064 cm–1 and 1146 cm–1) were significantly decreased in plasma-derived EVs spectra of AD cases (Supplementary Figure 2B–E). Of note, decreases in the areas of peaks 1039 cm–1 and 1064 cm–1 were consistent with previous data obtained for serum-derived EVs from AD cases [26]. The 1146 cm–1 peak area was not addressed in our previous study, but since clear differences could now be observed in the second derivative spectra of plasma-derived EVs, this peak area was likewise analyzed in serum-derived EVs. A significant decrease in this peak area was also found for AD cases when compared to serum-derived EVs of Controls (Supplementary Figure 3). Due to the potential value of this FTIR region and bdEVs duo in AD, the discriminatory value of other spectroscopic regions was further studied.
Analysis of peak area in 1720–1490 cm–1 spectroscopic region
FTIR spectra of EVs isolated from both biofluids (serum and plasma) was also analyzed in the region of 1720–1490 cm–1, which is characterized by the prominent amide I and II bands. Major differences could be observed in 1636 cm–1, assigned to ν(C = O) of parallel β-sheet, ν(C–N) and (N–H) bending vibration [22, 34–38], and in the 1628 cm–1 peak, assigned to ν(C = O) band of parallel β-sheet or non-native intermolecular β-sheets, suggesting the presence of protein aggregation [22, 35, 36]. These two peaks were consistently increased in serum- and plasma-derived EVs of AD cases (Fig. 3A). Peak 1682 cm–1 can be assigned to β-turn [34] and peak 1693 cm–1 is assigned to antiparallel β-sheet [34].
Fig. 3
Analysis of second derivative peak area in 1720–1490 cm–1 region of serum- and plasma-derived EVs spectra. Mean second derivative of serum-derived EVs of Controls and AD cases (n = 12 samples per group, 3 replicates were analyzed for each sample) or plasma-derived EVs spectra of Controls and AD cases (n = 14 samples per group, 3 replicates were analyzed for each sample) (A) in 1720–1490 cm–1 region and peak area analysis of FTIR spectra for serum- and plasma-derived EVs (B–E). **p≤0.01; ***p≤0.001; ****p≤0.0001. AD, Alzheimer’s disease; A.U., arbitrary units; C, controls; EVs, extracellular vesicles.
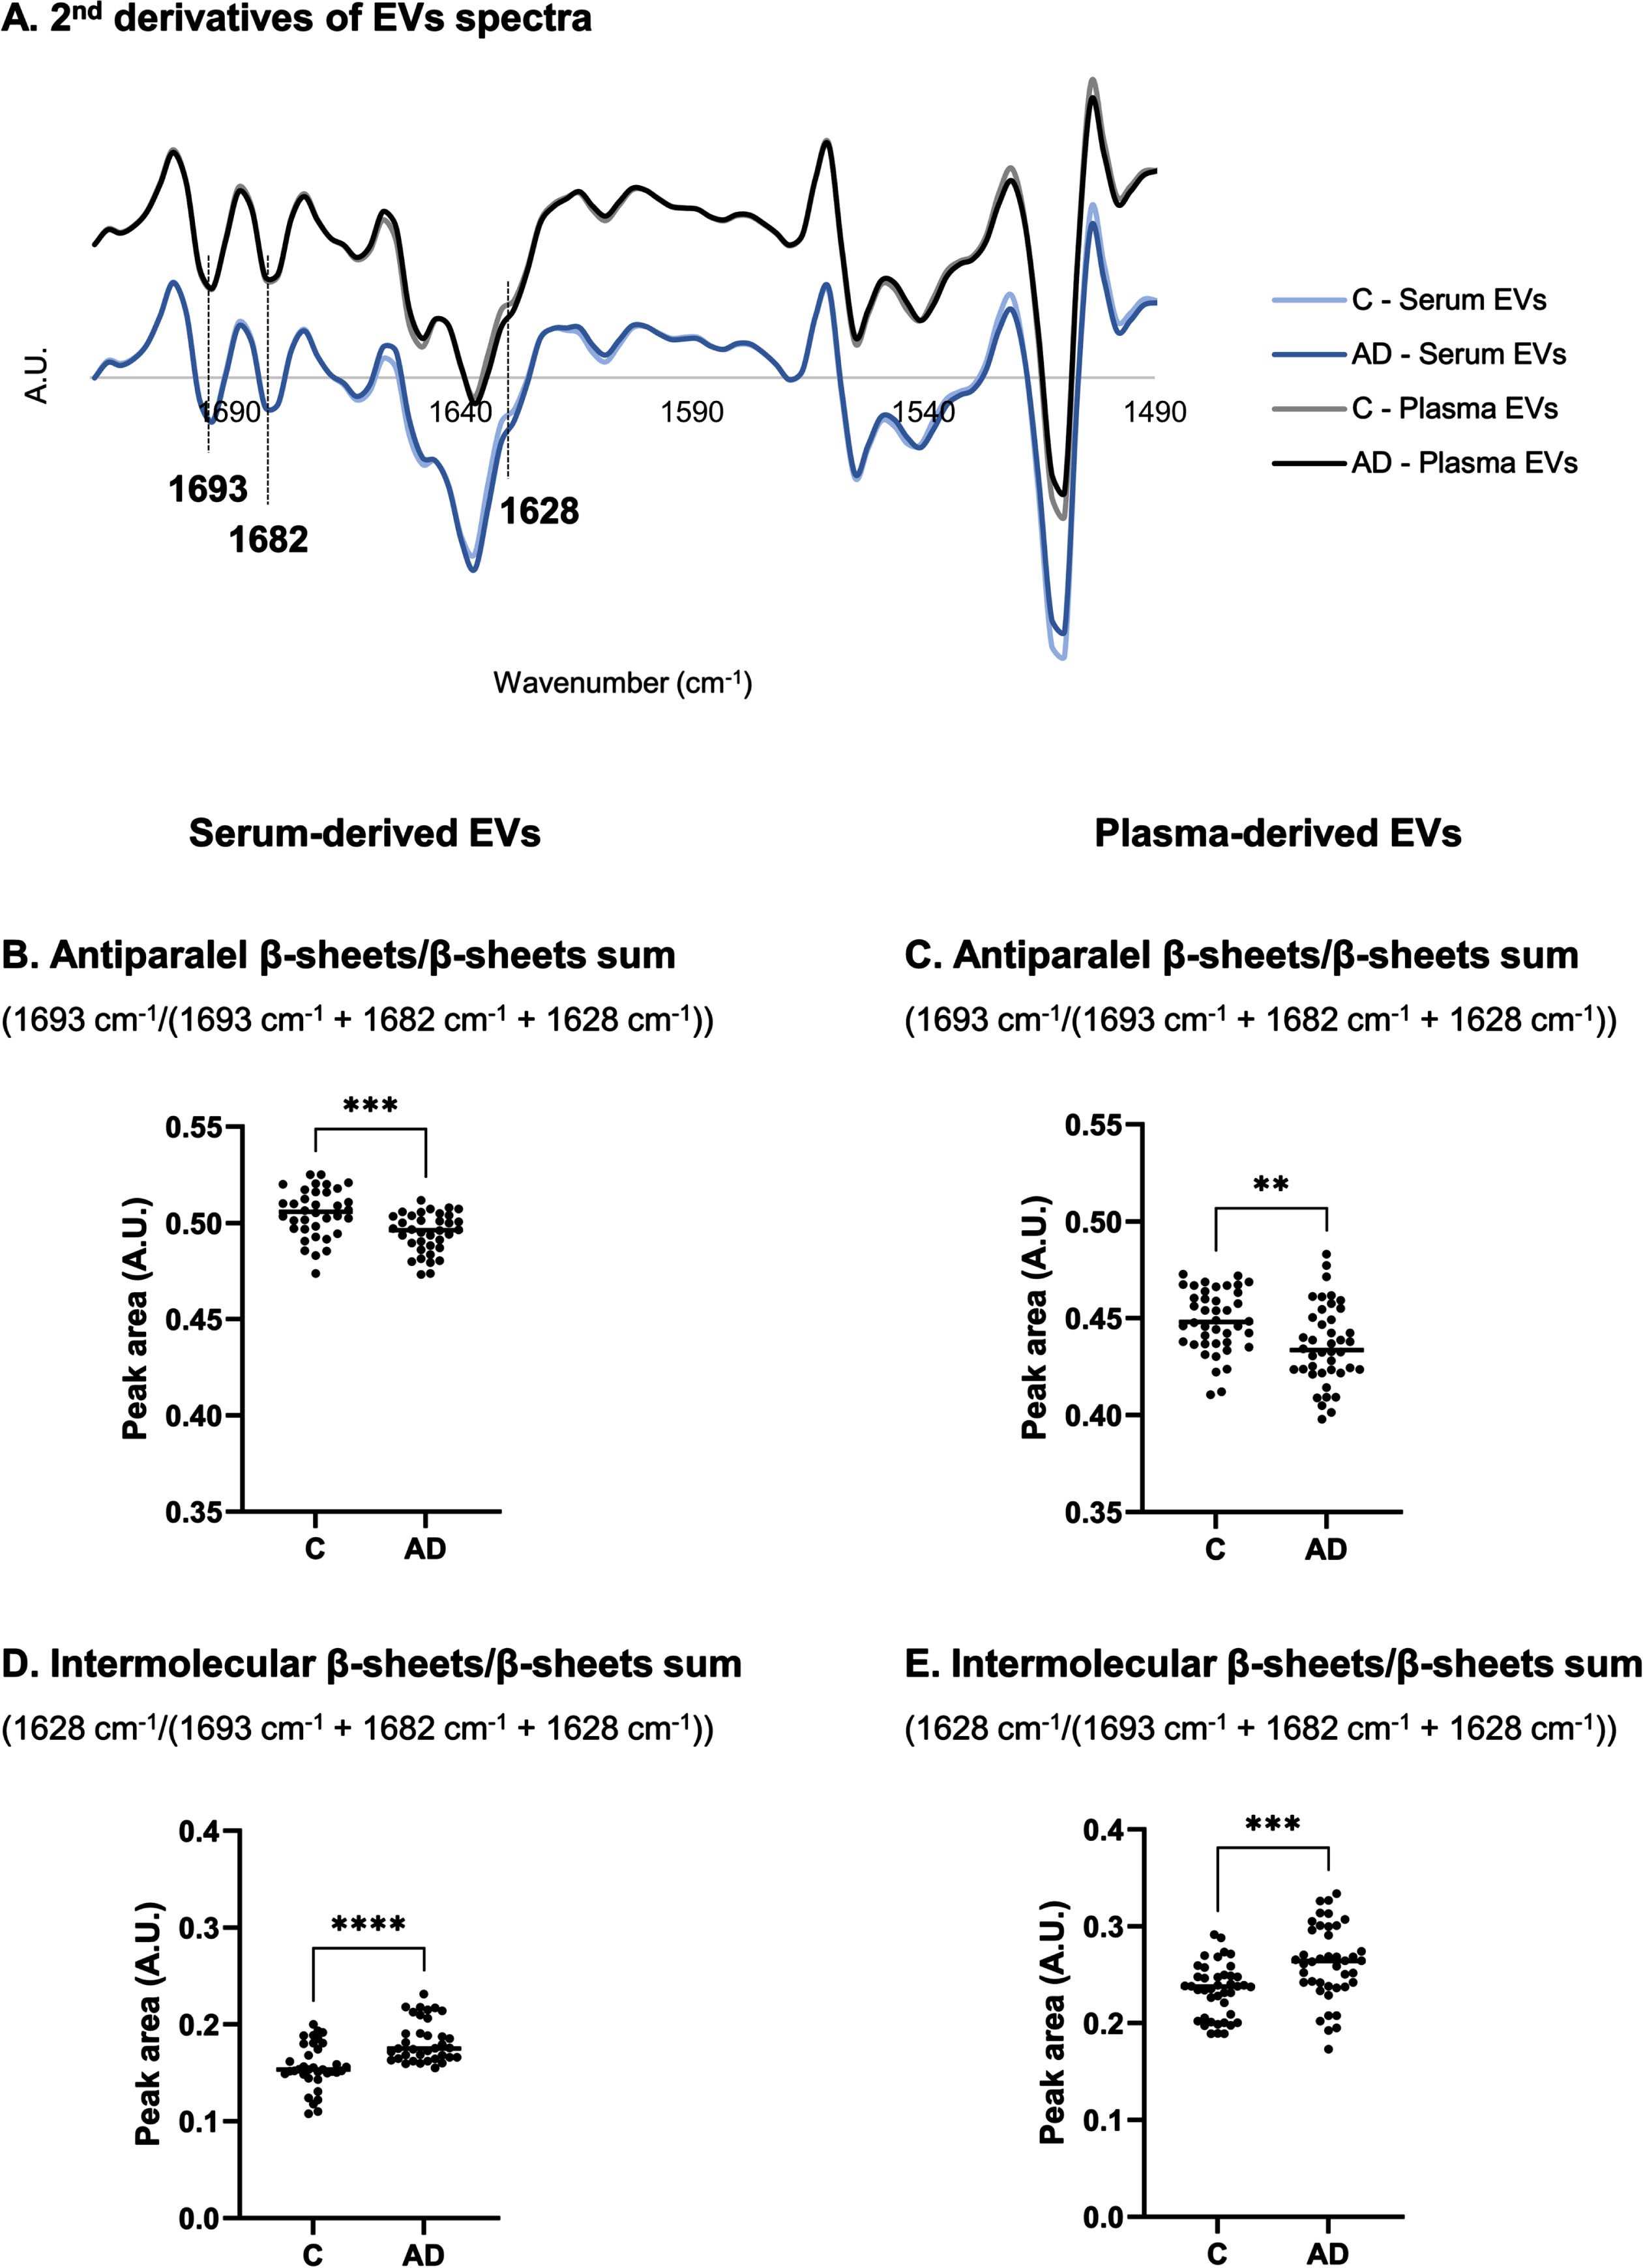
Peaks area of second-derivative spectra were calculated to further analyze alterations in proteins secondary structure. Antiparallel β-sheets by β-sheets sum ratio (1693 cm–1/(1693 cm–1 + 1682 cm–1 + 1628 cm–1)) (Fig. 3B, C) and intermolecular β-sheets by β-sheets sum ratio (1628 cm–1/(1693 cm–1 + 1682 cm–1 + 1628 cm–1)) (Fig. 3D, E) were calculated [39–44], and opposite patterns were identified. While antiparallel β-sheets by β-sheets sum ratio decreased, the intermolecular β-sheets by β-sheets sum ratio increased, for both serum- and plasma-derived EVs of AD cases when compared to Controls.
Analysis of peak area in 3050–2800 cm–1 spectroscopic regions
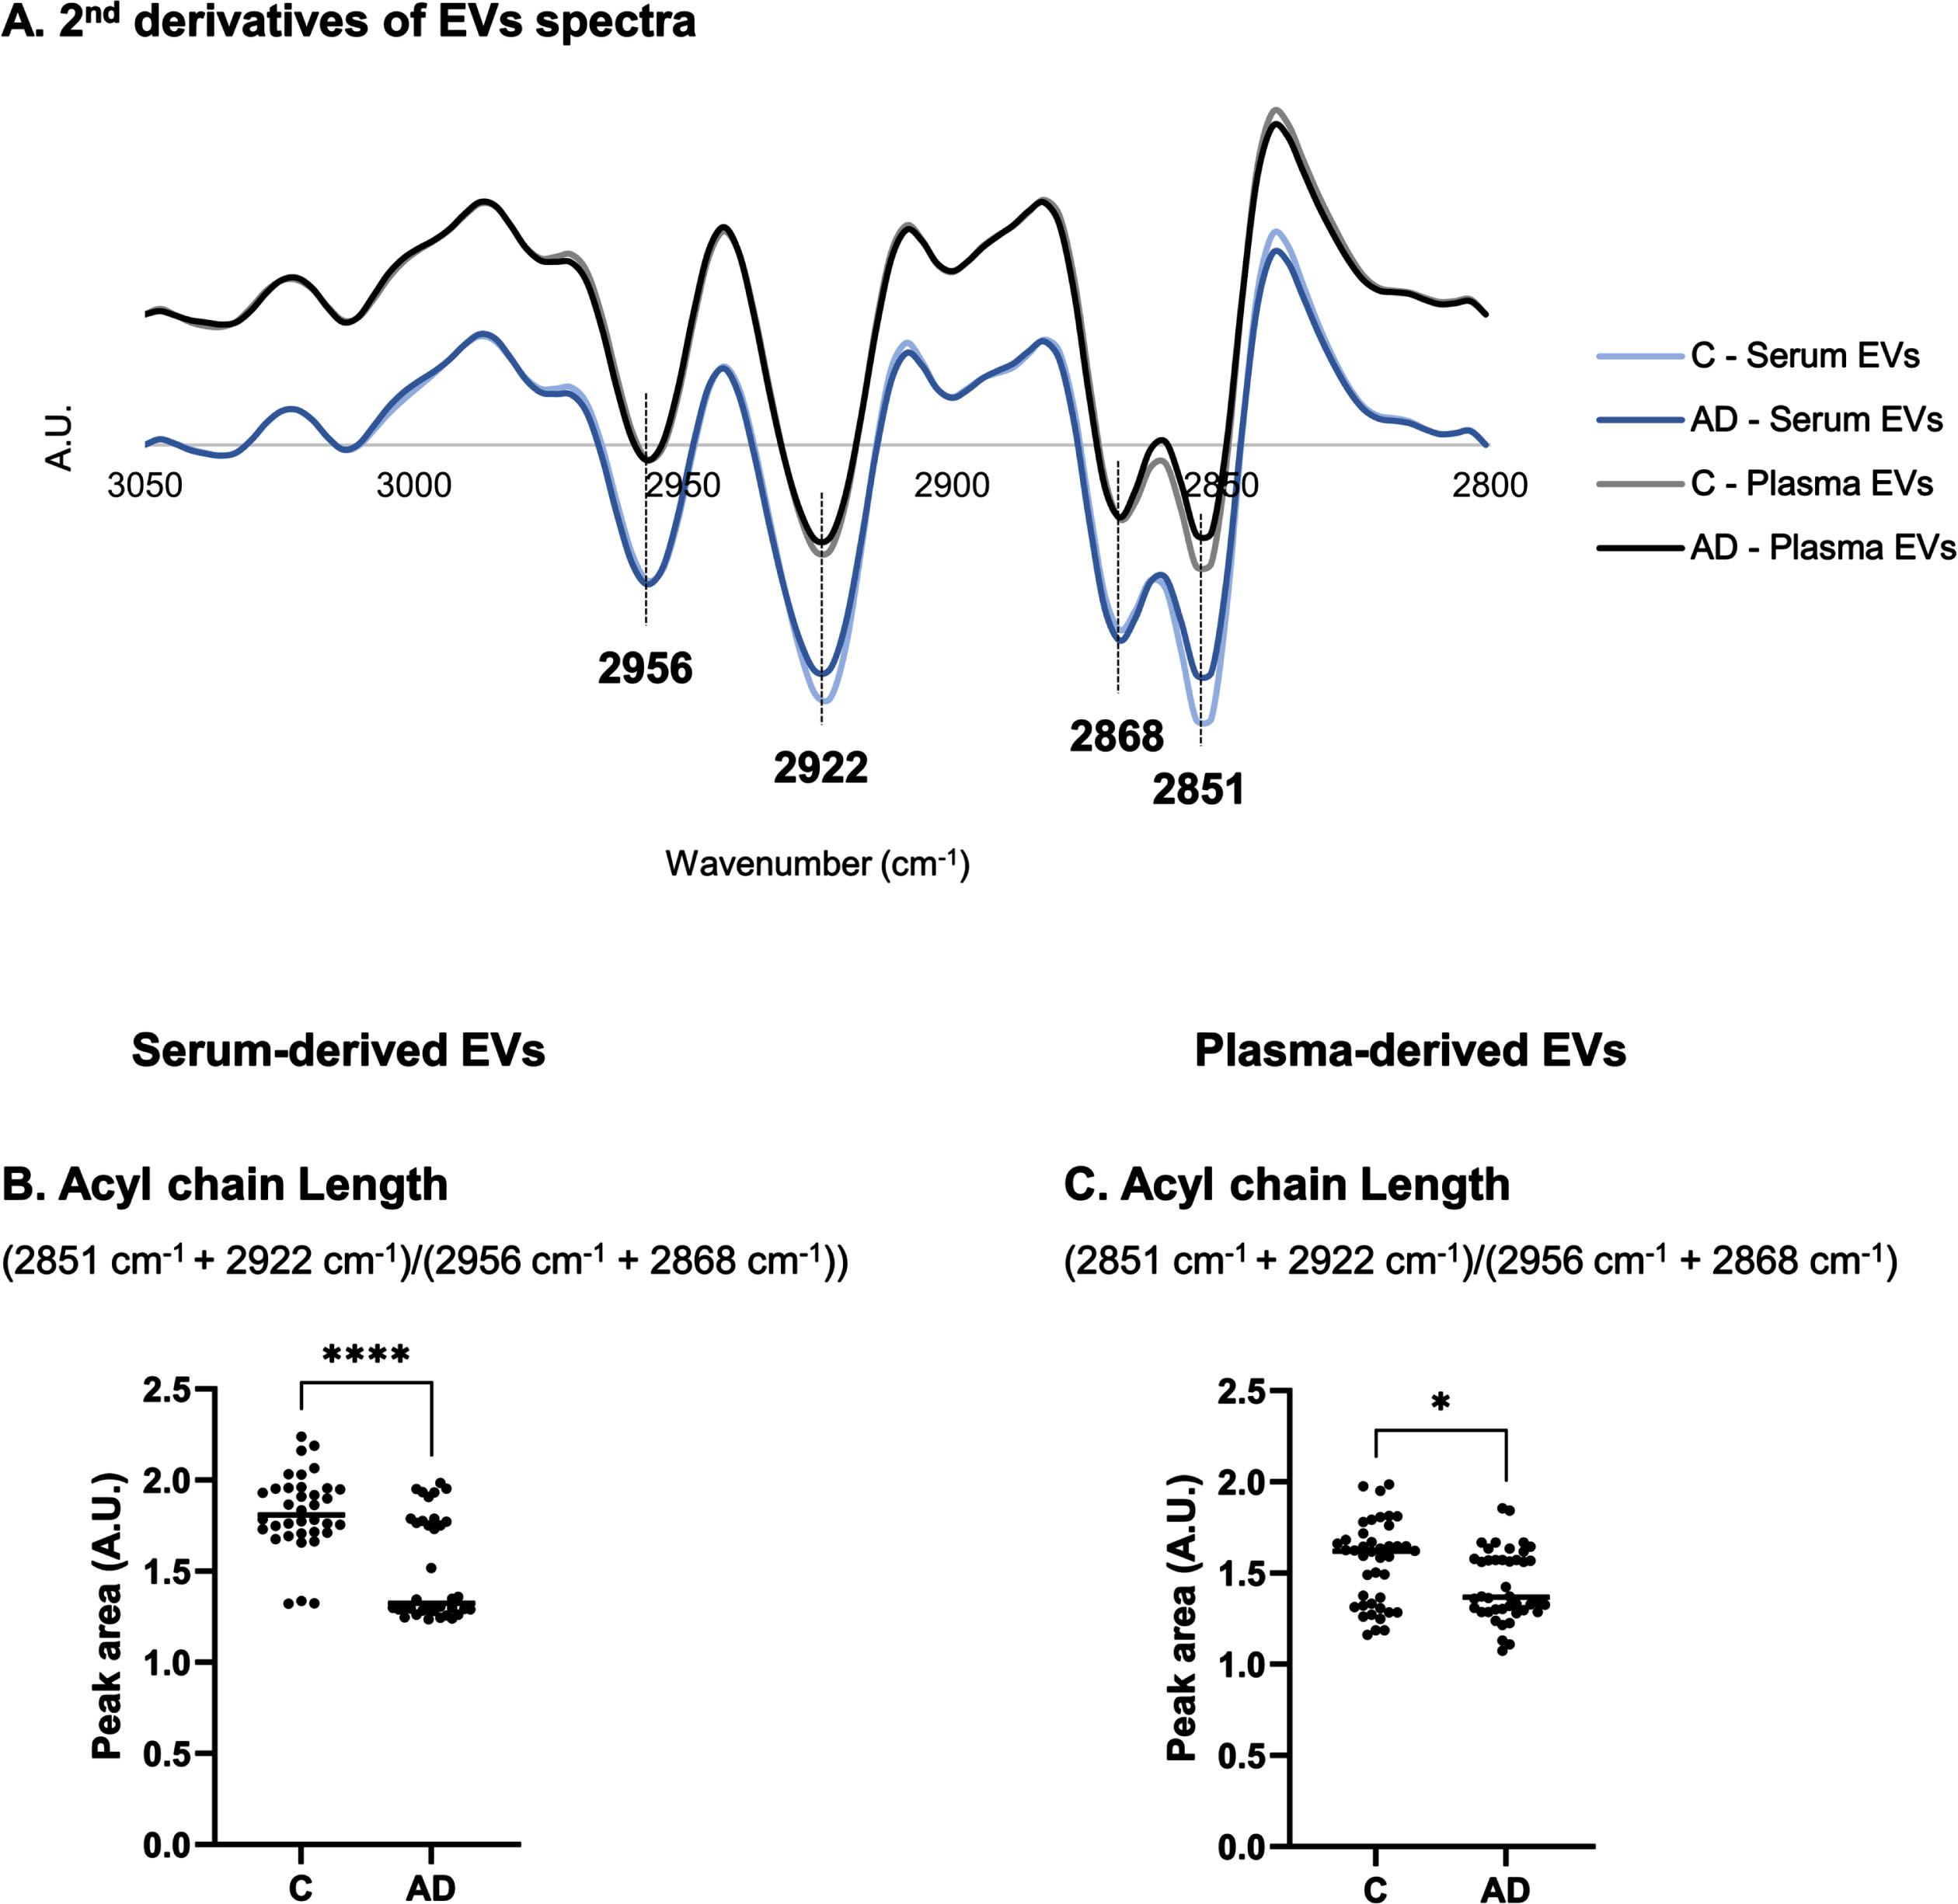
The FTIR spectral region between 3050–2800 cm–1 reflect changes in lipid content. This region was also addressed in serum- and plasma-derived EVs and differences could be observed in second derivative spectra profiles between Controls and AD cases (Fig. 4A). This was particularly noticed in 2851 cm–1 and 2922 cm–1 peaks assigned to νs(C–H) or asymmetric stretching (νas)(C–H) of methylene (CH2), respectively [22]. Peak area at 2868 cm–1 and 2956 cm–1 are associated to νs(C–H) or νas(C–H) of methyl (CH3), respectively [22]. A ratio including these peak area ((2851 cm–1 + 2922 cm–1)/(2956 cm–1 + 2868 cm–1)) can be informative of acyl chain length [31] and, thus, it was also calculated (Fig. 4B, C). A decrease in acyl chain length was found for both serum- and plasma-derived EVs spectra of AD cases.
Fig. 4
Analysis of second derivative peak area in 3050–2800 cm–1 region of serum- or plasma-derived EVs spectra. Mean second derivative of serum- or plasma-derived EVs spectra of Controls and AD cases (A) in 3050–2800 cm–1 and peak area analysis of FTIR spectra for serum- and plasma-derived EVs (C-D). Three replicates were analyzed for each sample. *p≤0.05; ****p≤0.0001. AD, Alzheimer’s disease; A.U., arbitrary units; C, controls; EVs, extracellular vesicles.
DISCUSSION
The combination of FTIR spectroscopy and bdEVs can be a powerful approach to assist AD diagnosis since it combines the use of an easy, and highly reproducible strategy to monitor EVs’ specific spectra signatures, related to the disease. Additionally, EVs can be isolated from blood following simple and fast protocols [45], an advantage for future implementation in clinical practice. Highly relevant, our group showed that FTIR spectra of serum-derived EVs discriminated Controls from AD cases in the 1200–900 cm–1 region (mainly assigned to carbohydrates and nucleic acids spectroscopic signals), better than serum per se [26], thus supporting the clinical value of the combined use of EVs and FTIR in disease diagnosis. This prompted us to analyze the same region using a distinct biofluid, the plasma-derived EVs, and employing univariate approaches, in a new set of Controls and AD cases. Both serum- and plasma-derived EVs spectra discriminated Controls from ADs cases, in different spectra regions. In 1200–900 cm–1 region, mainly assigned to carbohydrates and nucleic acids, second derivative peak area of distinct peaks 1146 cm–1, 1064 cm–1, 1039 cm–1 and 1011 cm–1 were significantly decreased in EVs spectra of AD cases, being that the three former peak area differences were common to both biofluids. Data obtained showed that both plasma- and serum- derived EVs spectra performed similar in discriminating Controls from AD cases. Furthermore, FTIR analysis was run in a distinct study group, reinforcing the discriminatory value of this FTIR region and bdEVs duo in AD.
The 1146 cm–1 peak is mainly assigned to the content in carbohydrates and, here it was decreased in either serum- or plasma-derived EVs from AD cases. This observation can relate with metabolic modifications resulting, e.g., from alterations in glucose metabolism which are commonly observed in AD, as brain hypometabolism. Glucose and glycogen are the main source of energy in the brain and it has been hypothesized that these are decreased in AD brains [46, 47]. Moreover, in EVs, carbohydrates (in the form of glycans) were found conjugated with proteins or lipids, at EVs surface and these may promote a role in these vesicles recognition by recipient cells [48]. Of note, it was also shown that glycans at glycosphingolipids from EVs surface are required to Aβ binding to EVs [49] and others shown that glycans composition at surface of platelet-enriched serum-derived EVs from AD patients differed from Controls [50].
Additionally, the peaks 1064 cm–1 and 1039 cm–1, mostly assigned to nucleic acids cargo, were found decreased in both serum- and plasma-derived EVs from AD cases, while peak 1011 cm–1 was found decreased only in EVs isolated from serum [26]. These changes may result from nucleic acids degradation by oxidative stress linked to the disease [51, 52], being consistent with the reported changes in this FTIR spectra region.
These promising alterations lead us to further explore other regions of FTIR spectra. The Amide I region was thus further analyzed in serum- and plasma-derived EVs spectra from Controls and AD cases. For AD cases, while an increase in intermolecular β-sheets was found, a decrease in antiparallel β-sheets was evident; supporting an increase in protein aggregation towards a decrease in oligomeric structures [53]. In agreement with our FTIR spectra observations for bdEVs, altered patterns in the Amide I region were also reported for human blood, blood peripheral mononuclear leukocytes or CSF, particularly an increase in peaks intensity assigned to β-sheets in AD cases [18, 23–25, 54]. The EVs’ role in AD is still not fully understood but it is certain that EVs transport several AD pathogenic proteins such as Aβ and tau species, in oligomer or aggregated forms [55–58], composed of stable β-sheets [59]. Data here presented support that EVs can be involved in protein aggregated forms spreading. Nonetheless, it would be relevant to determine the EVs proteome aggregates to improve the understanding of disease pathogenesis.
Distinct FTIR spectra profiles were also obtained for lipids characteristic peaks, namely CH2 and CH3 bonds. Beyond being components of cell and EVs membranes, lipids are involved in cell homeostasis and represent almost 50% of dried brain weight. Lipid metabolism dysfunction has also been reported in AD brains [60–62]. In particular, brain tissue-derived EVs of AD cases had lower levels of glycerophospholipids but higher levels of sphingolipids [61]. Since EVs can cross the blood-brain barrier, reported alterations in brain-derived EVs and brain tissue lipid composition may be reflected in bdEVs content, as observed here by distinct peak profiles. A decrease in peaks assigned to the methylene or methyl, symmetric or asymmetric stretching vibrations of fatty acids (3050–2800 cm–1 region) was observed for ADs spectra. This is in accordance with previous spectroscopy studies that reported lipid decreased intensity of plasma or CSF spectra peaks [18, 23]. Of note, diminished amounts of total membrane lipids (e.g. phospholipids and sphingomyelin) were found in brain, perhaps due to synapse loss and neurodegeneration, and also in CSF [63–67]. The decrease in acyl chain length associated with FTIR spectra of AD cases may reflect a breakdown of lipid acyl chains, resulting in the production of shorter chain lipid products [68]. The observed acyl chain length differences between Controls and AD cases seem sharper for serum-derived EVs than for plasma-derived EVs. This may be explained by the differences in the collection and processing of serum or plasma biofluids which can render in matrices with distinct metabolic profiles. To our knowledge, bdEVs lipidome is still not characterized in AD context but it is certainly a matter that deserves further investigation.
In summary, FTIR spectra profile of both serum- or plasma-derived EVs presented discriminatory potential between Controls and AD cases. These data also support the results previously obtained for the 1200–900 cm–1 spectra region, mainly assigned to carbohydrates and nucleic acids, for peaks 1039 cm–1 and 1064 cm–1, in serum-derived EVs and in plasma-derived EVs from a different set of patients. Unique profiles associated with AD pathogenesis for the Amide I and lipid region could also be found, reflecting disease alterations at these levels. Future experiments should enroll a higher number of individuals, including bdEVs from mild cognitive impairment cases and other types of dementia, as frontotemporal dementia, to address the differential diagnostic value of this combined EVs and FTIR approach. Nonetheless, FTIR spectroscopy analysis of bdEVs proved to be useful in discriminating AD from non-demented individuals, supporting its potential as a first screening or complementary tool for AD clinical diagnosis.
AUTHOR CONTRIBUTIONS
Tânia Soares Martins (Methodology; Writing - original draft). Maria Ferreira (Methodology; Writing – review & editing); Sandra Magalhães (Methodology; Writing – review & editing); Kevin Leandro (Methodology; Writing – review & editing); Luís P. de Almeida (Methodology; Writing – review & editing); Jonathan Vogelgsang (Resources); Benedict Breitling (Resources); Niels Hansen (Resources); Hermann Esselmann (Resources); Jens Wiltfang (Resources); Odete da Cruz e Silva (Writing – review & editing); Alexandra Nunes (Methodology; Writing – review & editing); Ana Gabriela Henriques (Conceptualization; Funding acquisition; Supervision; Writing – review & editing).
ACKNOWLEDGMENTS
We thank the volunteers and their families as well as all the health professionals involved in this study.
FUNDING
This work was funded by the Alzheimer’s Association under Grant 2019-AARG-644347 and supported by Instituto de Biomedicina (iBiMED) under Grant UIDB/04501/2020, UIDP/04501/2020, the ADPro – CENTRO-01-0145-FEDER-181255 Portugal 2020; the Fundação para a Ciência e Tecnologia (FCT) of the Ministério da Educação e Ciência, COMPETE program; the QREN and the European Union (Fundo Europeu de Desenvolvimento Regional). JV was funded by the Deutsche Forschungsgemeinschaft (DFG, German Research Foundation) under grant 413501650; TSM is supported by FCT under the individual PhD grant SFRH/BD/145979/2019. JW is supported by an Ilídio Pinho professorship at University of Aveiro.
CONFLICT OF INTEREST
The authors have no conflict of interest to report.
Odete da Cruz e Silva is an Editorial Board Member of this journal but was not involved in the peer-review process of this article nor had access to any information regarding its peer-review.
DATA AVAILABILITY
The data supporting the findings of this study are available within the article and/or its supplementary material.
SUPPLEMENTARY MATERIAL
[1] The supplementary material is available in the electronic version of this article: https://dx.doi.org/10.3233/JAD-231239.
REFERENCES
[1] | Nichols E , Steinmetz JD , Vollset SE , Fukutaki K , Chalek J , Abd-Allah F , Abdoli A , Abualhasan A , Abu-Gharbieh E , Akram TT , et al. ((2022) ) Estimation of the global prevalence of dementia in 2019 and forecasted prevalence in 2050: An analysis for the Global Burden of Disease Study 2019. Lancet Public Health 7: , e105–e125. |
[2] | Alzheimer’s Association ((2022) ) 2022 Alzheimer’s disease facts and figures. Alzheimers Dement 18: , 700–789. |
[3] | Hampel H , O’Bryant SE , Molinuevo JL , Zetterberg H , Masters CL , Lista S , Kiddle SJ , Batrla R , Blennow K ((2018) ) Blood-based biomarkers for Alzheimer disease: Mapping the road to the clinic. Nat Rev Neurol 14: , 639–652. |
[4] | Haass C , Selkoe D ((2022) ) If amyloid drives Alzheimer disease, why have anti-amyloid therapies not yet slowed cognitive decline? PLoS Biol 20: , e3001694. |
[5] | Blennow K , Zetterberg H ((2009) ) Cerebrospinal fluid biomarkers for Alzheimer’s disease. J Alzheimers Dis 18: , 413–417. |
[6] | Welge V , Fiege O , Lewczuk P , Mollenhauer B , Esselmann H , Klafki H-W , Wolf S , Trenkwalder C , Otto M , Kornhuber J , Wiltfang J , Bibl M ((2009) ) Combined CSF tau, p-tau181 and amyloid-β 38/40/42 for diagnosing Alzheimer’s disease. J Neural Transm 116: , 203–212. |
[7] | Rosa IM , Henriques AG , Wiltfang J , da Cruz E Silva OAB ((2018) ) Putative dementia cases fluctuate as a function of Mini-Mental State Examination cut-off points. J Alzheimers Dis 61: , 157–167. |
[8] | Zhang XY , Yang ZL , Lu GM , Yang GF , Zhang LJ ((2017) ) PET/MR imaging: New frontier in Alzheimer’s disease and other dementias. Front Mol Neurosci 10: , 343. |
[9] | Kim J , Jeong M , Stiles WR , Choi HS ((2022) ) Neuroimaging modalities in Alzheimer’s disease: Diagnosis and clinical features. Int J Mol Sci 23: , 6079. |
[10] | Li Y , Schindler SE , Bollinger JG , Ovod V , Mawuenyega KG , Weiner MW , Shaw LM , Masters CL , Fowler CJ , Trojanowski JQ , Korecka M , Martins RN , Janelidze S , Hansson O , Bateman RJ ((2022) ) Validation of plasma amyloid-β 42/40 for detecting Alzheimer disease amyloid plaques. Neurology 98: , e688–e699. |
[11] | Mielke MM , Dage JL , Frank RD , Algeciras-Schimnich A , Knopman DS , Lowe VJ , Bu G , Vemuri P , Graff-Radford J , Jack CR , Petersen RC ((2022) ) Performance of plasma phosphorylated tau 181 and 217 in the community. Nat Med 28: , 1398–1405. |
[12] | Nakamura A , Kaneko N , Villemagne VL , Kato T , Doecke J , Doré V , Fowler C , Li Q-X , Martins R , Rowe C , Tomita T , Matsuzaki K , Ishii K , Ishii K , Arahata Y , Iwamoto S , Ito K , Tanaka K , Masters CL , Yanagisawa K ((2018) ) High performance plasma amyloid-β biomarkers for Alzheimer’s disease. Nature 554: , 249–254. |
[13] | Klafki HW , Vogelgsang J , Manuilova E , Bauer C , Jethwa A , Esselmann H , Jahn-Brodmann A , Osterloh D , Lachmann I , Breitling B , Rauter C , Hansen N , Bouter C , Palme S , Schuchhardt J , Wiltfang J ((2022) ) Diagnostic performance of automated plasma amyloid-β assays combined with pre-analytical immunoprecipitation. Alzheimers Res Ther 14: , 127. |
[14] | Janelidze S , Stomrud E , Palmqvist S , Zetterberg H , van Westen D , Jeromin A , Song L , Hanlon D , Tan Hehir CA , Baker D , Blennow K , Hansson O ((2016) ) Plasma β-amyloid in Alzheimer’s disease and vascular disease. Sci Rep 6: , 26801. |
[15] | Sitnikova VE , Kotkova MA , Nosenko TN , Kotkova TN , Martynova DM , Uspenskaya MV ((2020) ) Breast cancer detection by ATR-FTIR spectroscopy of blood serum and multivariate data-analysis. Talanta 214: , 120857. |
[16] | Lopes J , Correia M , Martins I , Henriques AG , Delgadillo I , da Cruz E Silva O , Nunes A ((2016) ) FTIR and Raman spectroscopy applied to dementia diagnosis through analysis of biological fluids. J Alzheimers Dis 52: , 801–812. |
[17] | Santos F , Magalhaes S , Henriques MC , Fardilha M , Nunes A ((2018) ) Spectroscopic features of cancer cells: FTIR spectroscopy as a tool for early diagnosis. Curr Metabolomics 6: , 103–111. |
[18] | Paraskevaidi M , Morais CLM , Lima KMG , Snowden JS , Saxon JA , Richardson AMT , Jones M , Mann DMA , Allsop D , Martin-Hirsch PL , Martin FL ((2017) ) Differential diagnosis of Alzheimer’s disease using spectrochemical analysis of blood. Proc Natl Acad Sci U S A 114: , E7929–E7938. |
[19] | Krafft C , Wilhelm K , Eremin A , Nestel S , von Bubnoff N , Schultze-Seemann W , Popp J , Nazarenko I ((2017) ) A specific spectral signature of serum and plasma-derived extracellular vesicles for cancer screening. Nanomedicine 13: , 835–841. |
[20] | Paraskevaidi M , Morais CLM , Freitas DLD , Lima KMG , Mann DMA , Allsop D , Martin-Hirsch PL , Martin FL ((2018) ) Blood-based near-infrared spectroscopy for the rapid low-cost detection of Alzheimer’s disease. Analyst 143: , 5959–5964. |
[21] | Mordechai S , Shufan E , Porat Katz BS , Salman A ((2017) ) Early diagnosis of Alzheimer’s disease using infrared spectroscopy of isolated blood samples followed by multivariate analyses. Analyst 142: , 1276–1284. |
[22] | Correia M , Lopes J , Silva R , Rosa I , Henriques A , Delgadillo I , da Cruz e Silva OAB , Nunes A ((2016) ) FTIR spectroscopy – a potential tool to identify metabolic changes in dementia patients. J Alzheimers Neurodegener Dis 2: , 007. |
[23] | Depciuch J , Zawlik I , Skrzypa M , Pająk J , Potocka N , Łach K , Bartosik-Psujek H , Koziorowska A , Kaznowska E , Cebulski J ((2019) ) FTIR spectroscopy of cerebrospinal fluid reveals variations in the lipid: Protein ratio at different stages of Alzheimer’s disease. J Alzheimers Dis 68: , 281–293. |
[24] | Beyer L , Stocker H , Rujescu D , Holleczek B , Stockmann J , Nabers A , Brenner H , Gerwert K ((2023) ) Amyloid-beta misfolding and GFAP predict risk of clinical Alzheimer’s disease diagnosis within 17 years. Alzheimers Dement 19: , 1020–1028. |
[25] | Nabers A , Ollesch J , Schartner J , Kötting C , Genius J , Hafermann H , Klafki H , Gerwert K , Wiltfang J ((2016) ) Amyloid-β-secondary structure distribution in cerebrospinal fluid and blood measured by an immuno-infrared-sensor: A biomarker candidate for Alzheimer’s disease. Anal Chem 88: , 2755–2762. |
[26] | Soares Martins T , Magalhães S , Rosa IM , Vogelgsang J , Wiltfang J , Delgadillo I , Catita J , da Cruz e Silva OAB , Nunes A , Henriques AG ((2020) ) Potential of FTIR spectroscopy applied to exosomes for Alzheimer’s disease discrimination: A pilot study. J Alzheimers Dis 74: , 391–405. |
[27] | Shahpasand-Kroner H , Klafki H-W , Bauer C , Schuchhardt J , Hüttenrauch M , Stazi M , Bouter C , Wirths O , Vogelgsang J , Wiltfang J ((2018) ) A two-step immunoassay for the simultaneous assessment of Aβ38, Aβ40 and Aβ42 in human blood plasma supports the Aβ42/Aβ40 ratio as a promising biomarker candidate of Alzheimer’s disease. Alzheimers Res Ther 10: , 121. |
[28] | Vogelgsang J , Shahpasand-Kroner H , Vogelgsang R , Streit F , Vukovich R , Wiltfang J ((2018) ) Multiplex immunoassay measurement of amyloid-β42 to amyloid-β40 ratio in plasma discriminates between dementia due to Alzheimer’s disease and dementia not due to Alzheimer’s disease. Exp Brain Res 236: , 1241–1250. |
[29] | Soares Martins T , Catita J , Martins Rosa I , A B da Cruz e Silva O , Henriques AG , da Cruz e Silva OAB , Henriques AG ((2018) ) Exosome isolation from distinct biofluids using precipitation and column-based approaches. PLoS One 13: , e0198820. |
[30] | Yang H , Yang S , Kong J , Dong A , Yu S ((2015) ) Obtaining information about protein secondary structures in aqueous solution using Fourier transform IR spectroscopy. Nat Protoc 10: , 382–396. |
[31] | Magalhães S , Almeida I , Martins F , Camões F , Soares AR , Goodfellow BJ , Rebelo S , Nunes A ((2021) ) FTIR spectroscopy as a tool to study age-related changes in cardiac and skeletal muscle of female C57BL/6J mice. Molecules 26: , 6410. |
[32] | Gray E , Butler HJ , Board R , Brennan PM , Chalmers AJ , Dawson T , Goodden J , Hamilton W , Hegarty MG , James A , Jenkinson MD , Kernick D , Lekka E , Livermore LJ , Mills SJ , O’neill K , Palmer DS , Vaqas B , Baker MJ ((2018) ) Health economic evaluation of a serum-based blood test for brain tumour diagnosis: Exploration of two clinical scenarios. BMJ Open 8: , 17593. |
[33] | Rai V , Mukherjee R , Routray A , Ghosh AK , Roy S , Ghosh BP , Mandal PB , Bose S , Chakraborty C ((2018) ) Serum-based diagnostic prediction of oral submucous fibrosis using FTIR spectrometry. Spectrochim Acta Part A Mol Biomol Spectrosc 189: , 322–329. |
[34] | Ghimire H , Venkataramani M , Bian Z , Liu Y , Perera AGU ((2017) ) ATR-FTIR spectral discrimination between normal and tumorous mouse models of lymphoma and melanoma from serum samples. Sci Rep 7: , 16993. |
[35] | Mihály J , Deák R , Szigyártó IC , Bóta A , Beke-Somfai T , Varga Z ((2017) ) Characterization of extracellular vesicles by IR spectroscopy: Fast and simple classification based on amide and CH stretching vibrations. Biochim Biophys Acta Biomembr 1859: , 459–466. |
[36] | Wang Q , He H , Li B , Lin H , Zhang Y , Zhang J , Wang Z ((2017) ) UV–Vis and ATR–FTIR spectroscopic investigations of postmortem interval based on the changes in rabbit plasma. PLoS One 12: , e0182161. |
[37] | Thumanu K , Sangrajrang S , Khuhaprema T , Kalalak A , Tanthanuch W , Pongpiachan S , Heraud P ((2014) ) Diagnosis of liver cancer from blood sera using FTIR microspectroscopy: A preliminary study. J Biophotonics 7: , 222–231. |
[38] | Bonnier F , Baker MJ , Byrne HJ ((2014) ) Vibrational spectroscopic analysis of body fluids: Avoiding molecular contamination using centrifugal filtration. Anal Methods 6: , 5155. |
[39] | Magalhães S , Trindade D , Martins T , Martins Rosa I , Delgadillo I , Goodfellow BJ , da Cruz e Silva OAB , Henriques AG , Nunes A ((2020) ) Monitoring plasma protein aggregation during aging using conformation-specific antibodies and FTIR spectroscopy. Clin Chim Acta 502: , 25–33. |
[40] | Ruysschaert JM , Raussens V ((2018) ) ATR-FTIR analysis of amyloid proteins. Methods Mol Biol 1777: , 69–81. |
[41] | Seshadri S , Khurana R , Fink AL ((1999) ) Fourier transform infrared spectroscopy in analysis of protein deposits. Methods Enzymol 309: , 559–576. |
[42] | van de Weert M , Jørgensen L ((2012) ) Infrared spectroscopy to characterize protein aggregates. In Analysis of Aggregates and Particles in Protein Pharmaceuticals, Mahler H-C, Jiskoot W, eds. https://doi.org/10.1002/9781118150573.ch10 |
[43] | Dong A , Huang P , Caughey WS ((1990) ) Protein secondary structures in water from second-derivative amide I infrared spectra. Biochemistry 29: , 3303–3308. |
[44] | Shivu B , Seshadri S , Li J , Oberg KA , Uversky VN , Fink AL ((2013) ) Distinct β-sheet structure in protein aggregates determined by ATR-FTIR spectroscopy. Biochemistry 52: , 5176–5183. |
[45] | Soares Martins T , Vaz M , Henriques AG ((2022) ) A review on comparative studies addressing exosome isolation methods from body fluids. Anal Bioanal Chem 415: , 1239–1263. |
[46] | Hammond TC , Xing X , Wang C , Ma D , Nho K , Crane PK , Elahi F , Ziegler DA , Liang G , Cheng Q , Yanckello LM , Jacobs N , Lin AL ((2020) ) β-amyloid and tau drive early Alzheimer’s disease decline while glucose hypometabolism drives late decline. Commun Biol 3: , 352. |
[47] | Bass B , Upson S , Roy K , Montgomery EL , Jalonen TO , Murray IVJ ((2015) ) Glycogen and amyloid-beta: Key players in the shift from neuronal hyperactivity to hypoactivity observed in Alzheimer’s disease? Neural Regen Res 10: , 1023–1025. |
[48] | Williams C , Royo F , Aizpurua-Olaizola O , Pazos R , Boons GJ , Reichardt NC , Falcon-Perez JM ((2018) ) Glycosylation of extracellular vesicles: Current knowledge, tools and clinical perspectives. J Extracell Vesicles 7: , 1442985. |
[49] | Yuyama K , Sun H , Sakai S , Mitsutake S , Okada M , Tahara H , Furukawa J-I , Fujitani N , Shinohara Y , Igarashi Y ((2014) ) Decreased amyloid-β pathologies by intracerebral loading of glycosphingolipid-enriched exosomes in Alzheimer model mice. J Biol Chem 289: , 24488–24498. |
[50] | Odaka H , Hiemori K , Shimoda A , Akiyoshi K , Tateno H ((2021) ) Platelet-derived extracellular vesicles are increased in sera of Alzheimer’s disease patients, as revealed by Tim4-based assays. FEBS Open Bio 11: , 741–752. |
[51] | Peuchant E , Richard-Harston S , Bourdel-Marchasson I , Dartigues JF , Letenneur L , Barberger-Gateau P , Arnaud-Dabernat S , Daniel JY ((2008) ) Infrared spectroscopy: A reagent-free method to distinguish Alzheimer’s disease patients from normal-aging subjects. Transl Res 152: , 103–112. |
[52] | Bradley-Whitman MA , Timmons MD , Beckett TL , Murphy MP , Lynn BC , Lovell MA ((2014) ) Nucleic acid oxidation: An early feature of Alzheimer’s disease. J Neurochem 128: , 294–304. |
[53] | Magalhães S , Almeida I , Pereira CD , Rebelo S , Goodfellow BJ , Nunes A ((2022) ) The long-term culture of human fibroblasts reveals a spectroscopic signature of senescence. Int J Mol Sci 23: , 5830. |
[54] | Carmona P , Molina M , Calero M , Bermejo-Pareja F , Martínez-Martín P , Alvarez I , Toledano A ((2012) ) Infrared spectroscopic analysis of mononuclear leukocytes in peripheral blood from Alzheimer’s disease patients. Anal Bioanal Chem 402: , 2015–2021. |
[55] | Beretta C , Nikitidou E , Streubel-Gallasch L , Ingelsson M , Sehlin D , Erlandsson A ((2020) ) Extracellular vesicles from amyloid-β exposed cell cultures induce severe dysfunction in cortical neurons. Sci Rep 10: , 19656. |
[56] | Sardar Sinha M , Ansell-Schultz A , Civitelli L , Hildesjö C , Larsson M , Lannfelt L , Ingelsson M , Hallbeck M ((2018) ) Alzheimer’s disease pathology propagation by exosomes containing toxic amyloid-beta oligomers. Acta Neuropathol 136: , 41–56. |
[57] | Polanco JC , Scicluna BJ , Hill AF , Götz J ((2016) ) Extracellular vesicles isolated from the brains of rTg4510 mice seed tau protein aggregation in a threshold-dependent manner. J Biol Chem 291: , 12445–12466. |
[58] | Fowler SL , Behr TS , Turkes E , Cauhy PM , Foiani MS , Schaler A , Crowley G , Bez S , Ficulle E , Tsefou E , O’Brien DP , Fischer R , Geary B , Gaur P , Miller C , D’Acunzo P , Levy E , Duff KE , Ryskeldi-Falcon B ((2023) ) Tau filaments are tethered within brain extracellular vesicles in Alzheimer’s disease. bioRxiv,, https://doi.org/10.1101/2023.04.30.537820 [Preprint]. Posted April 30, 2023. |
[59] | Liu K , Li J , Raghunathan R , Zhao H , Li X , Wong STC ((2021) ) The progress of label-free optical imaging in Alzheimer’s disease screening and diagnosis. Front Aging Neurosci 13: , 455. |
[60] | Kao YC , Ho PC , Tu YK , Jou IM , Tsai KJ ((2020) ) Lipids and Alzheimer’s disease. Int J Mol Sci 21: , 1505. |
[61] | Su H , Rustam YH , Masters CL , Makalic E , McLean CA , Hill AF , Barnham KJ , Reid GE , Vella LJ ((2021) ) Characterization of brain-derived extracellular vesicle lipids in Alzheimer’s disease. J Extracell Vesicles 10: , e12089. |
[62] | Tully AM , Roche HM , Doyle R , Fallon C , Bruce I , Lawlor B , Coakley D , Gibney MJ ((2003) ) Low serum cholesteryl ester-docosahexaenoic acid levels in Alzheimer’s disease: A case-control study. Br J Nutr 89: , 483–489. |
[63] | Svennerholm L , Gottfries C-G ((1994) ) Membrane lipids, selectively diminished in Alzheimer brains, suggest synapse loss as a primary event in early-onset form (type I) and demyelination in late-onset form (type II). J Neurochem 62: , 1039–1047. |
[64] | Pettegrew JW , Panchalingam K , Hamilton RL , Mcclure RJ ((2001) ) Brain membrane phospholipid alterations in Alzheimer’s disease. Neurochem Res 26: , 771–782. |
[65] | He X , Huang Y , Li B , Gong CX , Schuchman EH ((2010) ) Deregulation of sphingolipid metabolism in Alzheimer’s disease. Neurobiol Aging 31: , 398–408. |
[66] | Han X , Fagan AM , Cheng H , Morris JC , Xiong C , Holtzman DM ((2003) ) Cerebrospinal fluid sulfatide is decreased in subjects with incipient dementia. Ann Neurol 54: , 115–119. |
[67] | Walter A , Korth U , Hilgert M , Hartmann J , Weichel O , Hilgert M , Fassbender K , Schmitt A , Klein J ((2004) ) Glycerophosphocholine is elevated in cerebrospinal fluid of Alzheimer patients. Neurobiol Aging 25: , 1299–1303. |
[68] | Yonar D , Ocek L , Tiftikcioglu BI , Zorlu Y , Severcan F ((2018) ) Relapsing-remitting multiple sclerosis diagnosis from cerebrospinal fluids via Fourier transform infrared spectroscopy coupled with multivariate analysis. Sci Rep 8: , 1025. |


