
Potential Impact of Slowing Disease Progression in Early Symptomatic Alzheimer’s Disease on Patient Quality of Life, Caregiver Time, and Total Societal Costs: Estimates Based on Findings from GERAS-US Study
Abstract
Background:
Impact of Alzheimer’s disease (AD) progression on patient health-related quality of life (HRQoL), caregiver time, and societal costs is not well characterized in early AD.
Objective:
To assess the association of change in cognition with HRQoL, caregiver time, and societal costs over 36 months, and estimate the impact of slowing disease progression on these outcomes.
Methods:
This post-hoc analysis included patients with amyloid-positive mild cognitive impairment (MCI) and mild AD dementia (MILD AD) from the 36-month GERAS-US study. Disease progression was assessed using the Mini-Mental State Examination score. Change in outcomes associated with slowing AD progression was estimated using coefficients from generalized linear models.
Results:
At baseline, 300 patients had MCI and 317 had MILD AD. Observed natural progression over 36 months was associated with: 5.1 point decline in the Bath Assessment of Subjective Quality of Life in Dementia (BASQID) score (for HRQoL), increase in 1,050 hours of total caregiver time, and $8,504 total societal costs for MCI; 6.6 point decline in the BASQID score, increase in 1,929 hours of total caregiver time, and $12,795 total societal costs for MILD AD per person. Slowing AD progression by 30% could result in per person savings in HRQoL decline, total caregiver time, and total societal costs: for MCI: 1.5 points, 315 hours, and $2,638; for MILD AD: 2.0 points, 579 hours, and $3,974.
Conclusions:
Slowing AD progression over 36 months could slow decline in HRQoL and save caregiver time and societal cost in patients with MCI and MILD AD.
INTRODUCTION
In the United States (US), an estimated 6.7 million older adults are living with Alzheimer’s disease (AD) in the year 2023 [1]. In 2021, AD was the seventh leading cause of death and among the top causes of disability and debility among patients aged≥65 years [1, 2]. AD and other dementias are associated with significant healthcare costs, estimated to be $345 billion in 2023 [1]. With an increasing older population, the number of patients with symptomatic AD in the US is projected to double by 2060, and the total annual healthcare costs are projected to increase to $1 trillion (2023 estimates) by 2050 [1]. In addition, AD continues to impose a huge societal burden in the US, with unpaid informal care (by caregivers) amounting to approximately 18 billion hours, valued at $339.5 billion in 2022 [1].
In patients with AD, progression from early AD (mild cognitive impairment [MCI] due to AD or mild dementia due to AD [MILD AD]) to late-stage disease over several years leads to greater loss in cognition and function, resulting in increased care needs for patients, increased costs, and greater caregiver burden [3, 4]. The current standard of care treatments for AD target the symptoms rather than the underlying biomolecular factors, and the duration of benefit is inconsistent [5–7].
In recent clinical studies, amyloid-targeting monoclonal antibodies have demonstrated slowing of AD progression rates [7–12], with two amyloid-targeting therapies currently approved by the US FDA for the treatment of patients with early AD [13, 14]. As AD is a progressive condition, slowing its progression might preserve the time in earlier stages of disease when caregiver burden and costs are lower. With these recent developments in the AD treatment landscape [13, 14], it is important to understand the potential impact of slowing disease progression on quality of life (QoL), caregiver outcomes, and costs [15].
GERAS-US (NCT02951598) was a 36-month, US-based, prospective, longitudinal cohort study, which investigated clinical and economic outcomes in patients with early AD (amyloid-positive patients with MCI or MILD AD) receiving usual care. The study demonstrated higher total societal costs per month and caregiver burden in MILD AD compared to MCI over 36 months [16]. However, as the study was conducted prior to the approval of amyloid-targeting monoclonal antibodies [13, 14], it did not evaluate the impact of slowing AD progression on patient and caregiver outcomes. Reported studies of lecanemab and aducanumab have demonstrated positive impact of slowing disease progression on health-related QoL (HRQoL) and caregiver burden [17–19]. The aim of this real-world study, in patients with amyloid-positive MCI or MILD AD, was to determine the impact of disease progression on patients’ HRQoL, caregiver time, and societal costs, and the potential impact of slowing AD progression by 20% to 30%. Slowing of AD progression by 20% –30% was based on treatment effects reported in recent clinical trials with amyloid-targeting therapies versus placebo [9, 10, 19, 20].
MATERIALS AND METHODS
Study design and data source
The current study was a post-hoc analysis conducted using the data from the GERAS-US study, conducted between 29 October 2016 and 30 January 2021. Patients with early AD and their study partners were enrolled in GERAS-US study between 30 October 2016 and 9 October 2017 [16, 21].
In the GERAS-US study, patient data were collected during routine visits with their healthcare provider through clinician interviews and study partner surveys. Patients underwent amyloid testing to increase the diagnostic certainty of AD. Patients were grouped into two cohorts based on their Mini-Mental State Examination (MMSE) and Functional Activities Questionnaire (FAQ) scores – MCI (MMSE 24 to 30 and FAQ < 6) and MILD AD (MMSE 20 to 30 and FAQ≥6) [22]. Following enrollment, the participants were observed at six-month intervals until they reached 36 months of participation [21]. Supplementary Figure 1 summarizes the study design and numbers of patients completing assessments at various time points.
The GERAS-US study was conducted in accordance with the Declaration of Helsinki, Council for International Organizations of Medical Sciences International Ethical Guidelines, International Council for Harmonization-Good Clinical Practice guidelines, and applicable laws and regulations [16, 21]. As the protocol for the GERAS-US study was approved by central or site-specific Institutional Review Boards and allows for post-hoc analyses, the current study did not require additional ethics approval.
Study population
Amyloid-positive patients with MCI or MILD AD from the GERAS-US study were included in this study (full analysis set, N = 617). At baseline, patients were aged between 55 to 85 years (inclusive), had an MMSE score of≥20, had a study partner residing or in close contact with them, and tested amyloid-positive in prior amyloid tests or based on a florbetapir positron emission tomography scan received through the investigator. Further details of the study population have been described previously [21]. For the outcome analyses, we further required that participants had both MMSE and outcomes measured at baseline and month 36 (outcome analysis set, n = 222). Supplementary Figure 2 illustrates the patient disposition in MCI and MILD AD groups study population for these analyses.
Outcomes and assessments
Disease progression measurements
Disease progression was measured by the MMSE score [23], assessed at baseline, 6, 12, 18, 24, 30, and 36 months. MMSE is a commonly used investigator-rated measure of cognition in dementia. The range for the total MMSE score is 0 to 30, with higher score indicating better cognition. Participants with baseline and at least one post-baseline MMSE measurement in the full analysis set were utilized to estimate disease progression.
Outcomes
The outcomes in this study included change in HRQoL (BASQID), total caregiver time, and total societal costs over 36 months. The impact of disease progression on these outcomes was assessed in participants who had both MMSE and outcome measurements at baseline and month 36 (outcomes analysis set). HRQoL in patients was assessed at baseline, 12, 24, and 36 months using the Bath Assessment of Subjective Quality of Life in Dementia (BASQID) scale, a 14-item, self-reported measure of HRQoL for people with mild to moderate dementia [24]. This measure was developed to capture the experience, perception, and beliefs of people with dementia and contributes an important dimension to our understanding of the patients’ overall health when considered in conjunction with clinical measures of disease progression. The scores on the BASQID scale range from 0 to 100, with higher scores indicating better HRQoL [24].
Caregiver time and total societal costs in the GERAS-US study were assessed using the Resource Utilization in Dementia (RUD) questionnaire [25, 26]. The data were collected through structured interviews of the patients and their study partners at baseline and at follow-up. The RUD questionnaire was administered at baseline, 6, 12, 18, 24, 30, and 36 months. Caregiver time (hours/month) was estimated by data provided by caregivers on time spent: i) assisting patients with basic activities of daily living (ADL) such as using the toilet, eating, dressing, grooming, walking, and bathing; ii) assisting patients with instrumental ADLs such as shopping, cooking, housekeeping, laundry, transportation, taking medication, and managing finances; and iii) providing supervision in the 30 days prior to each assessment. The total caregiver time (hours/month) was the sum of time, in hours, spent assisting the participant with basic ADLs, instrumental ADLs, and supervising the subject, and was capped at 540 hours per month accounting for 6 hours of sleep per day for all caregivers. The total caregiver time in hours per day (hours/day) was calculated by dividing the total caregiver hours per month by 30. For months that the RUD questionnaire was not administered, last observation carried forward [27] was used to impute the missing total caregiver time at each month between two visits [28] among participants with both baseline and month 36 measurements. The total caregiver time over 3 years (hours/3 years) was calculated by adding monthly total caregiver time over 36 months.
Total societal costs ($/month) included four components: direct medical costs for patients (medication, hospitalization, emergency department, and outpatient visits) and study partners (medication, hospitalization, emergency department, and outpatient visits), direct non-medical costs for patients (accommodation, community service, and consumable goods), and indirect non-medical resources for study partners (caregiver time taken or work lost in caregiving) in the 30 days prior to each RUD assessment (Supplementary Figure 3) [16]. Costs ($/month) were computed by multiplying resources (RUD items and additional data collected on financial assistance, out-of-pocket expenses, and neuropsychological assessments) by uniformly applied cost units. Any unit costs not reported in 2017 values were adjusted to $USD 2017 using consumer price index (CPI) data from the US Bureau of Labor Statistics (US Bureau of Labor Statistics 2017). The prices were adjusted to year 2020 by multiplying a CPI inflation factor of 1.06 [29]. As with the total caregiver time, the total societal costs over 36 months were derived as the sum of monthly costs using the last observation carried forward imputation.
The potential impact of reduction in the natural disease progression rate by 20% 25% and 30% [9, 10, 19, 20] on the patients’ HRQoL, total caregiver time, and total societal costs was estimated over 36 months.
Statistical analysis
Demographics and baseline characteristics for the patients (overall, MCI, and MILD AD groups) and study partners were summarized descriptively based on the non-missing observations. Continuous variables were summarized using mean and standard deviation (SD). Categorical variables were summarized using counts and percentages. Comparisons between the patient groups were performed using t-test for continuous data and Fisher’s exact test for categorical data.
To describe the disease progression, the change in MMSE score from baseline to 36 months was analyzed using mixed model repeated measures (MMRM), which provides robust inference even in case of missing data. All participants with a baseline and at least one post-baseline MMSE measurement were included in the analysis. The model included the fixed effects of patient group at baseline (MCI and MILD AD), visit, and patient group at baseline-by-visit interaction. As the unit of analysis focused on the change in MMSE score from baseline (rather than the absolute score at each visit), baseline AD severity level (MCI and MILD AD) was automatically included as a covariate, thereby negating the need for including baseline demographics in the model [27, 28]. Least square mean change (LSMC) from baseline to 36 months and 95% confidence intervals (CI) were used for potential clinical outcome savings (e.g., caregiver time savings and total societal costs) resulting from slowing AD progression by 20% to 30%.
Participants who had both MMSE and outcome measurements at baseline and 36 months post-baseline were included in the outcome analyses. For the BASQID score, a linear regression model was used to estimate the relationship between change in the MMSE (20% –30% reduction, independent variable) and change in the BASQID (dependent variable) over 36 months adjusting for baseline value, age, number of comorbidities, and study partner relationship. The generalized linear model (GLM) with normal distribution was used to estimate the relationship between change in the MMSE (20% –30% reduction) for total caregiver time and with log link and gamma distribution for total societal cost over 36 months. The models included baseline MMSE, change in MMSE from baseline to 36 months, age, number of comorbidities, and study partner relationship. Separate models were developed for MCI and MILD AD. The savings in all outcomes over 36 months were estimated based on LSMC in MMSE, coefficients and 95% CI of MMSE change from baseline to 36 months from above models. All estimates were evaluated based on a 2-sided significance level of 0.05 for all analyses. The 95% CIs were provided for all estimates. No adjustments for multiplicity were made. Analyses were performed using Statistical Analysis Software Version 9.4 (SAS Institute Inc., Cary, NC, USA).
To maximize the generalizability of our findings, we used the larger sample of all participants with baseline and at least one post-baseline MMSE measurement in the full analysis set to estimate disease progression. However, to assess the potential impact of selection bias given the high rate of missing MMSE data over the 36 months, we repeated the analyses using disease progression estimates derived using only those participants with MMSE measurements at 36 months (outcomes analysis set) by way of a sensitivity analysis.
RESULTS
Of the 617 with amyloid-positive early symptomatic AD in the longitudinal cohort, 300 were MCI and 317 were MILD AD participants (the full analysis set). The study completion rates were 57.3% (n = 172) for MCI and 54.0% (n = 171) for MILD AD groups, respectively. Reasons for study discontinuation commonly included patient withdrawal, patient loss to follow-up, and study partner withdrawal. In MCI and MILD AD groups, 8 (6.3%) and 12 (8.3%) patients discontinued the study due to death, respectively. However, the outcome analysis set only comprised of those who completed the study and had measurement of MMSE and outcomes at baseline and month 36 (n = 108 MCI and n = 114 MILD AD). For some participants who completed the study, their 36 month follow-up visit was captured by phone (frequently due to restrictions imposed by the COVID pandemic) and MMSE could not be captured. Those participants could not be included in the outcomes analysis.
Baseline demographics and characteristics:patients and study partners
For the 617 patients included in the full analysis set (300 MCI and 317 MILD AD), mean (SD) age was 71.0 (7.8) years and 52.7% were females (Table 1). Compared with the MCI group, the MILD AD group had older patients (mean [SD] age 71.7 [8.0] versus 70.3 [7.4] years, respectively), fewer patients with high school or above education (62.0% versus 82.3% respectively), and fewer patients who were working (11.1% versus 20.4% respectively) (Table 1). Patients with MILD AD had longer mean (SD) duration of AD diagnosis (1.5 [2.2] versus 1.0 [1.3] years, respectively), and longer time since first symptom compared with the MCI group. However, fewer patients in the MILD AD group were taking medication for AD compared with the MCI group (36.0% versus 48.7% respectively). In general, baseline demographics and characteristics in the full analysis set and outcome analysis set were similar (Supplementary Table 1).
Table 1
Demographic characteristics – patients (full analysis set)
| Characteristic | Total (N = 617) | MCI (n = 300) | MILD AD (n = 317) | p* |
| Sex, n (%) | 1.000 | |||
| Female | 325 (52.7) | 158 (52.7) | 167 (52.7) | |
| Male | 292 (47.3) | 142 (47.3) | 150 (47.3) | |
| Age at index date (y), mean (SD) | 71.0 (7.8) | 70.3 (7.4) | 71.7 (8.0) | 0.030 |
| Race, n (%) | 0.969 | |||
| White | 538 (87.2) | 259 (86.3) | 279 (88.0) | |
| Black or African American | 63 (10.2) | 33 (11.0) | 30 (9.5) | |
| Asian | 10 (1.6) | 5 (1.7) | 5 (1.6) | |
| American Indian or Alaska Native | 4 (0.6) | 2 (0.7) | 2 (0.6) | |
| Multiple | 2 (0.3) | 1 (0.3) | 1 (0.3) | |
| Education, n (%) | <0.001 | |||
| Less than high school | 165 (26.8) | 51 (17.1) | 114 (36.1) | |
| High school or above | 442 (71.9) | 246 (82.3) | 196 (62.0) | |
| Work status, n (%) | 0.003 | |||
| Yes | 96 (15.6) | 61 (20.4) | 35 (11.1) | |
| No | 513 (83.4) | 236 (78.9) | 277 (87.7) | |
| Living situation, n (%) | 0.032 | |||
| Non-institutionalized | 154 (67.2) | 73 (76.0) | 81 (60.9) | |
| Limited home care | 55 (24.0) | 16 (16.7) | 39 (29.3) | |
| Adult home care | 13 (5.7) | 6 (6.3) | 7 (5.3) | |
| Long term/permanent institutionalization | 5 (2.2) | 0 | 5 (3.8) | |
| Number of comorbidities, median (min, max) | 2 (0, 8) | 2 (0, 6) | 2 (0, 8) | 0.779 |
| Comorbidities, n (%) | ||||
| Depression | 204 (33.1) | 94 (31.3) | 110 (34.7) | 0.393 |
| Sleep disorder | 131 (21.2) | 59 (19.7) | 72 (22.7) | 0.376 |
| Diabetes | 148 (24.0) | 75 (25.0) | 73 (23.0) | 0.573 |
| Coronary artery disease | 62 (10.0) | 28 (9.3) | 34 (10.7) | 0.594 |
| Hypertension | 385 (62.4) | 191 (63.7) | 194 (61.2) | 0.561 |
| Receiving AD medication, n (%) | 260 (42.1) | 146 (48.7) | 114 (36.0) | 0.001 |
| Time since AD diagnosis (y), mean (SD) | 1.2 (1.8) | 1.0 (1.3) | 1.5 (2.2) | <0.001 |
| Time since first symptoms, mean (SD) | 3.0 (2.8) | 2.7 (2.4) | 3.2 (3.0) | 0.018 |
| MMSE, mean (SD) | 25.9 (2.8) | 27.4 (1.8) | 24.4 (2.8) | <0.001 |
| CFI, mean (SD) | 55.6 (16.0) | 47.0 (14.0) | 63.7 (13.4) | <0.001 |
| Total caregiver time (h/day), mean (SD) | 4.3 (5.3) | 2.3 (3.6) | 6.2 (5.8) | <0.001 |
| Total cost/month, mean (SD) | 3269.2 (6032) | 2430.3 (3584) | 4063.0 (7581) | <0.001 |
| ZBI, mean (SD) | 16.7 (14.8) | 12.4 (13.4) | 20.8 (14.9) | <0.001 |
| BASQID, mean (SD) | 57.1 (20.3) | 64.7 (18.5) | 49.8 (19.2) | <0.001 |
AD, Alzheimer’s disease; BASQID, Bath Assessment of Subjective QoL in Dementia; CFI, Cognitive Function Instrument; Max, maximum; MCI, mild cognitive impairment due to AD; MILD AD, mild dementia due to AD; Min, Minimum; MMSE, Mini-Mental State Examination; N, number of patients in the analysis population; n, number of patients in the specified category; SD, standard deviation; ZBI, Zarit Burden Interview. *p-value is from t-test for continuous variables and from Fisher’s exact test for categorical variables between MCI and MILD AD groups based on non-missing observations.
For the corresponding 617 study partners in the study, the mean (SD) age was 59.5 (15.4) years, 66.9% were females, and most were spouses (45.1%) (Table 2). For the 222 study partners of patients in the outcome analysis set, baseline demographics and characteristics are presented in the Supplementary Table 2.
Table 2
Demographic characteristics – study partners
| Characteristic | Total (N = 617) | MCI (n = 300) | MILD AD (n = 317) | p* |
| Sex, n (%) | 0.021 | |||
| Female | 413 (66.9) | 187 (62.3) | 226 (71.3) | |
| Male | 204 (33.1) | 113 (37.7) | 91 (28.7) | |
| Age at index date (y), mean (SD) | 59.5 (15.4) | 59.7 (15.9) | 59.3 (14.9) | 0.791 |
| Education, n (%) | <0.001 | |||
| Less than high school | 115 (18.7) | 33 (11.0) | 82 (25.9) | |
| High school graduate | 117 (19.0) | 49 (16.4) | 68 (21.5) | |
| Some college | 156 (25.4) | 78 (26.1) | 78 (24.7) | |
| College or above | 225 (36.6) | 138 (46.2) | 87 (27.5) | |
| Study partner relationship, n (%) | 0.117 | |||
| Spouse | 278 (45.1) | 144 (48.0) | 134 (42.3) | |
| Sibling | 37 (6.0) | 14 (4.7) | 23 (7.3) | |
| Child | 161 (26.1) | 70 (23.3) | 91 (28.7) | |
| Friend | 81 (13.1) | 46 (15.3) | 35 (11.0) | |
| Other | 60 (9.7) | 26 (8.7) | 34 (10.7) | |
| Study partner resides with patient, n (%) | 423 (68.6) | 196 (65.3) | 227 (71.6) | 0.100 |
| Number of caregivers in addition to study partner, n (%) | 0.001 | |||
| Zero | 391 (63.4) | 212 (70.7) | 179 (56.5) | |
| One | 166 (26.9) | 67 (22.3) | 99 (31.2) | |
| More than one | 60 (9.7) | 21 (7.0) | 39 (12.3) |
AD, Alzheimer’s disease; MCI, mild cognitive impairment due to AD; MILD AD, mild dementia due to AD; N, number of study partner in the analysis population; n, number of study partner in the specified category; SD, standard deviation. *p-value is from t-test for continuous variables and from Fisher’s exact test for categorical variables between MCI and MILD AD groups based on non-missing observations.
Disease progression over 36 months
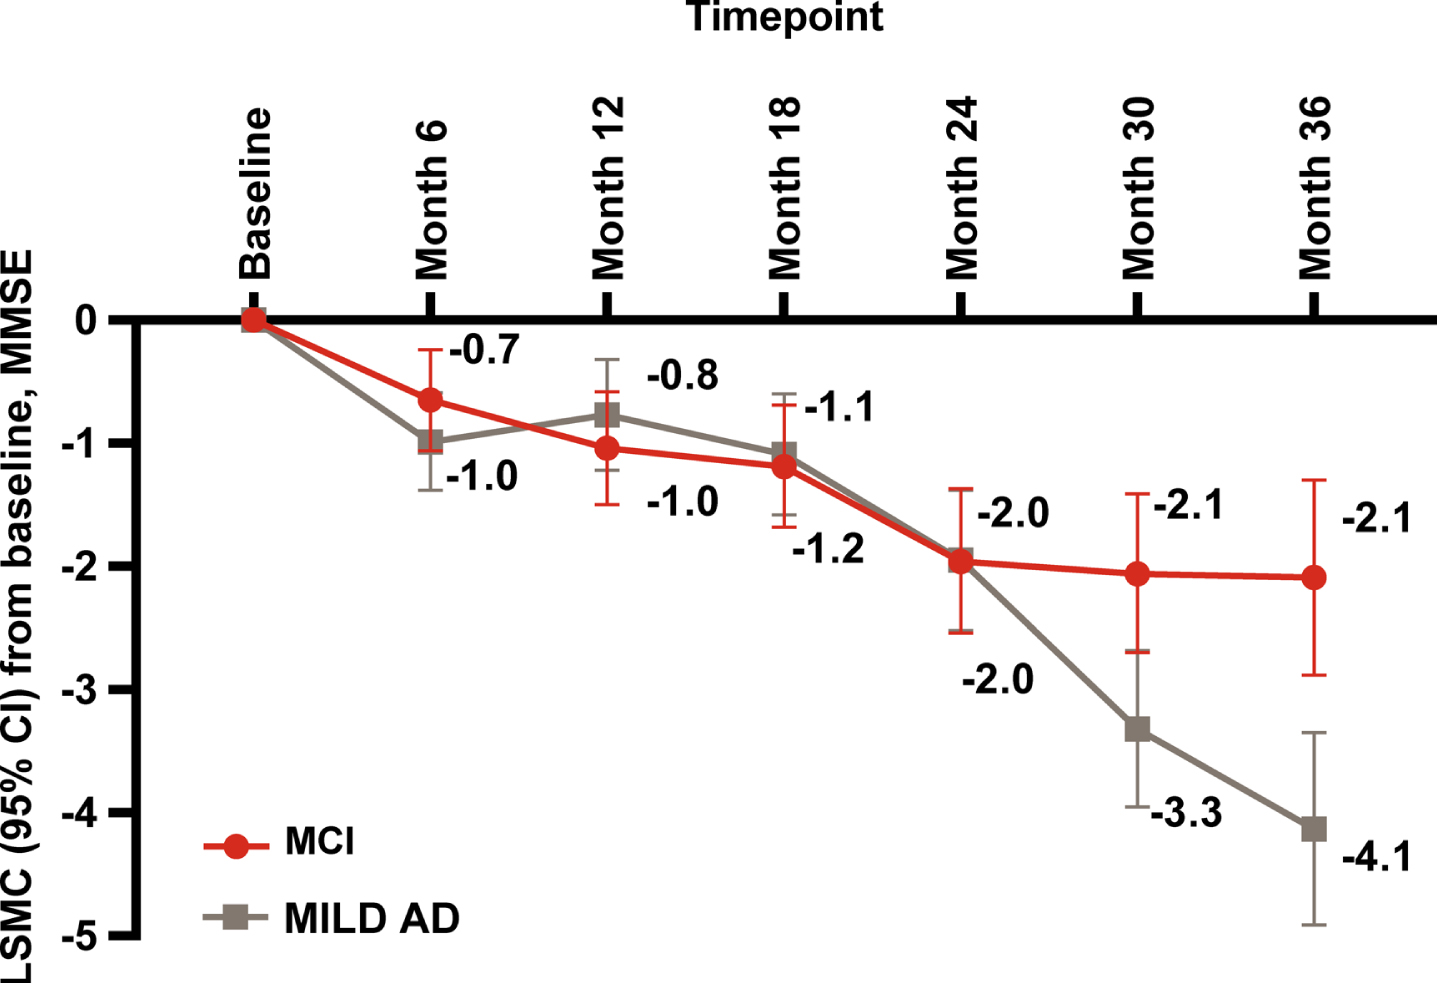
As measured by MMSE, disease progressed over time in both the MCI and MILD AD groups. At baseline, the mean (SD) MMSE score was 27.4 (1.8) in the MCI and 24.4 (2.8) in MILD AD groups (Table 1). Decline in the MMSE score from baseline to 36 months was significant in both groups (p < 0.001) (Fig. 1). At 36 months, the MILD AD group had a significantly greater decline in MMSE compared with the MCI group (LSMC [95% CI] –4.1 [–4.9, –3.4] versus –2.1 [–2.9, –1.3]; LSMC difference: 2.0 [–3.2, –0.9], p < 0.001).
Fig. 1
Disease progression measured by MMSE: LSMC baseline to 36 months. AD, Alzheimer’s disease; CI, confidence interval; MCI, mild cognitive impairment; MILD AD, mild dementia due to AD; LSMC, least squares mean change (from MMRM model); MMRM, mixed model repeated measures; MMSE, Mini-Mental State Examination. p≤0.001 at month 36, calculated from t-test for comparing MCI and MILD AD.
Outcomes over 36 months
HRQoL: BASQID
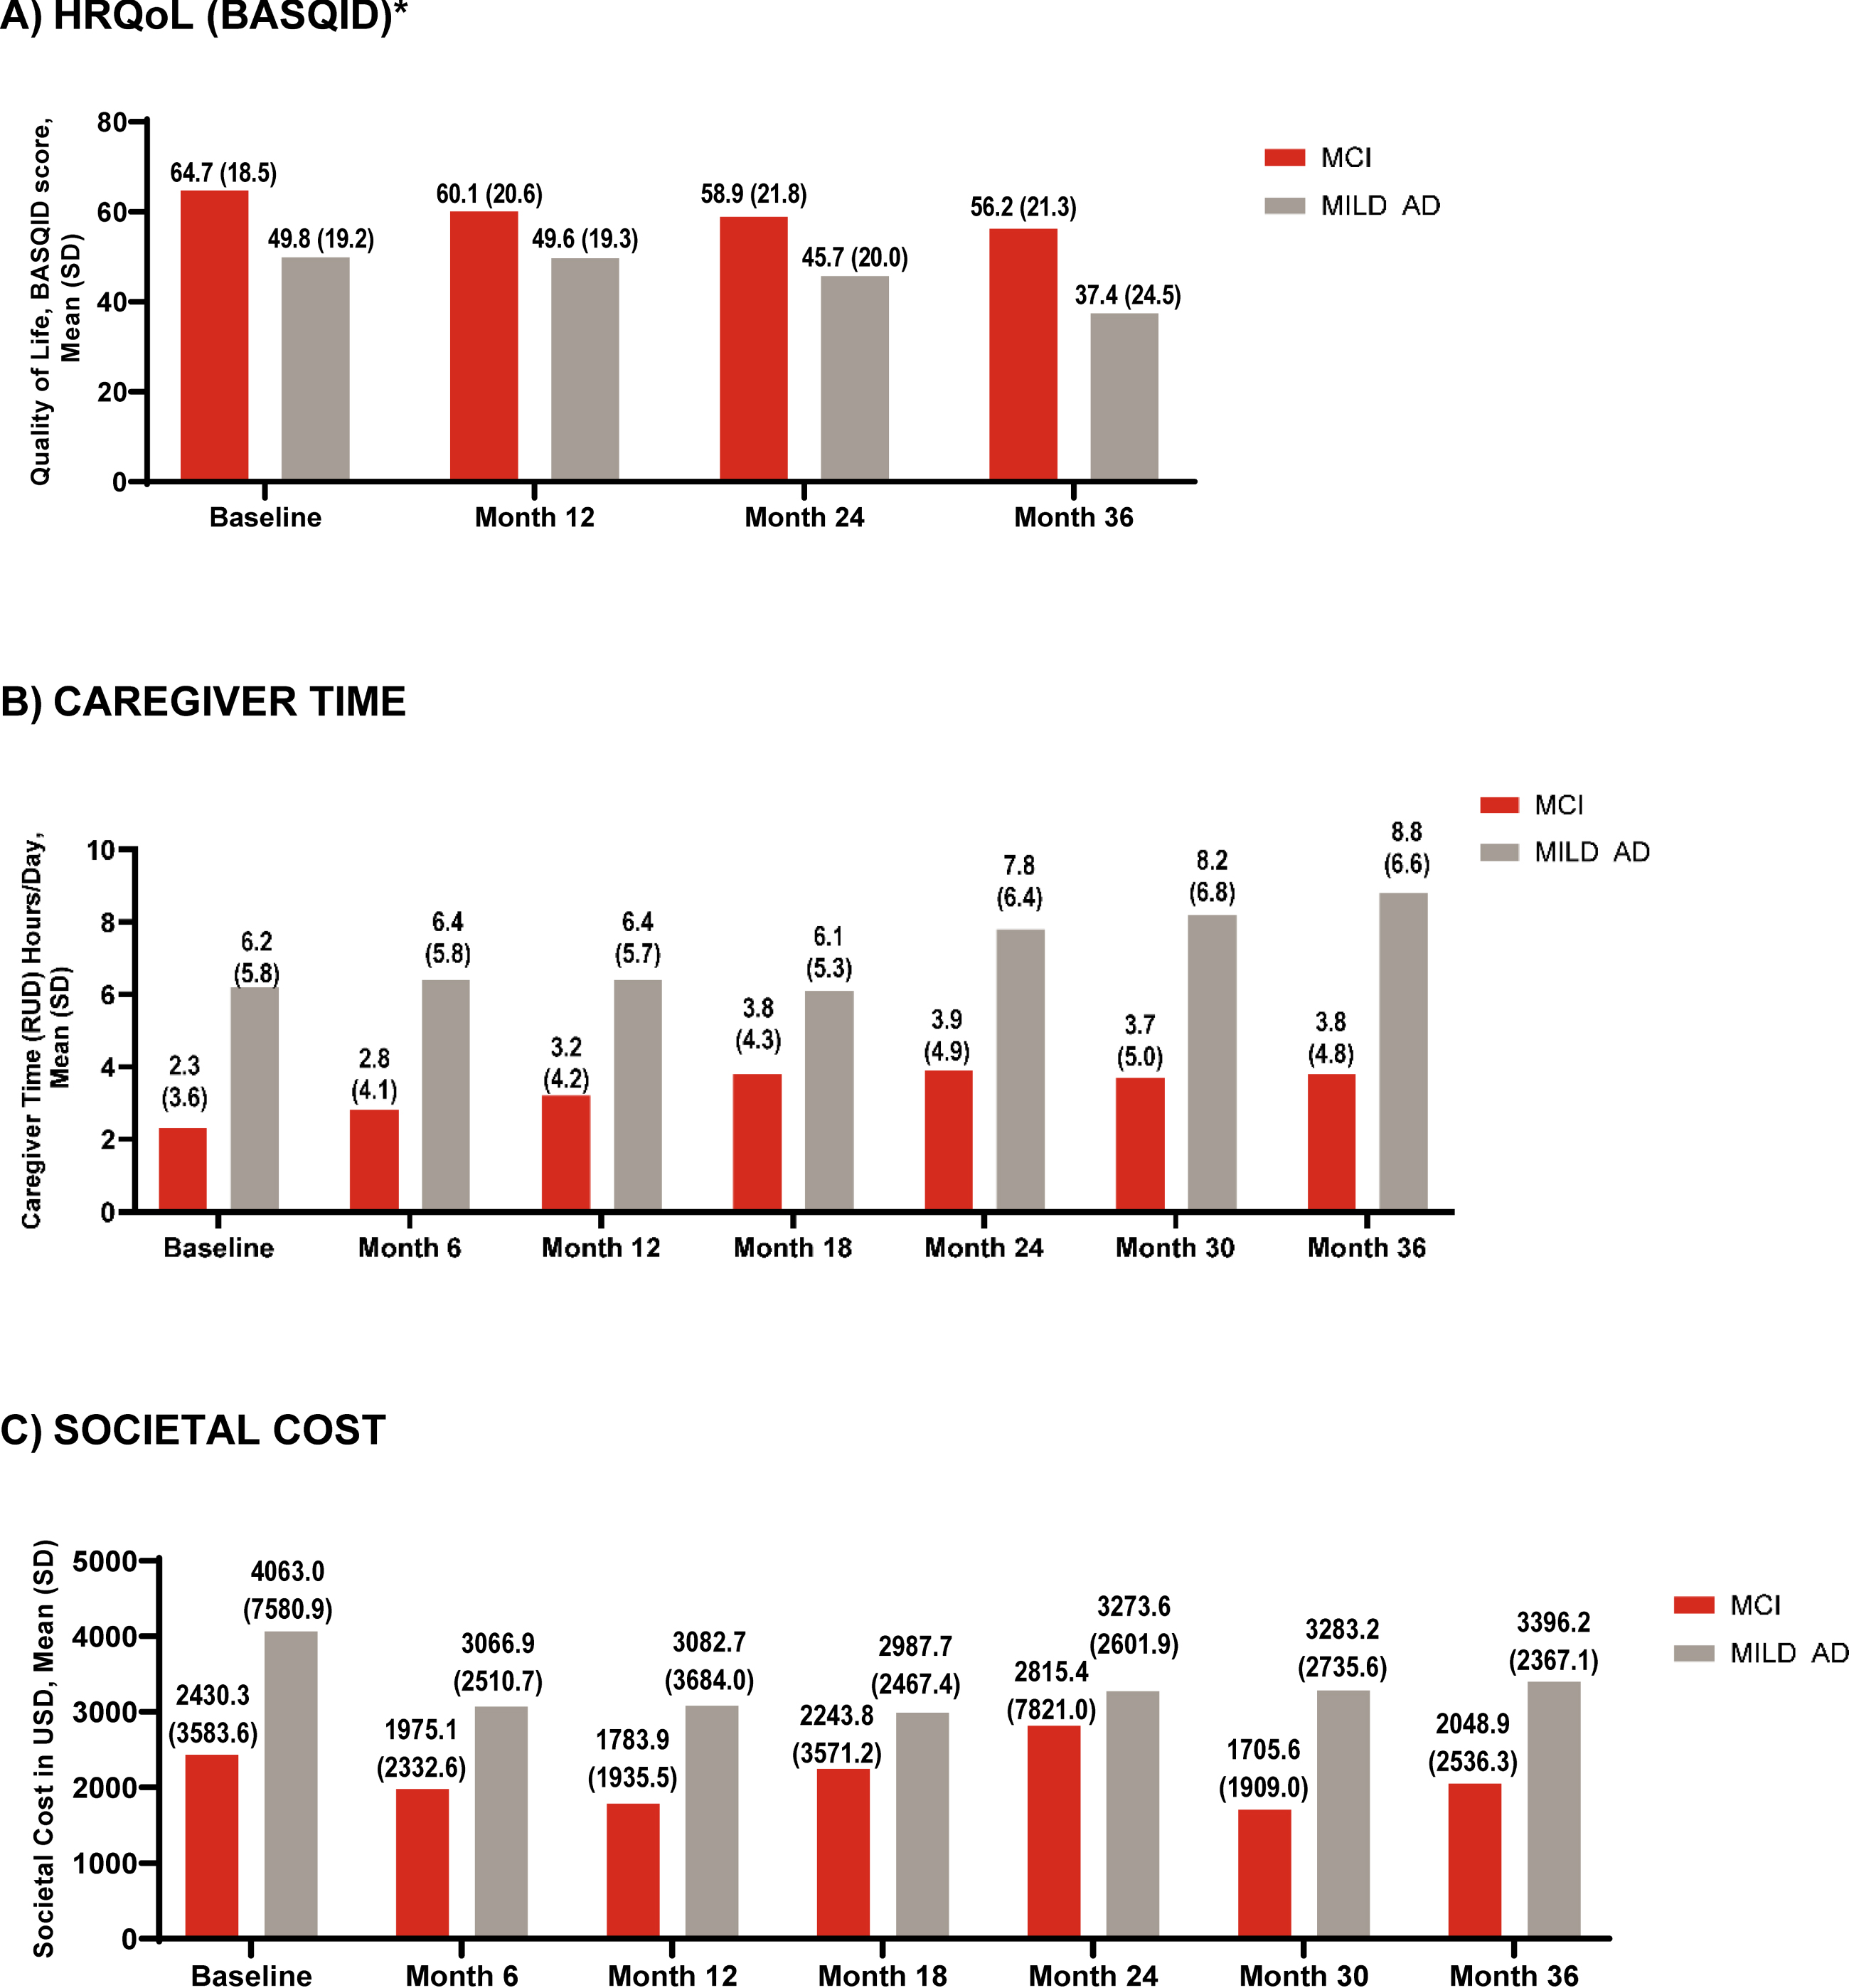
From baseline to 36 months, the mean (SD) BASQID score decreased in both groups (MCI: 64.7 [18.5] to 56.2 [21.3]); MILD AD: 49.8 [19.2] to 37.4 [24.5]) (Fig. 2A). When change from baseline to 36 months was analyzed using MMRM, the MCI group had a statistically similar decrease in QoL compared with the MILD AD group (LSMC [95% CI] BASQID score: –4.8 [–7.6, –2.0] versus –7.3 [–10.0, –4.5], LSMC difference at 36 months: –2.4 [–6.4, 1.5], p = 0.22) (Supplementary Figure 4).
Fig. 2
HRQoL (BASQID), caregiver time, and societal costs at baseline and 36 months. AD, Alzheimer’s disease; BASQID, Bath Assessment of Subjective Quality of Life in Dementia; HRQoL, health-related quality of life; MCI, mild cognitive impairment; MILD AD, mild dementia due to AD; RUD, Resource Utilization in Dementia questionnaire; SD, standard deviation; USS, United States dollar. *Scored from 0 to 100: higher scores indicate better QoL. Caregiver time capped at 540 hours/month.
Caregiver time: RUD
From baseline to 36 months, the mean (SD) total caregiver time in hours per day increased in both groups (MCI: 2.3 [3.6] hours/day to 3.8 [4.8] hours/day; MILD AD: 6.2 [5.8] hours/day to 8.8 [6.6]) (Fig. 2B). When the change from baseline to 36 months was analyzed using MMRM, the MCI group and MILD AD group had a similar increase in caregiver time (LSMC [95% CI] RUD, hours/day: 1.2 [0.5, 2.0] versus 1.0 [0.3, 1.8], LSMC difference at 36 months: 0.2 [–0.9, 1.3], p = 0.743).
Total societal costs: total, direct and indirect costs
At baseline, the total societal cost per month (mean [SD]) for the MCI and MILD AD groups was $2,430.3 (3,583.7) and $4,063.0 (7,580.9), respectively. At month 6, the total societal cost declined to $1,975.1 (2,332.6) for MCI and $3,066.9 (2,510.7) for MILD AD. Total societal costs became more stable from 6 to 18 months. From 6 months to 36 months, total societal costs in both groups increased modestly: to $2,048.9 (2,536.3) in MCI and $3,396.2 (2,367.1) in mild AD (Fig. 2C).
Impact of change in MMSE on outcomes
The LSMC (95% CI) in MMSE from baseline to 36 months was –2.1 (–2.9, –1.3) for MCI and –4.1 (–4.9, –3.4) for MILD AD, which was described as observed progression. Potential savings in HRQoL, total caregiver time, and total societal costs after slowing AD progression by up to 30% are presented in the following sections.
BASQID score
The mean (SD) baseline BASQID was 64.7 (18.5) for the MCI and 49.8 (19.2) for MILD AD groups (Table 1).
For the MCI group, the observed 2.1-point worsening in MMSE was associated with a decrease of 5.1 (95% CI, 3.6, 6.6) points in the BASQID score per patient at 36 months (equivalent to 7.9% [95% CI 5.5% 10.3%] worsening in HRQoL). Slowing AD progression by 30% could lessen the impact on HRQoL, with a 5.5% worsening on BASQID instead of 7.9% (Table 3, Fig. 3A).
Table 3
Potential improvements in HRQoL by slowing disease progression (as measured by MMSE)
| Outcome | Patient group | MMSE LSMC from baseline to 36 months | Coefficient of MMSE change from baseline to 36 months (SE) | % Change in BASQID from baseline to month 36 relative to baseline (95% CI) | Change in BASQID from baseline to month 36 (95% CI) | BASQID savings at month 36 compared with observed progression |
| BASQID score | MCI | –2.1 (observed progression) | 2.448 (0.370) | –7.9% (–10.3% –5.5%) | –5.111 (–6.642, –3.580) | NA |
| –1.7 (20% slowing) | –6.3% (–8.2% –4.4%) | –4.089 (–5.314, –2.864) | 1.022 | |||
| –1.6 (25% slowing) | –5.9% (–7.7% –4.2%) | –3.834 (–4.982, –2.685) | 1.278 | |||
| –1.5 (30% slowing) | –5.5% (–7.2% –3.9%) | –3.578 (–4.650, –2.506) | 1.533 | |||
| MILDAD | –4.1 (observed progression) | 1.589 (0.313) | –13.2% (–18.3% –8.0%) | –6.561 (–9.121, –4.002) | NA | |
| –3.3 (20% slowing) | –10.5 % (–14.7% –6.4%) | –5.249 (–7.297, –3.202) | 1.312 | |||
| –3.1 (25% slowing) | –9.9% (–13.7% –6.0%) | –4.921 (–6.841, –3.001) | 1.640 | |||
| –2.9 (30% slowing) | –9.2% (–12.8% –5.6%) | –4.593 (–6.385, –2.801) | 1.968 |
AD, Alzheimer’s disease; BASQID, Bath Assessment of Subjective QoL in Dementia; CI, confidence interval; HRQoL, health-related quality of life; LSMC, least squares mean change (from MMRM model); MMSE, Mini-Mental State Examination; MCI, mild cognitive impairment; MILD AD, mild dementia due to AD; NA, not applicable; SE, standard error. Patients with both MMSE and outcomes measured at baseline visit and 36 month visit (outcome analysis set) were included in the analyses (change from baseline to 36 months). The linear regression model was performed for change in BASQID from baseline to 36 months. Separate models were fitted for MCI and MILD AD, respectively. All models included baseline value, change in MMSE from baseline to 36 months, age, number of comorbidities, and study partner relationship.
Fig. 3
Potential slowing of HRQoL decline and savings in total caregiver time and total societal costs with slowing of disease progression over 36 months (by MMSE). AD, Alzheimer’s disease; BASQID, Bath Assessment of Subjective Quality of Life in Dementia; HRQoL, health-related quality of life; MCI, mild cognitive impairment; MILD AD, mild dementia due to AD; MMSE, Mini-Mental State Examination; RUD, Resource Utilization in Dementia questionnaire; vs, versus. All comparisons presented over 36 months are with natural progression. Caregiver time capped at 540 hours/month.
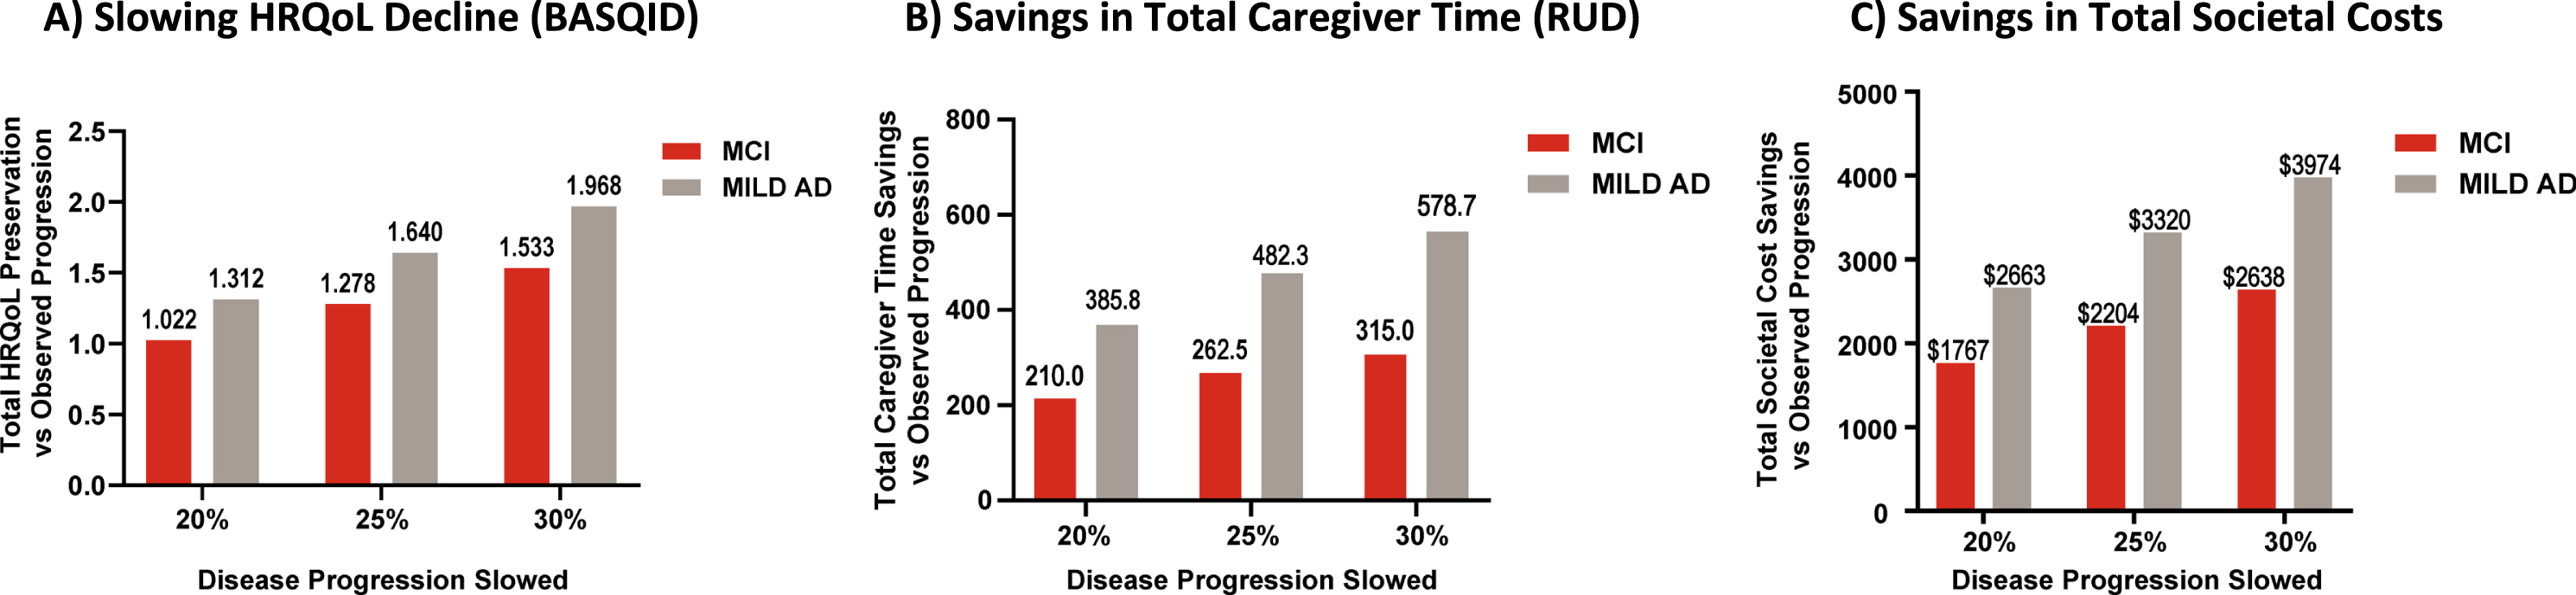
For the MILD AD group, the observed 4.1-point worsening in MMSE was associated with a decrease of 6.6 (95% CI, 4.0, 9.1) points in the BASQID score per patient at 36 months (equivalent to a 13.2% (95% CI, 8.0% 18.3%) worsening in HRQoL). Slowing AD progression by 30% could lessen the impact on HRQoL, with a 9.2% worsening on BASQID instead of 13.2% (Table 3, Fig. 3A).
We also present the results for slowing AD progression by 20% and 25% in Table 3 and Fig. 3A.
Total caregiver time
The mean (SD) total caregiver time over 36 months was 3,877 (3,703) hours for the MCI and 8,398 (5,554) hours for MILD AD groups.
For the MCI group, the observed 2.1-point worsening in MMSE was associated with an increase of 1,050 hours (95% CI, 740, 1,360) in total caregiver time per patient over 36 months, when compared with no disease progression (MMSE change from baseline to 36 months equal to 0). This was equivalent to a 27.1% (95% CI, 19.1% 35.1%) increase in total caregiver time. Slowing AD progression by 30% could result in a savings of 315 hours of caregiver time per patient: 735 hours [95% CI, 518, 952] for 30% slowing compared with 1,050 hours [95% CI, 740, 1,360] for observed disease progression.
For the MILD AD group, the observed 4.1-point worsening in MMSE was associated with an increase of 1,929 hours (95% CI, 1,271, 2,587) in total caregiver time per patient over 36 months. This was equivalent to a 23.0% (95% CI, 15.1% 30.8%) increase in total caregiver time. Slowing AD progression by 30% could result in a savings of 579 hours of caregiver time per patient: 1,350 hours [95% CI, 890, 1,811] for 30% slowing compared with 1,929 hours (95% CI, 1, 271, 2,587] observed disease progression (Table 4, Fig. 3B).
Table 4
Potential cost and caregiver time savings by slowing disease progression (as measured by MMSE)
| Outcome | Patient group | MMSE LSMC from baseline to 36 months | Coefficient of MMSE change from baseline to 36 months (SE) | % Increase in total outcome over 36 months relative to no progression (95% CI) | Increase in total outcome over 36 months relative to no progression (95% CI) | Total outcome savings over 36 months compared with observed progression |
| Total caregiver time (RUD) | MCI | –2.1 (observed progression) | –502.8(74.7) | 27.1% (19.1% 35.1%) | 1050.0 (740.3, 1359.6) | NA |
| –1.7 (20% slowing) | 21.7% (15.3% 28.1%) | 840.0 (592.3, 1087.7) | 210.0 | |||
| –1.6 (25% slowing) | 20.3% (14.3% 26.3%) | 787.5 (555.2, 1019.7) | 262.5 | |||
| –1.5 (30% slowing) | 19.0% (13.4% 24.6%) | 735.0 (518.2, 951.7) | 315.0 | |||
| MILD AD | –4.1 (observed progression) | –467.1 (80.4) | 23.0% (15.1% 30.8%) | 1929.1 (1271.0, 2587.1) | NA | |
| –3.3 (20% slowing) | 18.4% (12.1% 24.6% | 1543.2 (1016.8, 2069.7) | 385.8 | |||
| –3.1 (25% slowing) | 17.2% (11.4% 23.1%) | 1446.8 (953.2, 1940.3) | 482.3 | |||
| –2.9 (30% slowing) | 16.1% (10.6% 21.6%) | 1350.3 (889.7, 1811.0) | 578.7 | |||
| Total societal cost | MCI | –2.1 (observed progression) | –0.046 (0.019) | 10.2% (1.8% 19.3%) | $8,504 ($1,479, $16,108) | NA |
| –1.7 (20% slowing) | 8.1% (1.4% 15.2%) | $6,736 ($1181, $12,656) | $1,767 | |||
| –1.6 (25% slowing) | 7.5% (1.3% 14.1%) | $6,300 ($1107, $11,811) | $2,204 | |||
| –1.5 (30% slowing) | 7.0% (1.2% 13.1%) | $5,865 ($1,033, $10,974) | $2,638 | |||
| MILD AD | –4.1 (observed progression) | –0.024 (0.008) | 10.6% (4.0% 17.5%) | $12,795 ($4,881, $21,206) | NA | |
| –3.3 (20% slowing) | 8.4% (3.2% 13.8%) | $10,132 ($3,889, $16,687) | $2,663 | |||
| –3.1 (25% slowing) | 7.8% (3.0% 12.9%) | $9,475 ($3,643, $15,580) | $3,320 | |||
| –2.9 (30% slowing) | 7.3% (2.8% 11.9%) | $8,821 ($3,396, $14,481) | $3,974 |
AD, Alzheimer’s disease; CI, confidence interval; GLM, generalized linear model; LSMC, least squares mean change (from MMRM model); MMSE, Mini-Mental State Examination; MCI, mild cognitive impairment; MILD AD, mild dementia due to AD; NA, not applicable; RUD, Resource Utilization in Dementia questionnaire; SE, standard error. Patients with both MMSE and outcomes measured at baseline visit and 36 month visit (outcome analysis set) were included in the analyses (total over 36 months). The general linear model was performed for total caregiver time. The GLM with log link and gamma distribution was performed for total societal cost. Separate models were fitted for MCI and MILD AD, respectively. All models included baseline MMSE, change in MMSE from baseline to 36 months, age, number of comorbidities, and study partner relationship. Caregiver time capped at 540 hours/month.
We also present the results for slowing AD progression by 20% and 25% in Table 4 and Fig. 3B.
Total societal costs
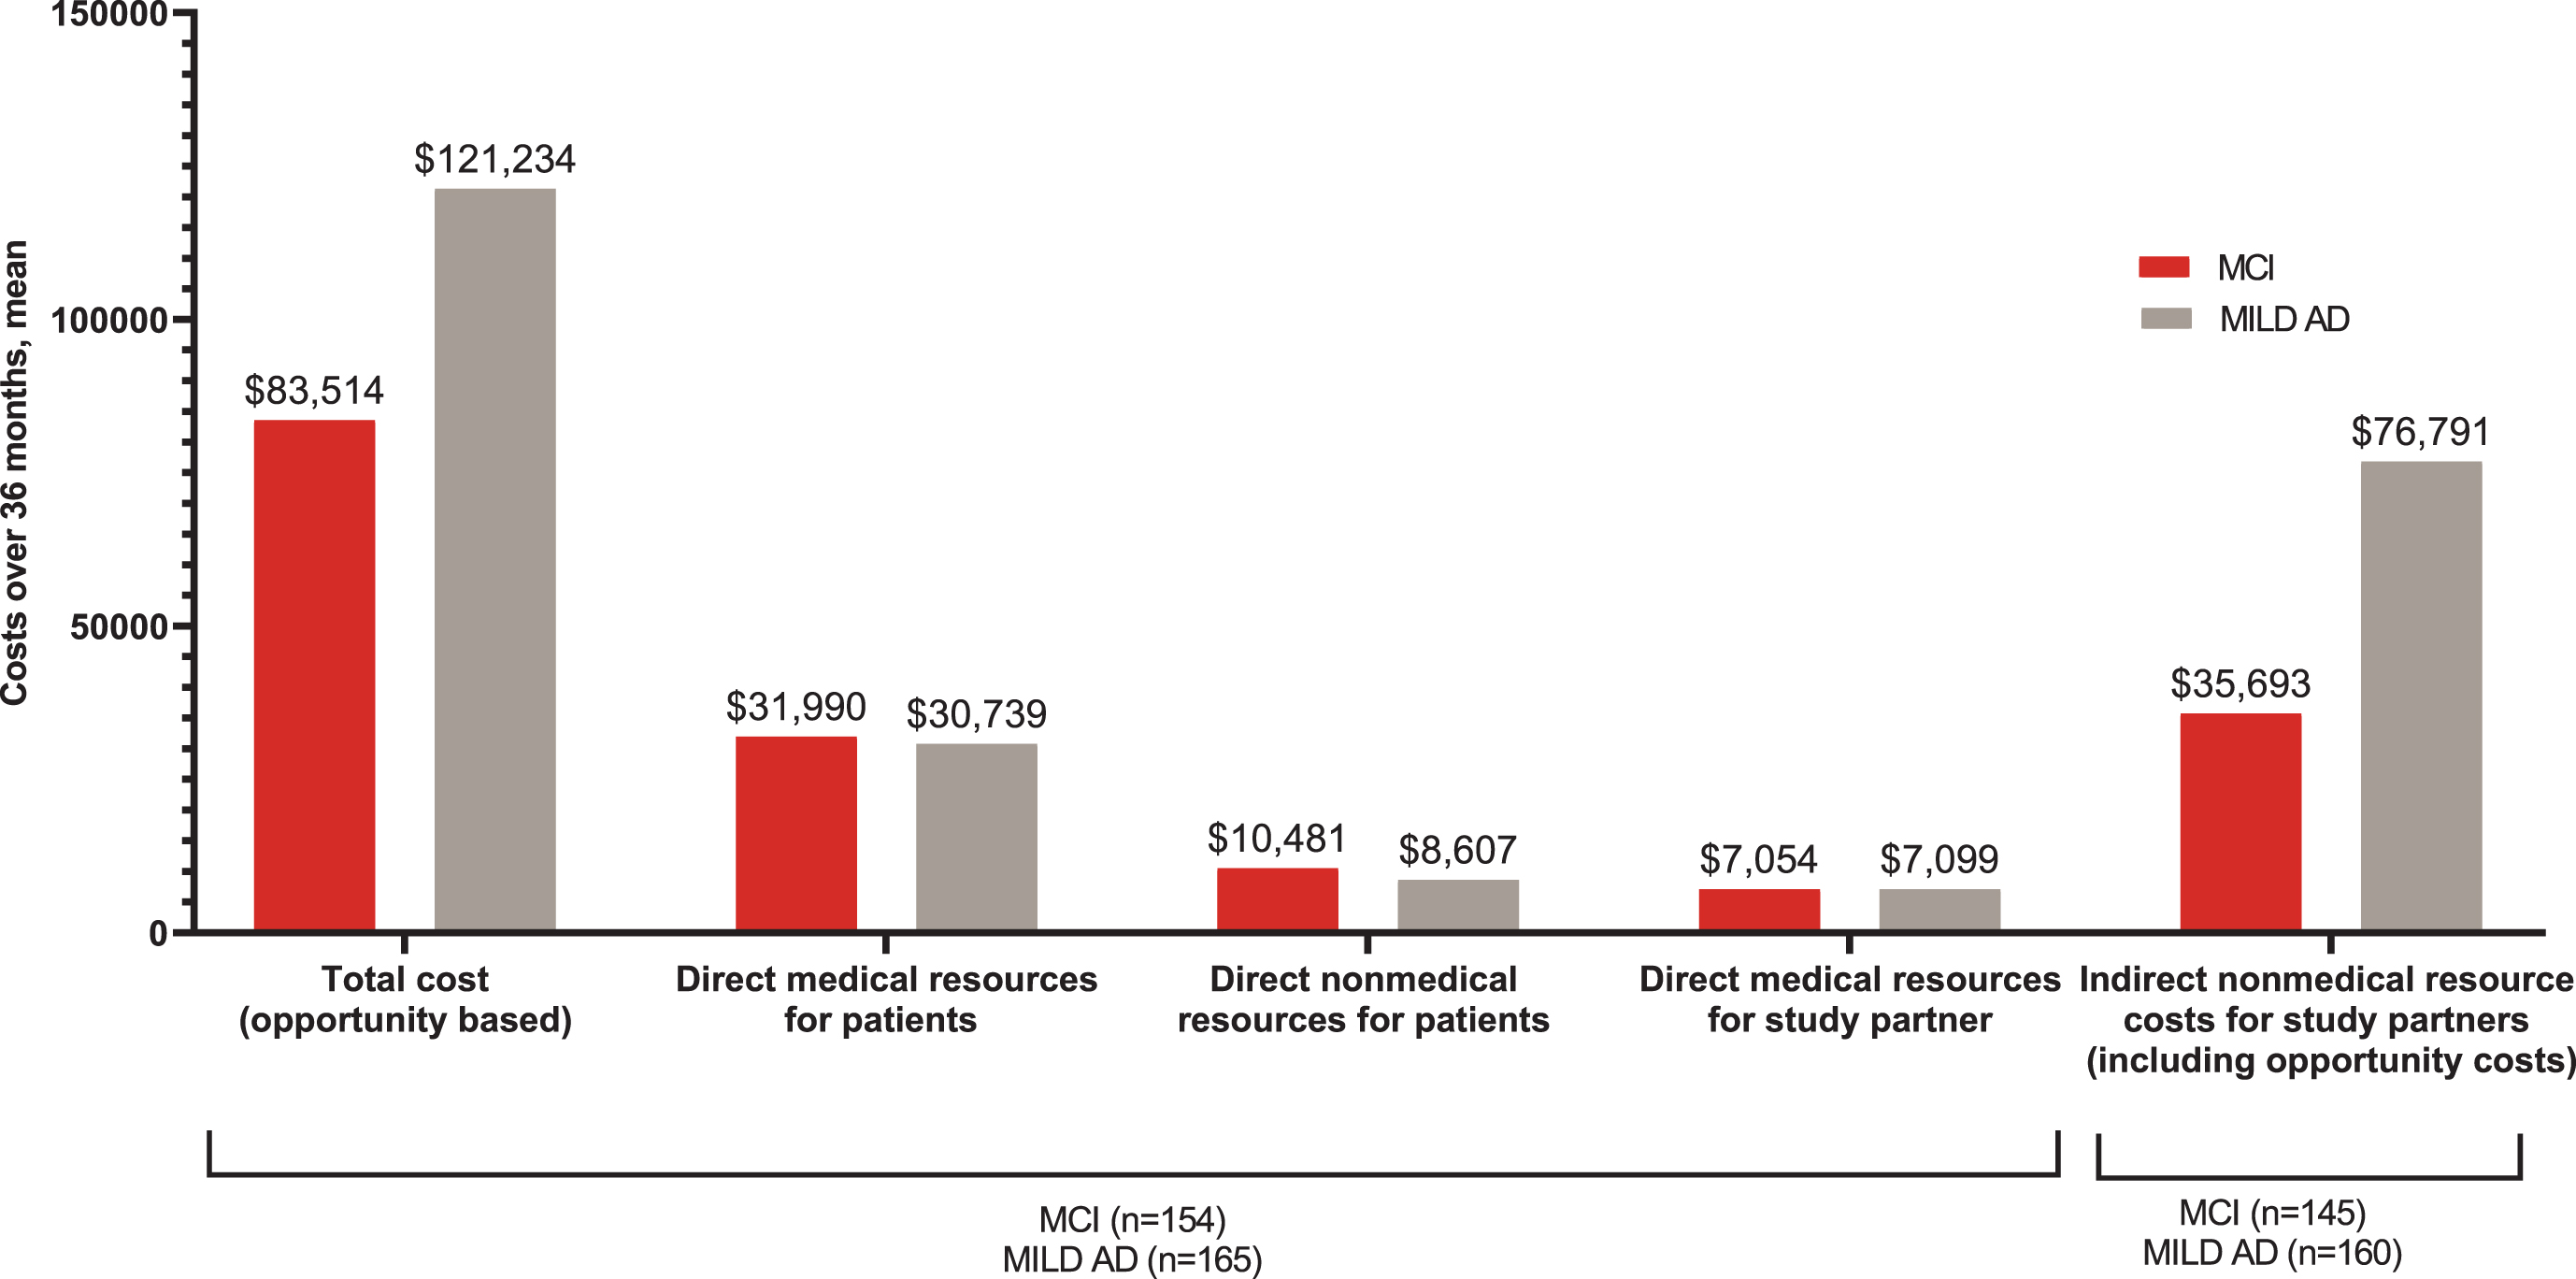
The mean (SD) total societal cost over 36 months was $83,514 ($70,208) for the MCI group and $121,234 ($63,742) for the MILD AD group (Fig. 4), which was largely driven by indirect non-medical costs incurred by study partners (MCI: $35,693, MILD AD: $76,791), followed by direct medical resources for patients (MCI: $31,990, MILD AD: $30,739) (Fig. 4).
Fig. 4
Mean total, direct, and indirect costs over 36 months. AD, Alzheimer’s disease; MCI, mild cognitive impairment; MILD AD, mild dementia due to AD; n, number of patients in the specified category. All costs are presented as “per patient cost over 36 months”. *p-value < 0.001 (t-test).
For the MCI group, the observed 2.1 points worsening in MMSE was associated with an increase of $8,504 (95% CI, $1,479, $16,108) in total societal costs per patient over 36 months. This was equivalent to a 10.2% (95% CI, 1.8% 19.3%) increase in total societal cost. Slowing AD progression by 30% could result in a savings of $2,638 in total societal cost per patient: $5,865 [95% CI, $1,033, $10,974] for 30% slowing compared with $8,504 [95% CI, $1,479, $16,108] for observed disease progression, or $2,796 per patient with the prices adjusted to year 2020.
For the MILD AD group, the observed 4.1 points worsening in MMSE was associated with an increase of $12,795 (95% CI, $4,881, $21,206) in total societal cost per patient over 36 months. This was equivalent to a 10.6% (95% CI, 4.0% 17.5%) increase in total societal cost. Slowing AD progression by 30% could result in a savings of $3,974 in total societal cost per patient: $8,821 [95% CI, $3,396, $14,481] for 30% slowing compared with $12,795 [95% CI, $4,881, $21,206] for observed disease progression, or $4,212 per patient with prices adjusted to year 2020 (Table 4, Fig. 3C).
We also present the results for slowing AD progression by 20% and 25% in Table 4 and Fig. 3C.
In the sensitivity analysis among participants with both MMSE and outcomes measured at baseline and month 36 (Supplementary Tables 3 and 4), the findings are largely consistent with those from the larger primary analysis sample. The estimated disease progression and the potential impact of slowing disease progression were slightly smaller compared to the primary analysis results.
DISCUSSION
This analysis of patients from the GERAS-US study population with amyloid-positive early symptomatic AD described the relationship between cognitive decline and measures of patients’ HRQoL, caregiver time, and societal costs. The findings of this study are important as they add to the available evidence from the GERAS-US study that reported an increase in the total societal costs and caregiver burden as the disease progresses over 36 months in an early symptomatic AD population [16]. The current study explored the estimated change in the HRQoL, total caregiver time, and total societal costs if disease progression were to be slowed down by 20% to 30%. This slowing in AD progression is similar to the degree of slowing reported in clinical studies for anti-amyloid therapies currently approved or in development for AD [7–12, 19, 20]. The consistent findings between the sensitivity analysis and the primary analysis, which was conducted on a larger sample, highlight the robustness of the results. The slower disease progression observed in participants in the outcome analysis set may explain the slightly smaller potential impact on health outcomes in the sensitivity analysis. Describing the impact of slowing disease progression in early symptomatic AD in terms of outcomes that are meaningful for patients, their caregivers and society in general, may help us to understand more holistically the benefits of a potential disease-modifying treatment.
Patients with symptomatic AD progress from early stages (MCI or MILD AD) to the later stages gradually over a period of years and develop greater symptom severity and dependence on others for care with each stage [4, 30]. At present, the focus of AD treatments is shifting from managing symptoms to targeted therapy aimed at slowing the progression of the disease [6]. Similar to what is reported in the literature regarding AD severity and decline in cognition [31], this cohort of patients with early symptomatic AD had a significant decline in cognition over 36 months as measured by the MMSE score. The cognitive decline at 36 months in the MILD AD group was significantly greater compared with the MCI group, indicating that the rate of cognitive decline accelerates as the disease advances. In the ICTUS, a multicenter cohort study, 52% 36% and 12% of patients had slow (≤1-point decrease in MMSE per year), intermediate (2 to 5 point decrease in MMSE per year) and rapid (≥6 point decrease in MMSE per year) cognitive decline, with higher cognitive dysfunction at baseline (ADAS-cog) strongly associated with intermediate and rapid cognitive decline [32].
This study describes that HRQoL declines and the need for caregiver hours increases over 36 months in patients with biomarker-confirmed early symptomatic AD. These findings are consistent with prior literature showing that HRQoL continues to deteriorate and caregiver burden increases with increasing disease severity in the later stages of disease [30, 33–35]. Of note, Mank et al. included patients with PET and/or biomarker-confirmed early symptomatic AD [30], similar to the current study [21]. We showed that slowing AD progression by 30% has the potential to slow decline in HRQoL, reduce the need for additional care partner hours, and allow the patient to maintain some independence in carrying out everyday activities longer, which are important treatment goals for patients with early AD [36].
AD progression also leads to increased societal costs, including direct (e.g., medical) and indirect (e.g., caregiver) costs [35, 37–44]. Factors associated with increasing costs include: symptom progression including neuropsychiatric symptoms, medical management of comorbidities, and increasing need for resources to perform everyday activities, including both formal services and informal care [16, 45, 46]. Direct caregiver medical costs (as mentioned in Supplementary Figure 3) can also contribute to total societal costs due to increase in caregiving time and associated stress for caregivers [47], which may potentially increase caregiver health costs. Caregiver time and stress may increase with progression of AD, leading to higher caregiver health costs especially in those who progress beyond the early stages [47]. A previous study in Ireland demonstrated that total costs related to AD and MCI are directly associated with patient dependence and function, where a 1-point improvement in patient functioning (on Disability Assessment for Dementia scale) reduced the total costs by €417 and a 1-point increase in dependence (on Dependence Scale) led to an increase in cost by €796 [46]. In the current study, there was an initial decline in total societal costs from baseline to 6 months, after which the mean total societal costs remained relatively stable through 36 months in both groups. The initial decline in costs was likely due to more efficient medical management following definitive diagnosis at baseline, as described in our previous study [26]. Overall, the costs in the MILD AD group remained higher than those in the MCI group. For the MCI and MILD AD groups, the observed disease progression led to increased total societal cost of $8,504 and $12,795, respectively, compared to those with no progression. Indirect non-medical resource costs for study partners (e.g., costs related to caregiver hours) contributed greatly to the total societal costs, especially in the MILD AD group. Compared with observed progression, slowing AD progression by 30% over 36 months could result in total societal cost savings in both MCI and MILD AD groups. This suggests that slowing disease progression could lower overall costs by reducing the need for additional caregiver time or loss for caregivers due to loss of work. Furthermore, this suggests that slowing AD progression in earlier stages where costs and caregiver burden are lower, could have greater impact in patients’ lives.
The early and accurate diagnosis of AD is important for appropriate care planning, including therapeutic intervention [36, 48]. Treatments that slow disease progression, especially in the early stages of AD, have the potential to provide more clinical benefit [9, 10, 19, 20, 49, 50] by preserving the patient’s cognitive and functional capabilities longer. This, in turn, could slow decline in patient HRQoL and result in potential savings in caregiver time and total societal costs.
Strengths and limitations
This study offers new insight into the potential impact of slowing disease progression on patient HRQoL, total caregiver time, and total societal costs in individuals with biomarker-confirmed early symptomatic AD under routine clinical care. Many prior cohort studies in the literature did not perform biomarker confirmation for amyloid status, and as a result, may include a mixed sample of patients with AD and non-AD dementias. Understanding the progression from the earliest stages of symptomatic, biomarker-confirmed AD will help characterize the potential impact of disease-modifying therapies when started in the earliest stages. Lastly, estimating potential savings in cost and caregiver hours based on slowing cognitive decline for both MCI and MILD AD groups provides important insights on the benefits of slowing AD progression.
Among the potential limitations of the study, relatively modest decline in cognition and ability to perform everyday activities in this cohort over 36 months could partly be due to the attrition of the sicker patient/caregiver dyads. Thus, the results may underestimate the actual decline in cognition that was experienced by the original baseline cohort. In addition, as the population consisted of patients with early AD enrolled in the GERAS-US study, the findings may not be generalizable to all patients with AD. We also observed larger-than-expected attrition during the COVID-19 pandemic during the last year of data collection, when many participants were homebound and unable to attend clinic visits. For those who remained in the study, data were collected remotely via a study partner, which led to missing data in the MMSE score and other in-person assessments. Early discontinuation, e.g., due to death in 3.2% of patients overall, may limit the generalizability of our findings, and result in failure to capture the cost of end-of-life care. For patients to be included in the analysis, we required that participants had both MMSE and outcomes measured at baseline and month 36 for the outcome analysis. This led to the exclusion of patients who discontinued the study, resulting in a smaller sample size and potentially underestimating the total caregiver time and cost, and overestimating HRQoL. Furthermore, the outcome analyses were carried out separately for MCI and MILD AD groups. This stratification reduced the sample size, which might lead to less stable estimates. In this study, 15.6% patients were working at baseline (20.4% in MCI and 11.1% in MILD AD), which may suggest that patient productivity loss costs are important; however, they were not captured as part of this study. Finally, our estimates of the impact of slowing disease progression are based on counterfactual predictions using observational data and should be confirmed in randomized studies for disease-modifying treatments.
Summary
The findings of this study showed decline in patient HRQoL and increase in total caregiver time and total societal costs in patients with biomarker-confirmed early symptomatic AD over 36 months. Based on modeled outcomes, slowing AD progression would be expected to result in less decline in HRQoL and savings in caregiver time as well as in total societal costs over 36 months. The use of therapies to slow AD progression in the early symptomatic stages offers patients the potential to preserve HRQoL and maintain independence in performing daily activities for longer periods of time, outcomes that are meaningful to patients, their caregivers, and society.
AUTHOR CONTRIBUTIONS
Julie M. Chandler (Conceptualization; Investigation; Methodology; Writing – review & editing; Final approval and accountability); Wenyu Ye (Methodology; Writing – review & editing; Interpretation of data, Final approval and accountability); Xiaojuan Mi (Data curation; Formal analysis; Writing – review & editing; Interpretation of data, Final approval and accountability); Erin G. Doty (Writing – review & editing; Interpretation of data, Final approval and accountability); Joseph A. Johnston (Writing – review & editing; Interpretation of data, Final approval and accountability).
ACKNOWLEDGMENTS
The authors thank the GERAS team, the study investigators, site personnel, patients, their families and study partners for their participation and support in this study. Karan Sharma and Keerthana Muthiah (employees of Eli Lilly Services India Private Limited) provided medical writing support under the guidance of the authors.
FUNDING
Eli Lilly and Company is the sole sponsor and funder for this study; the sponsor was responsible for the study design, data collection, data analysis, interpretation of data, and decision to publish the findings. Eli Lilly and Company also sponsored the medical writing support for the manuscript.
CONFLICT OF INTEREST
Julie M. Chandler, Wenyu Ye, Erin G. Doty, and Joseph A. Johnston are employees and minor stockholders of Eli Lilly and Company. Xiaojuan Mi is an employee of TechData Services Company, which is in contract with Eli Lilly and Company.
DATA AVAILABILITY
The data supporting the findings of this study are available on request from the corresponding author. The data are not publicly available due to privacy or ethical restrictions.
SUPPLEMENTARY MATERIAL
[1] The supplementary material is available in the electronic version of this article: https://dx.doi.org/10.3233/JAD-231166.
REFERENCES
[1] | ((2023) ) 2023 Alzheimer’s disease facts and figures. Alzheimers Dement 19: , 1598–1695. |
[2] | Jiaquan Xu SLM , Kenneth D. Kochanek , Elizabeth Arias ((2022) ) Mortality in the United States, 2021. NCHS Data Brief, 1–8. |
[3] | FDA’s Decision to Approve New Treatment for Alzheimer’s Disease. Available on. https://www.fda.gov/drugs/news-events-human-drugs/fdas-decision-approve-new-treatment-alzheimers-disease. Accessed on May 19, 2023. |
[4] | Jetsonen V , Kuvaja-Kollner V , Valimaki T , Selander T , Martikainen J , Koivisto AM ((2021) ) Total cost of care increases significantly from early to mild Alzheimer’s disease: 5-year ALSOVA follow-up. Age Ageing 50: , 2116–2122. |
[5] | Atri A ((2019) ) Current and future treatments in Alzheimer’s disease. Semin Neurol 39: , 227–240. |
[6] | Vaz M , Silvestre S ((2020) ) Alzheimer’s disease: Recent treatment strategies. Eur J Pharmacol 887: , 173554. |
[7] | Cummings J , Lee G , Zhong K , Fonseca J , Taghva K ((2021) ) Alzheimer’s disease drug development pipeline: 2021. Alzheimers Dement (N Y) 7: , e12179. |
[8] | Haeberlein SB , Gheuens S , Chen T , O’Gorman J , von Rosenstiel P , Chiao P , Wang G , von Hehn C , Skordos L , Hock C , Nitsch R , Sandrock ((2018) ) Aducanumab 36-month data from PRIME: A randomized, double-blind, placebo-controlled Phase 1b study in patients with prodromal or mild Alzheimer’s disease (S2.004). Neurology 90: (15_supplement), https://doi.org/10.1212/WNL.90.15_supplement.S2.004. |
[9] | Mintun MA , Lo AC , Duggan Evans C , Wessels AM , Ardayfio PA , Andersen SW , Shcherbinin S , Sparks J , Sims JR , Brys M , Apostolova LG , Salloway SP , Skovronsky DM ((2021) ) Donanemab in early Alzheimer’s disease. N Engl J Med 384: , 1691–1704. |
[10] | Sims JR , Zimmer JA , Evans CD , Lu M , Ardayfio P , Sparks J , Wessels AM , Shcherbinin S , Wang H , Monkul Nery ES , Collins EC , Solomon P , Salloway S , Apostolova LG , Hansson O , Ritchie C , Brooks DA , Mintun M , Skovronsky DM ; TRAILBLAZER-ALZ 2 Investigators ((2023) ) Donanemab in early symptomatic Alzheimer disease: The TRAILBLAZER-ALZ 2 randomized clinical trial. JAMA 330: , 512–527. |
[11] | Swanson CJ , Zhang Y , Dhadda S , Wang J , Kaplow J , Lai RYK , Lannfelt L , Bradley H , Rabe M , Koyama A , Reyderman L , Berry DA , Berry S , Gordon R , Kramer LD , Cummings JL ((2021) ) A randomized, double-blind, phase 2b proof-of-concept clinical trial in early Alzheimer’s disease with lecanemab, an anti-Abeta protofibril antibody. Alzheimers Res Ther 13: , 80. |
[12] | Klein G , Delmar P , Voyle N , Rehal S , Hofmann C , Abi-Saab D , Andjelkovic M , Ristic S , Wang G , Bateman R , Kerchner GA , Baudler M , Fontoura P , Doody R ((2019) ) Gantenerumab reduces amyloid-beta plaques in patients with prodromal to moderate Alzheimer’s disease: A PET substudy interim analysis. Alzheimers Res Ther 11: , 101. |
[13] | FDA Grants Accelerated Approval for Alzheimer’s Drug. Available https://www.fda.gov/news-events/press-announcements/fda-grants-accelerated-approval-alzheimers-drug. Accessed on September 15, 2022. |
[14] | FDA Grants Accelerated Approval for Alzheimer’s Disease Treatment. Available on https://www.fda.gov/news-events/press-announcements/fda-grants-accelerated-approval-alzheimers-disease-treatment. Accessed on May 19, 2023. |
[15] | Zhu CW , Sano M ((2024) ) Meaningful benefit of disease modifying treatment: Evaluating changes in health related resource use. Alzheimers Dement (N Y). |
[16] | Robinson RL , Rentz DM , Andrews JS , Zagar A , Kim Y , Bruemmer V , Schwartz RL , Ye W , Fillit HM ((2020) ) Costs of early stage Alzheimer’s disease in the United States: Cross-sectional analysis of a prospective cohort study (GERAS-US). J Alzheimers Dis 75: , 437–450. |
[17] | Herring WL , Gould IG , Fillit H , Lindgren P , Forrestal F , Thompson R , Pemberton-Ross P ((2021) ) Predicted lifetime health outcomes for aducanumab in patients with early Alzheimer’s disease. Neurol Ther 10: , 919–940. |
[18] | Tahami Monfared AA , Tafazzoli A , Ye W , Chavan A , Zhang Q ((2022) ) Long-term health outcomes of lecanemab in patients with early Alzheimer’s disease using simulation modeling. Neurol Ther 11: , 863–880. |
[19] | van Dyck CH , Swanson CJ , Aisen P , Bateman RJ , Chen C , Gee M , Kanekiyo M , Li D , Reyderman L , Cohen S , Froelich L , Katayama S , Sabbagh M , Vellas B , Watson D , Dhadda S , Irizarry M , Kramer LD , Iwatsubo T ((2023) ) Lecanemab in early Alzheimer’s disease. N Engl J Med 388: , 9–21. |
[20] | Budd Haeberlein S , Aisen PS , Barkhof F , Chalkias S , Chen T , Cohen S , Dent G , Hansson O , Harrison K , von Hehn C , Iwatsubo T , Mallinckrodt C , Mummery CJ , Muralidharan KK , Nestorov I , Nisenbaum L , Rajagovindan R , Skordos L , Tian Y , van Dyck CH , Vellas B , Wu S , Zhu Y , Sandrock A ((2022) ) Two randomized phase 3 studies of Aducanumab in early Alzheimer’s disease. J Prev Alzheimers Dis 9: , 197–210. |
[21] | Robinson RL , Rentz DM , Bruemmer V , Scott Andrews J , Zagar A , Kim Y , Schwartz RL , Ye W , Fillit HM ((2019) ) Observation of patient and caregiver burden associated with early Alzheimer’s disease in the United States: Design and baseline findings of the GERAS-US cohort study. J Alzheimers Dis 72: , 279–292. |
[22] | Teng E , Becker BW , Woo E , Knopman DS , Cummings JL , Lu PH ((2010) ) Utility of the functional activities questionnaire for distinguishing mild cognitive impairment from very mild Alzheimer disease. Alzheimer Dis Assoc Disord 24: , 348–353. |
[23] | Folstein MF , Folstein SE , McHugh PR ((1975) ) “Mini-mental state”. A practical method for grading the cognitive state of patients for the clinician. J Psychiatr Res 12: , 189–198. |
[24] | Trigg R , Skevington SM , Jones RW ((2007) ) How can we best assess the quality of life of people with dementia? the Bath Assessment of Subjective Quality of Life in Dementia (BASQID). Gerontologist 47: , 789–797. |
[25] | Wimo A , Gustavsson A , Jonsson L , Winblad B , Hsu MA , Gannon B ((2013) ) Application of Resource Utilization in Dementia (RUD) instrument in a global setting. Alzheimers Dement 9: , 429–435.e417. |
[26] | Chandler JM , Rentz DM , Zagar A , Kim Y , Schwartz RL , Fillit H ((2023) ) Disease progression and costs at the 3-year follow-up of the GERAS-US study. Alzheimers Dement (Amst) 15: , e12430. |
[27] | Lenox-Smith A , Reed C , Lebrec J , Belger M , Jones RW ((2018) ) Potential cost savings to be made by slowing cognitive decline in mild Alzheimer’s disease dementia using a model derived from the UK GERAS observational study. BMC Geriatr 18: , 57. |
[28] | Lenox-Smith A , Reed C , Lebrec J , Belger M , Jones RW ((2016) ) Resource utilisation, costs and clinical outcomes in non-institutionalised patients with Alzheimer’s disease: 18-month UK results from the GERAS observational study. BMC Geriatr 16: , 195. |
[29] | U.S. Bureau of Statistics. CPI Inflation Calculator. Available on https://www.bls.gov/data/inflation_calculator.htm. Accessed on 18 Dec 2023. |
[30] | Mank A , Rijnhart JJM , van Maurik IS , Jonsson L , Handels R , Bakker ED , Teunissen CE , van Berckel BNM , van Harten AC , Berkhof J , van der Flier WM ((2022) ) A longitudinal study on quality of life along the spectrum of Alzheimer’s disease. Alzheimers Res Ther 14: , 132. |
[31] | Davis M , T OC , Johnson S , Cline S , Merikle E , Martenyi F , Simpson K ((2018) ) Estimating Alzheimer’s disease progression rates from normal cognition through mild cognitive impairment and stages of dementia. Curr Alzheimer Res 15: , 777–788. |
[32] | Canevelli M , Kelaiditi E , Del Campo N , Bruno G , Vellas B , Cesari M , ICTUSDSA group ((2016) ) Predicting the rate of cognitive decline in Alzheimer disease: Data from the ICTUS Study. Alzheimer Dis Assoc Disord 30: , 237–242. |
[33] | Froelich L , Llado A , Khandker RK , Pedros M , Black CM , Sanchez Diaz EJ , Chekani F , Ambegaonkar B ((2021) ) Quality of life and caregiver burden of Alzheimer’s disease among community dwelling patients in Europe: Variation by disease severity and progression. J Alzheimers Dis Rep 5: , 791–804. |
[34] | Ashizawa T , Igarashi A , Sakata Y , Azuma M , Fujimoto K , Kobayashi T , Takase Y , Ikeda S ((2021) ) Impact of the severity of Alzheimer’s disease on the quality of life, activities of daily living, and caregiving costs for institutionalized patients on anti-Alzheimer medications in Japan. J Alzheimers Dis 81: , 367–374. |
[35] | Dauphinot V , Potashman M , Levitchi-Benea M , Su R , Rubino I , Krolak-Salmon P ((2022) ) Economic and caregiver impact of Alzheimer’s disease across the disease spectrum: A cohort study. Alzheimers Res Ther 14: , 34. |
[36] | Porsteinsson AP , Isaacson RS , Knox S , Sabbagh MN , Rubino I ((2021) ) Diagnosis of early Alzheimer’s disease: Clinical practice in 2021. J Prev Alzheimers Dis 8: , 371–386. |
[37] | Kannan H , Bolge SC , Del Valle M , Alvir J , Petrie CD ((2011) ) The association between Alzheimer’s disease symptom severity and caregiver outcomes: A cross-sectional study. Prim Care Companion CNS Disord 13: , PCC.10m01043. |
[38] | Shin JY , Habermann B ((2022) ) Caregivers of adults living with Alzheimer’s disease or dementia in 2020: A secondary analysis. J Gerontol Nurs 48: , 15–25. |
[39] | Maresova P , Dolejs J , Mohelska H , Bryan LK ((2019) ) Cost of treatment and care for people with Alzheimer’s disease: A meta-analysis. Curr Alzheimer Res 16: , 1245–1253. |
[40] | Geldmacher DS , Kirson NY , Birnbaum HG , Eapen S , Kantor E , Cummings AK , Joish VN ((2013) ) Pre-diagnosis excess acute care costs in Alzheimer’s patients among a US Medicaid population. Appl Health Econ Health Policy 11: , 407–413. |
[41] | Lin PJ , Zhong Y , Fillit HM , Chen E , Neumann PJ ((2016) ) Medicare expenditures of individuals with Alzheimer’s disease and related dementias or mild cognitive impairment before and after diagnosis. J Am Geriatr Soc 64: , 1549–1557. |
[42] | Nair R , Haynes VS , Siadaty M , Patel NC , Fleisher AS , Van Amerongen D , Witte MM , Downing AM , Fernandez LAH , Saundankar V , Ball DE ((2018) ) Retrospective assessment of patient characteristics and healthcare costs prior to a diagnosis of Alzheimer’s disease in an administrative claims database. BMC Geriatr 18: , 243. |
[43] | Taipale H , Purhonen M , Tolppanen AM , Tanskanen A , Tiihonen J , Hartikainen S ((2016) ) Hospital care and drug costs from five years before until two years after the diagnosis of Alzheimer’s disease in a Finnish nationwide cohort. Scand J Public Health 44: , 150–158. |
[44] | Desai U , Kirson NY , Ye W , Mehta NR , Wen J , Andrews JS ((2019) ) Trends in health service use and potentially avoidable hospitalizations before Alzheimer’s disease diagnosis: A matched, retrospective study of US Medicare beneficiaries. Alzheimers Dement (Amst) 11: , 125–135. |
[45] | Leibson CL , Long KH , Ransom JE , Roberts RO , Hass SL , Duhig AM , Smith CY , Emerson JA , Pankratz VS , Petersen RC ((2015) ) Direct medical costs and source of cost differences across the spectrum of cognitive decline: A population-based study. Alzheimers Dement 11: , 917–932. |
[46] | Gillespie P , O’Shea E , Cullinan J , Lacey L , Gallagher D , Ni Mhaolain A , B. Lawlor for the Enhancing Care in Alzheimer's Disease (ECAD) Study Team ((2013) ) The effects of dependence and function on costs of care for Alzheimer’s disease and mild cognitive impairment in Ireland. Int J Geriatr Psychiatry 28: , 256–264. |
[47] | Vu M , Mangal R , Stead T , Lopez-Ortiz C , Ganti L ((2022) ) Impact of Alzheimer’s disease on caregivers in the United States. Health Psychol Res 10: , 37454. |
[48] | Nelson L , Tabet N ((2015) ) Slowing the progression of Alzheimer’s disease; what works? Ageing Res Rev 23: , 193–209. |
[49] | Aisen PS , Jimenez-Maggiora GA , Rafii MS , Walter S , Raman R ((2022) ) Early-stage Alzheimer disease: Getting trial-ready. Nat Rev Neurol 18: , 389–399. |
[50] | Hampel H , Au R , Mattke S , van der Flier WM , Aisen P , Apostolova L , Chen C , Cho M , De Santi S , Gao P , Iwata A , Kurzman R , Saykin AJ , Teipel S , Vellas B , Vergallo A , Wang H , Cummings J ((2022) ) Designing the next-generation clinical care pathway for Alzheimer’s disease. Nat Aging 2: , 692–703. |


