
Clusterization of Behavioral and Psychological Symptoms of Dementia as Assessed by Neuropsychiatric Inventory: A Case Against the Use of Principal Component Analysis
Abstract
Background:
The term Behavioral and Psychological Symptoms of Dementia (BPSD) covers a group of phenomenologically and medically distinct symptoms that rarely occur in isolation. Their therapy represents a major unmet medical need across dementias of different types, including Alzheimer’s disease. Understanding of the symptom occurrence and their clusterization can inform clinical drug development and use of existing and future BPSD treatments.
Objective:
The primary aim of the present study was to investigate the ability of a commonly used principal component analysis to identify BPSD patterns as assessed by Neuropsychiatric Inventory (NPI).
Methods:
NPI scores from the Aging, Demographics, and Memory Study (ADAMS) were used to characterize reported occurrence of individual symptoms and their combinations. Based on this information, we have designed and conducted a simulation experiment to compare Principal Component analysis (PCA) and zero-inflated PCA (ZI PCA) by their ability to reveal true symptom associations.
Results:
Exploratory analysis of the ADAMS database revealed overlapping multivariate distributions of NPI symptom scores. Simulation experiments have indicated that PCA and ZI PCA cannot handle data with multiple overlapping patterns. Although the principal component analysis approach is commonly applied to NPI scores, it is at risk to reveal BPSD clusters that are a statistical phenomenon rather than symptom associations occurring in clinical practice.
Conclusions:
We recommend the thorough characterization of multivariate distributions before subjecting any dataset to Principal Component Analysis.
INTRODUCTION
Behavioral and Psychiatric Symptoms in Dementia (BPSD) are the main source of caregiver burden and a key driver behind emergency room visits and institutionalization of people with dementia including Alzheimer’s disease [1–4]. Current symptomatic therapies of Alzheimer’s disease (cholinesterase inhibitors and memantine) have limited impact on BPSD [1–3]. Mostly off-label use of other drugs (antipsychotics, antidepressants, benzodiazepines) can produce adverse effects that are particularly undesirable in this frail patient population [1–3] resulting in initiatives to reduce their prescription [5]. Thus, it is imperative to develop and introduce novel safe and effective therapies to better address the needs of both, people living with dementia with BPSD and their caregivers.
However, therapeutic progress is predicated on understanding the clinical phenomenology of BPSD. Based on their clinical presentation, BPSD cover a broad and fairly heterogeneous group of symptoms. One of the most commonly used clinical instruments to study BPSD, the Neuropsychiatric Inventory, recognizes 10 (10-item NPI) or 12 (12-item NPI) symptoms [6, 7]. Patients rarely display all of the symptoms at once or even during the disease course. It is believed that people with dementia mostly present small individual clusters of symptoms [8]. High dimensionality of NPI items makes visualization difficult, limits simple exploration of the data, and requires application of statistical methods to reveal clusters of symptoms.
Principal component analysis (PCA) is the most widely used instrument to study the associations of different NPI items [8–15]. In simple terms, PCA is a dimensionality-reduction method capable of transforming a large set of variables into a smaller set that still contains most of the information in the large set. For example, PCA was used to reduce 12 items of NPI to five factors: 1 - delusions, hallucinations, and sleep abnormalities; 2 - agitation, irritability, and aberrant motor behavior; 3 - depression, anxiety, and apathy; 4 - euphoria and disinhibition; 5 - appetite and eating disorders [15].
In most, if not all, research publications describing associations of NPI items, choice of the PCA is not explained and utility of this tool for analysis of multivariate distributions of NPI scores is not discussed (see Supplementary Material 3 for a full list of such publications). The primary aim of our study was to investigate the ability of PCA to reveal such associations. Our study is the first attempt to evaluate suitability of PCA to characterize occurrence of BPSD when studied using NPI. To that end, we designed a simulation experiment to compare the ability of PCA (or zero-inflated PCA) to reveal symptom associations of different complexity that were found in a publicly available set of epidemiological data (ADAMS).
MATERIALS AND METHODS
ADAMS data analysis
We were granted access to the database of the Aging, Demographics, and Memory Study (ADAMS). The ADAMS is a supplement to the Health and Retirement Study (HRS) that is sponsored by the National Institute on Aging (U01-AG009740) and performed by the University of Michigan with the specific aim of conducting a population-based study of dementia (http://hrsonline.isr.umich.edu). The HRS is an ongoing biennial longitudinal survey of a nationally representative cohort of more than 20,000 U.S. adults aged 51 and older who reside in the community and in nursing homes throughout the 48 contiguous United States [16]. The ADAMS sample was a stratified random subsample of 1,770 individuals aged 71 years and older from five cognitive strata based on scores for the 35-point HRS cognitive scale [17] or proxy assessments of cognition from the 2000 or 2002 waves of the HRS [18]. The ADAMS further stratified the three highest cognitive strata according to age and gender to ensure adequate numbers in each subgroup [18]. Full details of the ADAMS sample design and selection procedures are described elsewhere [18–20].
The initial assessments of the ADAMS subjects (Wave A) took place between July 2001 and December 2003 on average 13.3 (standard deviation 6.9) months after the most recent HRS interview. Wave A assessments were completed for 856 subjects, representing a 56% response rate among non-deceased sample members [18]. Three follow-up waves (B, C, D) were conducted in the next decade. A population of subjects with no missing NPI values and at least one BPSD was used for PCA as described by Hellton et al. (2021) and other authors [9, 21, 22]. Wave A contained 317 subjects with at least one BPSD assessed by the NPI (after removal of the subjects with missing values), this number was considered sufficient to conduct multivariate analysis. The follow-up waves B, C, and D were not analyzed because they contained only 61, 73, and 36 subjects, respectively, with at least one BPSD assessed by the NPI.
Neuropsychiatric Inventory (NPI)
The NPI is a widely used measure of neuropsychiatric symptoms in dementia [6]. In its initial form (as used for the ADAMS data collection), the NPI covered information on BPSD during the past month across 10 items—delusions, hallucinations, agitation, depression, anxiety, elation, apathy, disinhibition, irritability, and aberrant motor behaviors—using a structured interview with a knowledgeable informant. For each symptom reported by the informant, additional information is obtained on the frequency (4-point scale), severity (3-point scale), and caregiver distress (6-point scale) associated with the rated behavior or symptom. Psychometric properties of the NPI have been previously reported [6, 23]. The NPI has been validated and shown to have good reliability; Cronbach alpha was 0.88 for internal consistency reliability [6].
In the majority of publications presenting NPI scores, product NPI scores are calculated as BPSD frequency for the last month (rated from 0 to 4) multiplied by BPSD severity (rated from 1 to 3). The possible values of product scores are therefore 0-1-2-3-4-6-8-9-12. Hellton et al. (2021) pointed out some weaknesses of ordinary PCA of NPI scores since their marginal univariate distributions are zero inflated and proposed to conduct PCA on correlation matrix based on zero-inflated bivariate Poisson distribution [8].
To mimic the Poisson distribution more closely, Hellton et al. replaced product scores with sum scores calculated as sums of BPSD frequency and severity. Adding frequency and severity yields a scale of 0-2-3-4-5-6-7, as frequency and severity are only scored if screening questions indicate that the NPI item is present, generating a minimum sum of 2 [8]. In order to avoid gaps in the possible values, Hellton et al. proposed to subtract 1 from the sum that is above zero arriving at an integer scale of 0-1-2-3-4-5-6.
For presentation purposes, BPSD were abbreviated as: DELU – delusions, HALL - hallucinations, AGIT – agitation/aggression, DEPR – depression/dysphoria, APAT – apathy/indifference, ELAT – elation/euphoria, ANXI - anxiety, DISI - disinhibition, IRRI – irritability/lability, ABER – aberrant motor behavior.
Statistical analysis methods
NPI product and sum scores (empirical or simulated) for the 10 NPI items were analyzed using PCA and zero-inflated (ZI) PCA.
As in the majority of the previous publications, we used PCA on correlation matrix of product NPI scores with varimax rotation of loadings and a threshold for loadings≥0.30 (see Supplementary Material 3). BPSD with loadings equal or greater than the threshold in a component were considered associated. Also, according to Hellton et al. (2021), we used ZI PCA on correlation matrix of sum NPI scores with promax rotation of loadings and a threshold for loadings≥0.40 [8]. For both analyzes, the Guttman-Kaiser criterion (the number of eigenvalues greater than one) served as a measure of optimal number of principal components [24].
We refer the readers to Hellton et al. (2021) and Supplementary Material 1 for detailed explanation of the PCA and ZI PCA.
PCA, varimax and promax rotations were performed using the “prcomp”, “varimax” and “promax” functions in the R base “Stats” package (version 3.6.3) [25]. ZI PCA was done according to the procedure described by Hellton et al. (2021) [8].
Overall study design
Analysis was done in two steps: i) visual examination of distribution of ADAMS NPI scores using bivariate plots, followed by ii) simulations with predefined associations of BPSD to assess the efficacy of PCA in retrieving these patterns.
Simulation experiment
The R package “GenOrd” for the stochastic simulation of discrete variables with assigned marginal distributions and correlation matrix was used [26].
Ten “symptoms” in the simulation (called “Symptom A” to “Symptom J”) corresponded to ten BPSD items in the NPI. We introduced “signal” and “noise” symptoms. Signals were simulated with support points 0-1-2-3-4-6-8-9-12 for product scores or 0-1-2-3-4-5-6 for sum scores. Noise had two support points 0–1. Marginal probability for zero support point was set to 0.5 for signals and 0.9 for noise. The remaining probability was distributed equally between non-zero support points. A combination of signal and noise symptoms within a subject constituted a “pattern”. Pearson’s correlation between all signals in a pattern was set to 0.90. Noise symptoms were uncorrelated.
We used four predefined patterns in our simulation. Each pattern was simulated with 30 subjects, then the subjects were combined into a dataset (120 subjects); a total of 1000 such datasets were simulated for product scores and another 1000 datasets were simulated for sum scores. Thus, each dataset represented a finite mixture distribution that consisted of four sub-populations (or clusters of subjects), each defined by its pattern of symptoms. PCA and ZI PCA were then applied to retrieve the original patterns.
We further describe the notation used to discuss the results of the simulation. Patterns that consisted of one signal and nine noise symptoms were called “mono-symptoms”, patterns that contained two or more signals were called “symptom associations”. We also used a symbolic notation {“A”, ... ,“J”} to describe a set of signals in a pattern: e.g., pattern {“A”} is a mono-symptom “A”, pattern {“B”, “C”} is an association of symptoms “B” and “C”, and so on.
The simulation contained a set of four pre-defined patterns:
– pattern 1: symptom association {“A”, “B”};
– pattern 2: symptom association {“C”, “D”};
– pattern 3: symptom association {“C”, “E”};
– pattern 4: symptom association {“D”, “F”}.
RESULTS
Examination of multivariate distribution of ADAMS NPI composite scores
The ADAMS Wave A NPI dataset consisted of 856 subjects; 826 subjects did not have missing NPI values, 317 (38.4%) of them had at least 1 BPSD and were included in the analysis. Among these 317 subjects, 124 (39%) were males, 193 (61%) females; 251 (79%) were white, 53 (17%) black and 13 (4%) of other ethnicity; 106 (33%) were in the 70–79 years age category; 152 (48%) in the 80–89 years age category and 59 (19%) were older than 90 years. Mean Mini-Mental State Examination total score was 25.6 (standard deviation 23.5).
Figure 1 illustrates a bivariate distribution of the NPI composite scores using the Hallucinations-Delusions pair as an example (please see Supplementary Figure 2 for pairwise distributions of other symptoms). There is a mixture of at least three zero-inflated distributions encircled by ellipses in Fig. 1: subjects that have either both hallucinations and delusions, those who have hallucinations but no delusions, and those who have delusions but no hallucinations. In other words, we have at least three overlapping patterns or three clusters of subjects with delusions and/or hallucinations. The same or more complex visual patterns are present for any other pair of BPSD in the analyzed ADAMS dataset (Supplementary Figure 2). Thus, visual inspection of the ADAMS dataset provides examples of clinically plausible overlapping NPI symptom patterns.
Fig. 1
Bivariate distribution of NPI product scores in ADAMS. Twenty five out of 317 subjects had both DELU and HALL. Twenty eight out of 317 subjects had HALL only. Thirty nine out of 317 subjects had DELU only. The circle sizes are proportional to the number of subjects with the corresponding combination of product scores for HALL and DELU. Black circles are joint symptoms (both symptoms have a product score greater than zero), grey circles along the axes are disjoint symptoms (one of the symptoms has a product score of zero), empty circle at the (0,0) coordinate – both symptoms are zero. Semi-transparent ellipses contour three zero-inflated components of the mixed distribution. Please see text for more explanation. DELU – delusions, HALL – hallucinations.
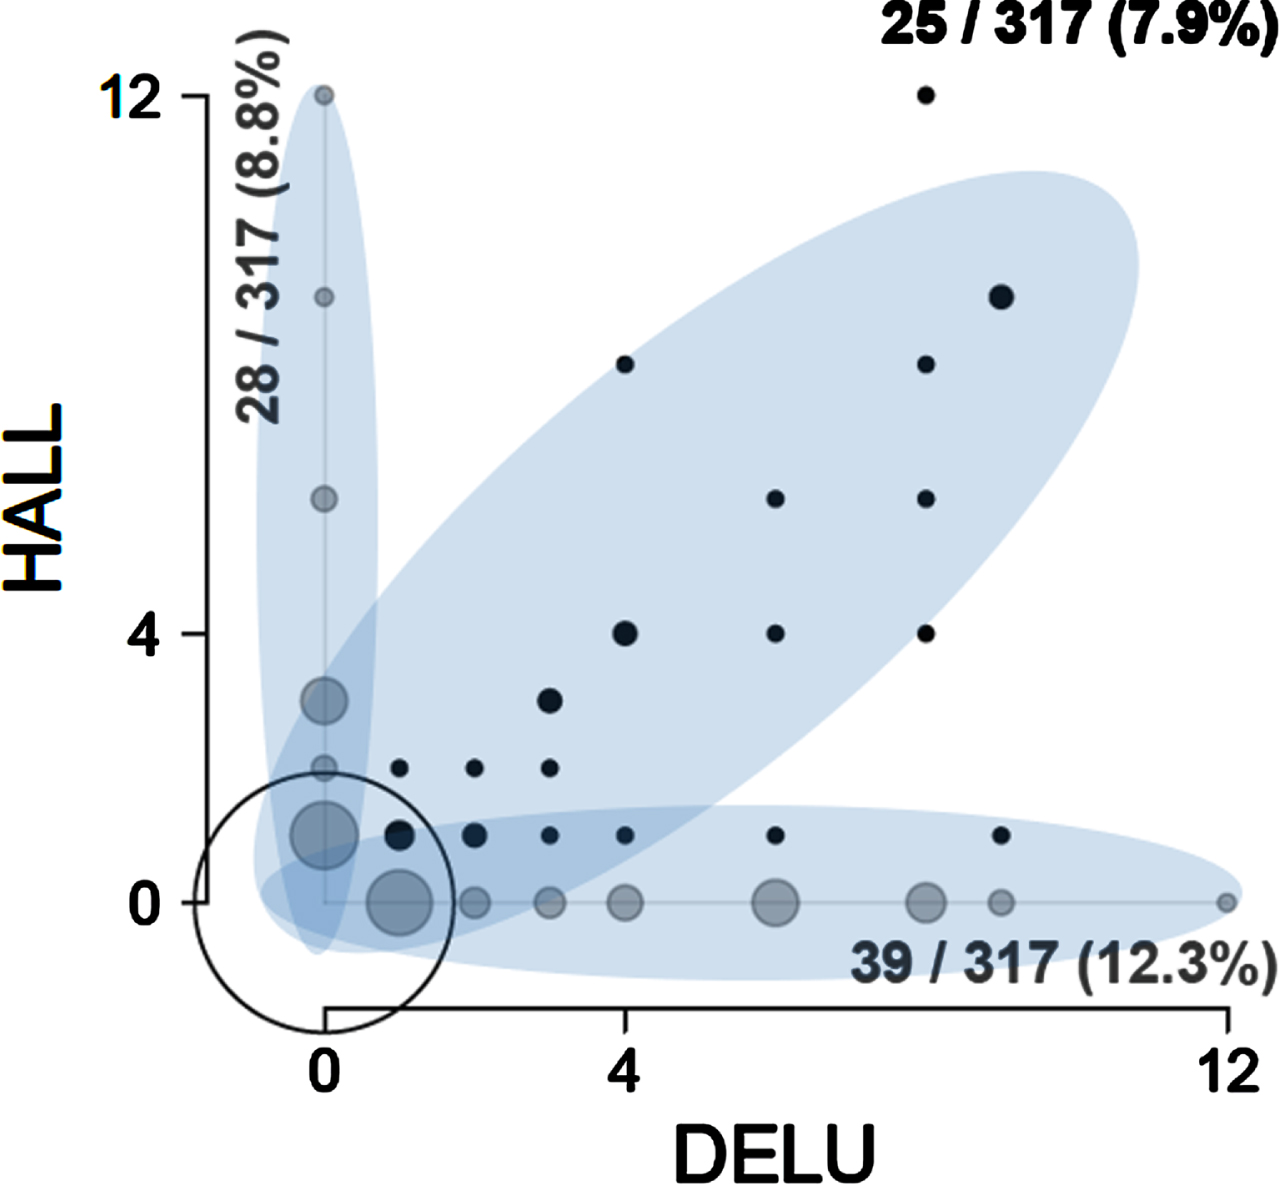
To correctly describe the distribution of NPI product scores in Fig. 1 with PCA, one would need three non-orthogonal principal components corresponding to the three highlighted ellipses—a diagonal, a vertical, and a horizontal—that would maximize variance within each sub-distribution. This is impossible: principal components must be orthogonal, and their number cannot exceed the number of variables (two in this case). Note that NPI sum scores form very similar distribution mixtures (not shown).
In the following section, we explain in more details why PCA (and ZI PCA) is not applicable to such distribution mixtures if the objective is to use PCA as a descriptive technique and not just to conserve information.
Simulation experiment
Figure 2 presents the four simulated clusters of subjects (each cluster is defined by its pattern of signals) that form a finite mixture of four multivariate zero-inflated distributions of NPI scores. Two patterns are of particular interest - association of symptoms {“A”, “B”} and {“C”, “D”}. Association of symptoms {“C”, “D”} is masked in the simulation dataset by the presence of other associations: {“C”, “E”} and {“D”, “F”}. In other words, such patterns are overlapping. Overlapping patterns may not be visible to PCA. In contrast, association of symptoms {“A”, “B”} is not masked because its signals do not overlap with signals from any other pattern.
Fig. 2
Visualization of four pre-defined patterns in the simulation experiment. Simulation consisted of 1000 datasets for product scores (used for ordinary PCA) and 1000 datasets for sum scores (used for ZI PCA). Each dataset contained 4 pre-defined patterns with 30 random subjects per pattern (total n = 120). Symptoms “A”-“J” corresponded to ten NPI items. One dataset for product scores and one dataset for sum scores are visualized in this figure. Each pattern is plotted separately: one box per symptom. Left pane: product NPI scores. Right pane: sum NPI scores. Symptoms were simulated either as signals (boxes with high NPI scores) or as noise (boxes with low NPI scores). Pattern 1 – symptom association {“A”, “B”}. Pattern 2 – symptom association {“C”, “D”}. Pattern 3 – symptom association {“C”, “E”}. Pattern 4 – symptom association {“D”,“F”}. Patterns 2-4 overlap with each other. See text for other details.
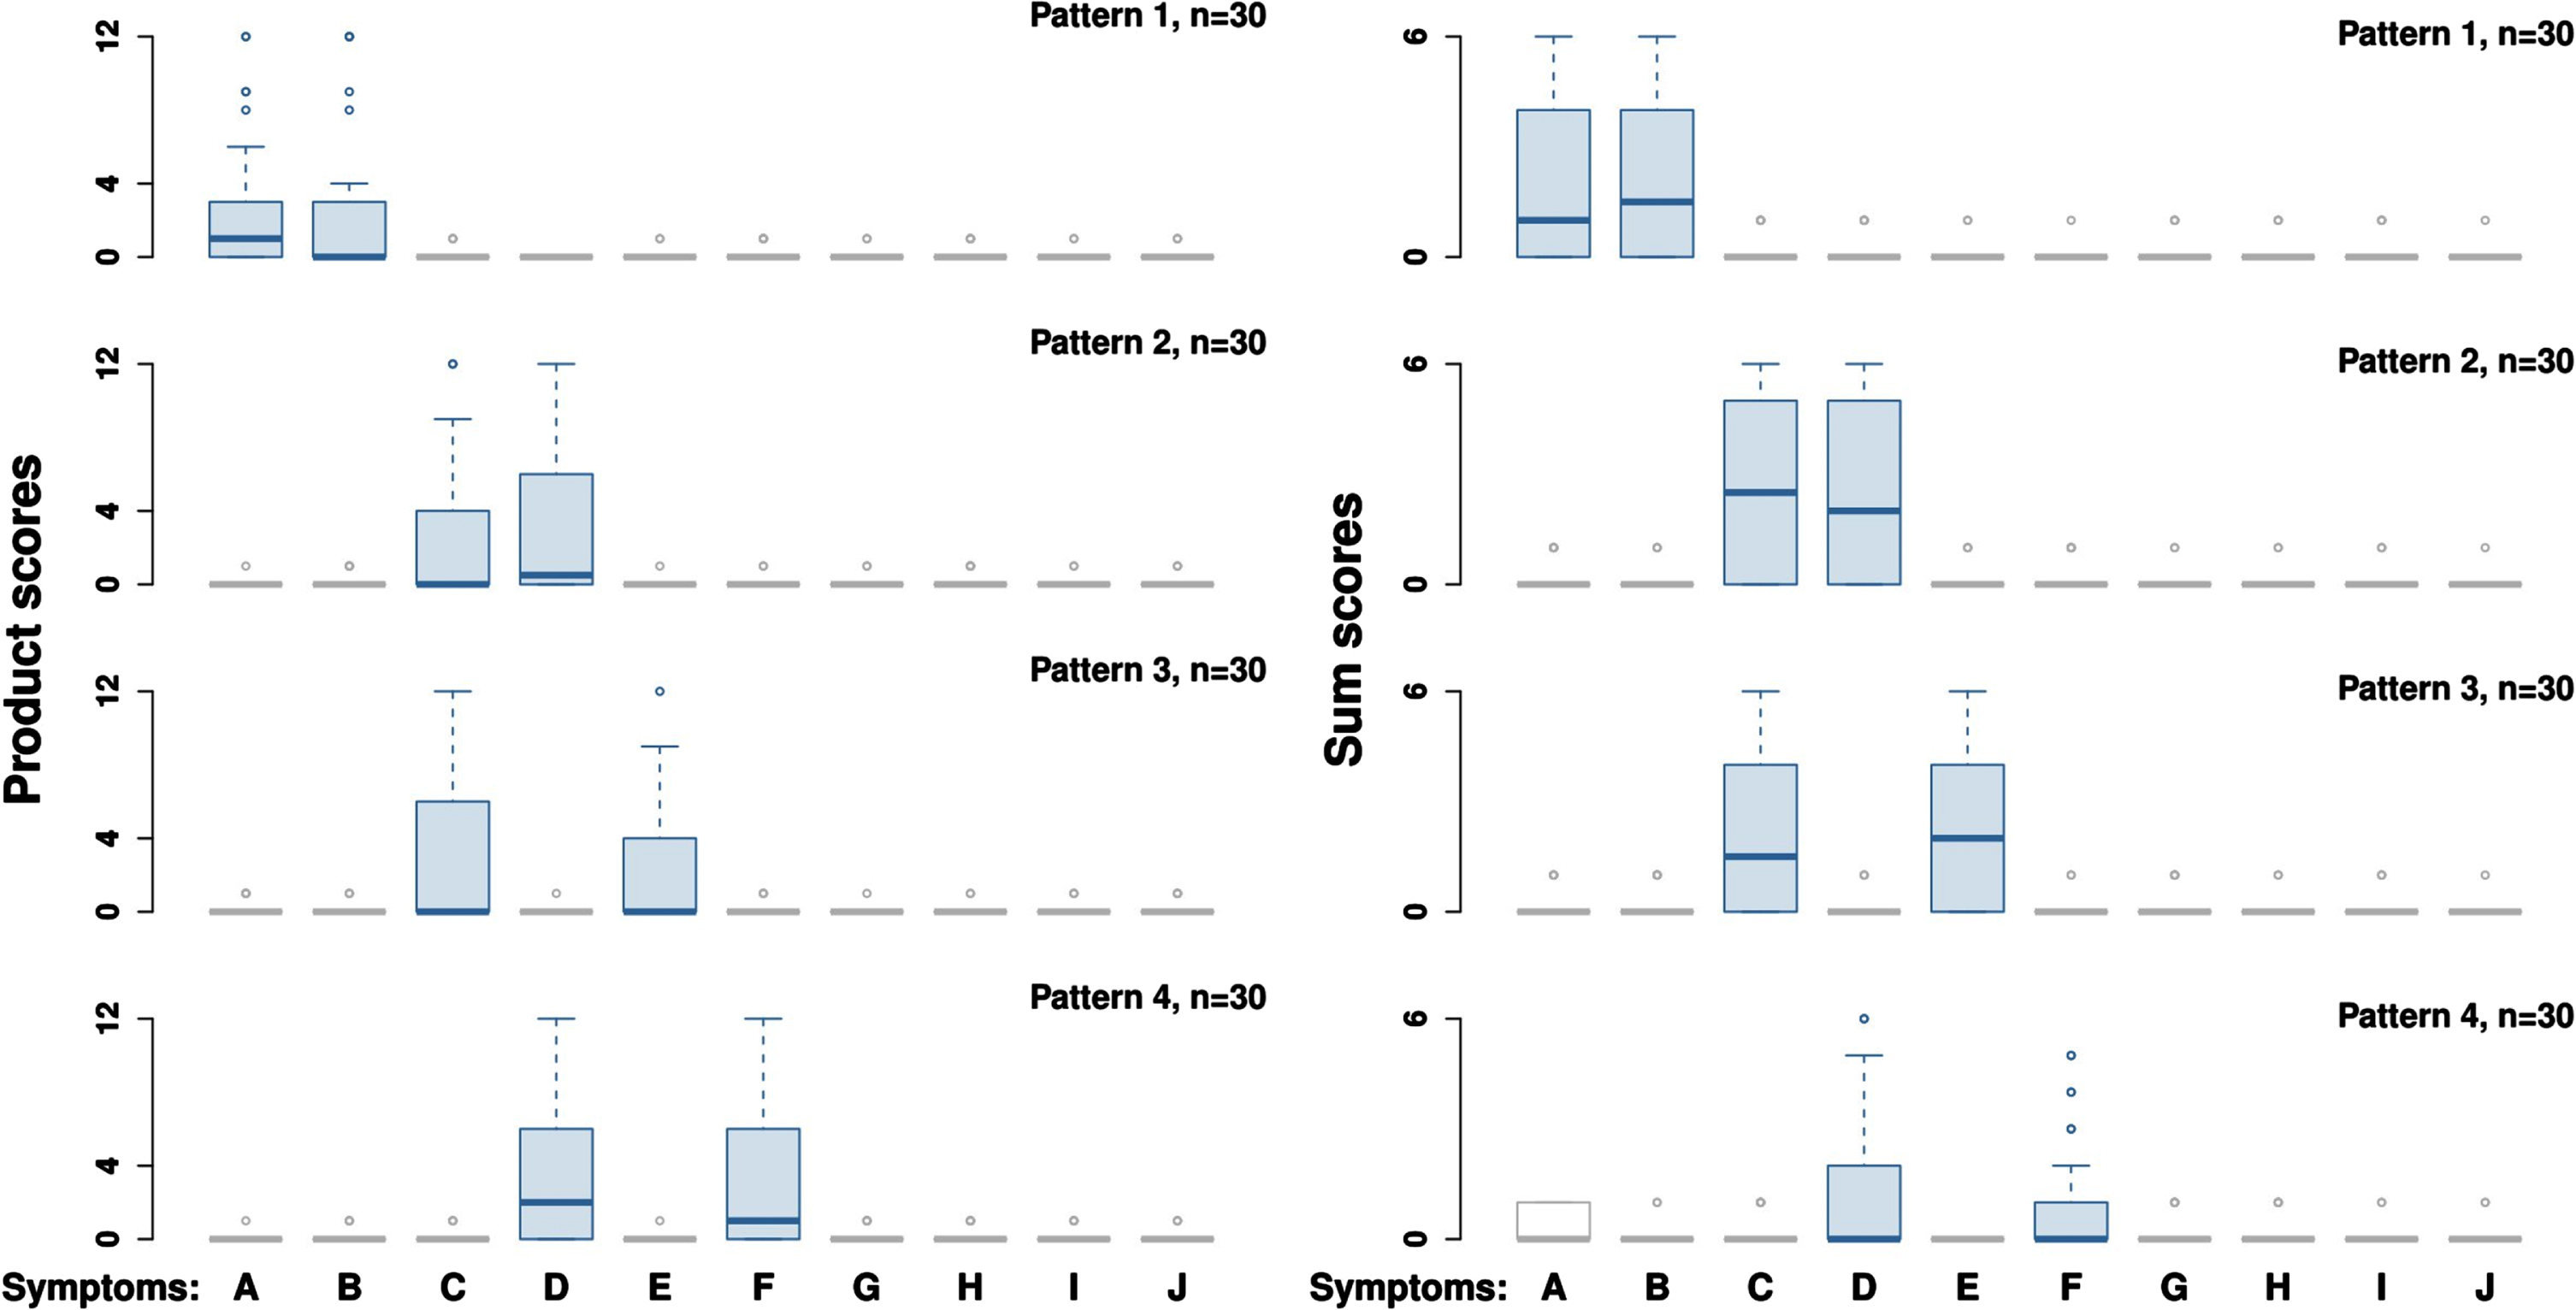
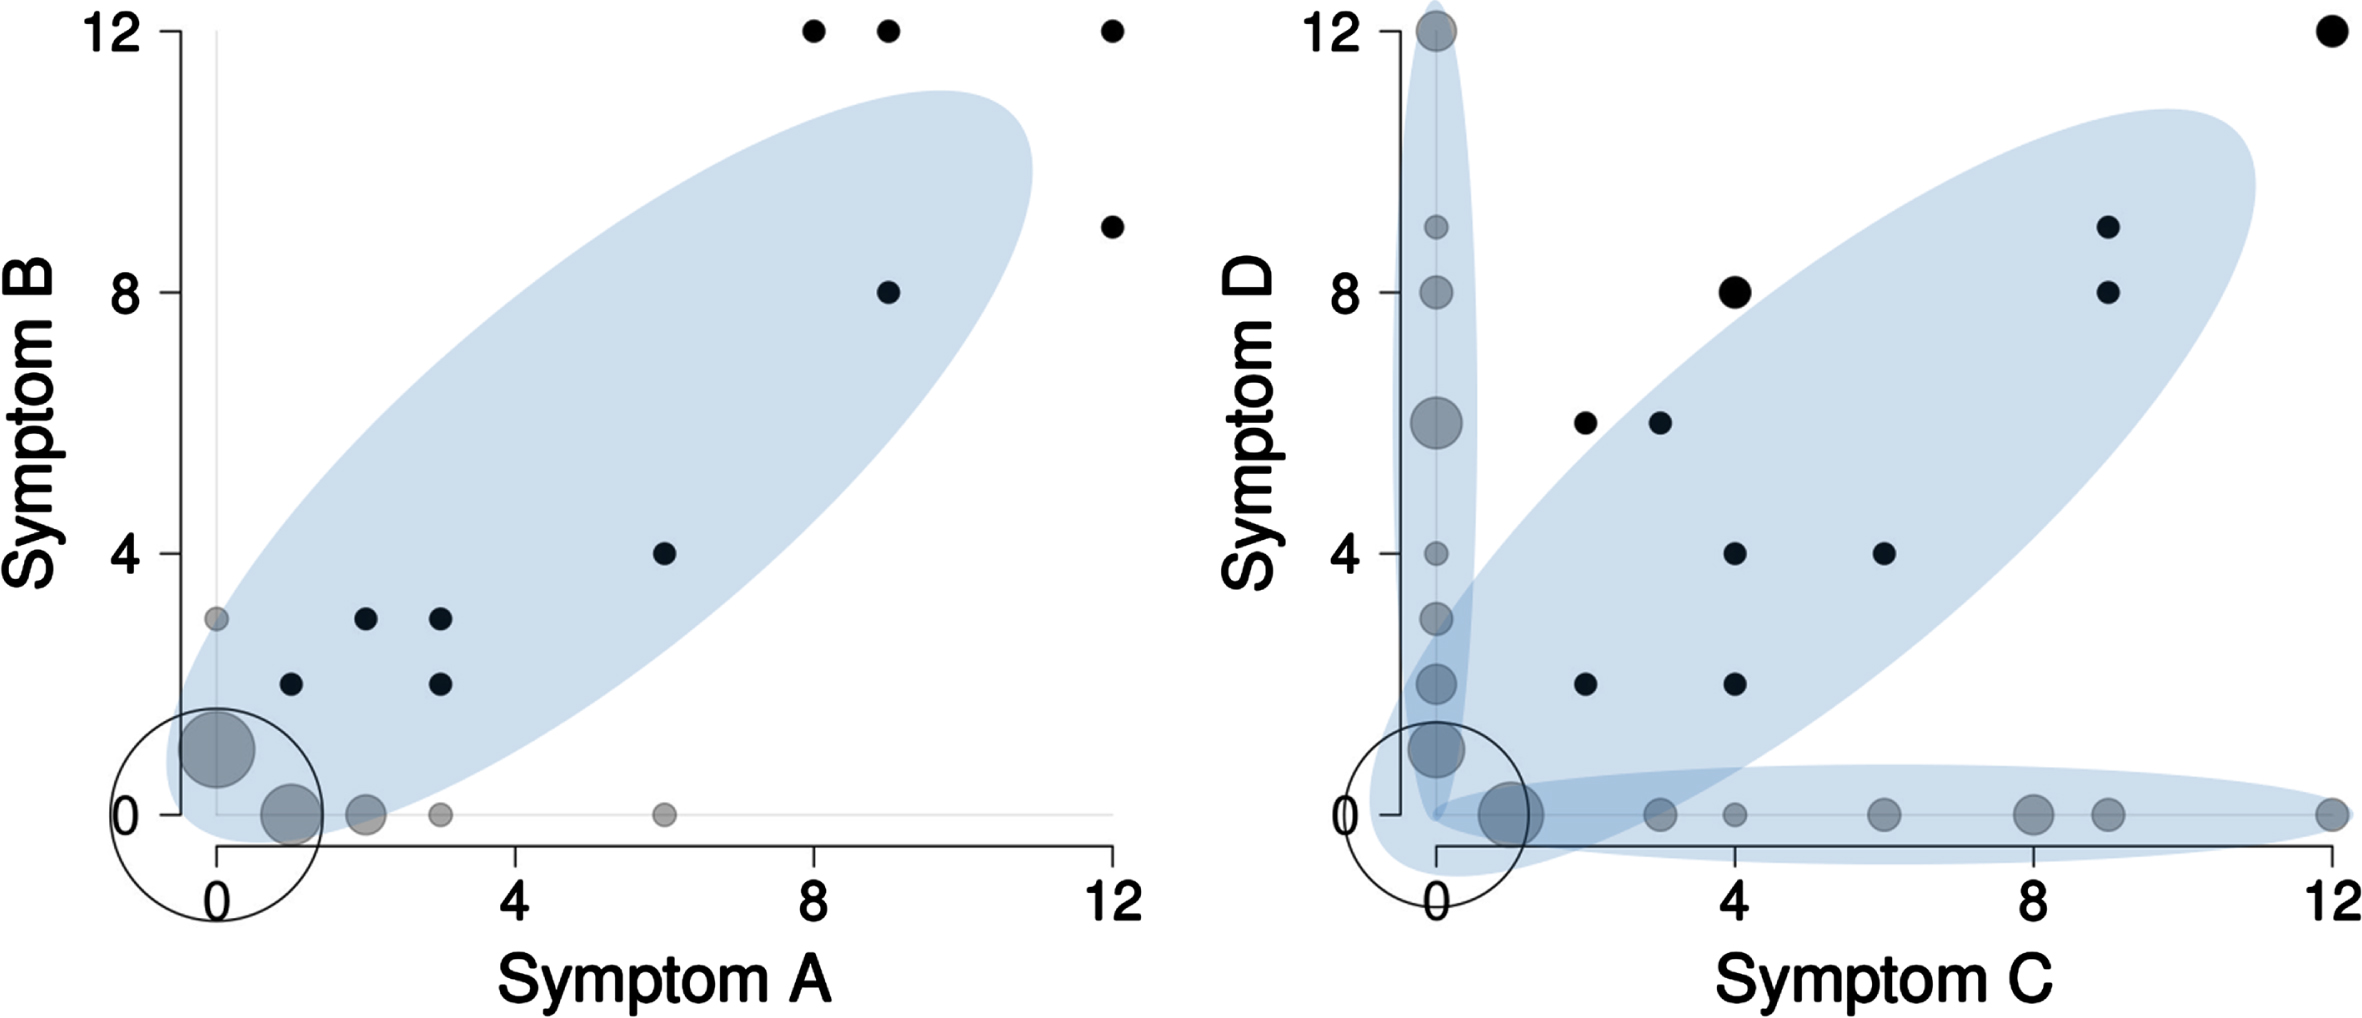
Figure 3 shows bivariate distribution for the four simulated patterns visualized in Fig. 2. In the left panel of Fig. 3, there is a one-cluster zero-inflated distribution formed by the signal pattern {“A”,“B”} that is hardly ever seen in the ADAMS dataset (see also Supplementary Figure 1). In the right panel of Fig. 3, there are three distinct clusters that look similar to the ADAMS pairwise distribution (Fig. 1). These three clusters are the mixture of signal patterns {“C”, “D”}, {“C”, “E”}, and {“D”,“F”}.
Fig. 3
Bivariate distribution of product scores of symptoms in the simulation experiment. A total of 120 subjects were simulated with symptom associations {“A”,“B”}, {“C”,“D”}, {“C”,“E”}, and {“D”,“F”} (30 subjects per pattern, see Fig. 2 and text for explanation). When all four patterns are included into one dataset, the following bivariate distributions are observed. The symptom association {“C”, “D”} overlaps with the symptom associations {“C”, “E”} and {“D”, “F”}, while symptom association {“A”,“B”} stays non-masked. Black circles are joint symptoms, grey circles are disjoint symptoms (one of the symptoms has a product score of zero), empty circle – both symptoms are zero. The size of the circles is proportional to the number of subjects.
The detection rates of the simulated patterns for PCA and ZI PCA are shown in Table 1. The main result of the simulation experiment is that PCA and ZI PCA were unable to detect fully masked symptom association {“C”,“D”} (0.8% of correct findings for PCA, 1.1% for ZI PCA). Besides, PCA and ZI PCA were prone to false detections. For each iteration PCA “detected” on average 0.473 mono-symptoms and 1.791 symptom associations that did not exist. ZI PCA “detected” for each iteration 0.380 false mono-symptoms and 1.463 false symptom associations.
Table 1
Simulation experiment: detection of four pre-defined patterns by PCA and ZI PCA
| Type of pattern | True/ False | Pattern | Overlapping status | Number of detected patterns in 1000 repetitions (% , if applicable) | |
| PCA | ZI PCA | ||||
| Mono-symptoms | True | none | –– | –– | –– |
| False | {“A”}-{“J”} | –– | 473 | 380 | |
| Symptom associations | True | {“A”,“B”} | Non-masked | 809 (80.9%) | 1000 (100.0%) |
| True | {“C”,“D”} | Fully masked by | 8 (0.8%) | 11 (1.1%) | |
| {“C”,“E”} and {“D”,“F”} | |||||
| True | {“C”,“E”} | Partially masked by | 766 (76.6%) | 979 (97.9%) | |
| {“C”,“D”} | |||||
| True | {“D”,“F”} | 745 (74.5%) | 982 (99.0%) | ||
| False | {“G”,“H”}, {“D”,“F”,“I”}, | –– | 1791 | 1463 | |
| {“C”,“D”,“F”, “J”}, etc. | |||||
Simulation was run with 1000 random datasets. Each dataset was a mixture of 4 pre-defined patterns, 30 random subjects per pattern. Symptom association {“C”,“D”} was masked by symptom associations {“C”, “E”} and {“C”, “F”}. PCA – principal component analysis of correlation matrix of product scores with varimax rotation and loading threshold 0.30; ZI PCA – zero inflated PCA of correlation matrix of sum scores with promax rotation and loading threshold 0.40. Optimal number of principal components was determined using Guttman-Kaiser criterion. See text for other details.
DISCUSSION
Behavioral and psychological symptoms drive institutionalization of people with dementia but, until recent times, in comparison to cognition and disease-modification, have not been much in focus of drug development [1–3, 27, 28]. One potential reason is that a better understanding of BPSD presence and time course is needed to inform targeted treatment development. Of particular interest is the question which BPSD appear in isolation and which combinations of BPSD are possible and are prevalent.
To address BPSD presence and co-occurrence, previous research has mostly used principal component analysis (PCA) applied to NPI scores. PCA (or exploratory factor analysis) is useful to explore redundancy of variables. For example, there may be a total of 10 variables (symptoms) and, by identifying closely related variables and grouping them into components (“latent factors”), a larger number of variables (symptoms) is reduced to a lower (i.e., less than 10) number of factors or components. PCA can be used to describe/interpret the existing associations only under assumption that we work with a single multivariate distribution, or at least with a mixture of non-overlapping multivariate distributions. Otherwise PCA is a variable reduction technique only.
Bivariate plots of ADAMS NPI scores have clearly illustrated existence of overlapping distribution mixtures (Supplementary Figure 2). We observed the same type of bivariate distributions for NPI scores in the Alzheimer’s Disease Neuroimaging Initiative dataset (results not shown). Such overlapping mixtures were modelled in the simulation experiment (Fig. 3, right panel) where three overlapping patterns shared the same symptoms (symptom association {“C”, “D”}, {“C”, “E”} and {“D”,“F”}). The overlapping patterns were visually distinct (Fig. 3, right panel) and could not be retrieved by PCA. On other hand, the non-overlapping pattern (symptom association {“A”,“B”}; Fig. 3, left panel) could be easily retrieved by PCA.
In the simulation experiment (Table 1), PCA and ZI PCA detected symptom association {“A”,“B”} in 80.9% and 100.0% of iterations, while symptom association {“C”,“D”} was detected in 0.8% and 1.1% of iterations respectively. Such results are explained by the fact that a principal component cannot adequately maximize total variance of finite mixture distributions (i.e., principal components lay outside of overlapping data subspaces, see Supplementary Material 4 for an illustrative example). The high level of false findings makes both methods particularly unreliable.
We also ran more complex simulations (summarized in Supplementary Material 5) where we modeled random instead of pre-defined patterns. We compared efficiency of detection of random overlapping versus random non-overlapping patterns, and gradually increased the number of patterns in one dataset up to 8. Efficiency of PCA and ZI PCA dropped dramatically when random patterns were allowed to overlap. The drop became even more dramatic when the number of patterns was increased.
Thus, the main outcome of the present study is the demonstration that NPI scores present mixtures of overlapping multivariate distributions which the principal components can not fit. Consequently, PCA should not be applied to this kind of data. Such conclusion may sound rather unexpected given the large number of publications based on the use of PCA in research on BPSD. We noticed that bivariate distributions of NPI scores were not investigated in any of the identified publications (Supplementary Material 3). Instead, authors looked at marginal univariate distributions only.
It is also of interest to note that among 48 publications on PCA of NPI scores listed in the Supplementary Material 3, none explicitly confirmed that the revealed associations of BPSD truly existed in the dataset. The authors did not check how their PCA model fitted the data. Instead, some authors used PCA scores to allocate subjects to the discovered principal components. For example, Aalten et al. (2003) allocated 59.8% subjects to a component that was characterized among other BPSD by Euphoria (or Elation) [9]. The loading for Euphoria was 0.716 in this component implying a considerable number of subjects with pronounced Euphoria. However, the same publication provides descriptive data indicating that Euphoria was the rarest and the weakest symptom observed in only 7% of subjects with mean NPI product score of 0.34. Such examples question the goodness of fit of PCA components to the actual data.
One reason for such a poor fit is that, in most previous publications including Aalten et al. (2003), PCA was applied to scaled variables (i.e., correlation matrix instead of covariance matrix). This can be critical for analysis of NPI items since the scores are unified and their magnitude corresponds to clinical severity of the symptoms. Scaling equalizes items with low and high scores and distorts the results. For example, when we performed PCA using scaled ADAMS NPI data (results not shown), there was a persistent cluster that was predominantly characterized by Euphoria as well. Euphoria was clinically non-significant in the majority of subjects, meaning that scaling inflated the scores of this item. By contrast, no euphoria cluster was present when PCA was conducted using non-scaled data.
Another major restriction of the PCA is that the number of components is limited by the number of variables. PCA can utilize up to n components, where n is the number of variables. Thus, in case of 10 NPI symptoms, PCA can provide up to 9 meaningful components. There is no guarantee that, in real life, the number of clinically meaningful symptom clusters is limited to nine.
To conclude, although principal component analysis is commonly applied, such analysis is at risk to reveal BPSD clusters of NPI scores that are a statistical phenomenon rather than symptom associations that occur in real life (at least when studied using tools such as NPI). We recommend the thorough characterization of multivariate distributions before subjecting any dataset to Principal Component Analysis. Finally, we recommend to evaluate suitability of other common methods (e.g., k-means clusterization) that would be able to handle the presence of overlapping distribution mixtures of the NPI scores.
Limitations
One limitation of this study is that the analyses were performed using BPSD data collected using one specific tool (NPI). Without performing a similar analysis, conclusions of our study should not be generalized to BPSD data collected using other tools. Another limitation could be that the mixtures of overlapping multivariate distributions of BPSDs were simulated based on the examples initially derived from the ADAMS database only. Although we did access other databases (such as ADNI) to confirm presence of similar BPSD distributions (as assessed by NPI), it is still possible that the real-world distributions of NPI scores are not adequately captured in the datasets to which we had access. One further limitation is that the distributions of NPI scores may change as the disease develops. One would need to have an access to a dataset significantly larger than ADAMS to characterize the distributions of NPI scores in populations with varying degrees of dementia severity. Related to the latter limitation, the ADAMS database participants have no confirmed Alzheimer’s disease diagnoses by the experimental NIA-AA criteria [29].
ACKNOWLEDGMENTS
The ADAMS is a supplement to the Health and Retirement Study (HRS) data that is sponsored by the National Institute on Aging (U01-AG009740) and conducted by the University of Michigan with the specific aim of conducting a population-based study of dementia.
AUTHOR CONTRIBUTIONS
Timofey L. Galankin (Conceptualization; Data curation; Formal analysis; Methodology; Software; Validation; Visualization; Writing – original draft; Writing – review & editing); Anton Y. Bespalov (Conceptualization; Data curation; Formal analysis; Funding acquisition; Methodology; Project administration; Supervision; Writing – original draft; Writing – review & editing); Hans J. Moebius (Conceptualization; Funding acquisition; Methodology; Supervision; Visualization; Writing – original draft; Writing – review & editing).
FUNDING
This work was funded by EXCIVA GmbH, Heidelberg, Germany.
CONFLICT OF INTEREST
The work by TG, AB, and HM was funded by EXCIVA GmbH, Heidelberg, Germany. AB and HM are co-founders and shareholders of EXCIVA GmbH. HM is an Editorial Board Member of this journal but was not involved in the peer-review process nor had access to any information regarding its peer-review.
DATA AVAILABILITY
The ADAMS data are publicly available and access can be requested from the HRS Web site (https://hrs.isr.umich.edu/).
Runnable R codes used in simulation experiments are available from https://doi.org/10.17605/OSF.IO/VWBRZ.
SUPPLEMENTARY MATERIAL
[1] The supplementary material is available in the electronic version of this article: https://dx.doi.org/10.3233/JAD-231008.
REFERENCES
[1] | Corbett A , Smith J , Creese B , Ballard C ((2012) ) Treatment of behavioral and psychological symptoms of Alzheimer’s disease. Curr Treat Options Neurol 14: , 113–125. |
[2] | Cloak N , Khalili Y Al ((2022) ) Behavioral and psychological symptoms in dementia. In StatPearls. StatPearls, Treasure Island (FL). https://www.ncbi.nlm.nih.gov/books/NBK551552/ |
[3] | Tible OP , Riese F , Savaskan E , Von Gunten A ((2017) ) Best practice in the management of behavioural and psychological symptoms of dementia. Ther Adv Neurol Disord 10: , 297–309. |
[4] | Lanctôt KL , Amatniek J , Ancoli-Israel S , Arnold SE , Ballard C , Cohen-Mansfield J , Ismail Z , Lyketsos C , Miller DS , Musiek E , Osorio RS , Rosenberg PB , Satlin A , Steffens D , Tariot P , Bain LJ , Carrillo MC , Hendrix JA , Jurgens H , Boot B ((2017) ) Neuropsychiatric signs and symptoms of Alzheimer’s disease: New treatment paradigms. Alzheimers Dement (N Y) 3: , 440–449. |
[5] | Kales HC , Gitlin LN , Lyketsos CG ((2019) ) When less is more, but still not enough: Why focusing on limiting antipsychotics in people with dementia is the wrong policy imperative. J Am Med Dir Assoc 20: , 1074–1079. |
[6] | Cummings JL , Mega M , Gray K , Rosenberg-Thompson S , Carusi DA , Gornbein J ((1994) ) The Neuropsychiatric Inventory: Comprehensive assessment of psychopathology in dementia. Neurology 44: , 2308–2308. |
[7] | Cummings JL ((2012) ) The Neuropsychiatric Inventory: Assessing psychopathology in dementia patients. Neurology 48: , 10S–16S. |
[8] | Hellton KH , Cummings J , Vik-Mo AO , Nordrehaug JE , Aarsland D , Selbaek G , Giil LM ((2020) ) The truth behind the zeros: A new approach to principal component analysis of the Neuropsychiatric Inventory. Multivariate Behav Res 56: , 70–85. |
[9] | Aalten P , de Vugt ME , Lousberg R , Korten E , Jaspers N , Senden B , Jolles J , Verhey FRJ ((2003) ) Behavioral problems in dementia: A factor analysis of the neuropsychiatric inventory. Dement Geriatr Cogn Disord 15: , 99–105. |
[10] | Regier NG , Hodgson NA , Gitlin LN ((2020) ) Neuropsychiatric symptom profiles of community-dwelling persons living with dementia: Factor structures revisited. Int J Geriatr Psychiatry 35: , 1009–1020. |
[11] | Lundqvist LO , Hultqvist J , Granvik E , Minton L , Ahlström G ((2020) ) Psychometric properties of the Neuropsychiatric Inventory for adults with intellectual disability. J Appl Res Intellect Disabil 33: , 1210–1220. |
[12] | Wada-Isoe K , Kikuchi T , Umeda-Kameyama Y , Mori T , Akishita M , Nakamura Y ((2020) ) Validation of the Neuropsychiatric Inventory based on item response theory. J Alzheimers Dis Rep 4: , 151–159. |
[13] | Chen S , Lin K , Wang H , Yamakawa M , Makimoto K , Liao X ((2018) ) Reliability and structural validity of the Chinese version of the Neuropsychiatric Inventory, Nursing Home version. Psychogeriatrics 18: , 113–122. |
[14] | Connors MH , Seeher KM , Crawford J , Ames D , Woodward M , Brodaty H ((2018) ) The stability of neuropsychiatric subsyndromes in Alzheimer’s disease. Alzheimers Dement 14: , 880–888. |
[15] | Cummings JL , McRae T , Zhang R ((2006) ) Effects of donepezil on neuropsychiatric symptoms in patients with dementia and severe behavioral disorders. Am J Geriatr Psychiatry 14: , 605–612. |
[16] | Juster FT , Suzman R ((1995) ) An overview of the Health and Retirement Study. J Hum Resour 30: , S7. |
[17] | Ofstedal MB , Fisher GG , Herzog AR ((2005) ), Documentation of Cognitive Functioning Measures in the Health and Retirement Study. https://hrs.isr.umich.edu/publications/biblio/5620 |
[18] | Heeringa SG , Fisher GG , Hurd M , Langa KM , Ofstedal MB ((2007) ) Aging, Demographics And Memory Study (ADAMS) sample design, weighting and analysis for ADAMS. https://hrs.isr.umich.edu/publications/biblio/5761 |
[19] | Plassman BL , Langa KM , Fisher GG , Heeringa SG , Weir DR , Ofstedal MB , Burke JR , Hurd MD , Potter GG , Rodgers WL , Steffens DC , Willis RJ , Wallace RB ((2007) ) Prevalence of dementia in the United States: The aging, demographics, and memory study. Neuroepidemiology 29: , 125–132. |
[20] | Plassman B , Langa K , Fisher G , Heeringa SG , Weir D , Ofstedal MB , Burke Jr. , Hurd MD , Potter G , Rodgers W , Steffens DC , McArdle J , Willis R , Wallace R ((2008) ) Prevalence of cognitive impairment without dementia in the United States. Ann Intern Med 148: , 427–434. |
[21] | Kazui H , Yoshiyama K , Kanemoto H , Suzuki Y , Sato S , Hashimoto M , Ikeda M , Tanaka H , Hatada Y , Matsushita M , Nishio Y , Mori E , Tanimukai S , Komori K , Yoshida T , Shimizu H , Matsumoto T , Mori T , Kashibayashi T , Yokoyama K , Shimomura T , Kabeshita Y , Adachi H , Tanaka T ((2016) ) Differences of behavioral and psychological symptoms of dementia in disease severity in four major dementias. PLoS One 11: , e0161092. |
[22] | Selbæk G , Engedal K ((2012) ) Stability of the factor structure of the Neuropsychiatric Inventory in a 31-month follow-up study of a large sample of nursing-home patients with dementia. Int Psychogeriatr 24: , 62–73. |
[23] | Cummings JL ((1997) ) The Neuropsychiatric Inventory: Assessing psychopathology in dementia patients. Neurology 48: , S10–S16. |
[24] | Kaiser HF ((1960) ) The application of electronic computers to factor analysis. Educ Psychol Meas 20: , 141–151. |
[25] | R Core Team (2020) R: A language and environment for statistical computing. R Foundation for Statistical Computing, Vienna, Austria. URL https://www.R-project.org/. |
[26] | Barbiero A , Ferrari PA ((2017) ) An R package for the simulation of correlated discrete variables. Commun Stat Simul Comput 46: , 5123–5140. |
[27] | Cummings JL , Morstorf T , Zhong K ((2014) ) Alzheimer’s disease drug-development pipeline: Few candidates, frequent failures. Alzheimers Res Ther 6: , 37. |
[28] | Cummings J , Lee G , Zhong K , Fonseca J , Taghva K ((2021) ) Alzheimer’s disease drug development pipeline: 2021. Alzheimers Dement (N Y) 7: , e12179. |
[29] | Jack CR , Bennett DA , Blennow K , Carrillo MC , Dunn B , Haeberlein SB , Holtzman DM , Jagust W , Jessen F , Karlawish J , Liu E , Molinuevo JL , Montine T , Phelps C , Rankin KP , Rowe CC , Scheltens P , Siemers E , Snyder HM , Sperling R , Elliott C , Masliah E , Ryan L , Silverberg N ((2018) ) NIA-AA Research Framework: Toward a biological definition of Alzheimer’s disease. Alzheimers Dement 14: , 535–562. |


