
Altered Motor Activity Patterns within 10-Minute Timescale Predict Incident Clinical Alzheimer’s Disease
Abstract
Background:
Fractal motor activity regulation (FMAR), characterized by self-similar temporal patterns in motor activity across timescales, is robust in healthy young humans but degrades with aging and in Alzheimer’s disease (AD).
Objective:
To determine the timescales where alterations of FMAR can best predict the clinical onset of AD.
Methods:
FMAR was assessed from actigraphy at baseline in 1,077 participants who had annual follow-up clinical assessments for up to 15 years. Survival analysis combined with deep learning (DeepSurv) was used to examine how baseline FMAR at different timescales from 3 minutes up to 6 hours contributed differently to the risk for incident clinical AD.
Results:
Clinical AD occurred in 270 participants during the follow-up. DeepSurv identified three potential regions of timescales in which FMAR alterations were significantly linked to the risk for clinical AD: <10, 20–40, and 100–200 minutes. Confirmed by the Cox and random survival forest models, the effect of FMAR alterations in the timescale of <10 minutes was the strongest, after adjusting for covariates.
Conclusions:
Subtle changes in motor activity fluctuations predicted the clinical onset of AD, with the strongest association observed in activity fluctuations at timescales <10 minutes. These findings suggest that short actigraphy recordings may be used to assess the risk of AD.
INTRODUCTION
The pathology of Alzheimer’s disease (AD) can progress silently for decades before the clinical diagnosis of the disease, and this long preclinical phase is believed to provide a window for effective interventions [1]. Thus, understanding physiological changes in preclinical AD and identifying people at risk for developing AD at earlier stages are of great clinical relevance.
Using concepts and methods derived from nonlinear dynamics, previous studies in healthy young humans identified fractal motor activity regulation (FMAR) that manifests as robust self-similar patterns in spontaneous motor activity fluctuations with similar temporal correlations across a wide range of timescales from seconds to hours [2–7]. Using the Memory and Aging Project (MAP) dataset at Rush University AD Center [8], we previously showed that FMAR degrades with aging, leading to more random movements (i.e., reduced temporal activity correlations), and the degradation accelerated after the onset of mild cognitive impairment and dementia [9]. In addition, after adjusting for other risk factors for dementia (e.g., age, education, physical activity, sleep fragmentation, and daily activity rhythm), more random activity fluctuations predicted a faster cognitive decline and increased risk of incident AD in older people years before any sign of cognitive impairment [10]. Furthermore, our recent study showed a link between FMAR and AD pathology in preclinical AD [11].
However, despite the established links between FMAR and AD, the timescale where FMAR is the most sensitive to risk of clinical AD is unknown. In prior studies, average behaviors and changes in FMAR were commonly examined in two wide timescales: shorter and longer than 90 min [9, 10, 12–15]. Although there is strong evidence that changes in these two wide timescales have been linked to the effect of aging and the risk for dementia, they are overly coarse, and no study has examined the changes in FMAR across finer time scales. Clarifying the alterations of FMAR at finer timescales during the development/progression of AD is important for the mechanistic understanding of the impacts of AD on physiological processes/functions related to motor control, which can facilitate better design of biomarkers for early detection of AD.
Here, we test whether alterations in the temporal correlations of motor activity at different timescales have different contributions to the risk for clinical AD. We followed the participants with no dementia at baseline for up to 15 years. Using motor activity recordings (actigraphy) collected from these participants at baseline, we examined the temporal correlations in activity fluctuations across a wide range of timescales from 3 min to 6 h. We used deep learning survival analysis to identify the timescale region(s) significantly associated with incident clinical AD. The identified candidate timescale regions were then validated by examining the association between the FMAR in these regions and incident clinical AD with traditional survival analysis approaches, including Cox Proportional Hazard model and random survival forest.
MATERIALS AND METHODS
Participants
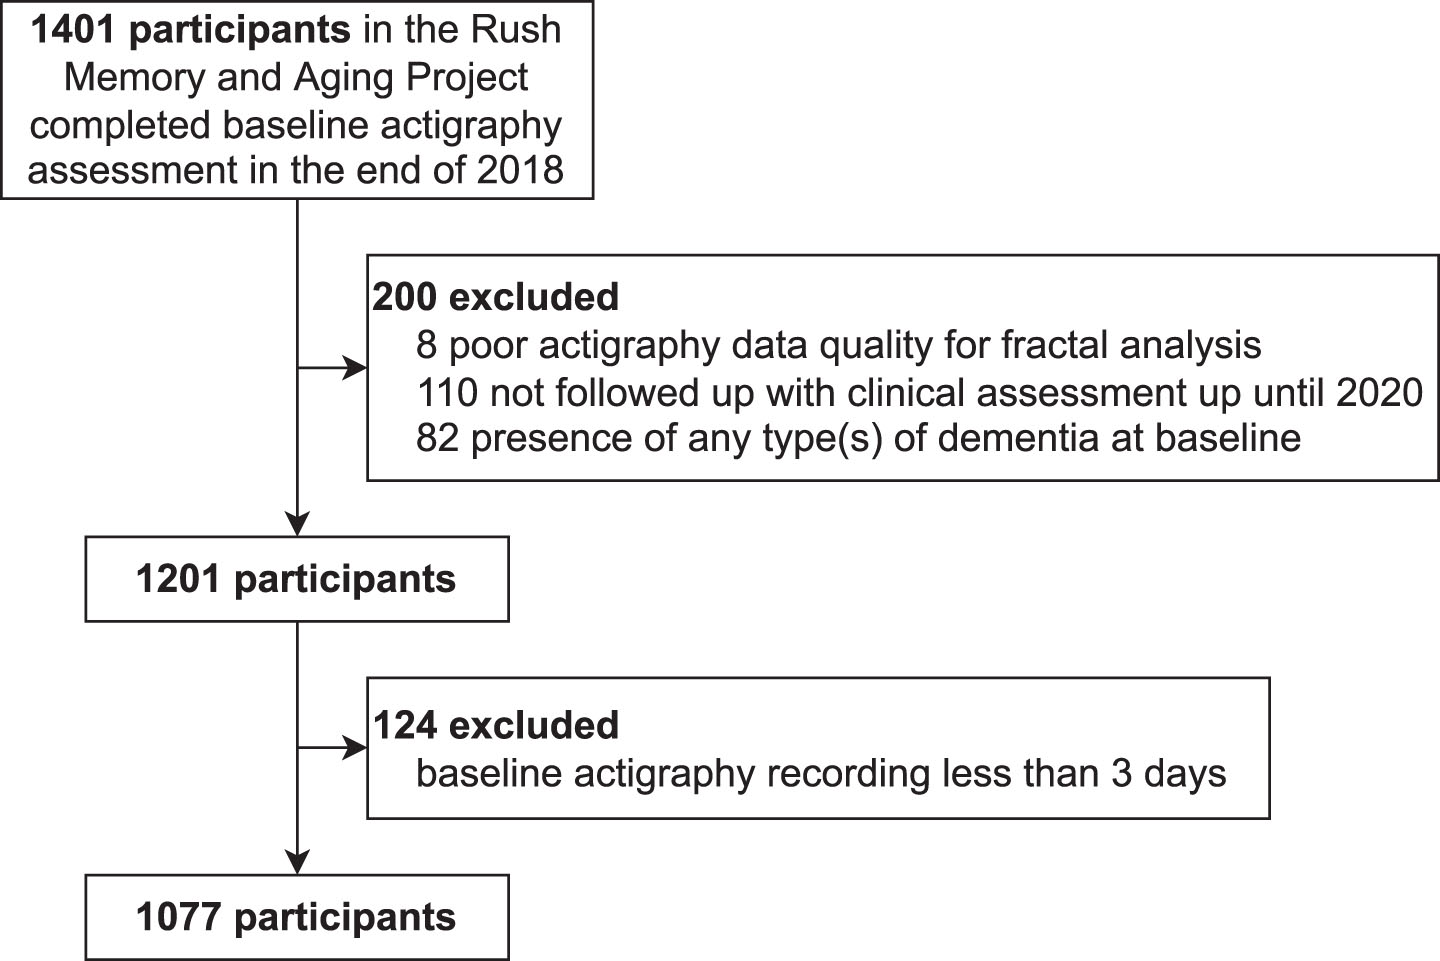
Participants were from the Rush Memory and Aging Project (MAP), a longitudinal cohort study at the Rush University Medical Center (RUMC). All participants signed an informed consent for participation and a repository consent to allow data to be re-purposed. MAP was approved by the Intuitional Review Board of the RUMC. The current study was approved by the Mass General Brigham Intuitional Review Board. The inclusion criteria were 1) valid motor activity assessment (actigraphy) and 2) valid cognitive assessment at baseline. Until the end of 2018, 1,401 participants met these inclusion criteria. The exclusion criteria were: 1) poor data quality (see the following subsection); 2) no follow-up clinical assessment until 2020; and 3) presence of any type of dementia at baseline due to AD, Parkinson’s disease, Lewy body disease, stroke, depression, or frontotemporal degeneration. Note that patients with other neurological diseases but without dementia were included. Based on the flowchart in Fig. 1, we finally had 1,077 participants.
Fig. 1
The flowchart for inclusion/exclusion of study participants.
Exposure: Fractal motor activity regulation and its alterations
First, motor activity during the baseline visit was recorded using an actigraphy device (Actical, Philips Respironics, Bend, OR, US) worn on participants’ non-dominant wrist continuously for 10 days on average (max 14 days, standard deviation 1 day) [8]. Raw accelerometer data were integrated into proprietary counts (activity counts) in 15-s epochs. All activity count recordings were subject to signal quality screening [9, 10, 14], and low quality (defined as long segments with continuous zeros during daytime or spikes with amplitude 10 standard deviations higher than individual recording means [10]) were marked as gaps and excluded from subsequent data analysis. Those recordings that were shorter than 3 days [10] or had ≥50% gaps were also excluded(Fig. 1).
Next, to assess FMAR, detrended fluctuation analysis (DFA) [16] was performed to obtain a fluctuation amplitude F(n) as a function of timescales n from 3 min up to 6 h (see details in the Supplementary Methods and Supplementary Figure 1). For fractal fluctuations within a region of time scales, F(n) should be a power-law function (i.e., F(n) = nα), where the scaling exponent, α, estimates the temporal correlation in the fluctuations within the timescale region [17]. Note that all the participants in this study were old (59 to 100 years) and at risk for many diseases. Thus, it is expected that activity fluctuations in these participants may have altered temporal fluctuations. The altered temporal fluctuations can cause deviation from the power-law, hence different scaling exponents (α’s) at different timescales. To identify the timescales where altered FMAR was associated with the risk for clinical AD, we obtained the local scaling exponent “α(n)” at each timescale n by performing the power-law fit of 5 consecutive points (two points at both sides plus one middle point) of the function centered at timescale n (Supplementary Figure 2). The choice of 5 points is a trade-off between estimation reliability and locality, with Pearson’s R2 of the local estimation more than 0.5 for 98% of α(n)’s. The result of using different numbers of points to evaluate the local α(n) is in Supplementary Figure 3. Note, compared to other analyses to assess FMAR, such as the Hurst analysis and the auto-correlation analysis, the DFA can better quantify positive temporal correlations embedded in non-stationary biological/physiological fluctuations including motor activityfluctuations.
Outcome: Onset of clinical Alzheimer’s disease
To determine the clinical onset of AD, the 1984 National Institute of Neurological and Communicative Disorders and Stroke and the Alzheimer’s Disease and Related Disorders Association (NINCDS-ADRDA) criteria [18] were used since the Rush MAP started on 1997. The diagnosis of dementia due to AD was based on comprehensive clinical assessment according to the following four steps in the Rush MAP [19]. Step 1: History of cognitive decline was based on a structured interview with participants. Step 2: Cognitive impairment ratings of eleven tests were assessed covering five areas of cognition: orientation, attention, memory, language, and visuospatial ability. Step 3: A neuropsychologist rendered a clinical judgment: Impairment in one or two areas was consistent with single- or multiple-domain mild cognitive impairment, and impairment in three to five areas was consistent with dementia. When two areas of impairment were present, the neuropsychologist rendered an opinion regarding the presence of dementia. Step 4: A clinician entered all the information (i.e., history of cognitive decline, the number of impaired domains, the presence of memory impairment, and a clinical judgment regarding meaningful cognitive decline) to a decision tree, which generated a clinical diagnosis of dementia and AD based on the NINCDS-ADRDA criteria. The clinician was then offered an opportunity to override the decision. Note that “Alzheimer’s dementia” was used in the Rush MAP to describe the above multi-domain clinical dementia symptom of AD.
Other types of dementia were also identified in the Rush MAP using other criteria, including dementia related to vascular (NINDS-AIREN [20]), Parkinson’s or Lewy bodies (CAPIT [21]), depression (DSM-III-R criteria supported by the Hamilton rating scale for depression [22]), and frontotemporal degeneration (strict clinical judgment [19]).
Death is a competing risk. Here we assigned the primary outcome, clinical AD, as censored (unknown) for participants who died before the clinical diagnosis of AD.
Covariates
We considered the following categories of covariates at baseline: 1) Demographics: age, sex, years of education; 2) Cognition: Scores of 19 neuropsychological tests were z-transformed based on the means and standard deviations of the cohort, and then averaged to obtain a global composite cognitive measure (higher scores indicate better cognitive performance); 3) motor function assessed by a composite score covering 10 motor performance tests [23]; 4) chronic health conditions assessed by the number (ranging from 0 to 3) of present vascular risk factors (hypertension, diabetes, and smoking) and the number (ranging from 0 to 4) of present vascular diseases (myocardial infarction, congestive heart failure, claudication, and stroke) [24]; 5) physical activity assessed by total activity counts per day [25]; 6) the probability of the transition from activity to resting (kar) [26] that likely represents the fragmentation of daytime active period, and the probability of transition from resting to activity after a long (about 5 min) period of rest (kra) that represents sleep fragmentation [26]; 7) Interdaily stability, a measure of the stability of 24-h activity rhythms (ranging between 0–1 with low values for higher day-to-day variations); and 8) Intradaily variability, a measure of fragmentation of the rest-activity rhythms [27]. The collinearity structure among these covariates plus some scaling exponents is shown in Supplementary Figure 4 in the Supplementary Material. 1.6% of the covariates are missing. We imputed them using the K-nearest neighbor model with K = 10.
We also explored the potential interaction effect of altered FMAR and genetic risk on the clinical onset of AD. We considered the APOE ɛ4 allele that increases the risk of late-onset AD and predicts cognitive decline with aging [28]. APOE genotyping in the Rush MAP was performed by Polymorphic DNA Technologies (Alameda, CA). DNA was extracted from peripheral blood mononuclear cells, and the APOE haplotypes were determined by the two polymorphisms of rs7412 (codon 158) and rs429358 (codon 112) at exon 4 of the APOE gene. APOE ɛ4 genotype status was dichotomized as APOE ɛ4 carrier (heterozygote or homozygote, including APOE ɛ2/ɛ4, ɛ3/ɛ4, and ɛ4/ɛ4) or noncarrier.
Survival analysis with DeepSurv
We used DeepSurv [29], a deep learning approach of survival analysis, using convolutional neural network (CNN) as its hazard function. The rationale of using DeepSurv is that it takes all α(n)’s as input and let us inspect the importance of α(n). The inputs to DeepSurv were the covariates at the baseline visit and the local scaling exponents α(n) at different timescales. α(n) went through two convolution blocks, where each block contained a convolution layer (see the learned kernels of the first convolutional layer in Supplementary Figure 5), batch normalization, ReLU activation, max-pooling (downsampling the inputs 4 times), and dropout. The outputs were then concatenated with the baseline covariates defined above and fed to a fully connected layer with sigmoid activation. The model was trained using Adam’s optimizer with 0.001 learning rate (a common choice). The learning rate was reduced to its 10% to allow for annealing when the loss on the validation set did not decrease in 5 consecutive scans of the training dataset. The training was early stopped when the loss on the validation set did not decrease in 10 consecutive scans.
Determining the important timescales for AD risk
To obtain candidate timescales, we first computed the gradient of the DeepSurv-predicted AD hazard with respect to the local DFA scaling exponents α(n) at each timescale n. Since every participant has different gradient, we took the average of the gradients across all participants. We further smoothed the gradient across timescales using Savitzky-Golay filter with window length of 21 points and polynomial order of 2. The importance of α(n) was defined as the gradient. The candidate important timescales were identified as those with significant importance at 95% level (95% confidence interval does not include 0). The confidence interval was constructed as follows. First, assume the gradients follow normal distribution at each timescale, with mean equals to the mean across all participants, standard deviation equal to the standard error across all participants. Second, we used Bonferroni correction to control for family-wise error rate, therefore the lower bound is the value with cumulative probability at 2.5% /number of timescales in the normal distribution; and the upper bound is the value with cumulative probability at 100% – (2.5% /number of timescales in the normal distribution). The conserveness is good for our case of no a priori hypothesis over certain timescale. Note that we did not do variable selection since it is often affected by collinearity among predictors.
To validate candidate timescales found by DeepSurv, we performed analyses using two other survival analysis models: the Cox proportional hazards model with ElasticNet penalty (Cox), and random survival forests (RSF) [30]. The inputs to these two models were the DFA scaling exponent in the important timescales identified by the gradient of DeepSurv, adjusted by age, sex, education, and APOE ɛ4. Note that DeepSurv, Cox, and RSF models were trained with nested 5-fold cross validation (see Supplementary Methods). Since the results can be affected by the collinearity among the α(n) at different timescales n, we also investigated the univariate importance of each α(n), by fitting a Cox model to each α(n) while adjusting for the covariates.
Metrics for performance evaluation
To evaluate the performance of all models, we obtained two metrics: 1) concordance index (C-index) that measures how concordant the ranking of time to the clinical onset of AD is compared to the ranking of individual risks at the end of 15 years of follow-up; and 2) the average 3-to-9 years cumulative/dynamic AUC that measures the discrimination between the cases of clinical AD until a given time and the cases without the clinical onset at or after the given time. The range of 3-to-9 years was used to ensure enough participants for each point of time to the onset such that AUC was less subject to random noise.
All confidence intervals were obtained from bootstrapping the dataset 1000 times. The 2.5% and 97.5% percentiles were taken as the lower and upper bounds respectively to form 95% percentile confidence interval.
RESULTS
Participants characteristics
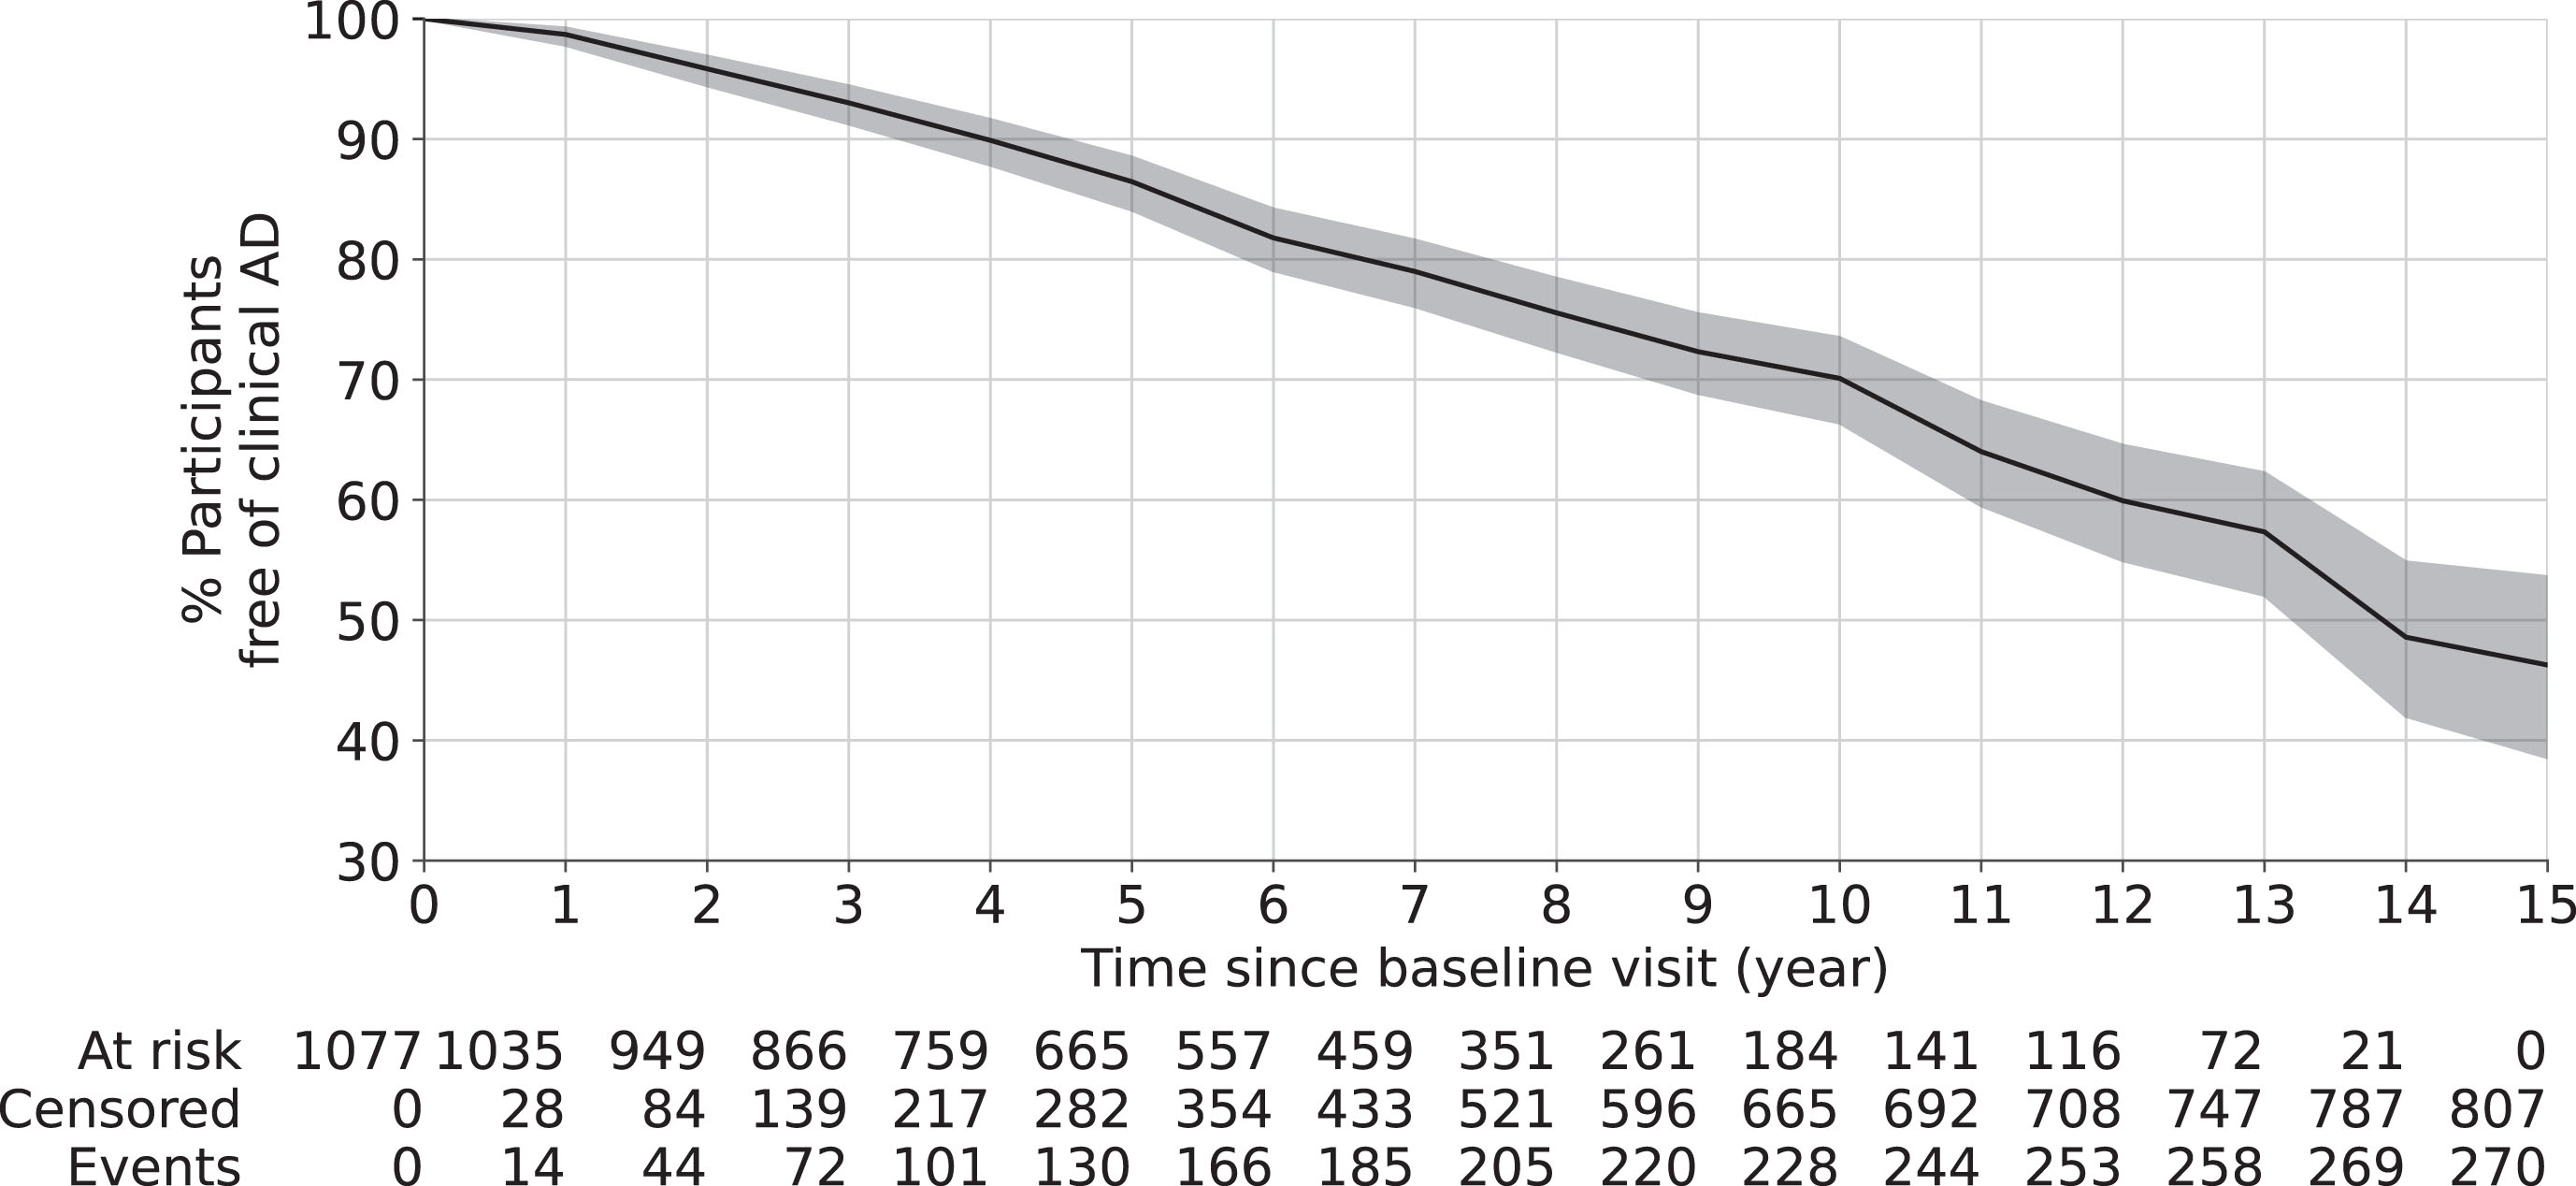
As shown in Table 1, 1,077 participants (age at baseline: 59 to 100 years old, 23% males) were included in this study. Until 15 years after baseline, 270 out of 1,077 participants were diagnosed with clinical AD. The median time to the clinical onset of AD was 6 years (1st and 3rd quartiles 3 and 8 years). The Kaplan-Meier survival curve in Fig. 2 shows that, about 30% participants had the clinical onset of AD at 10 years after baseline and about 46% at 15 years after baseline.
Table 1
Participant characteristics
| Variable | Value |
| Number of participants | 1,077 |
| Time to the clinical onset of AD (y) (median, 1st and 3rd quartiles) | 6 (3, 8) |
| Age at baseline visit (y) (mean, stdev) | 80.9 (7.3) |
| Male sex (n, %) | 247, 23% |
| Years of education (y) (mean, stdev) | 15 (3) |
| APOE ɛ4 carrier (n, %) | 226, 21% |
| Cognition score at baseline visit (normalized, a.u.) (mean, stdev) | 0.15 (0.53) |
| Interdaily stability (mean, stdev) [is]* | 0.53 (0.12) |
| Intradaily variability (mean, stdev) [iv]* | 0.72 (0.19) |
| Motor function (mean, stdev) | 1.02 (0.23) |
| Daily activity level (mean, stdev) | 2.75 (1.54) |
| Transition probability from activity to resting (median, 1st, 3rd quartiles) [kar]* | 0.06 (0.05, 0.08) |
| Transition probability from resting to activity (median, 1st, 3rd quartiles) [kra]* | 0.03 (0.02, 0.03) |
| Vascular disease burden+ (median, 1st and 3rd quartiles) | 0 (0, 1) |
| Vascular disease risk factor∧ (median, 1st and 3rd quartiles) | 1 (1, 2) |
*Abbreviation. +Including four vascular diseases: myocardial infarction, congestive heart failure, claudication, and stroke, ranges from 0 to 4. ∧Including three risk factors: hypertension, diabetes, and smoking, ranges from 0 to 3.
Fig. 2
Overall survival curve using Kaplan-Meier estimator. The shaded area represents the 95% confidence interval. The risk table at the bottom shows the number of participants at risk (who has not developed clinical AD) at different years after baseline visit. Here, at risk is defined as participants who have not developed clinical AD yet; censored is defined as participants lost-to-follow up due to any reason; and event is defined as being diagnosed of clinical AD.
Candidate timescales associated with incident clinical AD
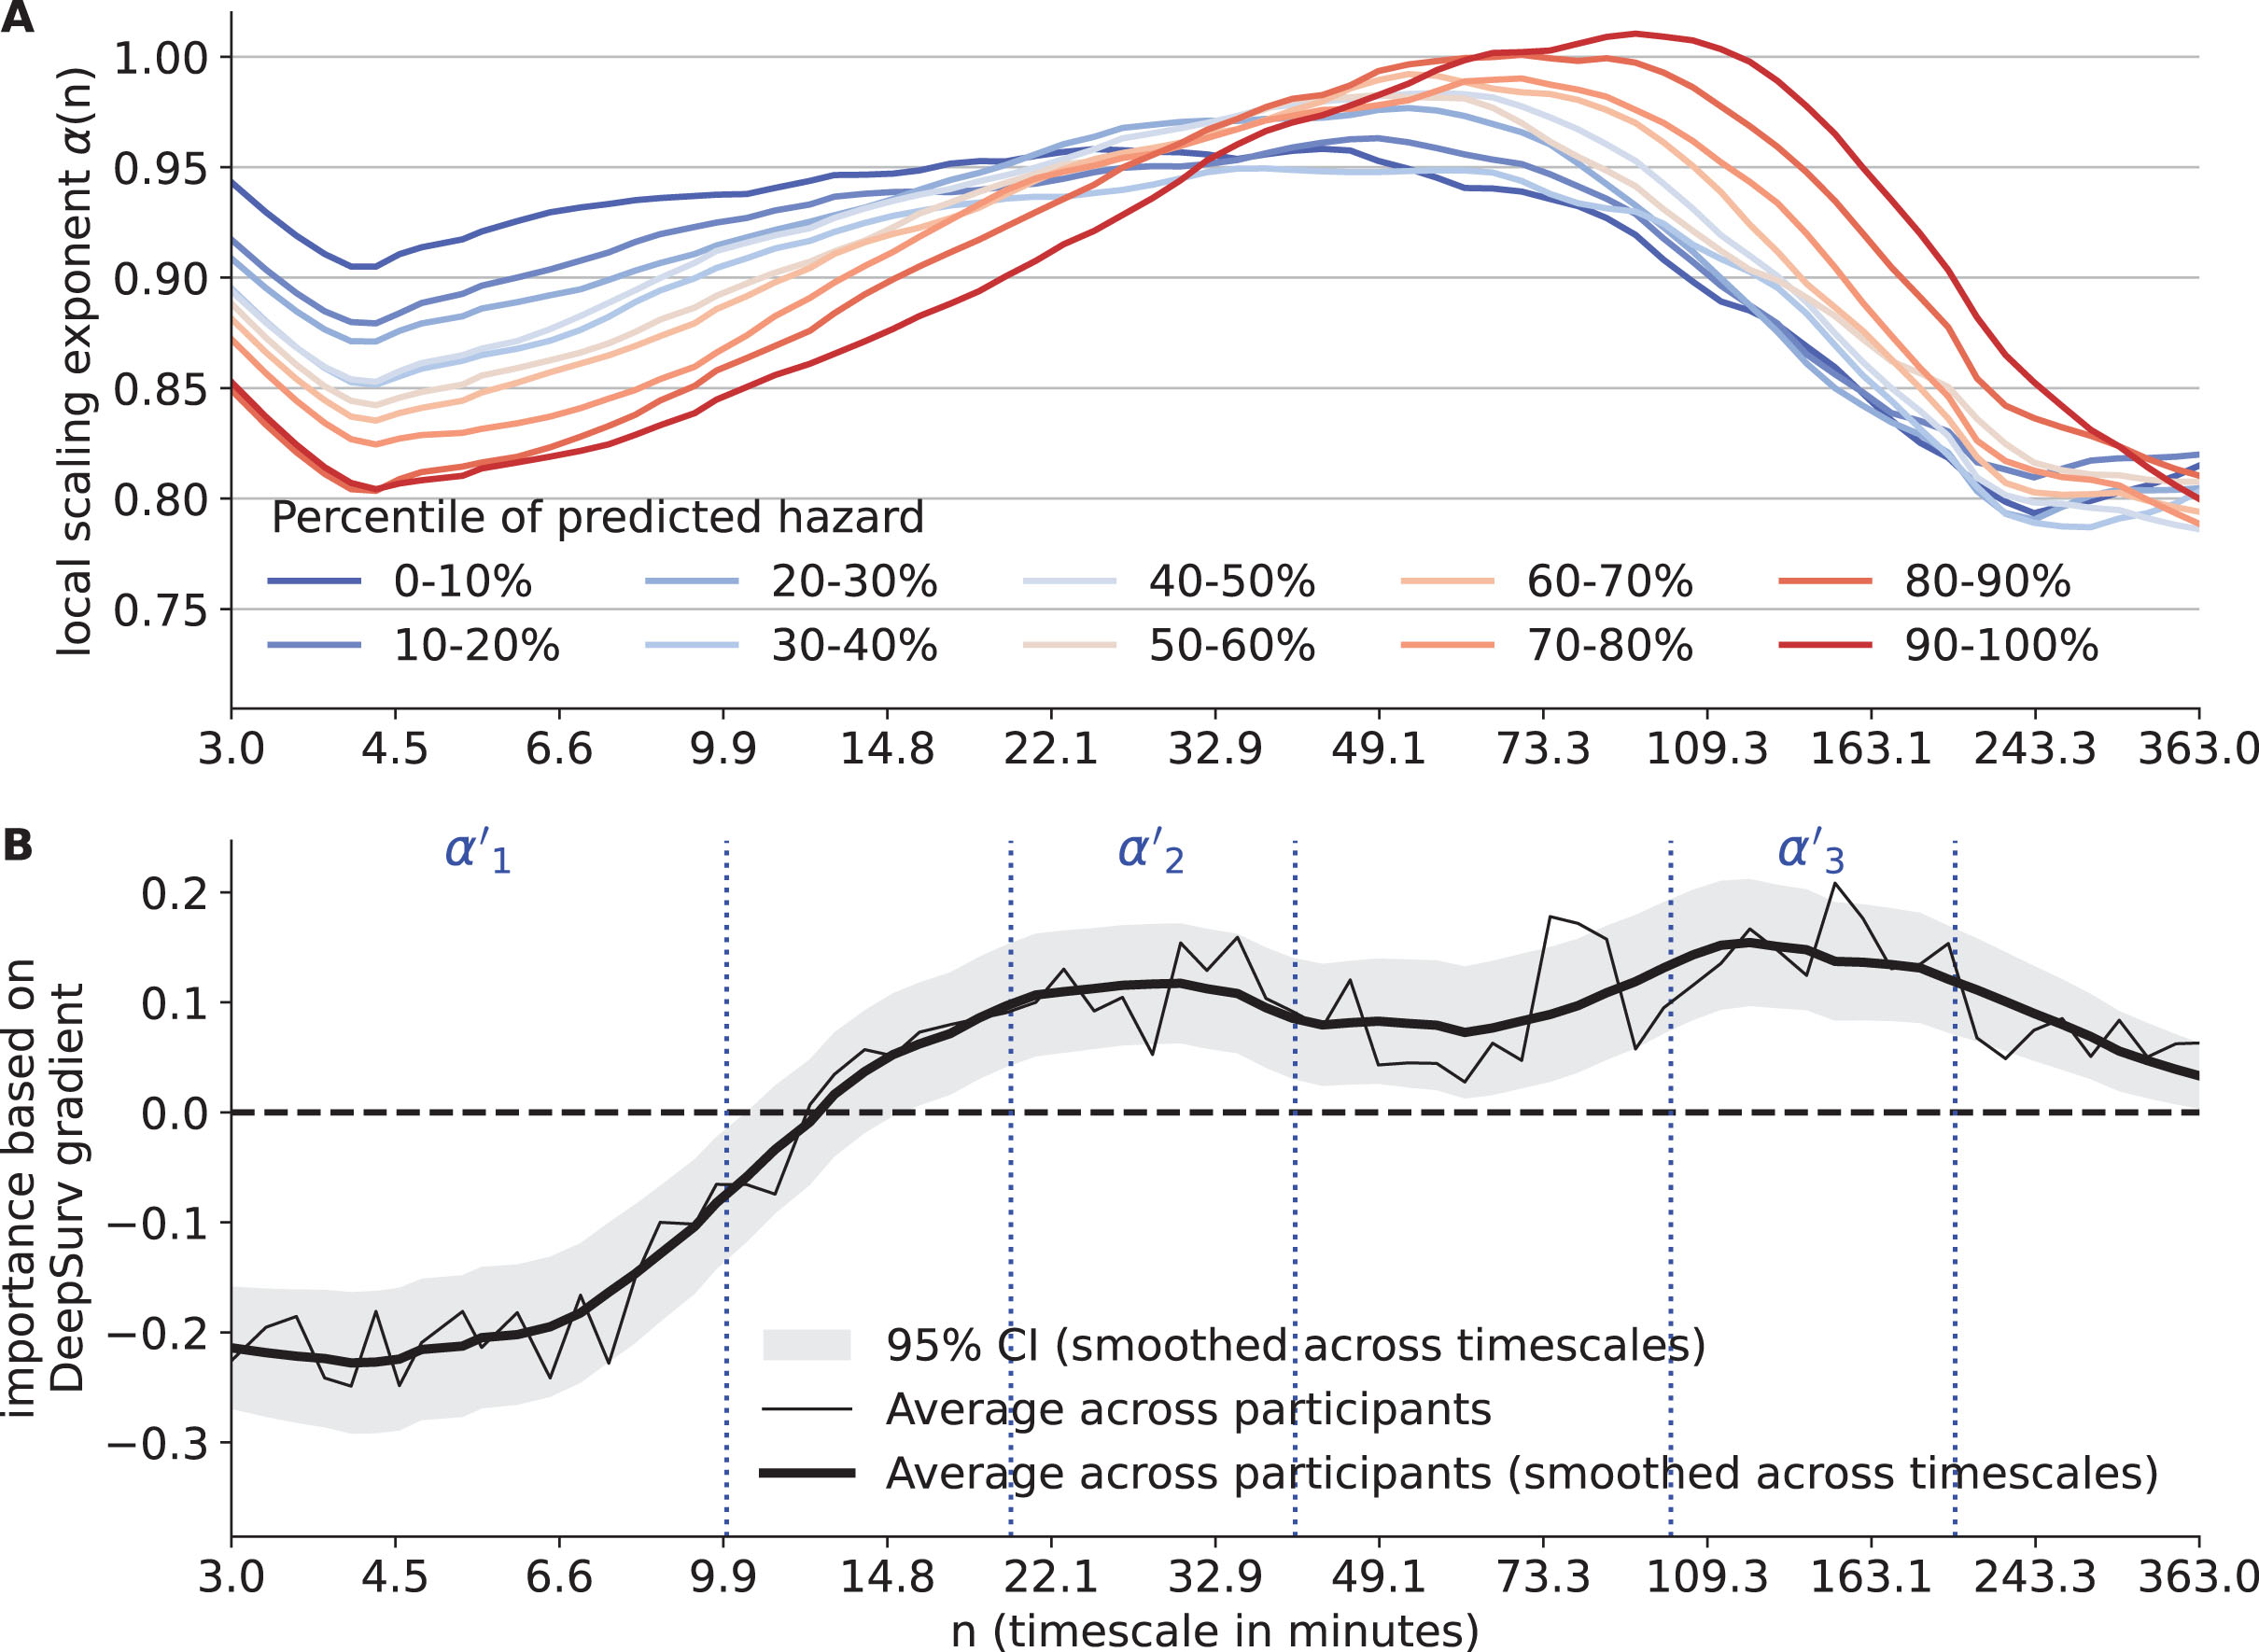
Between groups with different risk for clinical AD, the local scaling exponents α(n) showed the greatest and consistent difference at timescales n < 10 min (Fig. 3A). This observation was confirmed by the importance of α(n) from the DeepSurv model (Fig. 3B). The importance was significant at 0.05 level in three timescale regions: 1) <10 min, importance <0 such that larger α(n) was associated with a lower risk for clinical AD; 2) Between 20 to 40 min, importance > 0 such that larger α(n) was associated with a higher risk; 3) Between 100 to 200 min, importance >0 such that larger α(n) was associated with a higher risk.
Fig. 3
Results of deep learning for survival analysis. A) The average local scaling exponents α(n) of participants stratified by percentile of predicted hazards. The predicted hazards are obtained after adjusting for the covariates. The x-axis represents timescale n (in min). B) The importance based on the DeepSurv gradients for each local scaling exponent. The data were the averages of all participants. Both the raw (thin solid line) and smoothed curves (thick solid line) are shown. The horizontal dashed line indicates importance of 0, i.e., no effect. The vertical dashed lines indicate the borders of the three candidate timescales represented by α’1, α’2, and α’3.
To examine the potential effects of the collinearity among the α(n)’s at different timescales on the result in Fig. 3B, the univariate hazard ratio of each α(n) after adjusting for covariates was examined, which are not affected by the collinearity but noisier since being univariate (Supplementary Figure 6). The shape of the univariate hazard ratio as a function of n was similar to the shape of DeepSurv-derived importance in Fig. 3B, i.e., both their zero-crossing point were around 13 to 14 min and both the directionality of being harmful and beneficial to AD risk were the same. On the other hand, the univariate hazard ratios of α(n) had wider confidence interval compared to that in Fig. 3B, likely due to lower predictability of using only one local α(n). Overall, these results indicated that the identified timescale regions relevant to clinical AD risk (Fig. 3B) were reliable, not significantly affected by collinearity.
Validation of timescales associated with incident clinical AD
We next used the Cox and RSF models to validate the feature importance of the scaling exponents within the three candidate timescale regions identified by DeepSurv (<10 min: α’1; 20–40 min: α’2; 100–200 min: α’3). Note that α’1, α’2, and α’3 were not computed by averaging α(n), but by fitting a line to the timescale region. As shown in Table 2, both Cox and RSF models confirmed that α’1 among all scaling exponents contributed the most to the prediction of clinical AD. The direction of the impact of α’1 on hazard was also consistent with that observed in DeepSurv, i.e., larger α’1 for lower risk. For the impacts of α’2 and α’3, the impact directions in Cox and RSF models appeared to be consistent with those in DeepSurv but the effects did not reach the significance level (p values > 0.05).
Table 2
Feature importance of candidate scaling exponents based on Cox and RSF
| Model | Feature | Hazard ratio 15 years after baseline when increased 1 stdev |
| Cox | α’1: <10 min (stdev = 0.08) | 0.76 [0.66–0.87]* |
| α’2: 20 to 40 min (stdev = 0.09) | 0.98 [0.86–1.12] | |
| α’3: 100 to 200 min (stdev = 0.13) | 1.07 [0.95–1.20] | |
| Model | Feature | RSF feature importance (Reduction in Gini impurity) |
| RSF | α’1: <10 min | 9.8 [6.8–12.8] |
| α’2: 20 to 40 min | 0.1 [−0.9–1.2] | |
| α’3: 100 to 200 min | 2.0 [0.9–3.1] |
Contributions of FMAR alterations after adjusting for APOE ɛ4
To examine the effects of α’1, APOE ɛ4 status (1 for homozygous or heterozygous carrier and 0 otherwise), and their interaction, the Cox model was used while adjusting for age, sex, and education. Other covariates such as motor function and cognition based on clinical tests at baseline were not included because these covariates were linked to FMAR as reported previously and the current study was not focused on whether or how FMAR alterations predict the risk of AD via or independent of motor function and cognition. The hazard ratio for APOE ɛ4 carriers compared to non-carriers was 2.17 (95% CI: 1.65–2.84, p < 0.0001). The hazard ratio for α’1 remained statistically significant: for one standard deviation increase in α’1, the hazard ratio was 0.79 (95% CI: 0.70–0.91, p = 0.0013). The interaction between α’1 and APOE ɛ4 carrier was not statistically significant (p = 0.4).
Comparison to previous FMAR measure
We tested whether α’1 contributed to the risk for clinical AD, similar to or differently from the previously used scaling exponent at <90 min (α1). We performed analyses using Cox model, where we only adjust for age, sex, years of education, and APOE ɛ4 (Table 3). We selected Cox model because the model was used in a previous study to demonstrate the effect of α1 on the risk of clinical AD, and the Cox model had an equivalent performance compared to RSF and DeepSurv (next subsection).
Table 3
Hazard ratios and p-values of scaling exponents for prediction of clinical AD using Cox model
| Variable | Basic Model: Covariates only | Model A: Covariates +α1 | Model B: Covariates +α’1 | Model C: Covariates +α1, α’1 | Model D: Covariates + α’1, α’2, α’3 | |||||
| HR | p | HR | p | HR | p | HR | p | HR | p | |
| Age | 2.48 | 0.0** | 2.43 | 0.0** | 2.36 | 0.0** | 2.37 | 0.0** | 2.35 | 0.0** |
| Male sex | 1.06 | 0.37 | 1.05 | 0.42 | 1.03 | 0.66 | 1.03 | 0.60 | 1.03 | 0.67 |
| Education | 0.83 | 0.004* | 0.83 | 0.004* | 0.83 | 0.004* | 0.83 | 0.004* | 0.83 | 0.006* |
| APOE ɛ4 | 2.25 | 0.0** | 2.22 | 0.0** | 2.13 | 0.0** | 2.16 | 0.0** | 2.10 | 0.0** |
| α1 (<90 min) | / | / | 0.79 | 0.0** | / | / | 0.91 | 0.34 | / | / |
| α’1 (<10 min) | / | / | / | / | 0.76 | 0.0** | 0.82 | 0.04* | 0.76 | 0.0** |
| α’2 (20–40 min) | / | / | / | / | / | / | / | / | 0.98 | 0.76 |
| α’3 (100–200 min) | / | / | / | / | / | / | / | / | 1.07 | 0.28 |
*p < 0.05; **p < 0.001. HR, Adjusted hazard ratio 15 years after baseline when increased by 1 standard deviation.
When including α1 (<90 min) and α’1 (<10 min) in separate models (α1 in Model A and α’1 in Model B), we found that both were significantly associated with the risk of clinical AD (both p < 0.001). Consistently, α’1 and α1 were highly correlated (Spearman’s correlation 0.76, p < 0.001) (Supplementary Figure 4). When both α1 and α’1 were included in the same model (Model C), the contribution of α’1 remained significant (HR = 0.77, p = 0.009) while the contribution of α1 became not significant (p > 0.6). In Model D, the effects of α’2 and α’3 did not reach significance level.
Survival analysis performance
The C-index at 15 years of follow-up (averaged from the five testing sets) was similar in the Cox model and RSF models (Cox: 0.84, 95% confidence interval [0.81–0.87]; RSF: 0.82 [0.78–0.84]; p > 0.05 compared to Cox). The C-index was slightly but significantly lower in the DeepSurv (0.80 [0.78–0.81]). To confirm the importance of <10-min timescale, we repeated DeepSurv without <10-min timescale and obtained a C-index of 0.74 [0.72–0.76], which showed a statistically significant drop. Note that the 0.06 difference in C-index is considered numerically big because we obtained a C-index of 0.72 [0.70–0.74] by fitting another DeepSurv without age, a known important covariate, which corresponded to a 0.08 difference. The 3-to-9-year averaged cumulative/dynamic AUC was also similar in the Cox model and RSF (Cox: 0.88 [0.85–0.90]; RSF: 0.89 [0.86–0.90]; p > 0.05 compared to Cox) and was slightly lower in the DeepSurv (0.84 [0.83–0.86], p < 0.05 compared to both Cox and RSF). The cumulative/dynamic AUC showed a trend to decrease over the years since baseline, e.g., AUC in the DeepSurv = 0.86 after 3 years, 0.85 after 4 years, 0.85 after 5 years, 0.85 after 6 years, 0.84 after 7 years, 0.83 after 8 years, and 0.83 after 9 years. We also compared their survival curves of clinical AD during 15 years of follow-up in Supplementary Figure 7.
DISCUSSION
In this study, we systematically examined the temporal correlations of motor activity across a wide range of timescales (3 min to 6 h) and their associations with the clinical onset of AD (“Alzheimer’s dementia” used in Rush MAP) in the cohort of the Rush Memory and Aging Project. We showed that temporal correlations in these participants varied dramatically at different timescales (Fig. 3 and Supplementary Figure 8), suggesting loss of the scale-invariance and degraded FMAR. Our results showed that reduced temporal correlations (indicating more random motor activity fluctuations) at <10 min timescale was associated with increased risk for clinical AD.
Potential application of motor activity assessment in healthcare
Wearable devices allow collection of motor activity at a high sampling rate. The short-term activity fluctuations (at small timescales <90 min) attract attentions due to recent findings of their associations with mood disorders [4, 15], faster cognitive decline and risk for dementia [10], AD pathology in preclinical AD [11], and many other health outcomes such as frailty and disability in the elderly [14]. Our new results indicated that the pathophysiological alterations in FMAR linked to the development or clinical onset of AD is within the timescale of <10 min. This interpretation was supported by other findings: 1) α1 was correlated with both α’1 and α’2 (scaling exponent at timescales between 20–40 min) (α1 versus α’2: Spearman’s correlation 0.68, p < 0.001) (Supplementary Figure 4), but α’2 hardly predicted the clinical onset of AD (Table 2); and 2) the association between α1 and the clinical onset of AD became not significant when α’1 was included in the same model. In addition, we found that FMAR within 10 min estimated from one day was both reliable (Supplementary Figure 9) and enough for predicting onset of AD (Supplementary Figure 10). Thus, our findings support the potential of using actigraphy-based FMAR in continuous, long-term monitoring of the risk for dementia in older adults. One of the follow-up questions is how early altered FMAR can predict the risk for Alzheimer’s dementia. Relatedly, the observed decrease of the cumulative AUC over the time (Year 3–9 after baseline) in the DeepSurv suggests that FMAR might have a better performance in predicting the risk of Alzheimer’s dementia in a shorter term. Because AD-related neuropathology may progress silently for two decades before the onset of cognitive symptoms, further studies with more participants during a longer follow-up period are required to systematically determine the reliability of FMAR in the prediction at early preclinical stages.
Possible mechanisms of FMAR and its links to clinical AD
As proposed by Buchman et al., “motor function is not a unitary process” and “complexity and novelty of motor tasks demand increasing cognitive and sensory information processing for the accuracy of successful movements” [31]. Based on this theory, subtle changes in motor control such as more random activity fluctuations may reflect the effects of AD pathology on cognitive and sensory information processing in preclinical AD, which may explain the observed association between altered FMAR at small timescales and AD risk.
Another possible mechanism is related to sleep disturbances. There is evidence that sleep quality is linked to the pathology of amyloid-β (Aβ) in preclinical AD [32]; deep sleep enhances the glymphatic system that helps clear Aβ [33]; and sleep deprivation increases Aβ [34]. In this cohort, we did not find significant association of an actigraphy-based sleep fragmentation measure (kra, see Supplementary Tables 1 and 2) with incident clinical AD after controlling for FMAR measures and other covariates. In addition, kra was not significantly associated with FMAR at <10 min (α’1, Spearman’s correlation 0.026, p > 0.05) or in the other timescale regions linked to AD risk (20–40 min: α’2, Spearman’s correlation 0.034, p > 0.05; 100 to 200 min: α’3, Spearman’s correlation 0.028, p > 0.05) (Supplementary Figure 4). To formally confirm or refute that sleep disturbances are linked to temporal activity correlations at small timescales and contribute the FMAR-AD association, better sleep assessments based on polysomnography should be used to quantify sleep in future studies.
APOE ɛ4 status
The other important finding in the study was that the association between α’1 and the clinical onset of AD remains after adjusting for APOE ɛ4 status. It is important to note that genetics cannot fully explain the risk of developing AD and related dementias. The estimated heritability for AD is about 60% to 80% in a twin study [35]. The alternative risk factors for AD can be environmental conditions, lifestyle and scheduled daily activities such as smoking, air pollution, and shift work [36–38]. In addition, although APOE gene is the major genetic risk factor for AD, studies have continued to identify other risk loci [39], providing evidence for AD as a polygenic disorder. Thus, it is not surprising that the effect of fractal activity measures contributed to the risk for AD, after adjusting for APOE ɛ4 status. Consistently, our recent study showed that changes in fractal activity patterns were linked to AD pathology in preclinical AD, and the association was significant after adjusting for APOE ɛ4 status [11]. Changes in other non-cognitive physiological functions such as circadian variables have also been found to be linked to AD pathology, after adjusting for APOE ɛ4 status [40].
Limitations
Due to the historical reason (i.e., the Rush MAP was first launched in 1997), the NINCDS-ADRDA criteria established in 1984 was still the key criteria to determine the clinical onset of AD in the Rush MAP. Meanwhile, the 2011 NIA-AA guideline introduced the new criteria for clinical diagnosis of dementia due to AD [41], and the 2018 NIA-AA Research Framework further recommended certain changes in the criteria or terminology related to diagnosis of AD and related dementia [42]. This limitation may lead to certain misdiagnosis of AD based on clinical symptoms without pathological biomarkers. However, the potential effects on this and other studies in the Rush MAP should be minimized with the following two considerations: 1) The onset of dementia due to AD was based on the comprehensive cognitive assessments according to Rush MAP’s 4-step procedure (see details in the Methods Section). 2) Other types of dementia were also evaluated using other relevant criteria such that the diagnosis of dementia related to AD was not treated as a stand-alone evaluation. Thus, the cases of misdiagnosis related to other types of dementias should be rare.
The mechanisms underlying the temporal activity correlations within 10 min are yet to be determined. Observational/retrospective studies are inherently limited to addressing all questions comprehensively. Future prospective and mechanistic studies should be designed to examine the patterns during specific, relatively short task events using approaches such as video or other modalities to test whether the suggested timescales of fractal motor regulation can genuinely enhance the diagnosis of AD without significantly increasing the clinical burden.
This is a community-based cohort, reflecting the local demographics of participants, which may not be generalizable to a broader population. The other source of selection bias can come from recruitment, where some individuals might be more or less likely to be enrolled into the study than others (healthy cohort effect). The prospective nature of the Rush MAP helped alleviate this bias because the outcome was unknown at time of enrollment, making it less prone to selection bias.
Conclusion
The fluctuation pattern in motor activity varied dramatically at different timescales. More random fluctuations in motor activity at timescales within 10 min were associated with increased risk for incident clinical AD. The finding implies the potential of using a short actigraphy in identifying individuals at risk of AD. Future work is needed to study the longitudinal change of FMAR within 10 min over the course of the follow-up, the circadian influence over FMAR within 10 min, and the robustness against more survival analysis models.
AUTHOR CONTRIBUTIONS
Kun Hu (Conceptualization; Funding acquisition; Methodology; Resources; Supervision; Writing – review & editing); Haoqi Sun (Data curation; Formal analysis; Investigation; Methodology; Validation; Visualization; Writing – original draft; Writing – review & editing); Peng Li (Data curation; Formal analysis; Methodology; Writing – original draft; Writing – review & editing); Lei Gao (Data curation; Investigation; Methodology; Writing – review & editing); Jingyun Yang (Data curation; Writing – review & editing); Lei Yu (Data curation; Writing – review & editing); Aron S. Buchman (Data curation; Writing – review & editing); David A. Bennett (Data curation; Writing – review & editing); M. Brandon Westover (Conceptualization; Funding acquisition; Supervision; Writing – review & editing).
ACKNOWLEDGMENTS
The authors would like to thank the participants and staff of the Rush Memory and Aging Project and the Rush Alzheimer’s Disease Center.
FUNDING
This work was supported by the National Institutes of Health (grant numbers R01AG048108, RF1AG064312, RF1AG059867, R01AG083799, and R03AG067985), and the BrightFocus Foundation Alzheimer’s Research Program (A2020886 S).
CONFLICT OF INTEREST
Dr. Westover is a co-founder of Beacon Biosignal. The work presented here is not relevant to it.
DATA AVAILABILITY
The data supporting the findings of this study are available on request from the corresponding author or from the Memory and Aging Project at the Rush University Medical Center (RUMC) at https://www.radc.rush.edu.
SUPPLEMENTARY MATERIAL
[1] The supplementary material is available in the electronic version of this article: https://dx.doi.org/10.3233/JAD-230928.
REFERENCES
[1] | Sperling RA , Aisen PS , Beckett LA , Bennett DA , Craft S , Fagan AM , Iwatsubo T , Jack CR , Kaye J , Montine TJ , Park DC , Reiman EM , Rowe CC , Siemers E , Stern Y , Yaffe K , Carrillo MC , Thies B , Morrison-Bogorad M , Wagster MV , Phelps CH ((2011) ) Toward defining the preclinical stages of Alzheimer’s disease: Recommendations from the National Institute on Aging-Alzheimer’s Association workgroups on diagnostic guidelines for Alzheimer’s disease. Alzheimers Dement 7: , 280–292. |
[2] | Hu K , Ivanov PC , Chen Z , Hilton MF , Stanley HE , Shea SA ((2004) ) Non-random fluctuations and multi-scale dynamics regulation of human activity. Physica A 337: , 307–318. |
[3] | Hu K , Van Someren EJW , Shea SA , Scheer FAJL ((2009) ) Reduction of scale invariance of activity fluctuations with aging and Alzheimer’s disease: Involvement of the circadian pacemaker. Proc Natl Acad Sci U S A 106: , 2490–2494. |
[4] | Indic P , Salvatore P , Maggini C , Ghidini S , Ferraro G , Baldessarini RJ , Murray G ((2011) ) Scaling behavior of human locomotor activity amplitude: Association with bipolar disorder. PLoS One 6: , e20650. |
[5] | Aybek S , Ionescu A , Berney A , Chocron O , Aminian K , Vingerhoets FJG ((2012) ) Fractal temporal organisation of motricity is altered in major depression. Psychiatry Res 200: , 288–293. |
[6] | Goldberger AL , Amaral LAN , Hausdorff JM , Ivanov PC , Peng C-K , Stanley HE ((2002) ) Fractal dynamics in physiology: Alterations with disease and aging. Proc Natl Acad Sci U S A 99: (Suppl 1), 2466–2472. |
[7] | Pittman-Polletta BR , Scheer FAJL , Butler MP , Shea SA , Hu K ((2013) ) The role of the circadian system in fractal neurophysiological control. Biol Rev Camb Philos Soc 88: , 873–894. |
[8] | Bennett DA , Schneider JA , Buchman AS , Barnes LL , Boyle PA , Wilson RS ((2012) ) Overview and findings from the rush Memory and Aging Project. Curr Alzheimer Res 9: , 646–663. |
[9] | Li P , Yu L , Yang J , Lo M-T , Hu C , Buchman AS , Bennett DA , Hu K ((2019) ) Interaction between the progression of Alzheimer’s disease and fractal degradation. Neurobiol Aging 83: , 21–30. |
[10] | Li P , Yu L , Lim ASP , Buchman AS , Scheer FAJL , Shea SA , Schneider JA , Bennett DA , Hu K ((2018) ) Fractal regulation and incident Alzheimer’s disease in elderly individuals. Alzheimers Dement 14: , 1114–1125. |
[11] | Gao L , Li P , Gaba A , Musiek E , Ju Y-ES , Hu K ((2021) ) Fractal motor activity regulation and sex differences in preclinical Alzheimer’s disease pathology. Alzheimers Dement (Amst) 13: , e12211. |
[12] | Hu K , Harper DG , Shea SA , Stopa EG , Scheer FAJL ((2013) ) Noninvasive fractal biomarker of clock neurotransmitter disturbance in humans with dementia. Sci Rep 3: , 2229. |
[13] | Hu K , Riemersma-van der Lek RF , Patxot M , Li P , Shea SA , Scheer FA , Van Someren EJ ((2016) ) Progression of dementia assessed by temporal correlations of physical activity: Results from a 3.5-year, longitudinal randomized controlled trial. Sci Rep 6: , 27742. |
[14] | Li P , Lim ASP , Gao L , Hu C , Yu L , Bennett DA , Buchman AS , Hu K ((2019) ) More random motor activity fluctuations predict incident frailty, disability, and mortality. Sci Transl Med 11: , eaax1977. |
[15] | Knapen SE , Li P , Riemersma-van der Lek RF , Verkooijen S , Boks MPM , Schoevers RA , Scheer FAJL , Hu K ((2021) ) Fractal biomarker of activity in patients with bipolar disorder. Psychol Med 1: , 1562–1569. |
[16] | Peng CK , Buldyrev SV , Havlin S , Simons M , Stanley HE , Goldberger AL ((1994) ) Mosaic organization of DNA nucleotides. Phys Rev E Stat Phys Plasmas Fluids Relat Interdiscip Topics 49: , 1685–1689. |
[17] | Hu K , Ivanov PC , Chen Z , Carpena P , Stanley HE ((2001) ) Effect of trends on detrended fluctuation analysis. Phys Rev E 64: , 011114. |
[18] | McKhann G , Drachman D , Folstein M , Katzman R , Price D , Stadlan EM ((1984) ) Clinical diagnosis of Alzheimer’s disease Report of the NINCDS-ADRDA Work Group* under the auspices of Department of Health and Human Services Task Force on Alzheimer’s Disease. Neurology 34: , 939–939. |
[19] | Bennett DA , Schneider JA , Aggarwal NT , Arvanitakis Z , Shah RC , Kelly JF , Fox JH , Cochran EJ , Arends D , Treinkman AD , others ((2006) ) Decision rules guiding the clinical diagnosis of Alzheimer’s disease in two community-based cohort studies compared to standard practice in a clinic-based cohort study. Neuroepidemiology 27: , 169–176. |
[20] | Román GC , Tatemichi TK , Erkinjuntti T , Cummings J , Masdeu J , Garcia J , Amaducci L , Orgogozo J-M , Brun A , Hofman A , others ((1993) ) Vascular dementia: Diagnostic criteria for research studies: Report of the NINDS-AIREN International Workshop. Neurology 43: , 250–250. |
[21] | Langston JW , Widner H , Goetz CG , Brooks D , Fahn S , Freeman T , Watts R ((1992) ) Core assessment program for intracerebral transplantations (CAPIT). Mov Disord 7: , 2–13. |
[22] | Hamilton M ((1960) ) A rating scale for depression. J Neurol Neurosurg Psychiatry 23: , 56. |
[23] | Buchman AS , Wilson RS , Leurgans SE , Bennett DA , Barnes LL ((2015) ) Change in motor function and adverse health outcomes in older African-Americans. Exp Gerontol 70: , 71–77. |
[24] | Buchman AS , Yu L , Boyle PA , Shah RC , Bennett DA ((2012) ) Total daily physical activity and longevity in old age. Arch Intern Med 172: , 444–446. |
[25] | Buchman AS , Boyle PA , Yu L , Shah RC , Wilson RS , Bennett DA ((2012) ) Total daily physical activity and the risk of AD and cognitive decline in older adults. Neurology 78: , 1323–1329. |
[26] | Lim ASP , Yu L , Costa MD , Buchman AS , Bennett DA , Leurgans SE , Saper CB ((2011) ) Quantification of the fragmentation of rest-activity patterns in elderly individuals using a state transition analysis. Sleep 34: , 1569–1581. |
[27] | Van Someren EJ , Swaab DF , Colenda CC , Cohen W , McCall WV , Rosenquist PB ((1999) ) Bright light therapy: Improved sensitivity to its effects on rest-activity rhythms in Alzheimer patients by application of nonparametric methods. Chronobiol Int 16: , 505–518. |
[28] | Schiepers OJG , Harris SE , Gow AJ , Pattie A , Brett CE , Starr JM , Deary IJ ((2012) ) APOE E4 status predicts age-related cognitive decline in the ninth decade: Longitudinal follow-up of the Lothian Birth Cohort 1921. Mol Psychiatry 17: , 315–324. |
[29] | Katzman JL , Shaham U , Cloninger A , Bates J , Jiang T , Kluger Y ((2018) ) DeepSurv: Personalized treatment recommender system using a Cox proportional hazards deep neural network. BMC Med Res Methodol 18: , 1–12. |
[30] | Ishwaran H , Kogalur UB , Blackstone EH , Lauer MS ((2008) ) Random survival forests. Ann Appl Stat 2: , 841–860. |
[31] | Buchman AS , Bennett DA ((2011) ) Loss of motor function in preclinical Alzheimer’s disease. Expert Rev Neurother 11: , 665–676. |
[32] | Ju Y-ES , McLeland JS , Toedebusch CD , Xiong C , Fagan AM , Duntley SP , Morris JC , Holtzman DM ((2013) ) Sleep quality and preclinical Alzheimer disease. JAMA Neurol 70: , 587–593. |
[33] | Fultz NE , Bonmassar G , Setsompop K , Stickgold RA , Rosen BR , Polimeni JR , Lewis LD ((2019) ) Coupled electrophysiological, hemodynamic, and cerebrospinal fluid oscillations in human sleep. Science 366: , 628–631. |
[34] | Shokri-Kojori E , Wang G-J , Wiers CE , Demiral SB , Guo M , Kim SW , Lindgren E , Ramirez V , Zehra A , Freeman C , others ((2018) ) β-Amyloid accumulation in the human brain after one night of sleep deprivation. Proc Natl Acad Sci U S A 115: , 4483–4488. |
[35] | Gatz M , Reynolds CA , Fratiglioni L , Johansson B , Mortimer JA , Berg S , Fiske A , Pedersen NL ((2006) ) Role of genes and environments for explaining Alzheimer disease. Arch Gen Psychiatry 63: , 168–174. |
[36] | Durazzo TC , Mattsson N , Weiner MW , Initiative ADN ((2014) ) Smoking and increased Alzheimer’s disease risk: A review of potential mechanisms. Alzheimers Dement 10: , S122–S145. |
[37] | Bokenberger K , Sjölander A , Dahl Aslan AK , Karlsson IK , Åkerstedt T , Pedersen NL ((2018) ) Shift work and risk of incident dementia: A study of two population-based cohorts. Eur J Epidemiol 33: , 977–987. |
[38] | He F , Tang J , Zhang T , Lin J , Li F , Gu X , Chen A , Nevill A , Chen R ((2022) ) Impact of air pollution exposure on the risk of Alzheimer’s disease in China: A community-based cohort study. Environ Res 205: , 112318. |
[39] | Bagyinszky E , Youn YC , An SSA , Kim S ((2014) ) The genetics of Alzheimer’s disease. Clin Interven Aging 9: , 535. |
[40] | Musiek ES , Bhimasani M , Zangrilli MA , Morris JC , Holtzman DM , Ju Y-ES ((2018) ) Circadian rest-activity pattern changes in aging and preclinical Alzheimer disease. JAMA Neurol 75: , 582–590. |
[41] | McKhann GM , Knopman DS , Chertkow H , Hyman BT , Jack CR , Kawas CH , Klunk WE , Koroshetz WJ , Manly JJ , Mayeux R , Mohs RC , Morris JC , Rossor MN , Scheltens P , Carrillo MC , Thies B , Weintraub S , Phelps CH ((2011) ) The diagnosis of dementia due to Alzheimer’s disease: Recommendations from the National Institute on Aging-Alzheimer’s Association workgroups on diagnostic guidelines for Alzheimer’s disease. Alzheimers Dement 7: , 263–269. |
[42] | Jack CR , Bennett DA , Blennow K , Carrillo MC , Dunn B , Haeberlein SB , Holtzman DM , Jagust W , Jessen F , Karlawish J , Liu E , Molinuevo JL , Montine T , Phelps C , Rankin KP , Rowe CC , Scheltens P , Siemers E , Snyder HM , Sperling R , Elliott C , Masliah E , Ryan L , Silverberg N ((2018) ) NIA-AA Research Framework: Toward a biological definition of Alzheimer’s disease. Alzheimers Dement 14: , 535–562. |


