
Characteristics of T Cells in Single-Cell Datasets of Peripheral Blood and Cerebrospinal Fluid in Alzheimer’s Disease Patients
Abstract
Background:
Alzheimer’s disease (AD) is the most common type of dementia, causing a huge socioeconomic burden. In parallel with the widespread uptake of single-cell RNA sequencing (scRNA-seq) technology, there has been a rapid accumulation of data produced by researching AD at single-cell resolution, which is more conductive to explore the neuroimmune-related mechanism of AD.
Objective:
To explore the potential features of T cells in the peripheral blood and cerebrospinal fluid of AD patients.
Methods:
Two datasets, GSE181279 and GSE134578, were integrated from GEO database. Seurat, Monocle, CellChat, scRepertoire, and singleR packages were mainly employed for data analysis.
Results:
Our analysis demonstrated that in peripheral blood, T cells were significantly expanded, and these expanded T cells were possessed effector function, such as CD8+TEMRA, CD4+TEMRA, and CD8+TEM. Interestingly, CD8+TEMRA and CD4+TEMRA cells positioned adjacently after dimensions reduction and clustering. Notably, we identified that the expanded T cells were developed from Naïve T cells and TCM cells, and TEM cells was in the intermediate state of this developing process. Additionally, in cerebrospinal fluid of AD patients, the amplified T cells were mainly CD8+TEMRA cells, and the number and strength of communication between CD4+TEM, CD8+TEM, and CD8+TEMRA were decreased in AD patients.
Conclusions:
Our comprehensive analyses identified the cells in cerebrospinal fluid from AD patients are expanded TEMRA or TEM cells and the TEMRA cells communicating with other immune cells is weakened, which may be an important immune feature that leads to AD.
INTRODUCTION
Alzheimer’s disease (AD) is the most common type of dementia, causing a huge socioeconomic burden. Its main pathological manifestations are the deposition of extracellular amyloid-β (Aβ) and neurofibrillary tangles composed of intracellular phosphorylated tau proteins. However, the pathogenesis of AD cannot be fully explained by the classical hypothesis of Aβ and tau [1]. In recent years, genetic, clinical, and preclinical experimental studies have revealed that neuroinflammation plays an important role in the progression of AD disease [2–4], and many studies have suggested that the innate immune system is mainly involved in the course of AD, with most of them agreeing that neuroinflammation is mainly associated with microglia [5, 6]. In addition, there is also a majority of opinion that peripheral immune cells such as macrophages [7], neutrophils [8], and lymphocytes [9–14] can infiltrate the brain to involve in the immune response. As a result, the role of lymphocytes in AD pathology has accumulated a large number of studies in recent years [15, 16]. One study demonstrated that CD8+ T cells were amplified in the cerebrospinal fluid (CSF) of AD patients and elevated in the blood. At the same time, the team also found that CD3+ and CD8+ T cells could infiltrate into the area of amyloid lesions through transgenic mice, and these infiltrated cells closely interact with microglia [17], but the specific mechanism remains unsolved.
As a complex disease with multicellular involvement, the immune components are highly heterogeneous. At present, through the analysis of bulk transcriptome, proteomics, metabolomics, and epigenomics data, it can be found that the decline of nerve cell function in AD patients is related to the enhancement of innate immune response [18], but the omics data limited the discover of intercellular communication and heterogeneity within cells with high resolution, especially for cells with low gene or protein expression [19]. And the population or state of these cells is also critical. Therefore, using single cell RNA sequencing technology (scRNA-seq) to reveal the heterogeneity of immune cells in course of AD may be the best way to reveal the relationship between AD pathogenesis and immune cells. The use of scRNA-seq to study the immune mechanism of AD has yielded many pioneering theories. In 2020, Professor Coray and Professor Mark M. Davis of Stanford University published a study in Nature, they demonstrated the clonal expansion of T cells in CSF of AD patients [20], which leads to better understanding of adaptive immunity in the field of AD.
In this study, the dataset obtained from single-cell sequencing of AD in the GEO database was used to perform linear dimension reduction, subsets clustering, marker gene identification, peripheral blood immune cell subsets identification, peripheral blood T cell subsets identification, and CD8+ T cell subpopulations in CSF. Through the above analysis, we can describe the changes of immune cells, especially T cells, in AD patients, and explore the potential role of the changes of immune components in peripheral blood and central system in the pathological process of AD. This will help to correctly understand the role of the immune system in course of AD, and provide an important reference for the discovery of new immune-related biomarkers in the future, so as to provide a new research direction for the treatment of AD.
MATERIALS AND METHODS
Cellular dimensionality reduction and clustering subgroup analysis
In general, similar cell subpopulations exist with similar gene profiles, so the gene expression data of each cell can be used to cluster genetically similar cells into one class by clustering, so that the cells clustered together are a cell subpopulation. Since there are batches of samples in the collected data, Harmony’s method is used to correct the batch effect of single-cell expression profile data.
To retain high quality cells, we filtered the downloaded matrix again with filtering conditions including: 1) The number of genes identified in single cells was in the range of 200–4000; 2) The total number of unique molecular identifiers (UMIs) in a single cell is less than 15000; 3) The amount of mitochondrial gene expression in a single cell was less than 20%.
Data collection and software use
The GSE181279 [21] and GSE134578 datasets [20] were downloaded from the GEO database. The GSE181279 dataset was based on peripheral blood mononuclear cells (PBMC) isolated by density gradient centrifugation, and PBMC were isolated by flow cytometry to obtain CD45+ immune cells. This dataset was sequenced by Illumina NovaSeq 6000 platform and analyzed 36849 PBMC from peripheral blood of AD and normal controls (NC) for the percentage of intrinsic and adaptive immune cell types and their associated gene expression patterns. This dataset was compared with the reference genome (hg19) by Cell Ranger software (version 3.0.2, 10X Genomics) and the gene expression matrix was obtained after data quality control. The GSE134578 dataset was extracted from PBMC by Ficoll density gradient centrifugation, and the differences in clonal amplification of T cell subpopulations in AD patients and NC in vivo were evaluated by single-cell T cell receptor (TCR) sequencing and scRNA-seq methods. The dataset was sequenced on a GPL20301 Illumina HiSeq 4000 platform, and the gene expression matrix was obtained by Cell Ranger (version 3.0.2, 10X Genomics) against the reference genome (GRCh38 3.0.0) and after data quality control.
Marker gene identification
Differential analysis and marker gene identification were performed using the Seurat package to find differentially upregulated expressed genes in each cell subpopulation relative to other cell subpopulations, and these differentially expressed genes were potential marker genes for each cell subpopulation, which were mapped using the FeaturePlot and DoHeatmap functions.
Two datasets from the GEO database were analyzed using this method to classify subpopulations based on marker genes
Cell type identification
The cell type identification is based on the SingleR [22] package to correlate the identified cell expression profile with the gene expression of the reference cells, and the cell type to be identified is the one with the highest correlation with the reference cells. This way of using the reference database to identify the cell type largely removes the influence of subjective thoughts. The algorithm principle is to analyze the Spearman correlation of each cell in the sample with the expression profile of each cell that has been annotated, and then select the cell type with the highest correlation as the target identified cell type based on the calculated correlation. For the secondary type identification of T cells, due to the lack of a robust reference data set, a manual annotation approach is used, i.e., the known marker genes are used to compare with the gene expression profile of each cell in the sample, and the cell with high marker gene expression is selected as the final identified cell type.
Pseudo-time analysis of CD4+ and CD8+ T Cells
Pseudo-time analysis is a method to simulate the degree of cell development and differentiation progress by establishing a pseudo-time sequence, which is a visualization of an abstract biological process, and studies the process of mapping the state of development of a cell to a pseudo-time trajectory, calculating the sequence of gene expression in pseudo-time and thus infer the developmental state of that cell. All biological states to occur in a cell from the initial process to the developmental endpoint define the pseudo-temporal developmental trajectory, which changes as the transcriptome changes. The proposed temporal analysis uses the Monocle software package [23]. The principle is to simulate the cell developmental trajectory based on the order of gene appearance on the pseudo-time series, and to learn them by machine. The analysis method is to analyze the differential expression changes of genes and select the genes with large expression differences between cells, then infer and learn from their gene expression relationships to complete the construction of a minimum spanning tree (MST), and then use the MST to fit the longest path as the trajectory of cell differentiation and development.
Analysis of T-cell cell communication in CSF
The software package used for cellular communication analysis is CellChat, which probabilistically models cellular communication based on comprehensive information on the expression of signaling ligands, receptors, and cofactor genes, as well as a priori knowledge of their interactions, and further visualizes the data after inferring intercellular communication networks [24]. The flow of CellChat analysis in this study is shown in Fig. 1.
Fig. 1
The flowchart of CellChat analysis.

RESULTS
Alteration of the proportion of immune cells in the peripheral blood of AD
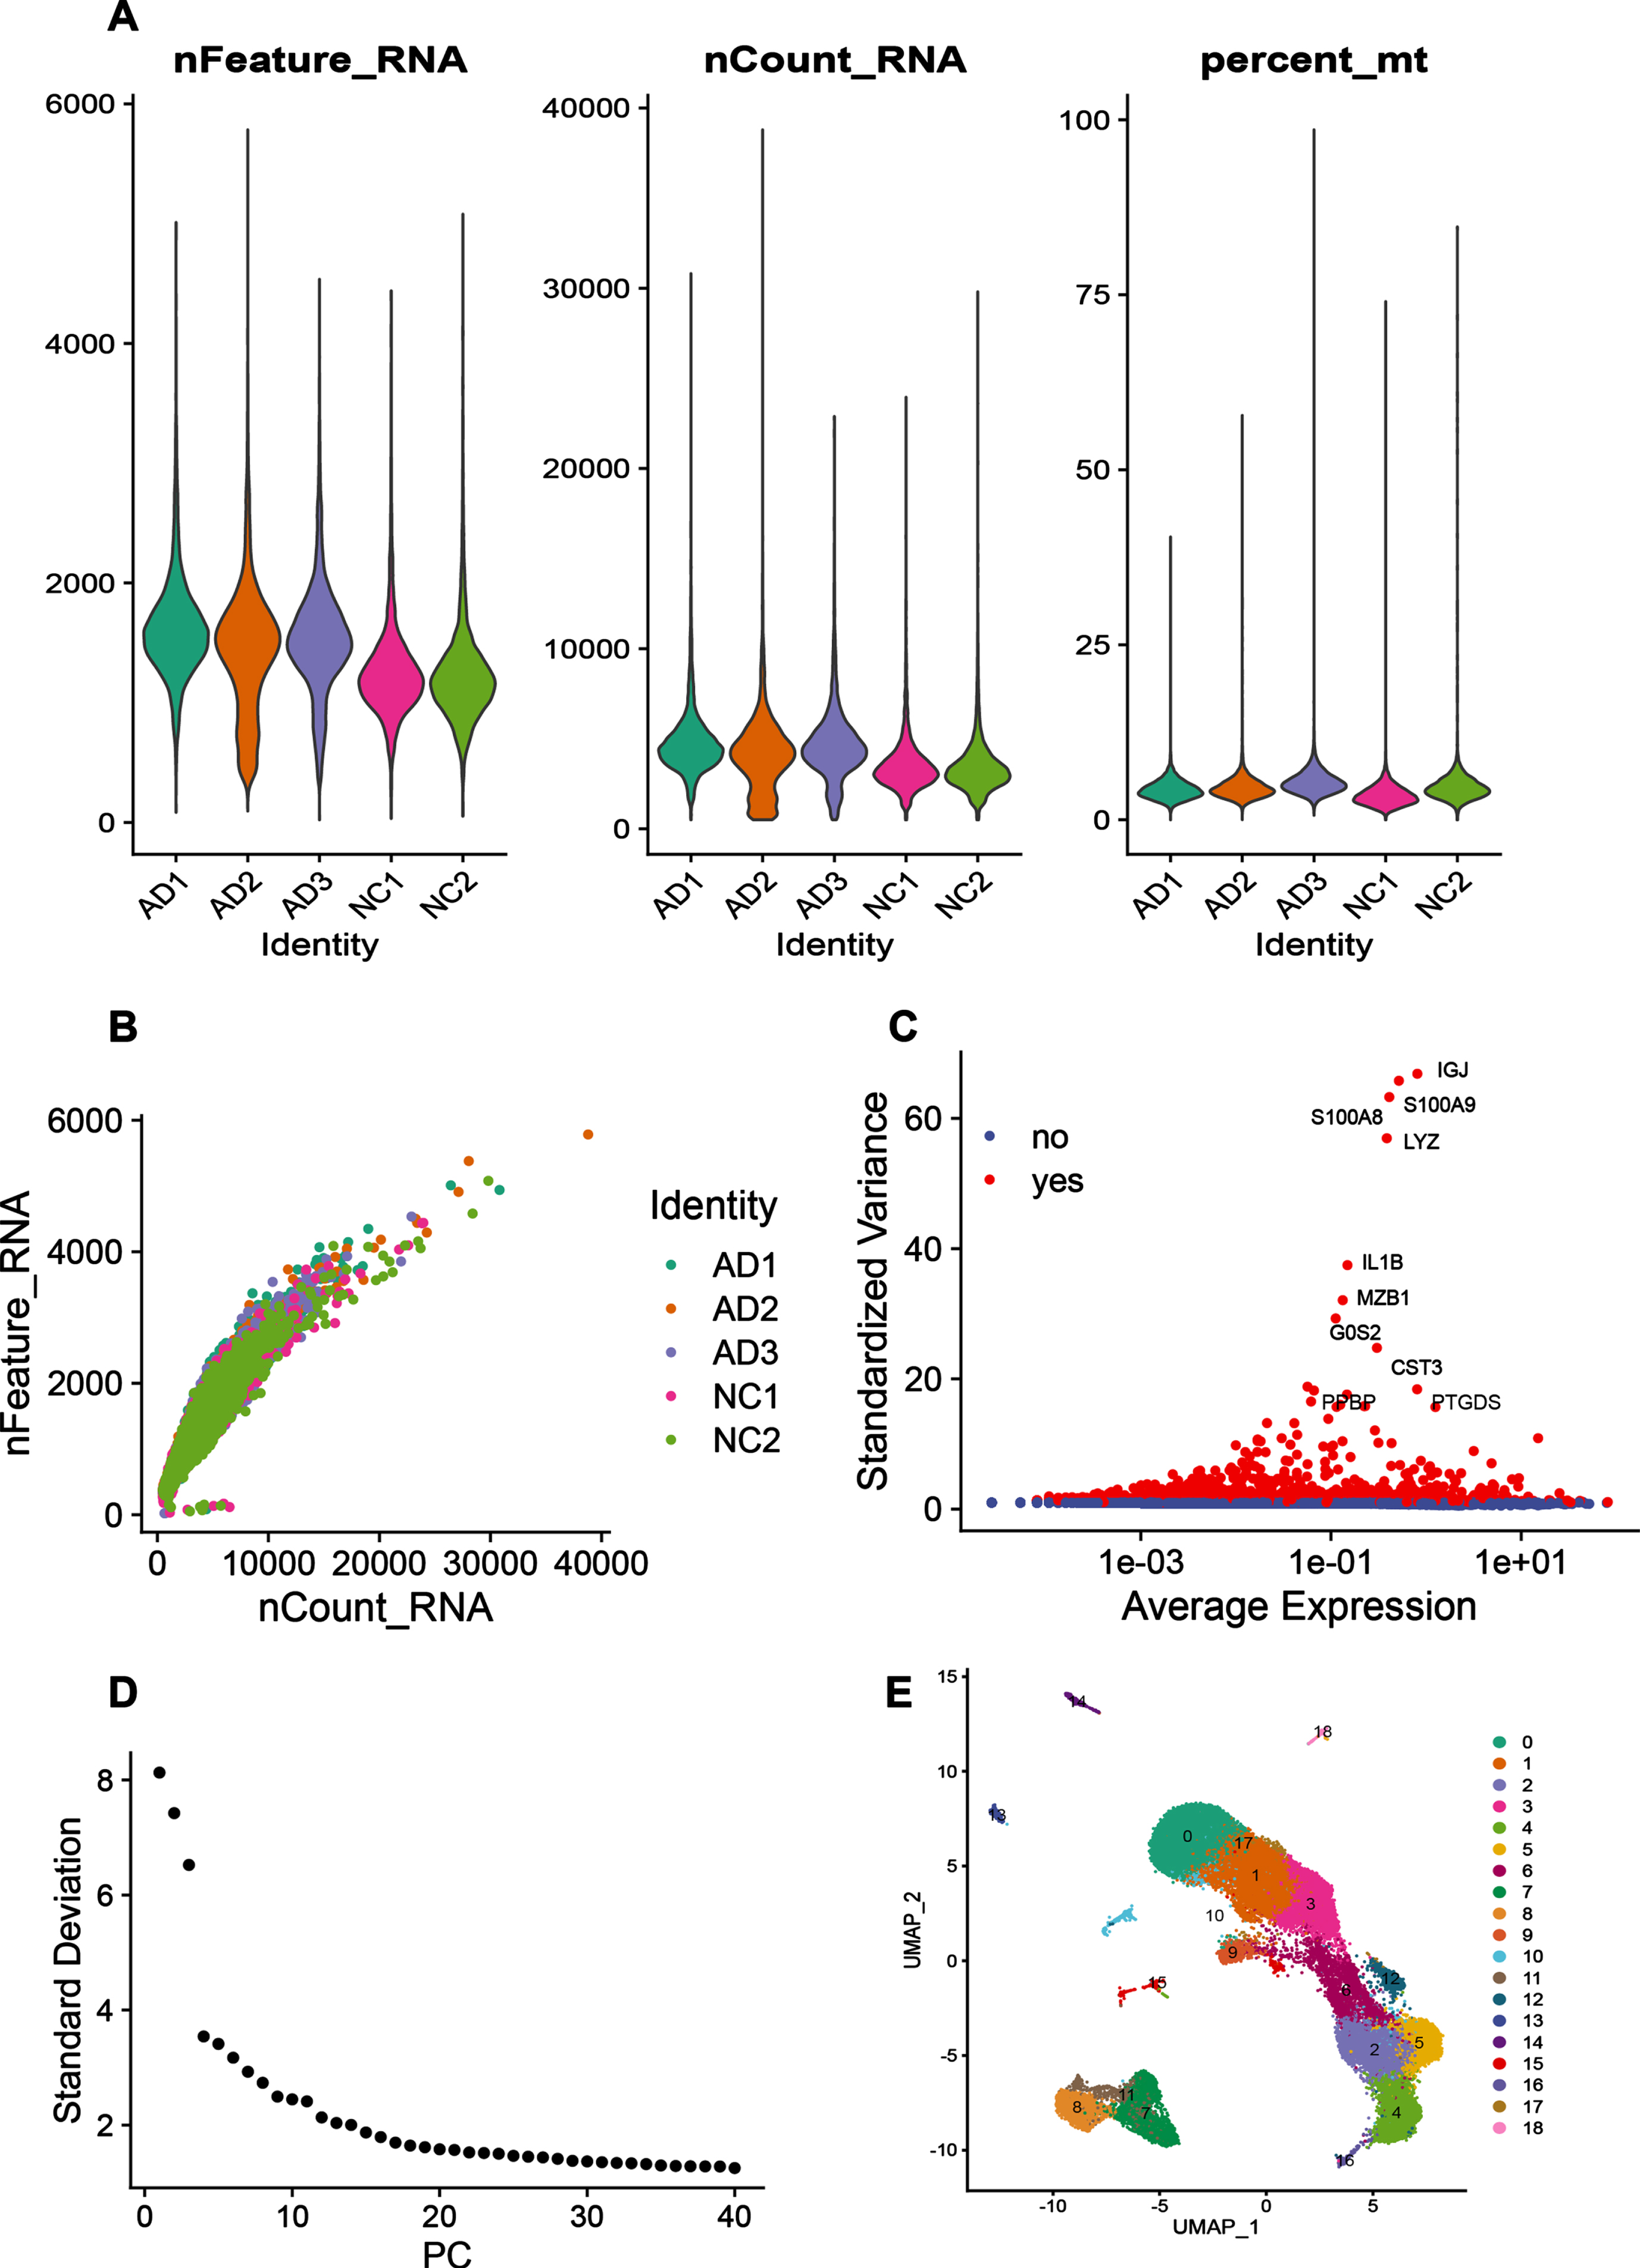
The GSE181279 dataset includes a total of 36,849 PBMCs, including 22,775 for AD patients and 14,074 for NC, information on the patient’s clinical samples is provided in Supplementary, and there are no age or sex differences between the two groups. The nFeature_RNA number of this dataset represents the number of gene expression per cell, which is less than 2000; nCount_RNA number represents the number of UMI, which is less than 10000; Percent_mt represents the percentage of mitochondria, which is less than 20% (Fig. 2A). And the nCount_RNA number was positively correlated with the nFeature_RNA number (Fig. 2B). Preliminary analysis of the dataset identified the top 10 highly variable genes, two of which, S100A8 and S100A9, were calcium-binding proteins highly expressed under inflammatory conditions (Fig. 2C). Downstream cluster analysis was performed by PCA linear dimensionality reduction with the top 30 PCs (Fig. 2D), and 18 cell subgroups could be identified after Harmony package removing batch effects between samples (Fig. 2E).
Fig. 2
Quality control of immune cell data in peripheral blood of AD patients. A) The number of genes (nFeature_RNA), the number of UMIs (nCount_RNA), and the percentage of mitochondrial content (percent_mt) in each cell of the single-cell sequencing dataset. The graph from left to right reflects the number of genes expressed per cell, the number of UMIs per cell, and the percentage of mitochondrial genes per cell in each individual respectively. As the mitochondrial genes in a cell is lower, the state of cell is better. B) The correlation plot between the number of genes in each sample and the number of UMIs. C) Red color indicates highly variable genes in the samples, whose expression significantly differed from compared to other genes. The top 10 genes with the largest differences in expression are shown in the graph. D) ElbowPlot, the number of principal components can be selected based on this plot when doing PCA linear dimensionality reduction analysis, and the value at the point where the curve falls more gently is generally selected as the number of principal components. E) UMAP clustering plot, which visualizes the clustering results of the data set.
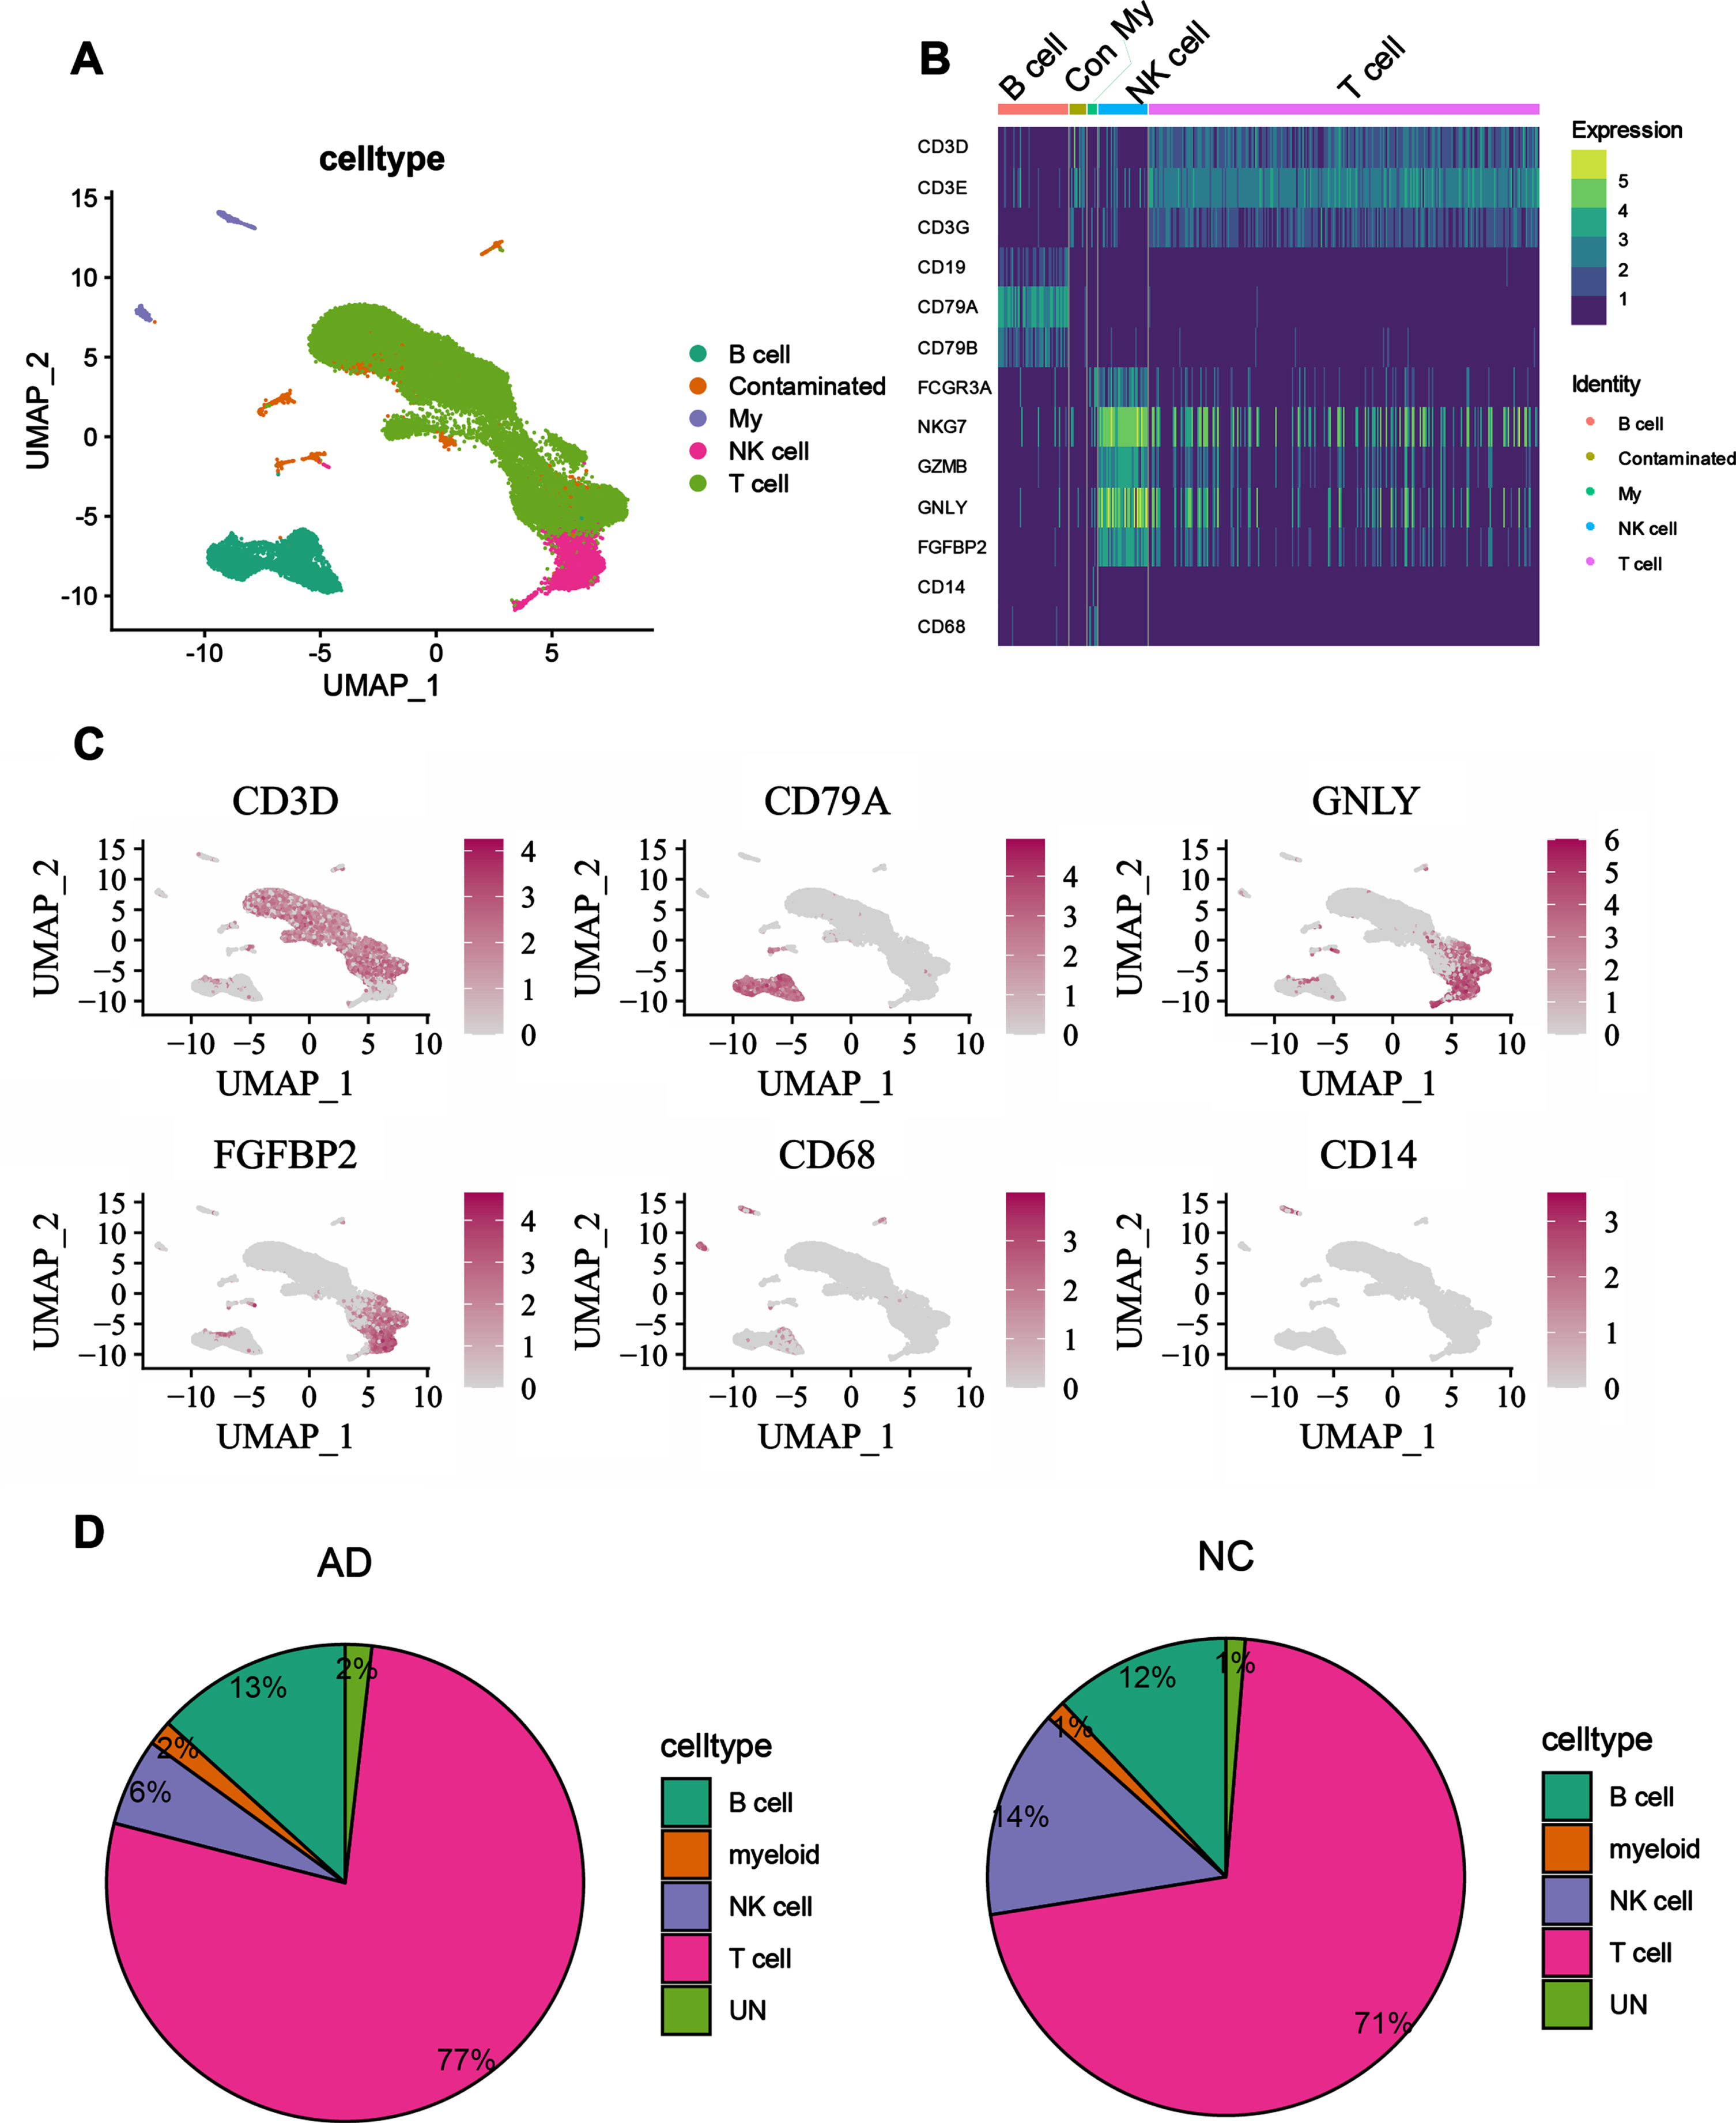
Those cell subpopulations were annotated based on differential genes, and the annotated cell types could be visualized by UMAP plots (Fig. 3A). The annotation results showed that T cells (CD4+, CD8+ T cells), NK cells, B cells, and myeloid cells (mononuclear macrophages) could be identified in the peripheral blood of AD patients and NC, and T cells accounted for the largest proportion of the peripheral blood. To verify the plausibility and accuracy of cell type identification, marker genes of known cell types were visualized in heat map (Fig. 3B), and the identified cell types were consistent with the known cell type marker genes. To further illustrate the accuracy of the annotation, marker genes of known cells were mapped to the UMAP as well (Fig. 3C), from which it can be seen that the region mapped by marker genes matches the identified cell types. Both results illustrate the accuracy of the annotation during the analysis. By comparing peripheral blood immune cell types and ratios of AD patients with NC, differences were found in the ratios of each cell type between them. We found that the ratio of T cells was higher in AD patients than in NC, a phenomenon suggestive of an expanded state of T cells in the peripheral blood of AD patients. But the ratio of NK cells was higher in the peripheral blood of NC than in AD patients, a result that implies that the innate immune system of AD patients may be somewhat weakened, while the adaptive immune system is strengthened. In the analysis of this study, the difference between B cells and myeloid cells was not particularly significant between AD patients and NC (Fig. 3D).
Fig. 3
Alteration of the proportion of immune cells in the peripheral blood of AD patients. A) UMAP plot showing annotation of cell types, different cell types are marked with different colors. B) Heatmap of gene expression, known marker genes are expressed in the annotated cells, the deeper the color, the higher the gene expression. C) FeaturedPlot graph, the mapping of known marker genes to annotated cell subpopulations, the darker red represents higher expression on that subpopulation. D) Proportional distribution of each cell subpopulation in AD and NC patients, with larger areas indicating a larger proportion of that subpopulation.
T cells in AD patients are mainly T cells with effector functions
From the above dataset, we focused on T cells and extracted them for subclustering analysis, and identified T cells as CD4+ T cells, CD8+ T cells and CD4+ CD8+ double positive (DP) cells based on their expression of different marker genes. CD4+ T cells were subdivided into CD4+ Naïve T cells, CD4+ TCM (central memory T cells) cells, CD4+ TEM (Effector memory T cells) cells and CD4+ TEMRA cells (Terminal differentiated effector memory CD45RA+ cells). CD8+T cells were further divided into CD8+ Naïve T cells, CD8+ TEM cells, and CD8+ TEMRA cells. The marker genes identified for each group of T cell subpopulation are shown as bubble plots (Fig. 4A).
Fig. 4
T cells in the peripheral blood of AD patients are mainly T cells with effector functions. A) The bubble plot shows the marker genes for each T cell subpopulation. The larger the dot in the plot, the larger the percentage of cells that express the gene in that subpopulation. The redder the color, the higher the expression of the gene in the subpopulation. B) The UMAP plot shows the distribution of each T cell subpopulation in the peripheral blood of AD patients and NC, and different colors represent different cell populations. C) The proportional distribution of T cell subsets in the peripheral blood of AD patients and NC. Each color represents a cell subset, and the larger the area, the greater the proportion of the cell population in the peripheral blood. D) Proportional distribution of CD8+ T cell subpopulations in peripheral blood from the GSE134578 dataset.
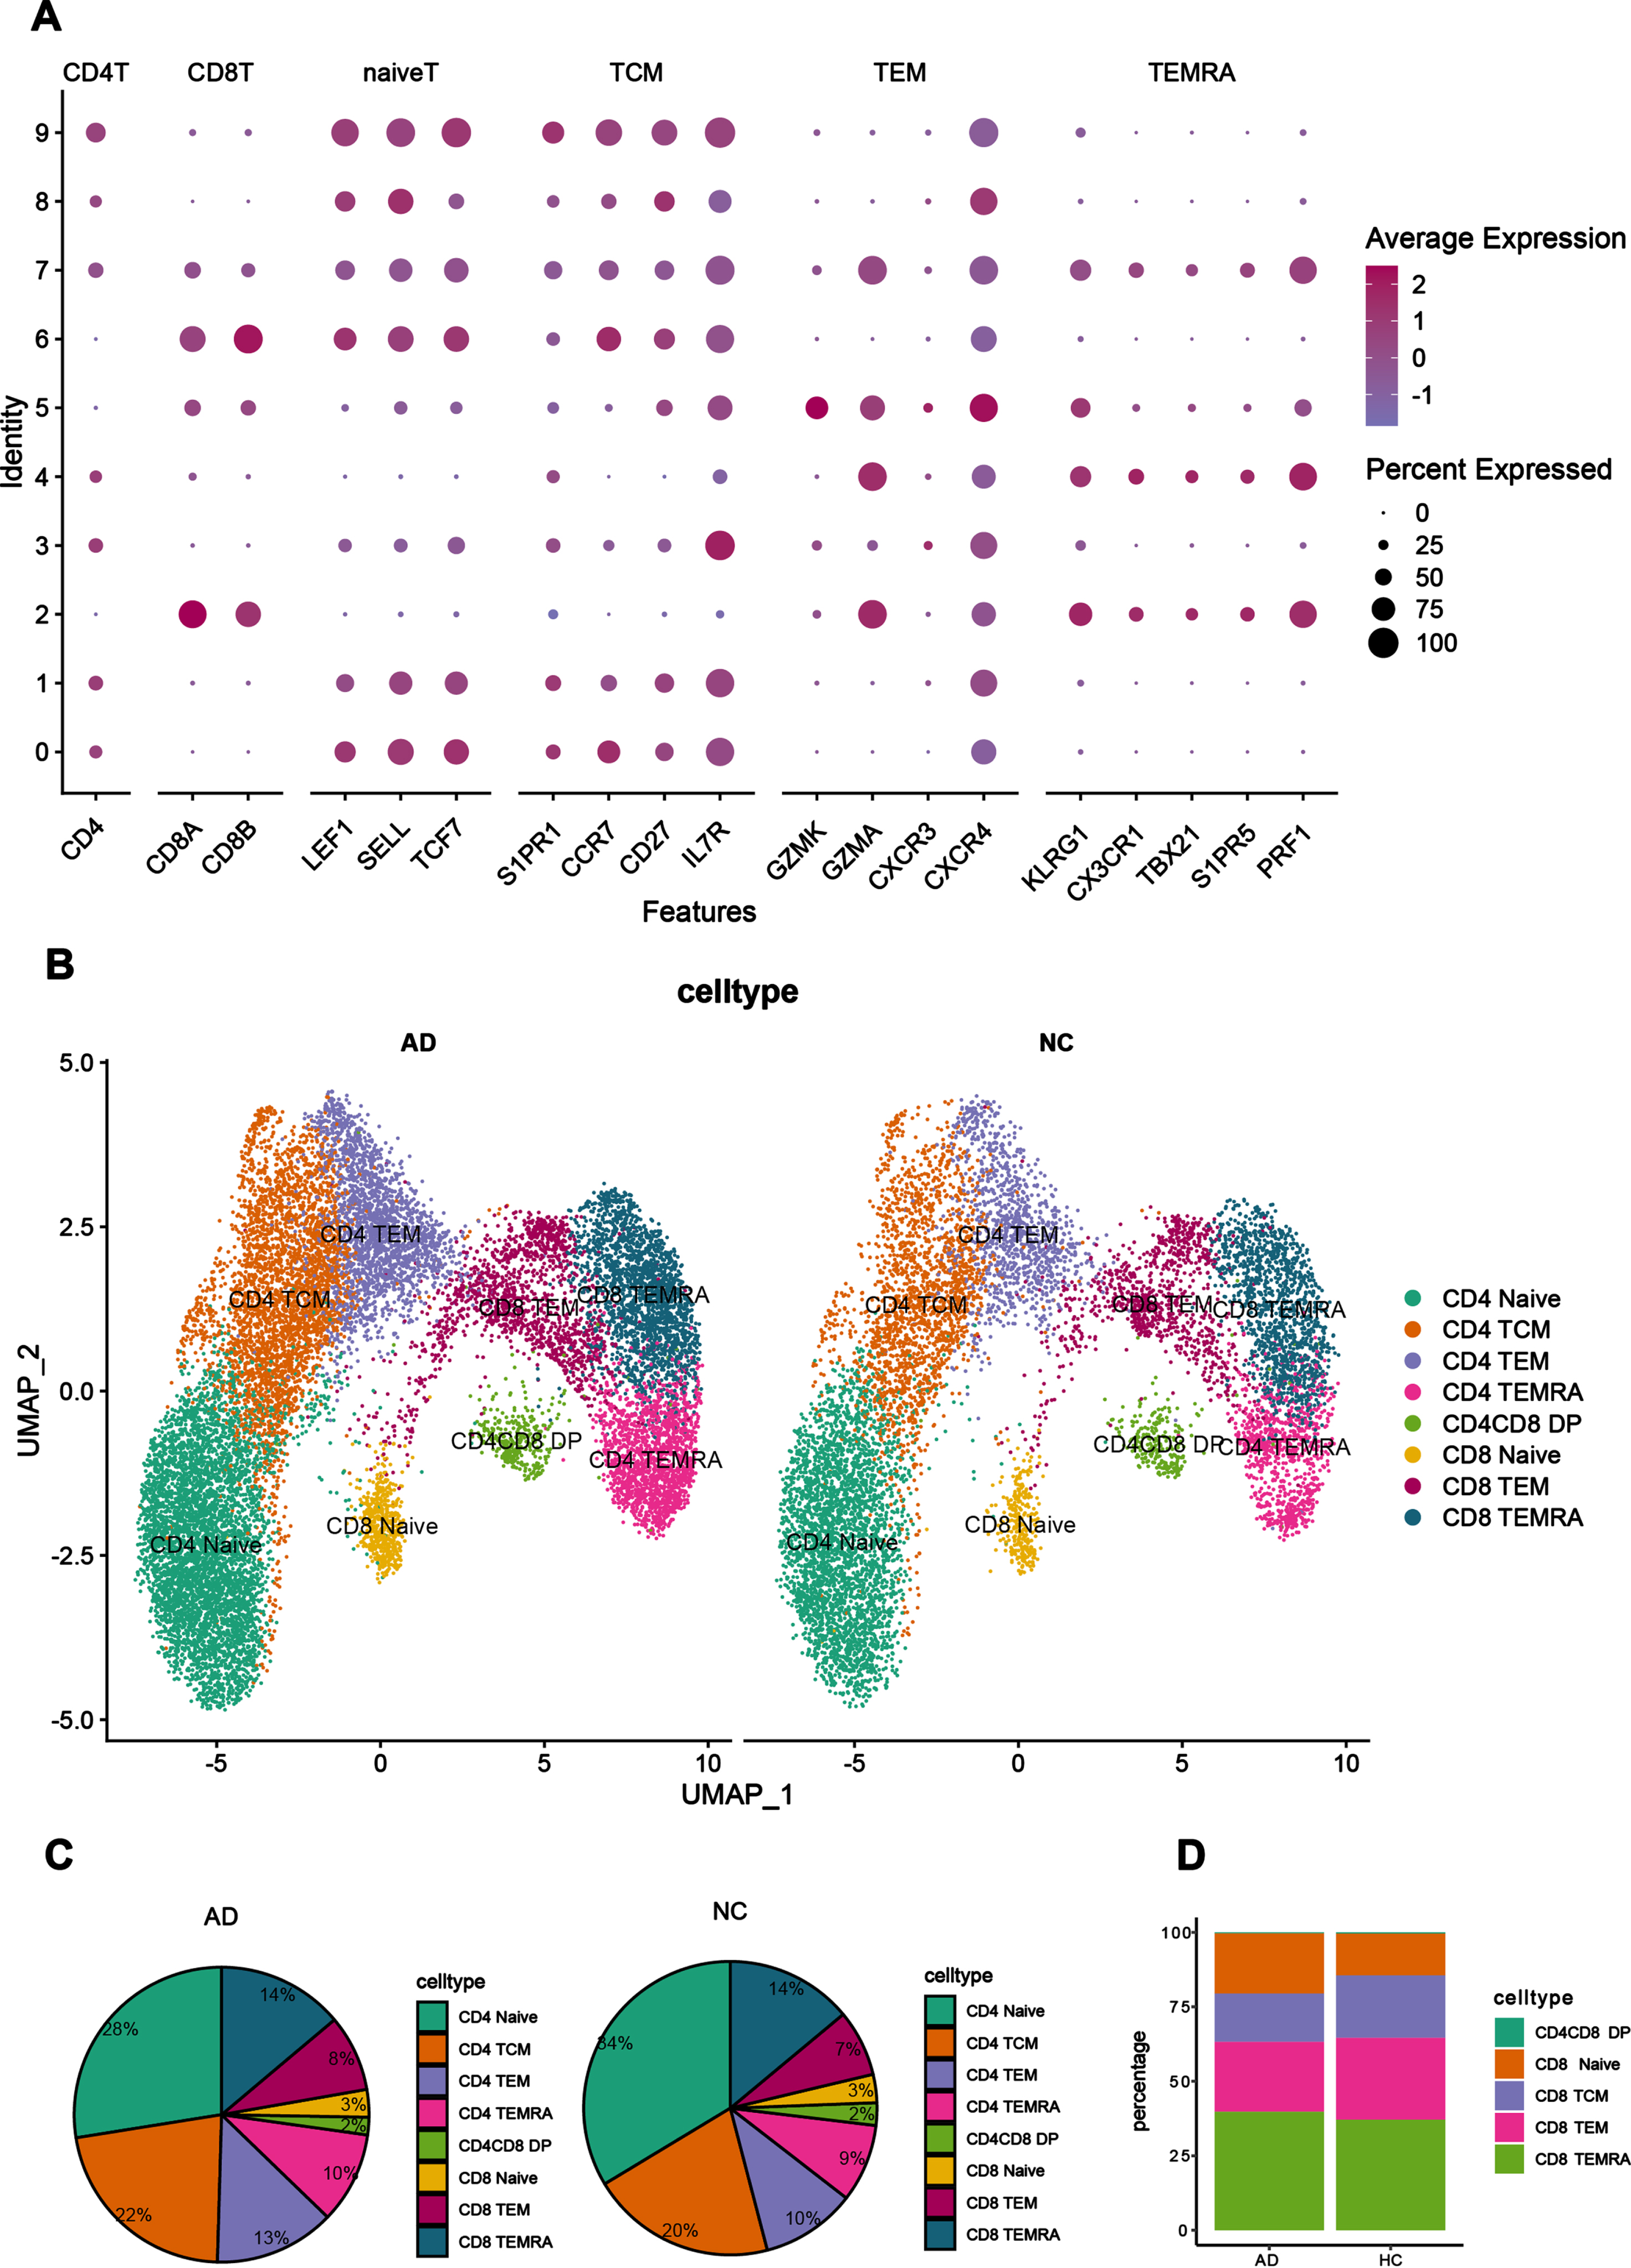
In the peripheral blood, there were differences in the distribution of each cell subpopulation (Fig. 4B) between AD patients and NC. In the UMAP plot of cell types, CD4+ TEMRA cells can be observed adjacent to CD8+ TEMRA and CD8+ TEM cells in position, implying that the biological characteristics of CD4+ TEMRA cells are similar to those of CD8+ TEMRA and CD8+ TEM. The proportion of CD4+ Naïve T cells and CD4+ TCM cells was more than 50% in the peripheral blood of NC, whereas the proportion of these two cell subsets was reduced in the peripheral blood of AD patients. Compared to NC, the proportion of CD4+ TEM cells were significantly increased in the peripheral blood of AD patients, as well as the proportion of TEMRA cells (CD4+ and CD8+) and CD8+ TEM cells, suggesting that T cells in the peripheral blood of AD patients are mainly effector T cells, whereas in the peripheral blood of NC they are mainly resting state T cells (Fig. 4C). The phenomenon found in this dataset was verified by analyzing CD8+ T cells in the CSF of the GSE134578 dataset, and it was found that the proportion of CD8+ TEMRA cells was also higher in AD patients in the GSE134578 dataset than in NC. The findings were consistent with each other (Fig. 4D).
Pseudo-time analysis of the subpopulations of CD4+ T cells and CD8+ T cells
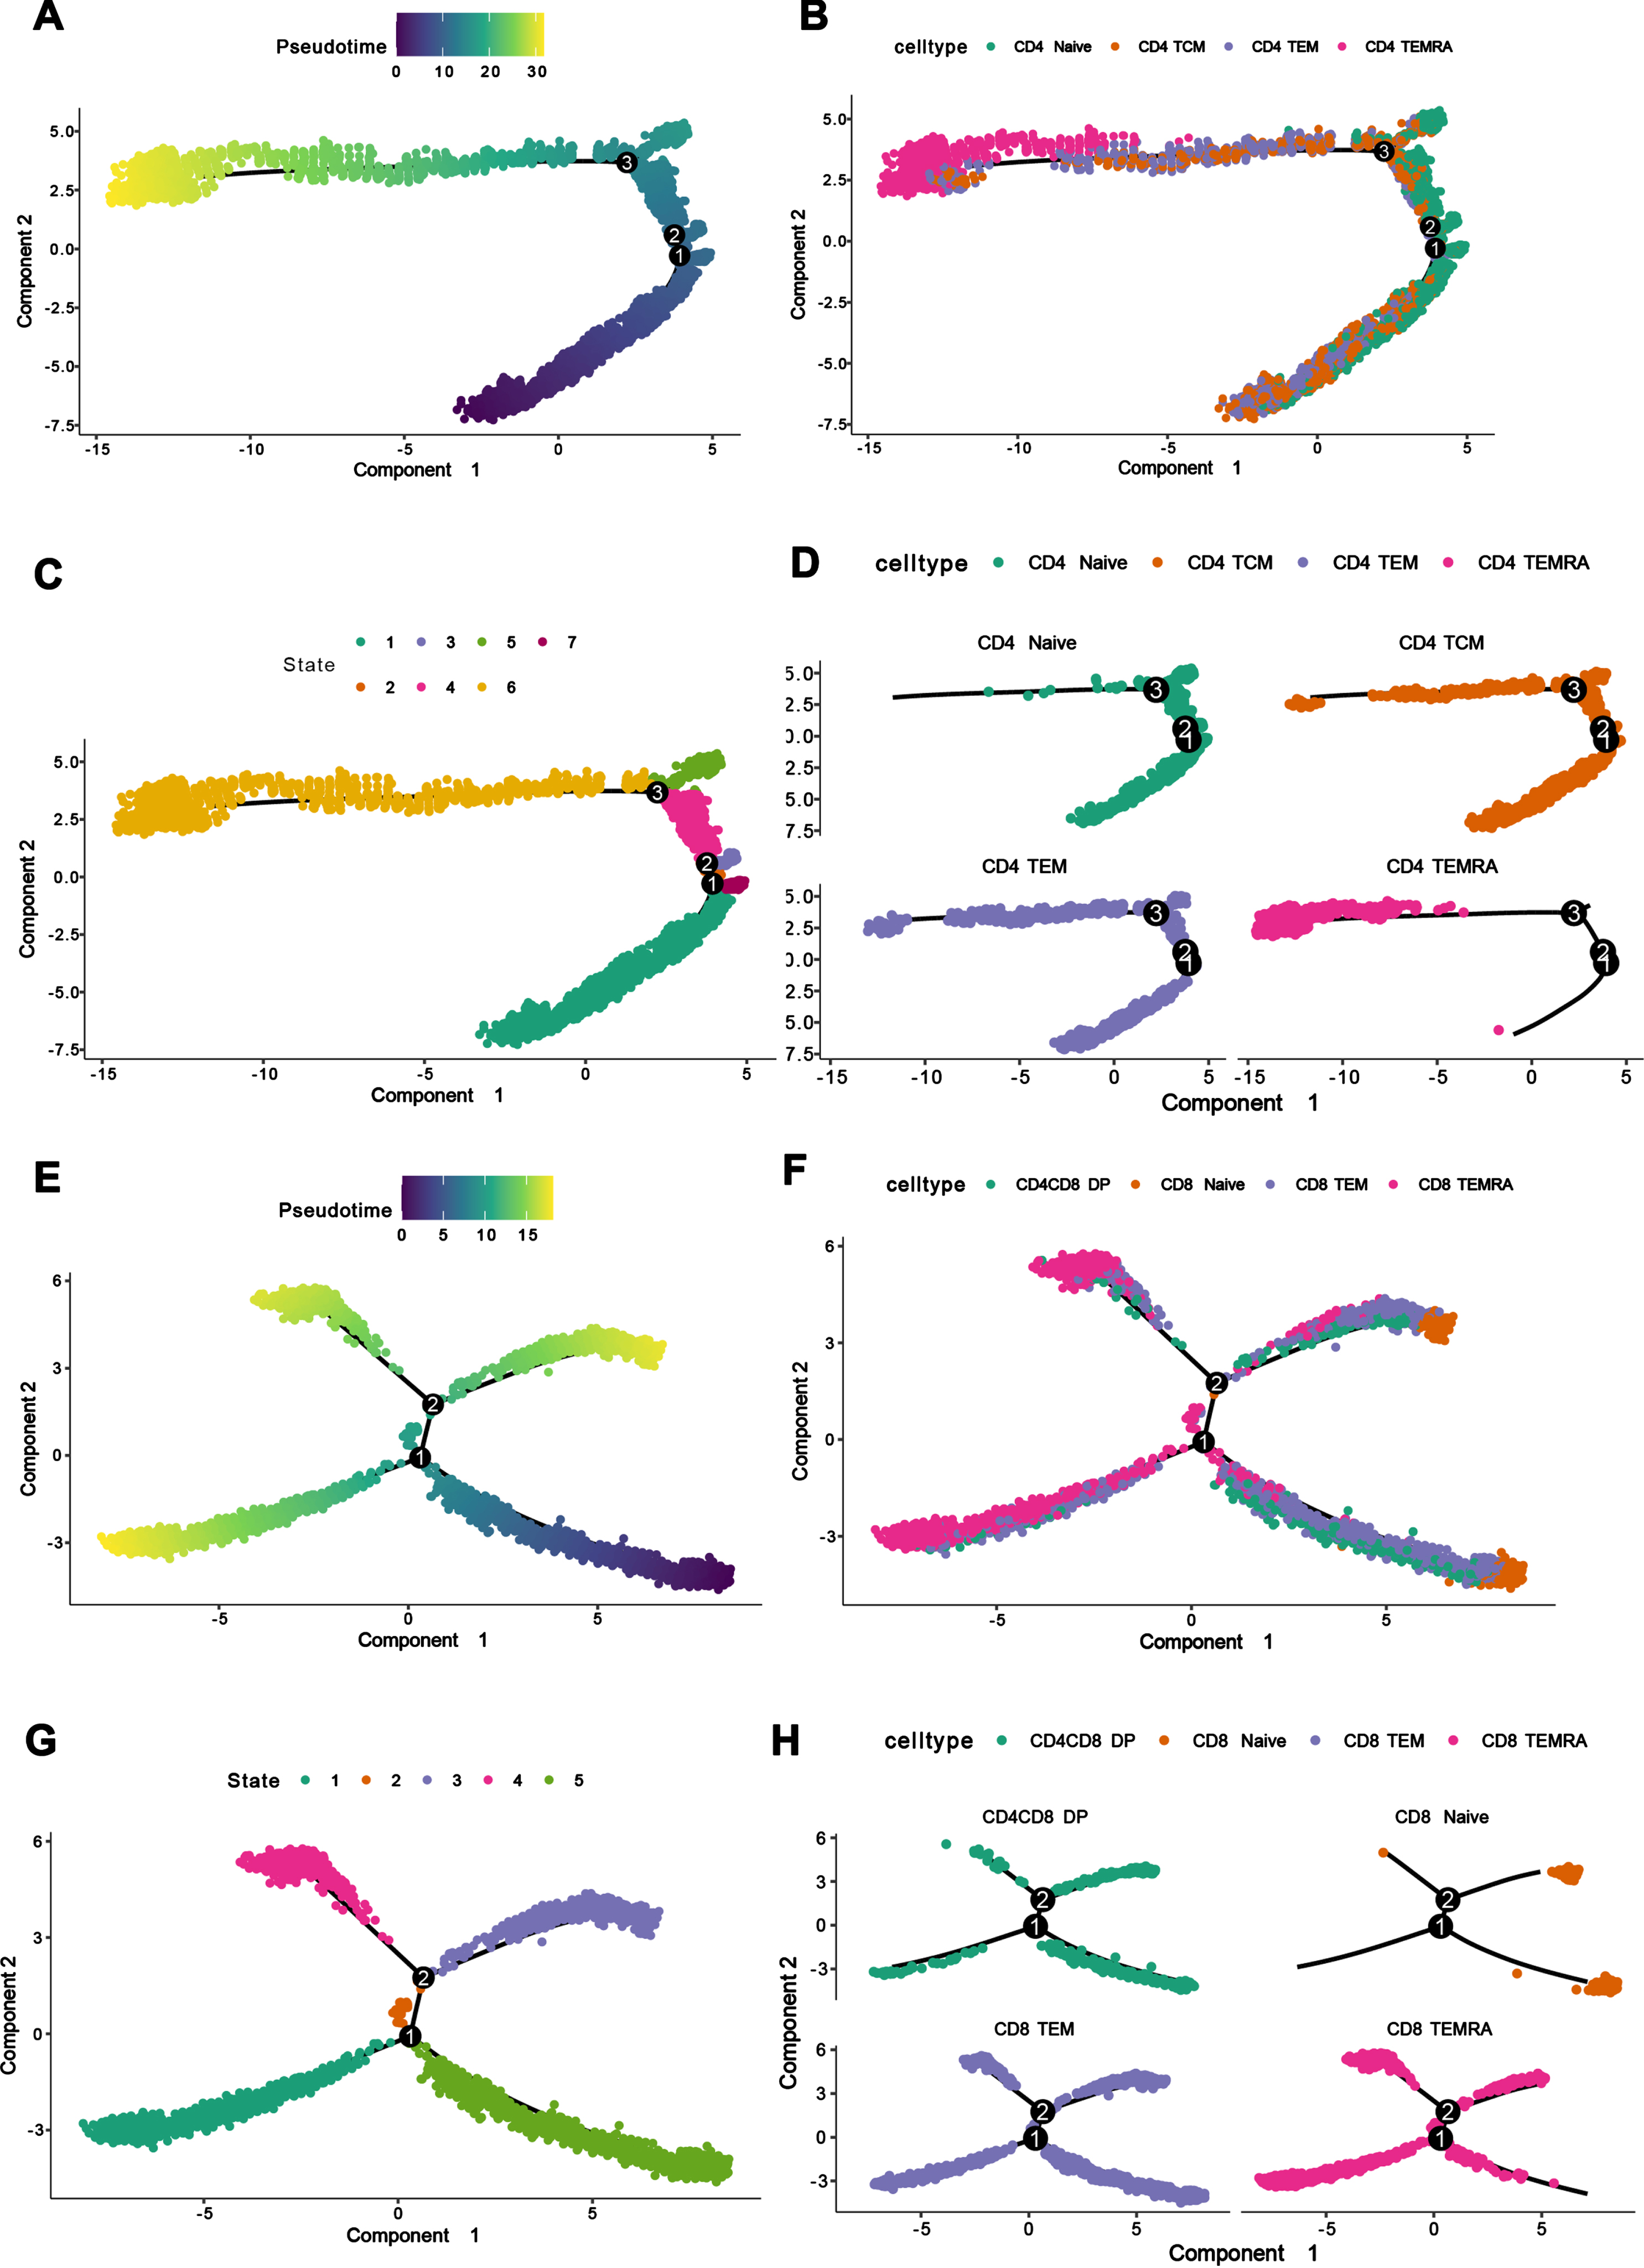
To study the developmental state of each subpopulation of CD4 and CD8 in peripheral blood clearly, we made pseudo-time analysis of the subpopulations of CD4+ and CD8+ T cells separately through monocle software. Firstly, we defined CD4+ Naïve and CD8+ Naïve as cells in the initial state of development according to immunological principles, and defined the pseudo-time point where CD4+ Naïve and CD8+ Naïve cells were located as the starting point of pseudo-time (Fig. 5A, E). We found that among CD4+ T cells, CD4+ TEMRA cells were in the terminal state of differentiation, which was caused by the differentiation of CD4+ Naïve, CD4+ TCM cells in the initial state of development, while CD4+ TEM cells were in the intermediate state of development (Fig. 5B-D). Among CD8+ T cells, CD8+ TEMRA cells were in the terminal differentiation state, which also developed from CD8+ Naïve cells, and CD8+ TEM cells were in the intermediate state of development, while CD4+CD8+DP cells were also found to be a kind of cells in the intermediate state of development.
Fig. 5
Pseudo-time analysis and single cell tractor analysis of the subpopulations of CD4+ T cells and CD8+ T cell. A) Pseudo-time and single cell trajectory analysis by Monocle. CD4+ Naïve T cells were defined as the initial state of T cells, so the pseudo-time sequence here represented the developmental sequence of cells, and the more yellow colored area represented the higher degree of differentiation. B) CD4+ T cell differentiation trajectory graph, corresponding to the pseudo-time graph, showing the differentiation trajectories of different CD4+ T cell subpopulations. C) Monocle proposed temporal state diagram, corresponding to the pseudo-time graph, each color represented a different differentiation state. D) CD4+ T cell differentiation trajectory graph, which separated CD4+ T cells by cell subpopulation to show the differentiation trajectories of different cell subpopulations. E) Pseudo-time and single cell trajectory analysis by Monocle. CD8+ Naïve T cells were defined as the initial state of T cells, so the pseudo-time sequence here represented the developmental order of cells, and the more yellow colored area represents the higher differentiation degree. F) CD8+ T cell differentiation trajectory graph, corresponding to the pseudo-time graph, showing the differentiation trajectories of different CD8+ T cell subpopulations. G) Monocle proposed temporal state graph, corresponding to the pseudo-temporal graph, each color represented a different differentiation state. H) CD8+ T cell differentiation trajectory map, which separated CD8+ T cells by cell subpopulation to show the differentiation trajectories of different cell subpopulations.
Differences in the immune composition of CSF and peripheral blood
In the dataset GSE134578, live immune cells in the CSF were sequenced using scRNA-seq technology. According to the original literature, there were no age or sex differences between AD and NC groups. After quality control and filtering, we analyzed 23,770 cells in the CSF, which were initially annotated as T cells, NK cells, B cells and myeloid cells after linear dimensional reduction analysis and clustering binning (Fig. 6A).
Fig. 6
Differences in immune composition between CSF and peripheral blood. A) UMAP graph of subpopulations of immune cells in cerebrospinal fluid, with colors used to indicate different immune cell populations, each represented by a scatter. B) UMAP graph of T-cell subpopulations in CSF, with each cell subpopulation represented by a color block and each cell represented by a scatter. C) The ratio of each immune cell population in CSF and peripheral blood. The size of each color block area represents the size of the proportion of each cell population. The left panel shows the proportion of immune cell populations in peripheral blood, and the right panel shows the proportion of immune cell populations in CSF. D) Proportional distribution of cell subpopulations in the cerebrospinal fluid and peripheral blood of AD patients. E) Wayne graphs of genes expressed by T cells in CSF and peripheral blood of AD patients and NC CSF and peripheral blood samples. The numbers on the two overlapping regions, represent the number of genes shared with each other. pbmc_AD, csf_AD, pbmc_NC and csf_NC represent peripheral blood of AD patients, cerebrospinal fluid of AD patients, peripheral blood of NC and cerebrospinal fluid of NC, respectively.

Since T cells represent a large proportion of CSF, the analysis further focused on T cells in CSF. After selecting T cells from the annotation results and continuing the reduction clustering, T cells were annotated as CD4+ TEM cells, CD4+ Naïve T cells, CD4+ TCM cells, CD8+ TEM, and CD8+ TEMRA based on known marker genes cells (Fig. 6B).
A comparative analysis of peripheral blood and CSF revealed that the distribution of immune cells in CSF was different from the distribution of immune cells in peripheral blood. The proportion of myeloid cells and T cells was higher in CSF than in peripheral blood, while in peripheral blood, the proportion of B cells and NK cells was higher than in CSF, indicating that there were differences in the immune composition of CSF and peripheral blood (Fig. 6C). However, there were also similarities between the two, i.e., T cells were the main component in both CSF and peripheral blood, which also indicates that the adaptive immune system has an important role in CSF.
In CSF, CD4+ T cells were its main constituent and the subpopulation of CD4+ T cells was more abundant; CD8+ T cells were mainly dominated by CD8+ TEM and CD8+ TEMRA cells. Similarly, in peripheral blood, the proportion of CD4+ T cells was higher than that of CD8+ T cells, with the proportion of CD4+ T accounting for about 75% and dominated by CD4+ TCM and CD4+ Naïve T cells (Fig. 6D). To further demonstrate the difference between T cells in CSF and peripheral blood, the samples were split into CSF from AD patients, peripheral blood from AD patients, CSF from NC, and peripheral blood from NC, and the genes expressed by T cells in the four samples were compared. More genes were found to overlap in the peripheral blood of AD patients and NC peripheral blood. In addition, the CSF of AD patients had more gene overlap with the NC CSF, while there were significant differences of the immune environment between peripheral blood and CSF (Fig. 6E).
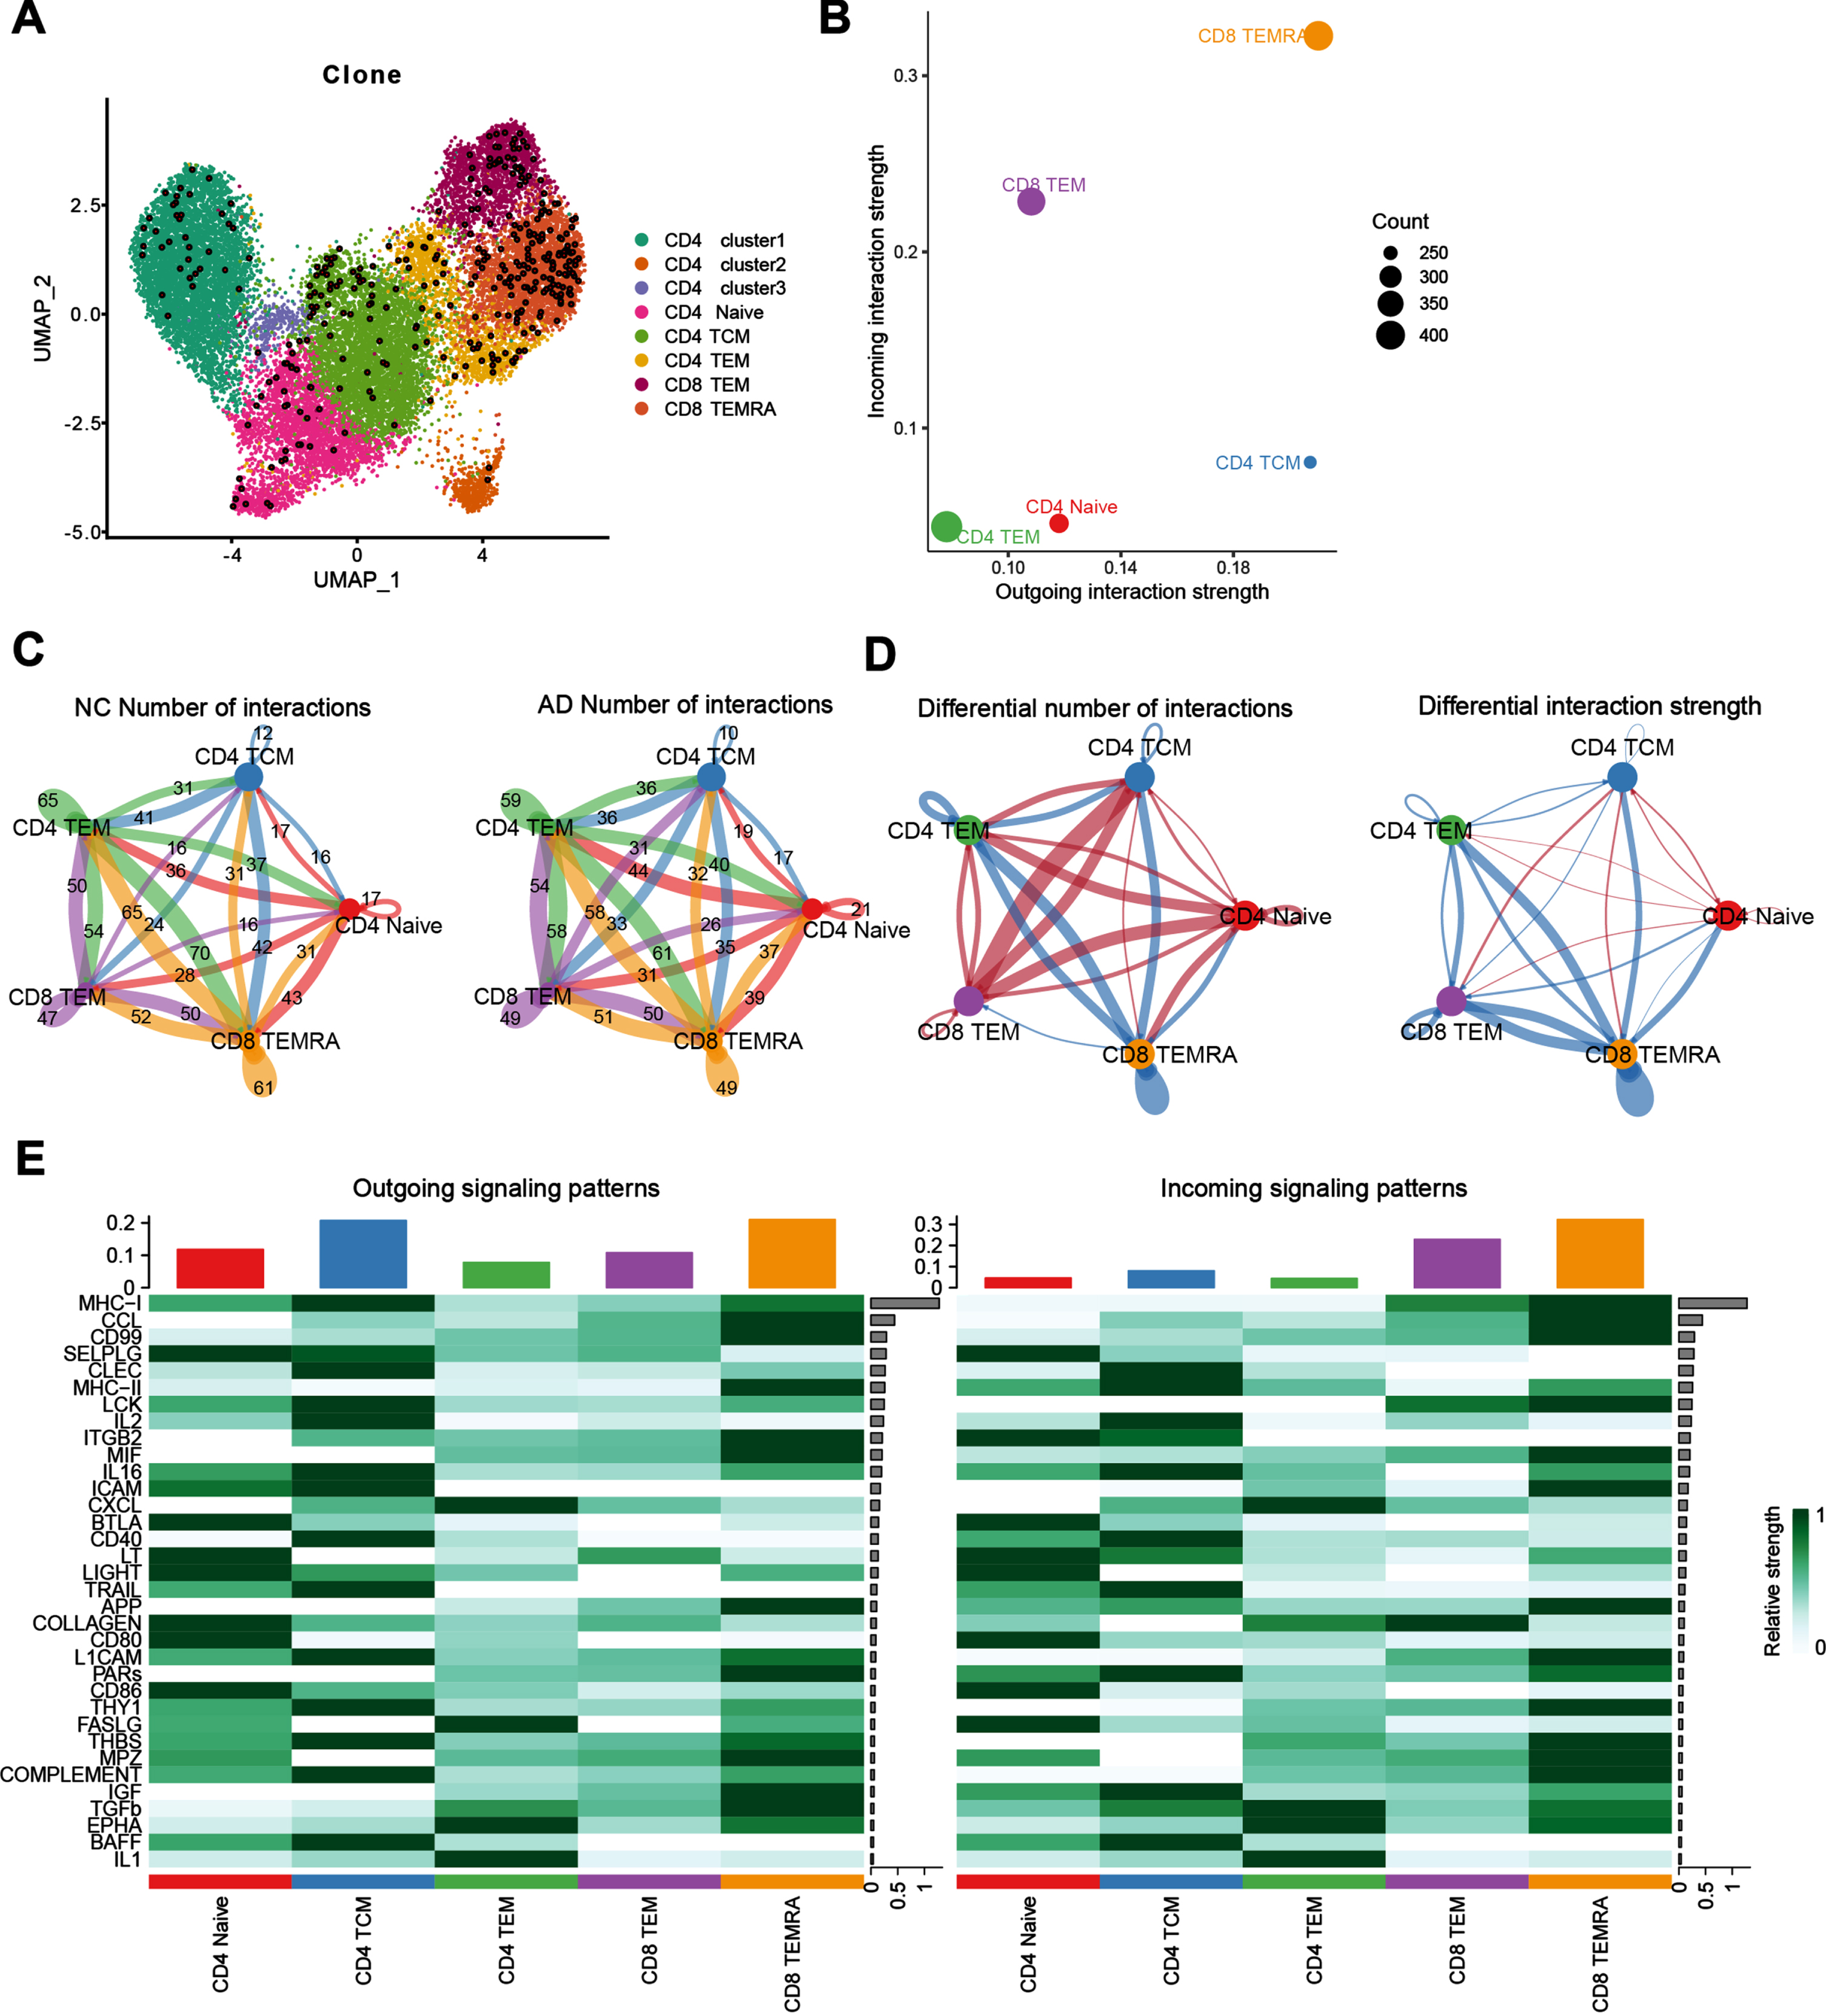
Diminished communication of CD8+ TEMRA cells in the CSF of AD
TCR is a specific receptor on the surface of T cells, and there is only one TCR on the surface of each T cell. Clonal proliferation information of T cells can be traced by single-cell TCR sequencing. We analyzed the single-cell TCR sequencing data of T cells in CSF and found that the clonally expanded T cells in CSF were mainly CD8+ TEMRA cells and CD8+ TEM cells (Fig. 7A). Additionally, we inferred the intercellular communication with CellChat tool and found that CD8+ TEMRA cells and CD8+ TEM cells demonstrate a pivot role in CSF (Fig. 7B). Furtherly, we explored the changes in communication between CD8+TEMRA and CD8+TEM and other immune cells in AD patients and revealed that the outgoing number and strength of CD8+ TEMRA cells communicating with CD8+ TEM, CD4+ TEM were downregulated in AD patients compared to NC. However, the outgoing number and strength of CD8+ TEM interacting with CD4+ TCM and CD4 naive were upregulated compared to NC (Fig. 7C, D). Next, we calculate the outgoing and incoming interaction strength of each signaling pathway (Fig. 7E) to reveal their contribution to the complex intercellular communications. Notably, MHC-1, CCL signaling were shown as the most predominant signaling in CD8+ TEMRA cells, as reflected by the largest outgoing and incoming interaction strength compared to other signaling pathways. In addition to MHC-1, CCL signaling, we also observed other increased proteins signaling related with brain injury and repairing like amyloid-β protein precursor (AβPP) signaling pathway. These results suggest that the cellular control of CD8+ TEMRA by other immune cells such as CD4+ TEM and CD8+ TEM is diminished during AD pathogenesis, which leads to the dysfunction of CD8+ TEMRA cells. Additionally, MHC-1, CCL signaling, and AβPP signaling pathway may be the main pathways for CD8+ TEMRA cell dysfunction.
Fig. 7
Diminished communication of CD8+ TEMRA cells in AD patients. A) Mapping of cells with more proliferating T cell clones on the UMAP plot, the enlarged dots in the plot represent T cells with more proliferating clones. B) Illustration of the incoming and outgoing interaction strengths for each of the cell types in AD patients. C) Cell communication network map, the size of the various colored circles around the periphery indicates the number of cells, the larger the circle, the greater the number of cells, cells emitting arrows express ligands, cells with arrows pointing to them express receptors, the more the number of ligand-receptor pairs, the thicker the lines. D) Differential cell-cell communications between AD and NC group, the red arrows represent upregulated cell communication in AD patients compared to NC, blue arrows represent downregulated cell communication. E) Heat map of incoming and outgoing signaling patterns.
DISCUSSION
With the accelerated aging of the population, the incidence of AD is increasing year by year. However, the current therapeutic drugs and intervention measurements for AD patients are limited, so there is an urgent need for clinical prevention and treatment at the early stages of the disease process to slow down the progression of these patients and achieve early diagnosis, intervention and treatment. Immune dysfunction is an important pathological event in AD patients, and studies have demonstrated the presence of immune cell expansion in the peripheral blood and CSF of AD patients, and the close association between the peripheral immune system and the central nervous system is gradually being investigated [25–27]. In AD patients, increased inflammatory response, reactive glial cells, weakened blood-brain barrier, plaque formation, and neurofibrillary tangles cause peripheral immune cells to enter the center and interact with brain-resident microglia, and it may be this interaction of peripheral immune cells with tissue-resident microglia that leads to the development of AD [28, 29]. Therefore, the comprehensive understanding of immune response in AD patients is in critical need. In this work, we demonstrated the distribution, developmental status and cellular communication of T cells in the peripheral blood and CSF of AD patients and NC at the single cell level using two public data sets.
We revealed that T cells in peripheral blood and CSF of AD patients are mainly CD8+TEMRA, CD8+TEM, and CD4+TEMRA cells, which are T cells that can exert effector functions. Previous studies have also identified the presence of T cells with effector functions in animal models of AD, and the infiltration of T cells into the brain may exert destructive effects [30], but this depends on the course of neuroinflammation and the type of infiltrating T cells [31]. It has been found that CD4+ lymphocyte subpopulations significantly affect the progression of AD in both mouse models and human studies [11, 32]. It has also been found that Th cells can target Aβ plaques in the brain by intravenous injection of Th cells, and thus Th cells can locally suppress neuroinflammation and clear Aβ plaques, as well as reduce the inflammation caused by innate immunity. However, no evidence of Th cell-mediated neurotoxicity has been found [33]. For technical reasons at that time, it was not possible to localize these T cells to cell subpopulations or to explain them at the single cell level [34–36]. However, in this work, we demonstrated that the subset of Th cell mediated neurotoxicity may be the CD4+TEMRA cells. Consistent with previous studies, the proportion of CD8+ T cells was found to be higher in the peripheral blood of AD patients than in NC [37, 38], and this change implies a disturbance in the proportion of T cell subpopulations in the peripheral blood from AD patient. In our study, we also found that CD8+ TEMRA and CD4+ TEMRA cells were positioned adjacent to each other in the UMAP plot, suggesting that they may have similar expression patterns. TCR diversity is important for maintaining the stability of the immune system. In AD patients, we analyzed the clonal expansion of TCR and demonstrated a reduction in TCR diversity, which indicated T cell in AD patients experience a clonal expansion stimulated by specific antigen [39, 40]. We tracked information on T cell clonal proliferation through TCR data and found that CD8+ TEMRA cells were the main clonally proliferating cells, which is consistent with Professor Wyss-Coray’s findings [20]. Additionally, we found that the trend of CD8+ TEM expansion was similar to CD8+ TEMRA cell expansion, which confirms that the T cells present in AD patients are mainly T cells with effector functions.
In order to accurately understand the communication between T cell subpopulations, we extracted T cells individually for intercellular communication analysis and found that the number as well as the strength of communication between CD8+ TEMRA cells and other T cells in AD patients was reduced. Therefore, we suggest that the weakened intercellular communication leads to a corresponding weakened control of CD8+ TEMRA cells by other T cells, which in turn leads to their expansion status and dysfunction and aggravates the development of AD pathological events. Despite the weakened communication between CD8+TEMRA and other T cells, the differentiation of CD8+TEMRA cells still followed the process of differentiation from CD8+ Naïve cells. This indicates that the differentiation pathway of CD8+ TEMRA in AD patients is not altered, i.e., AD disease itself does not affect the differentiation pathway of CD8+ TEMRA.
In this study we also compared the differences between CSF and peripheral blood at the genetic level and found that the immune environment of peripheral blood is significantly different from that of CSF because of less overlap of gene expression patterns. However, whether in peripheral blood or CSF, the AD and NC groups had more genetic overlap, indicating that the onset of AD does not completely change the environment of peripheral blood or CSF.
The limitation of the present study is the lack of experimental validation. Since this study is based on the analysis of human single-cell sequencing data, but the amount of data we can acquired from single-cell sequencing of AD patients is relatively rare, it is not yet possible to effectively perform patient-level validation. In the future, the functional similarity between CD8+ TEMRA cells and CD4+ TEMRA cells can be further verified, their specific effect mechanisms and their related signaling pathways in the development of AD can be explored, and the important role of communication between CD8+ TEMRA cells and other T cells in AD disease can be studied in depth.
ACKNOWLEDGMENTS
We thank the authors of the GSE181279 and GSE134578 datasets for their contribution.
FUNDING
This study was supported by the grant provided by the General Program of the National Natural Science Foundation of China (No. 82071442), the Jilin Provincial Department of Finance (JLSWSRCZX2021-004) and the STI2030-Major Projects (No. 2021ZD0201802).
CONFLICT OF INTEREST
The authors have no conflict of interest to report.
DATA AVAILABILITY
The data supporting the findings of this study are openly available in GSE181279 and GSE134578 at 10.3389/fimmu.2021.645666 and https://doi.org/10.1038/s41586-019-1895-7.
SUPPLEMENTARY MATERIAL
[1] The supplementary material is available in the electronic version of this article:https://dx.doi.org/10.3233/JAD-230784.
REFERENCES
[1] | Hardy J , Selkoe DJ ((2002) ) The amyloid hypothesis of Alzheimer’s disease: Progress and problems on the road to therapeutics. Science 297: , 353–356. |
[2] | Ising C , Venegas C , Zhang S , Scheiblich H , Schmidt SV , Vieira-Saecker A , Schwartz S , Albasset S , McManus RM , Tejera D , Griep A , Santarelli F , Brosseron F , Opitz S , Stunden J , Merten M , Kayed R , Golenbock DT , Blum D , Latz E , Buee L , Heneka MT ((2019) ) NLRP3 inflammasome activation drives tau pathology. Nature 575: , 669–673. |
[3] | Heppner FL , Ransohoff RM , Becher B ((2015) ) Immune attack: The role of inflammation in Alzheimer disease. Nat Rev Neurosci 16: , 358–372. |
[4] | Borovikova LV , Ivanova S , Zhang M , Yang H , Botchkina GI , Watkins LR , Wang H , Abumrad N , Eaton JW , Tracey KJ ((2000) ) Vagus nerve stimulation attenuates the systemic inflammatory response to endotoxin. Nature 405: , 458–462. |
[5] | Fu R , Shen Q , Xu P , Luo JJ , Tang Y ((2014) ) Phagocytosis of microglia in the central nervous system diseases. Mol Neurobiol 49: , 1422–1434. |
[6] | Wolf SA , Boddeke HW , Kettenmann H ((2017) ) Microglia in physiology and disease. Annu Rev Physiol 79: , 619–643. |
[7] | Theriault P , ElAli A , Rivest S ((2015) ) The dynamics of monocytes and microglia in Alzheimer’s disease. Alzheimers Res Ther 7: , 41. |
[8] | Zenaro E , Pietronigro E , Della Bianca V , Piacentino G , Marongiu L , Budui S , Turano E , Rossi B , Angiari S , Dusi S , Montresor A , Carlucci T , Nani S , Tosadori G , Calciano L , Catalucci D , Berton G , Bonetti B , Constantin G ((2015) ) Neutrophils promote Alzheimer’s disease-like pathology and cognitive decline via LFA-1 integrin. Nat Med 21: , 880–886. |
[9] | Prokop S , Miller KR , Drost N , Handrick S , Mathur V , Luo J , Wegner A , Wyss-Coray T , Heppner FL ((2015) ) Impact ofperipheral myeloid cells on amyloid-beta pathology in Alzheimer’s disease-like mice. J Exp Med 212: , 1811–1818. |
[10] | Baruch K , Schwartz M ((2013) ) CNS-specific T cells shape brain function via the choroid plexus. Brain Behav Immun 34: , 11–16. |
[11] | Baruch K , Rosenzweig N , Kertser A , Deczkowska A , Sharif AM , Spinrad A , Tsitsou-Kampeli A , Sarel A , Cahalon L , Schwartz M ((2015) ) Breaking immune tolerance by targeting Foxp3(+) regulatory T cells mitigates Alzheimer’s disease pathology. Nat Commun 6: , 7967. |
[12] | Ferretti MT , Merlini M , Spani C , Gericke C , Schweizer N , Enzmann G , Engelhardt B , Kulic L , Suter T , Nitsch RM ((2016) ) T-cell brain infiltration and immature antigen-presenting cells in transgenic models of Alzheimer’s disease-like cerebral amyloidosis. Brain Behav Immun 54: , 211–225. |
[13] | Marsh SE , Abud EM , Lakatos A , Karimzadeh A , Yeung ST , Davtyan H , Fote GM , Lau L , Weinger JG , Lane TE , Inlay MA , Poon WW , Blurton-Jones M ((2016) ) The adaptive immune system restrains Alzheimer’s disease pathogenesis by modulating microglial function. E. Proc Natl Acad Sci U S A 113: , 1316–1325. |
[14] | Winek K , Lobentanzer S , Nadorp B , Dubnov S , Dames C , Jagdmann S , Moshitzky G , Hotter B , Meisel C , Greenberg DS , Shifman S , Klein J , Shenhar-Tsarfaty S , Meisel A , Soreq H ((2020) ) Transfer RNA fragments replace microRNA regulators of the cholinergic poststroke immune blockade. Proc Natl Acad Sci U S A 117: , 32606–32616. |
[15] | Korin B , Ben-Shaanan TL , Schiller M , Dubovik T , Azulay-Debby H , Boshnak NT , Koren T , Rolls A ((2017) ) High-dimensional, single-cell characterization of the brain’s immune compartment. Nat Neurosci 20: , 1300–1309. |
[16] | Ritzel RM , Crapser J , Patel AR , Verma R , Grenier JM , Chauhan A , Jellison ER , McCullough LD ((2016) ) Age-associated resident memory CD8 T cells in the central nervous system are primed to potentiate inflammation after ischemic brain injury. J Immunol 196: , 3318–3330. |
[17] | Unger MS , Li E , Scharnagl L , Poupardin R , Altendorfer B , Mrowetz H , Hutter-Paier B , Weiger TM , Heneka MT , Attems J , Aigner L ((2020) ) CD8(+) T-cells infiltrate Alzheimer’s disease brains and regulate neuronal- and synapse-related gene expression in APP-PS1 transgenic mice. Brain Behav Immun 89: , 67–86. |
[18] | Gjoneska E , Pfenning AR , Mathys H , Quon G , Kundaje A , Tsai LH , Kellis M ((2015) ) Conserved epigenomic signals in mice and humans reveal immune basis of Alzheimer’s disease. Nature 518: , 365–369. |
[19] | De Strooper B , Karran E ((2016) ) The cellular phase of Alzheimer’s disease. Cell 164: , 603–615. |
[20] | Gate D , Saligrama N , Leventhal O , Yang AC , Unger MS , Middeldorp J , Chen K , Lehallier B , Channappa D , De Los Santos MB , McBride A , Pluvinage J , Elahi F , Tam GK , Kim Y , Greicius M , Wagner AD , Aigner L , Galasko DR , Davis MM , Wyss-Coray T ((2020) ) Clonally expanded CD8 T cells patrol the cerebrospinal fluid in Alzheimer’s disease. Nature 577: , 399–404. |
[21] | Xu H , Jia J ((2021) ) Single-cell RNA sequencing of peripheral blood reveals immune cell signatures in Alzheimer’s disease. Front Immunol 12: , 645666. |
[22] | Aran D , Looney AP , Liu L , Wu E , Fong V , Hsu A , Chak S , Naikawadi RP , Wolters PJ , Abate AR , Butte AJ , Bhattacharya M ((2019) ) Reference-based analysis of lung single-cell sequencing reveals a transitional profibrotic macrophage. Nat Immunol 20: , 163–172. |
[23] | Qiu X , Mao Q , Tang Y , Wang L , Chawla R , Pliner HA , Trapnell C ((2017) ) Reversed graph embedding resolves complex single-cell trajectories. Nat Methods 14: , 979–982. |
[24] | Jin S , Guerrero-Juarez CF , Zhang L , Chang I , Ramos R , Kuan CH , Myung P , Plikus MV , Nie Q ((2021) ) Inference and analysis of cell-cell communication using Cell Chat. Nat Commun 12: , 1088. |
[25] | Sattlecker M , Kiddle SJ , Newhouse S , Proitsi P , Nelson S , Williams S , Johnston C , Killick R , Simmons A , Westman E , Hodges A , Soininen H , Kloszewska I , Mecocci P , Tsolaki M , Vellas B , Lovestone S , AddNeuroMed Consortium, Dobson RJ ((2014) ) Alzheimer’s disease biomarker discovery using SOMAscan multiplexed protein technology. Alzheimers Dement 10: , 724–734. |
[26] | Park JC , Han SH , Mook-Jung I ((2020) ) Peripheral inflammatory biomarkers in Alzheimer’s disease: A brief review. BMB Rep 53: , 10–19. |
[27] | Bai B , Vanderwall D , Li Y , Wang X , Poudel S , Wang H , Dey KK , Chen PC , Yang K , Peng J ((2021) ) Proteomic landscape of Alzheimer’s disease: Novel insights into pathogenesis and biomarker discovery. Mol Neurodegener 16: , 55. |
[28] | Jevtic S , Sengar AS , Salter MW , McLaurin J ((2017) ) The role of the immune system in Alzheimer disease: Etiology and treatment. Ageing Res Rev 40: , 84–94. |
[29] | Wyatt-Johnson SK , Brutkiewicz RR ((2020) ) The complexity of microglial interactions with innate and adaptive immune cells in Alzheimer’s disease. Front Aging Neurosci 12: , 592359. |
[30] | Walsh JT , Watson N , Kipnis J ((2014) ) T cells in the central nervous system: Messengers of destruction or purveyors of protection? Immunology 141: , 340–344. |
[31] | Russo MV , McGavern DB ((2015) ) Immune surveillance of the CNS following infection and injury. Trends Immunol 36: , 637–650. |
[32] | Dansokho C , Ait Ahmed D , Aid S , Toly-Ndour C , Chaigneau T , Calle V , Cagnard N , Holzenberger M , Piaggio E , Aucouturier P , Dorothee G ((2016) ) Regulatory T cells delay disease progression in Alzheimer-like pathology. Brain 139: , 1237–1251. |
[33] | Fisher Y , Strominger I , Biton S , Nemirovsky A , Baron R , Monsonego A ((2014) ) Th1 polarization of T cells injected into the cerebrospinal fluid induces brain immunosurveillance. J Immunol 192: , 92–102. |
[34] | McQuillan K , Lynch MA , Mills KH ((2010) ) Activation of mixed glia by Abeta-specific Th1 and Th17 cells and itsregulation by Th2 cells. Brain Behav Immun 24: , 598–607. |
[35] | Browne TC , McQuillan K , McManus RM , O’Reilly JA , Mills KH , Lynch MA ((2013) ) IFN-gamma Production by amyloid beta-specific Th1 cells promotes microglial activation and increases plaque burden in a mouse model of Alzheimer’s disease. J Immunol 190: , 2241–2251. |
[36] | Mittal K , Eremenko E , Berner O , Elyahu Y , Strominger I , Apelblat D , Nemirovsky A , Spiegel I , Monsonego A ((2019) ) CD4 T cells induce a subset of MHCII-expressing microglia that attenuates Alzheimer pathology. iScience 16: , 298–311. |
[37] | Lueg G , Gross CC , Lohmann H , Johnen A , Kemmling A , Deppe M , Groger J , Minnerup J , Wiendl H , Meuth SG , Duning T ((2015) ) Clinical relevance of specific T-cell activation in the blood and cerebrospinal fluid of patients with mild Alzheimer’s disease. Neurobiol Aging 36: , 81–89. |
[38] | Skias D , Bania M , Reder AT , Luchins D , Antel JP ((1985) ) Senile dementia of Alzheimer’s type (SDAT): Reduced T8+-cell-mediated suppressor activity. Neurology 35: , 1635–1638. |
[39] | Long SA , Khalili J , Ashe J , Berenson R , Ferrand C , Bonyhadi M ((2006) ) Standardized analysis for the quantification of Vbeta CDR3 T-cell receptor diversity. J Immunol Methods 317: , 100–113. |
[40] | Matsumoto Y , Matsuo H , Sakuma H , Park IK , Tsukada Y , Kohyama K , Kondo T , Kotorii S , Shibuya N ((2006) ) CDR3 spectratyping analysis of the TCR repertoire in myasthenia gravis. J Immunol 176: , 5100–5107. |


