
Microglial Imaging in Alzheimer’s Disease and Its Relationship to Brain Amyloid: A Human 18F-GE180 PET Study
Abstract
Background:
Emerging evidence suggests a potential causal role of neuroinflammation in Alzheimer’s disease (AD). Using positron emission tomography (PET) to image overexpressed 18 kDA translocator protein (TSPO) by activated microglia has gained increasing interest. The uptake of 18F-GE180 TSPO PET was observed to co-localize with inflammatory markers and have a two-stage association with amyloid PET in mice. Very few studies evaluated the diagnostic power of 18F-GE180 PET in AD population and its interpretation in human remains controversial about whether it is a marker of microglial activation or merely reflects disrupted blood-brain barrier integrity in humans.
Objective:
The goal of this study was to study human GE180 from the perspective of the previous animal observations.
Methods:
With data from twenty-four participants having 18F-GE180 and 18F-AV45 PET scans, we evaluated the group differences of 18F-GE180 uptake between participants with and without cognitive impairment. An association analysis of 18F-GE180 and 18F-AV45 was then conducted to test if the relationship in humans is consistent with the two-stage association in AD mouse model.
Results:
Elevated 18F-GE180 was observed in participants with cognitive impairment compared to those with normal cognition. No regions showed reduced 18F-GE180 uptake. Consistent with mouse model, a two-stage association between 18F-GE180 and 18F-AV45 was observed.
Conclusions:
18F-GE180 PET imaging showed promising utility in detecting pathological alterations in a symptomatic AD population. Consistent two-stage association between 18F-GE180 and amyloid PET in human and mouse suggested that 18F-GE180 uptake in human might be considerably influenced by microglial activation.
INTRODUCTION
Therapeutic interventions targeting reduction of brain amyloid-β protein (Aβ) in Alzheimer’s disease (AD) have shown benefits in clinical trials; however, the mechanistic role of Aβ plaques in AD pathogenesis remains controversial. Emerging evidence suggests that alternative but correlated disease pathways and their interaction with brain amyloid pathology could be crucial for understanding the pathological mechanisms of AD at early stages of the disease. Evidence from genetic, autopsy, animal model, and proteomic studies suggest that neuroinflammation is a key aspect of the pathophysiology of AD [1–4].
The activated microglia in the AD-associated inflammatory response are believed to be beneficial for clearance of accumulating toxic Aβ oligomers/plaques and restoring tissue homeostasis in the early stages of AD [5]. However, the neurotoxic substance released by chronic microglial activation could cause neuronal damage and neurodegeneration. In both autopsy studies and transgenic AD mouse models, Aβ plaques are surrounded by activated microglia [6]. These findings suggest that an individual with more aggregated amyloid deposits is more likely to have greater microglial activity. Assessing microglial activation and testing its relationship to brain amyloid burden in living human patients is challenging. Brain inflammation in vivo has been studied with positron emission tomography (PET) using radiotracers binding to the 18 kDA translocator protein (TSPO), one of the very few proteins in the central nervous system altered in neuroinflammation [7]. Various radiotracers, including 11C-PK-11195, 11C-AC5216, 18F-DPA-714, and 18F-GE180, have been developed to bind with TSPO [8–11]. The binding affinity to TSPO and the ratio of tracers crossing the blood-brain barrier (BBB) are the major factors limiting the interpretation of radiotracers binding to microglial activation.
The recently developed 18F-GE180 radiotracer was demonstrated to have higher binding affinity to TSPO than the 11C-PK-11195 in several mouse models of neuroinflammation [12–14]. By collecting 18F-GE180 microglial PET imaging and Pittsburgh compound B (11C-PiB) amyloid PET imaging data in the APP23 mouse model of AD, transgenic mice was found to have higher 18F-GE180 binding than wild-type mice [15]. In addition, a two-stage association between 18F-GE180 and amyloid PET was observed, namely 18F-GE180 binding initially increases with accumulated brain amyloid, but the signal plateaus despite continuing amyloidosis. 18F-GE180 binding in transgenic mice co-localized with the immunohistochemistry staining of ionized calcium-binding adaptor molecule 1 (Iba1), an inflammation marker, indicating that 18F-GE180 tracer could image the elevated microglial activation in transgenic mice, which is consistent with the observations from other animal studies [13, 14, 16–18]. This evidence collectively supported a signature two-stage association between microglial activation and amyloid in AD mouse model.
However, whether the 18F-GE180 signal in human brain is substantially derived from microglial activation or merely reflects the integrity of the BBB is unresolved. BBB permeability could vary with species [19]. 18F-GE180 has a good affinity for TSPO, but its uptake in the human brain is observed to be lower than another TSPO tracer 11C-PBR28 [20]. Therefore, the promising results from AD mice might not necessarily predict the performance in human patients. The required immunohistochemical staining technique used in mice to illustrate the biological interpretation of 18F-GE180 uptake are not feasible for living human subjects.
Reduced microglial metabolism was reported to be associated with decreased 18F-GE180 uptake in both mice and human, suggesting that the 18F-GE180 uptake in human might be beyond BBB permeability [21]. If the two-stage association between microglial activation and amyloid observed in mice could be replicated with human 18F-GE180 and amyloid PET data, it could further serve as an additional piece of evidence supporting that elevated 18F-GE180 uptake in human brain might be substantially derived from abnormal microglial activation, instead of merely driven by disrupted BBB integrity.
In this study, we conducted the analysis with 18F-GE180 PET and 18F-AV45 amyloid PET imaging data from a cohort of elderly participants. We hypothesized that the cognitively impaired (CI) participants have higher 18F-GE180 uptake than the cognitively unimpaired (CU) individuals, and that the association between 18F-GE180 and 18F-AV45 is consistent with the two-stage association observed with the AD mouse model. To test our hypothesis, we first compared the differences between participants with and without cognitive impairment, then analyzed the association between these two PET modalities.
MATERIALS AND METHODS
Subjects
The data used in this study were collected from the Center for Neurodegeneration and Translational Neuroscience (CNTN, https://nevadacntn.org/). All participants were recruited at Cleveland Clinic Lou Ruvo Center for Brain Health (CCLRCBH), Las Vegas, Nevada. The study was approved by Cleveland Clinic Institutional Review Board and all participants gave written, informed consent. Only the participants with mixed or high affinity binding affinity to TSPO as determined by a single nucleotide polymorphism in the TSPO gene [22] were recruited for 18F-GE180 PET imaging. Twenty-four participants, consisting of 12 CU participants and 12 CI participants diagnosed clinically with mild cognitive impairment or mild dementia, were included. Diagnosis was based on the National Institute on Aging/Alzheimer’s Association (NIA/AA) clinical criteria [23, 24] and supported by assessment with the Montreal Cognitive Assessment (MoCA; shown in Table 1) and other neuropsychological assessments [25]. All 24 participants had 18F-GE180 PET and T1 structural magnetic resonance imaging available. All participants except one had 18F-AV45 PET scan available. Participants exhibited a broad range of amyloid standardized uptake value ratios (SUVRs), allowing study of the association between 18F-GE180 PET and brain amyloid burden. Demographic characteristics of the participants included in the study are summarized in Table 1.
Table 1
Demographic characteristics of the study participants
| CU | CI | p | |
| Age, y (SD) | 70.75 (7.48) | 74.58 (6.23) | 0.19 |
| Sex, M/F | 06/06 | 07/05 | 0.68 |
| Amyloid positivity | 1/11/0 | 8/3/1 | <0.001 |
| (+/–/NA) | |||
| MoCA (SD) | 27.08 (2.07) | 21.83 (4.06) | <0.001 |
| Weight, kg (SD) | 78.4 (13.0) | 78.0 (18.6) | 0.95 |
| Education, y (SD) | 15.25 (2.05) | 15.83 (2.59) | 0.55 |
CU, cognitively unimpaired; CI, cognitively impaired; F, female; M, male; kg, kilogram; MoCA, Montreal Cognitive Assessment; SD, standard deviation; y, years; NA, not available.
18F-AV45 and 18F-GE180 PET acquisition
Amyloid PET data were acquired from enrolled subjects after injection of 370 MBq (±10%) of 18F-AV45 (florbetapir). PET images were acquired for 20 min at 50–90 min after injection. The images were reconstructed using three-dimensional ordered-subset expectation maximization to an image size 256×256 matrix, slice thickness of 2.0 mm, and post reconstruction Gaussian filter of 3 mm.
CCLRBH had the investigational new drug (IND) approval from United States Food and Drug Administration to use 18F-GE180 radiotracers for human PET imaging. 18F-GE180 PET imaging was acquired from enrolled participants after injection of 185 MBq (±10%) of 18F-GE180. Following the protocols suggested by the vendor, the PET data were collected for 30 min beginning 75 min after injection. The images were reconstructed using three-dimensional ordered-subset expectation maximization to an image size 256×256 matrix and slice thickness of 2.0 mm.
Imaging analysis
The same analysis pipeline was used for both 18F-AV45 and 18F-GE180. Briefly, PET images were coregistered to their T1 structural image. The T1 images were input to FreeSurfer 6.0 (https://surfer.nmr.mgh.harvard.edu/) for anatomical segmentation and regional labelling. Regional SUVRs were computed by averaging the signal from gray matter voxels in each region and then normalized to the mean signal of the whole cerebellum. Then the mean SUVRs of four brain areas, including frontal, anterior/posterior cingulate, lateral parietal, and lateral temporal, were computed. The regions in each brain area can be found in Landau et al. [26]. The composite SUVR was calculated by averaging across these four brain areas. The composite SUVR from 18F-AV45 PET represents the overall assessment of brain amyloid, which is used in a binary approach to determine brain amyloid positivity with the cutoff of 1.11. Among the twelve CI participants, eight individuals were determined to be amyloid positive, three individuals were amyloid negative, and one individual had no 18F-AV45 amyloid PET scan. As to the twelve CU participants, only one subject was amyloid positive and all rest 11 subjects were amyloid negative.
Statistical analysis
While cerebellum is widely used as the reference region for 18F-AV45 PET, there is no consensus about the reference region for 18F-GE180 PET. Therefore, we first used 2-sample t-tests to compare the mean signal for the cerebellum between CI and CU groups to validate its usage as the reference region for 18F-GE180 PET. The 18F-GE180 signal intensity at cerebellum did not show a difference between the CI and CU group (see Fig. 2a and Results), indicating that it is appropriate to use cerebellum as the reference region and the differences of composite and regional 18F-GE180 SUVR are not driven by the discrepancy of cerebellar signal between groups. The overall between-group difference of the 18F-GE180 signal was evaluated by using the composite SUVR, followed by a set of region-wise comparisons of SUVRs from 39 cortical and subcortical regions defined by FreeSurfer (left- and right-hemisphere combined; list of regions can be found in the Supplementary Table 1). The false discovery rate (FDR) was used to correct for multiple comparisons. The differences of the 18F-AV45 composite SUVR between CU and CI group were also calculated. Since brain amyloid accumulates widely in the cortex, we did not carry out a region-wise comparison of 18F-AV45. With the observation of nonlinear association between 18F-AV45 and 18F-GE180, a restricted cubic spline regression was used to fit the curve with the corresponding SUVRs from the four brain areas described above (frontal, anterior/posterior cingulate, lateral parietal and lateral temporal). A bootstrapping technique was used to obtain the 95% confidence interval of the fitting curve with 1000 iterations. Then separate linear fitting was conducted to evaluate the association with 18F-AV45 SUVR below or above 1.15. This value was determined by the “elbow” point of the nonlinear fitting curve, indicating the transition point of the association between 18F-GE180 and 18F-AV45, which is irrelevant to amyloid positivity.
RESULTS
The 18F-GE180 SUVR image from one CI participant is shown on the upper panel of Fig. 1, and the co-registered T1 structural image is presented on the lower panel. Elevated signal intensity following the contour of parahippocampal gyrus (pointed by white arrows) was observed. The group comparison of the original 18F-GE180 signal at cerebellum did not show a difference between the CI and CU group (Fig. 2a; p > 0.05 and effect size d = 0.17). The CI group had higher composite SUVR than the CU group with moderate effect for 18F-GE180 (Fig. 2b; Cohen’s d = 0.61) and very large effect for 18F-AV45 (Fig. 2b; Cohen’s d = 1.46), although the difference for 18F-GE180 composite SUVR did not reach the significance level due to limited sample size.
Fig. 1
18F-GE180 PET SUVR image (upper panel) and T1 structural MRI image (lower panel) from a cognitively impaired participant. Elevated 18F-GE180 uptake following the contour of entorhinal cortex and parahippocampal gyrus (pointed by white arrows) was observed.
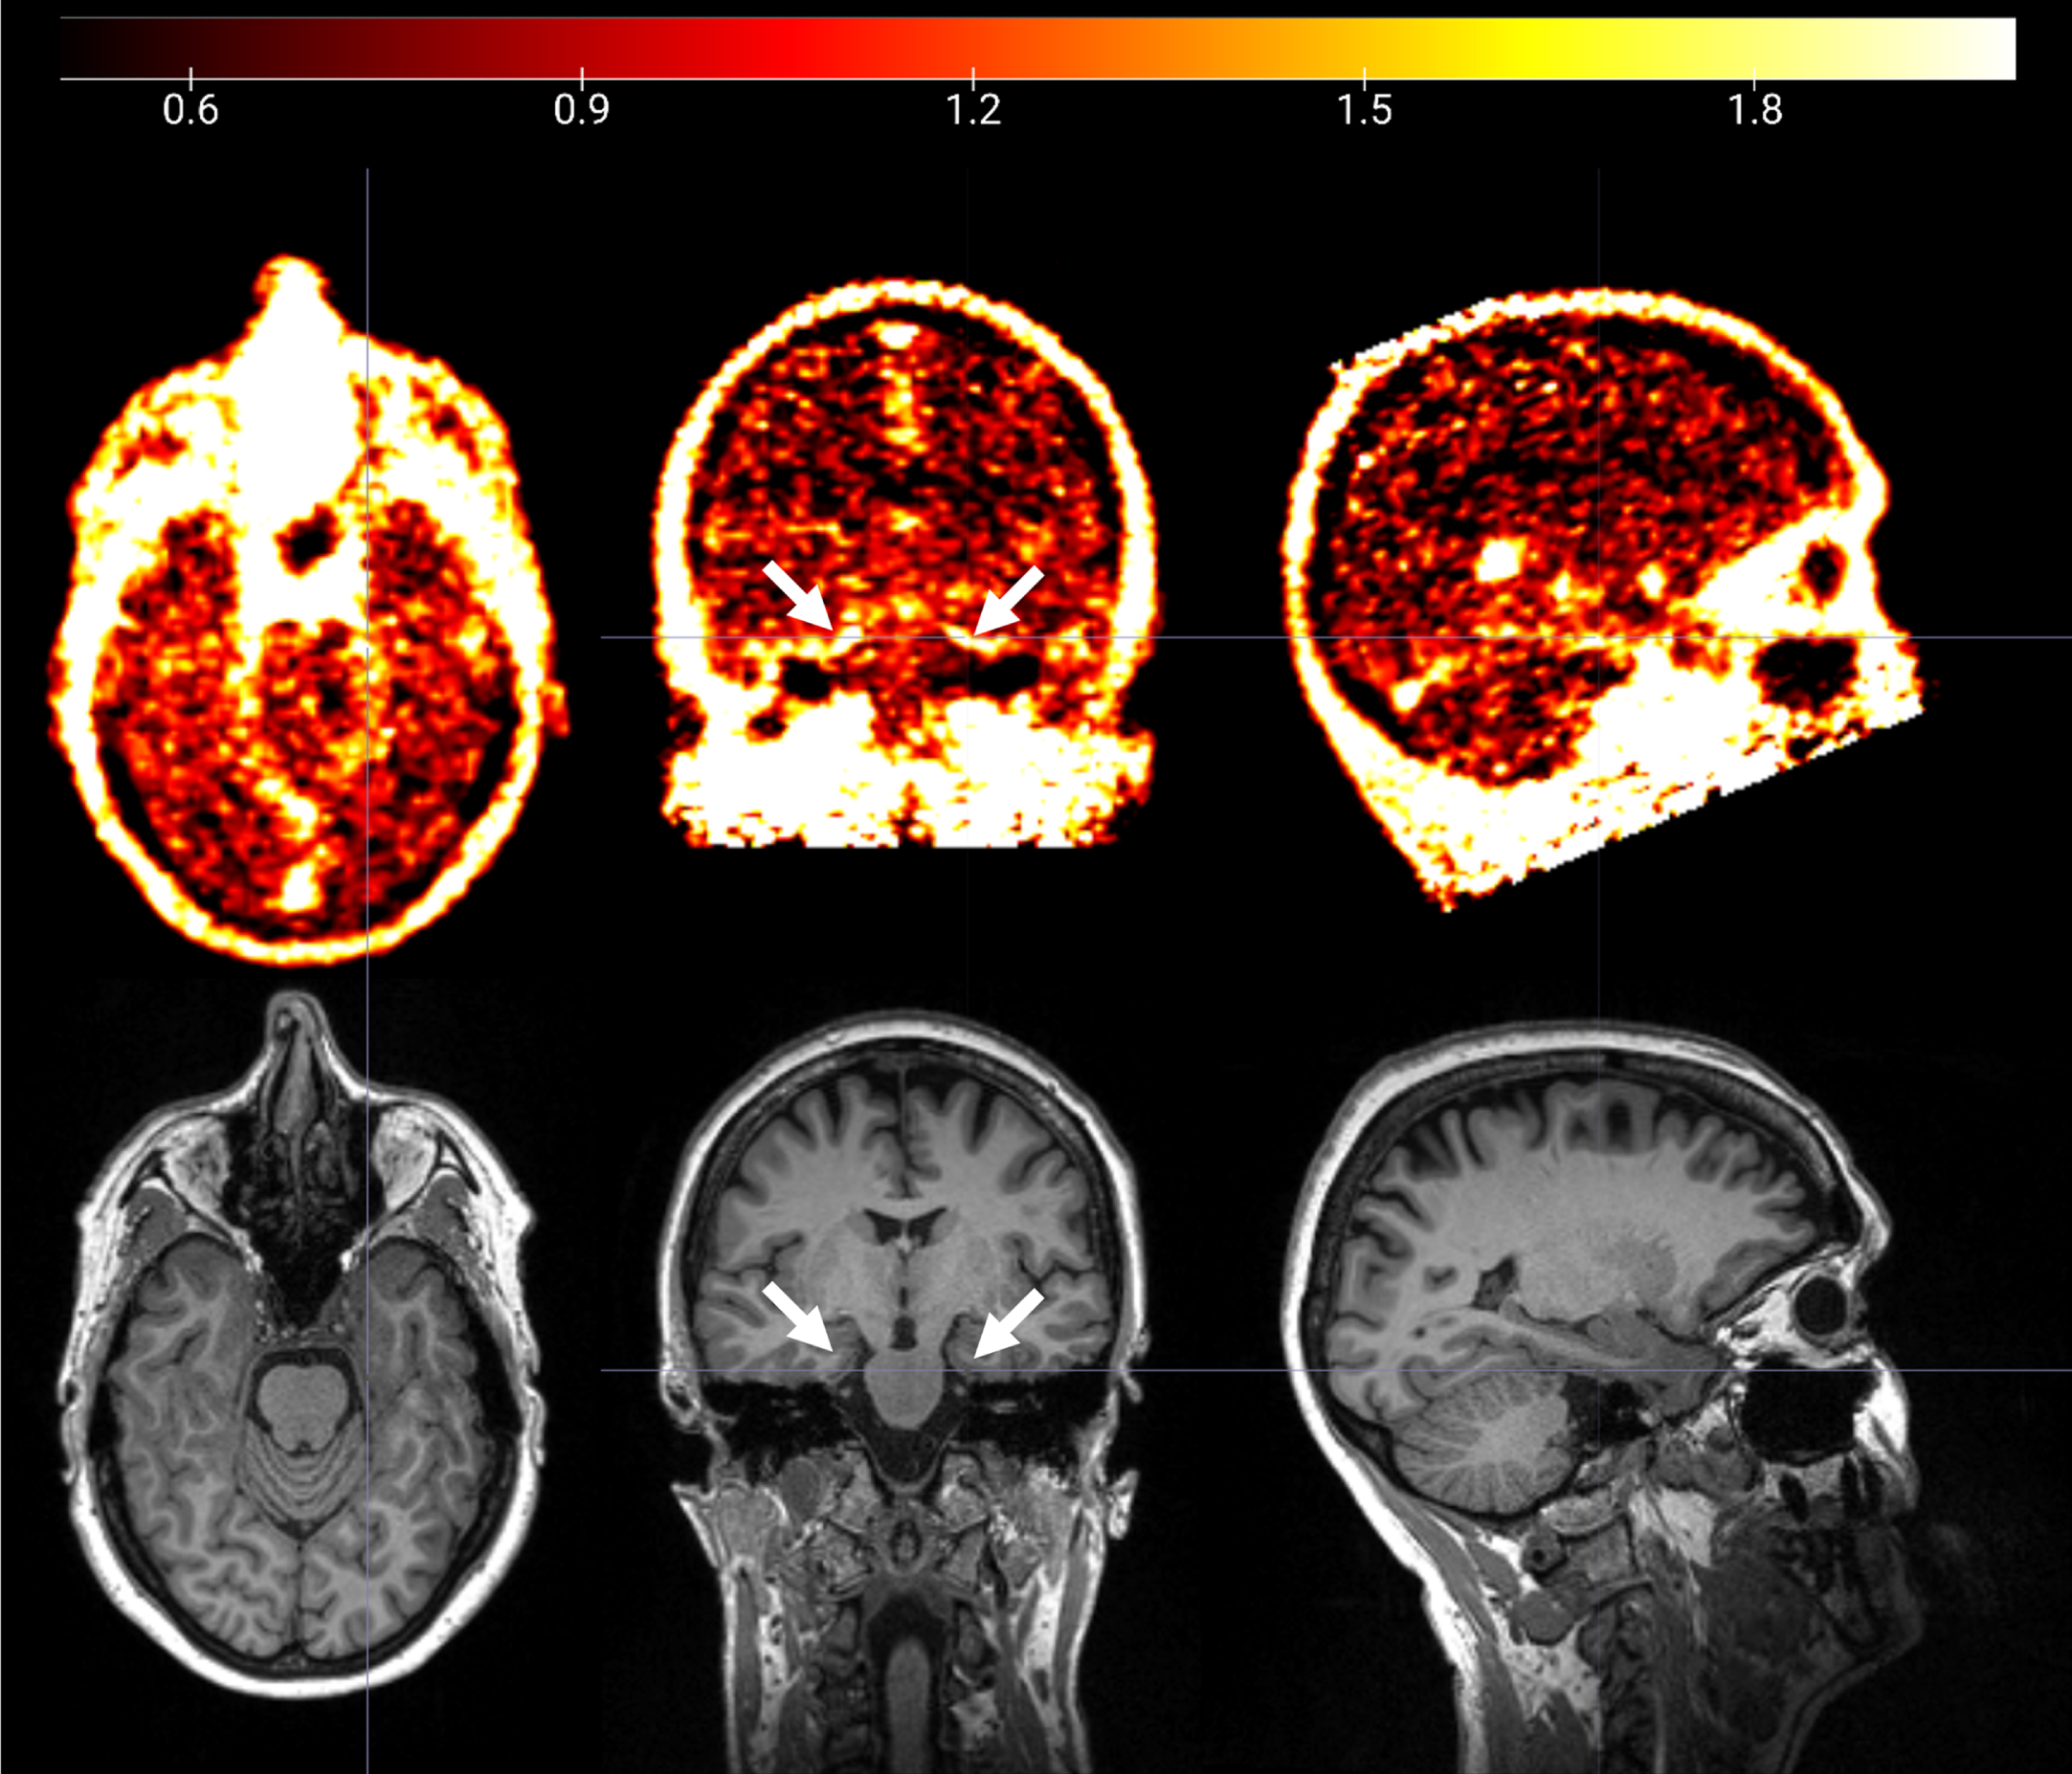
Fig. 2
Group comparison between CU and CI participants. (a) Group comparison of the mean intensity of raw 18F-GE180 signal in cerebellum. (b) Group comparison of 18F-GE180 and 18F-AV45 composite SUVRs. (c) Group comparison of regional 18F-GE180 SUVRs. Only the regions with at least moderate effect sizes (Cohen’s d > = 0.5) are shown in the plot. The effect sizes are marked as black dots. Asterisks (*) indicate the regions showing significant group differences after FDR correction. Gray dots and brown diamonds indicate the regional 18F-GE180 SUVRs for CU (cognitively unimpaired) and CI (cognitively impaired) participants, respectively.
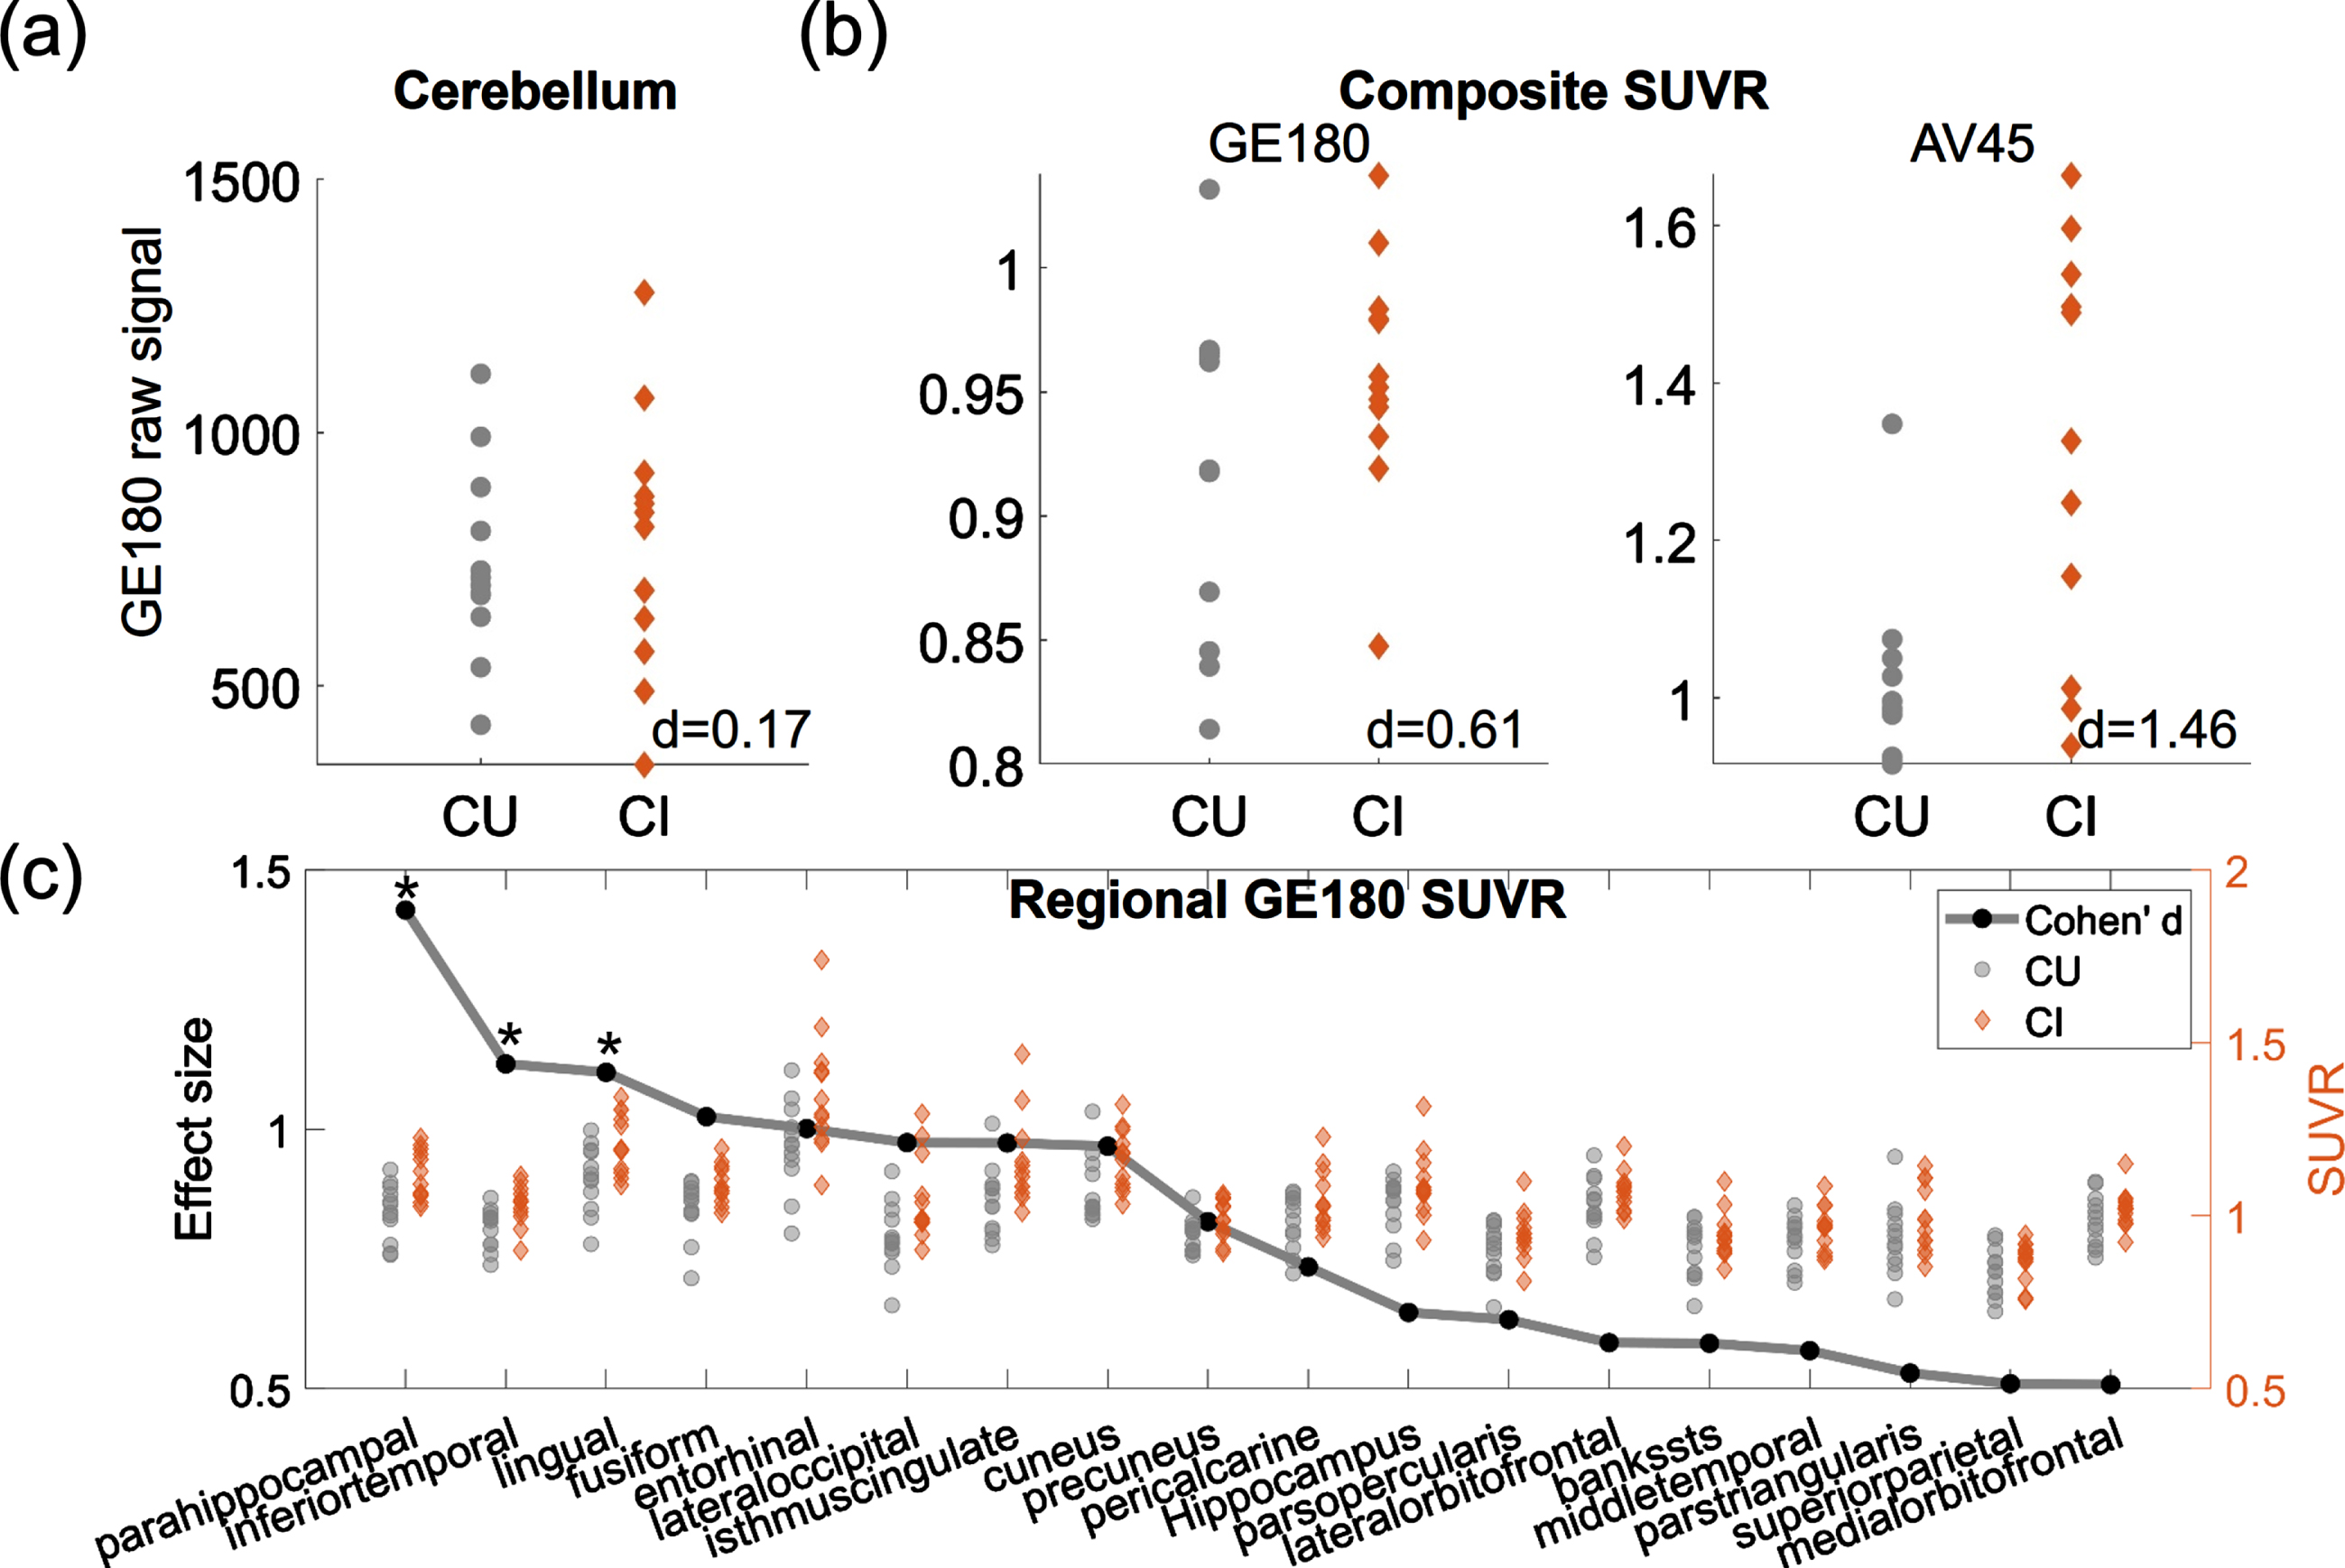
The regions having group differences with at least moderate effect sizes (Cohen’s d > = 0.5) are shown in Fig. 2c, with black dots representing the effect sizes and the gray dots and brown diamonds indicating the regional SUVRs for CU and CI participants, respectively. Higher 18F-GE180 SUVR in CI group was observed mainly in the parietal-temporal area. The group differences at parahippocampal, inferior temporal gyrus and lingual gyrus were significant after FDR correction (corrected p value <0.05). The most substantial regional difference was observed at parahippocampal gyrus with a very large effect (Cohen’s d = 1.42). No regions in the CI group showed lower 18F-GE180 compared to CU group. The complete list of regional comparisons can be found in Supplementary Table 1.
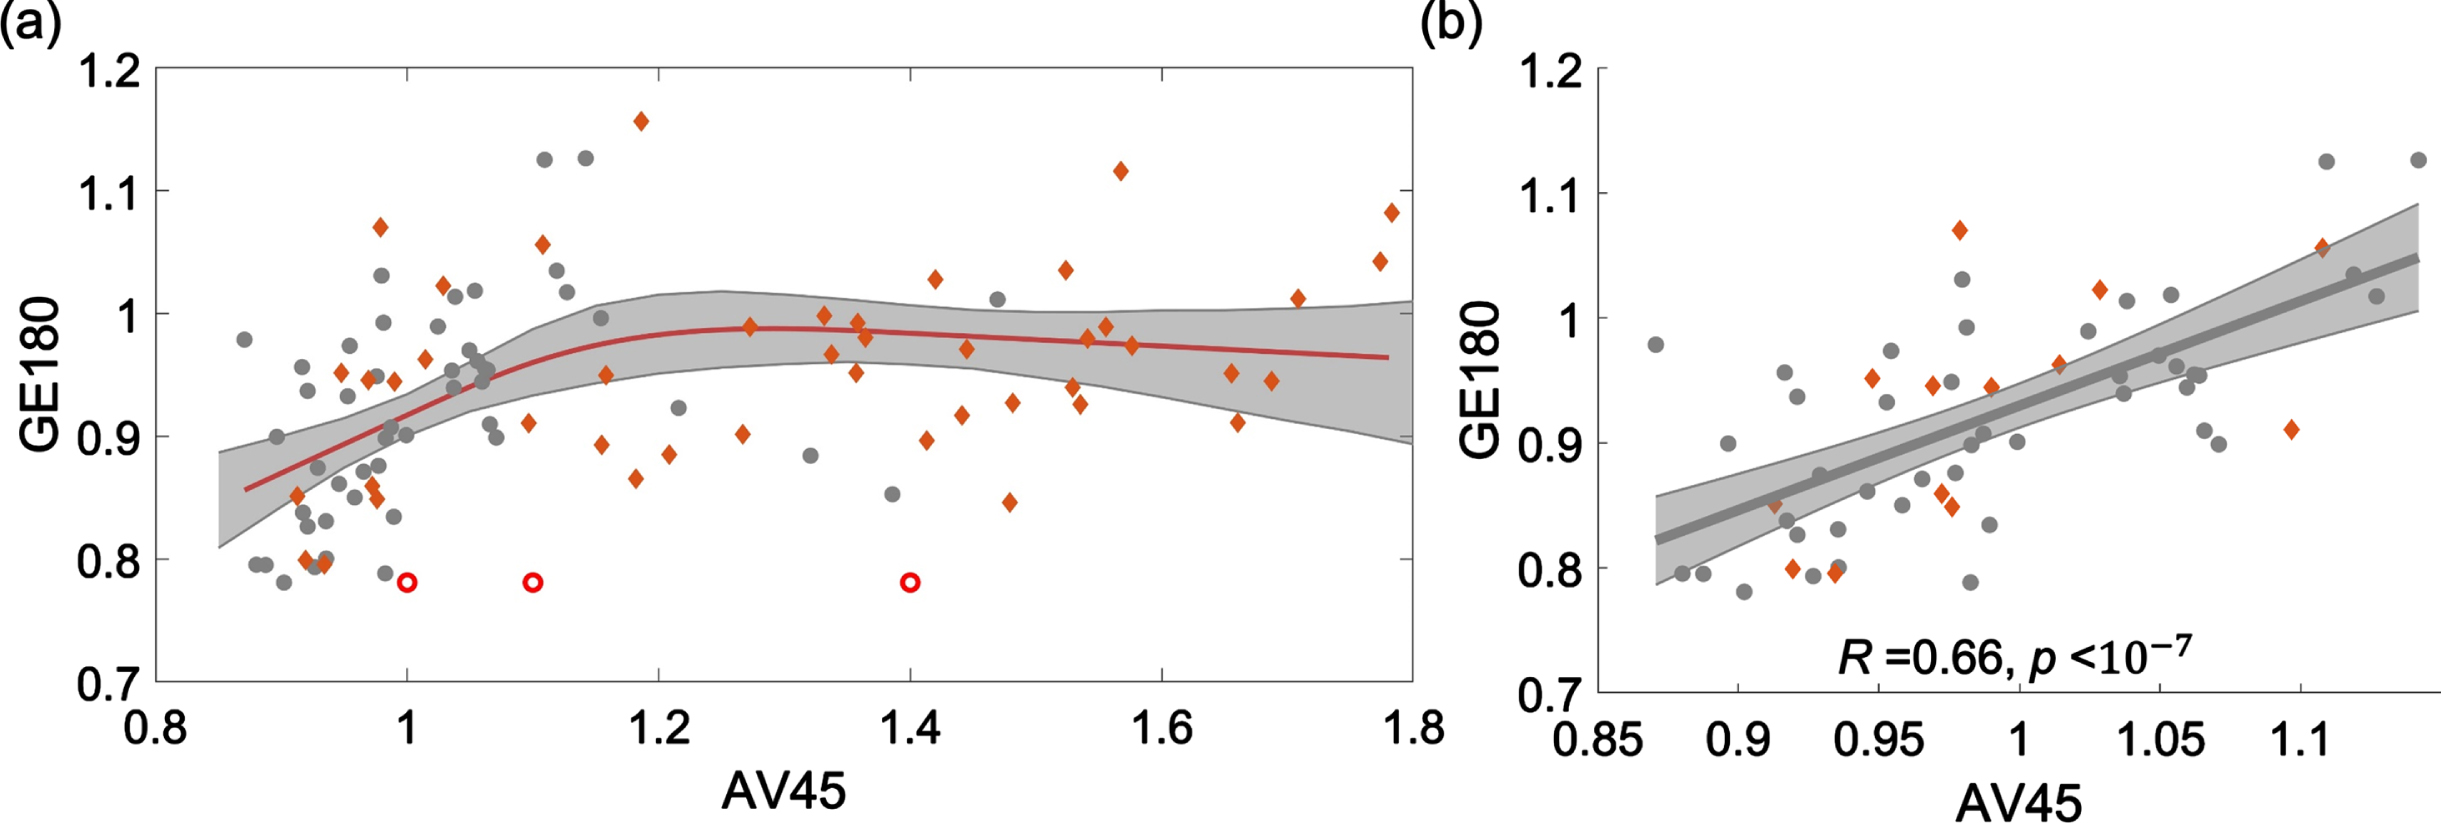
18F-AV45 and 18F-GE180 PET data were demonstrated to have a nonlinear relationship, as shown in the scatter plot of SUVRs from four brain areas, including frontal, anterior/posterior cingulate, lateral parietal, and lateral temporal (Fig. 3a). When the 18F-AV45 was relatively low (approximately <1.15), 18F-GE180 was positively correlated to 18F-AV45. When 18F-AV45 was higher, 18F-GE180 became poorly correlated to 18F-AV45 and presented as a flat fitting curve in the figure. To evaluate the significance level of the positive association in the lower range of 18F-AV45, a separate linear fitting was conducted to evaluate the association within the range of 18F-AV45 SUVR <1.15, a significant association between 18F-AV45 and 18F-GE180 was observed with R = 0.66 (R-squared = 0.44) and p value <10–7. Such an association remained to be highly significant when we used linear mixed effect model to evaluate the association with brain area modelled as a random effect, suggesting that such an association was not due to multiple measures from each individual used in the analysis. The separate scatter plots for these four brain areas in the lower range are shown in Supplementary Figure 1, similar positive associations were consistently observed at these four brain areas.
Fig. 3
Scatter plot of 18F-AV45 versus 18F-GE180 SUVRs from four brain areas, including frontal, anterior/posterior cingulate, lateral parietal, and lateral temporal. (a) A restricted cubic spline regression is conducted with the full range of AV45 SUVR. 18F-GE180 was positively correlated to 18F-AV45 when the 18F-AV45 was relatively low (approximately <1.15) and then became poorly correlated when 18F-AV45 was higher. (b) A linear fitting analysis was conducted in the lower 18F-AV45 range with SUVR <1.15. Similar trends were observed when the fitting was conducted for these four brain areas separately (Supplementary Figure 1).
DISCUSSION
Our study assessed a disease cohort having both 18F-GE180 and 18F-AV45 PET imaging available to help assess diagnostic power of 18F-GE180 and its relationship with brain amyloid burden. Very few studies investigated the diagnostic power of 18F-GE180 PET and its association with brain amyloid pathology. There is ongoing controversy about whether elevated 18F-GE180 uptakes represents overexpressed TSPO or reflects BBB integrity. This study was intended to evaluate the capability of 18F-GE180 PET in detecting pathological alterations in patients with cognitive impairment and provide additional evidence to clarify its potential biological meaning in human brains.
By using the same analysis pipeline as 18F-AV45 amyloid PET imaging, a 18F-GE180 composite score representing the overall assessment of radiotracer uptake in the brain was derived. At the whole brain level, 18F-GE180 uptake was found to be moderately higher in participants with cognitive impairment compared to those without cognitive impairment, whereas the 18F-AV45 uptake achieved a much more substantial difference between groups.
Region-wise analysis showed that nearly all regions had higher 18F-GE180 uptake in the CI group, but the difference varied from very small (Cohen’s d < 0.1) to very large (Cohen’s d > 1.2), with the regions showing substantially elevated 18F-GE180 uptake mainly located in the parietal-temporal area, including middle temporal gyrus, parahippocampal, hippocampus, superior parietal lobule, and precuneus. The regions identified match the known topology of the microglial activation in neurodegenerative diseases [21, 27, 28]. Parahippocampal gyrus was observed to have the most striking group difference. A previous report with an independent cohort also demonstrated elevated 18F-GE180 uptake in patients with AD [28]. The regions identified in our study are implicated in studies of the regional neuropathological changes in AD, including brain atrophy, hypometabolism, and tau pathology [29–31].
The variability of regional differences suggests that a relatively spatially-focal pathological alteration was detected by 18F-GE180. In fact, microglial activation was demonstrated to propagate and colocalize with tau pathology in a Braak stage-like fashion [32, 33]. The regions showing elevated 18F-GE180 in CI groups, such as hippocampus and entorhinal cortex, are the area susceptible to tau pathology at the early Braak stage. Based on the effect sizes in the group comparison, the parahippocampal (posterior portion of parahippocampal gyrus) had larger difference than the entorhinal cortex (anterior portion of the parahippocampal gyrus) and the hippocampus, although they are functionally and anatomically close to each other. Possibly due to their anatomical positions, the mean magnitude and the between-subject variance of 18F-GE180 SUVRs differed substantially at these three regions, which might contribute to the discrepancy of group differences observed among them.
In contrast, both autopsy and amyloid PET imaging studies have shown that, consistent with our findings, amyloid-β accumulates in nearly all cortical regions early in the disease continuum [34, 35]. The limited spatial extension of abnormal 18F-GE180 uptake, in contrast to widespread amyloid accumulation observed with 18F-AV45 amyloid PET, may contribute to the smaller difference observed with the 18F-GE180 composite score compared to 18F-AV45 composite score.
Preclinical imaging studies showed that the 18F-GE180 PET ligand co-localized with immunohistochemical staining of an inflammatory marker [15], indicating the feasibility of 18F-GE180 in detecting neuroinflammation in mice. In human subjects, the biological meaning of 18F-GE180 PET is uncertain. BBB permeability varies across species [19] and the observations in mice regarding 18F-GE180 do not necessarily guide human conclusions. Given the low permeability of the BBB to 18F-GE180 in human PET, some suggested that 18F-GE180 PET signal mainly reflected the integrity of BBB and was not specific for TSPO [36–38]. However, 18F-GE180 showed promising results in detecting neuroinflammation in patients with multiple sclerosis [39] or gliomas [40]. In these disease conditions, areas with compromised BBB did not necessarily show significant 18F-GE180 uptake while increased uptake was found in regions without visible contrast enhancement in gadolinium-contrasted MRI image expected with BBB impairment [41]. In addition, one previous study showed that pharmacological depletion of microglia led to decreased 18F-GE180 signal in mice and the reduction of 18F-GE180 signal was positively associated with reduction of cerebral glucose uptake in both mice models and patients with neurodegenerative diseases [21], suggesting that microglial activation contributes, at least partially, to the signal observed in 18F-GE180 human PET imaging. In this study, we showed that 18F-GE180 was positively correlated with 18F-AV45 when 18F-AV45 was low and was poorly correlated when the 18F-AV45 SUVR was higher. This finding suggests that 18F-GE180 uptake initially increases with brain amyloid and then plateaus with continuing amyloidosis. Microglial activation was found to be prior to tau pathology [33], and amyloid pathology was followed by tau pathology in the amyloid cascade model [42]. The positive association between 18F-GE180 and 18F-AV45 observed in the study in the lower amyloid range is in line with this previous research. The poor association in the higher amyloid range could be due to the collective effect of more concurrent pathological alterations (e.g., atrophy) with disease progression. The two-stage association of human 18F-GE180 PET with amyloid PET was consistent with previous observations in preclinical study [15], where increased 18F-GE180 uptake was demonstrated to colocalize with an inflammatory marker through immunohistochemistry staining technology. An independent study [27] showed that 18F-GE180 SUVR was positively associated with cerebrospinal fluid soluble triggering receptor expressed on myeloid cells 2 (sTREM2), a fluid marker of activated microglia, when sTREM2 concentration was less than 15 ng/ml. These results collectively provide evidence suggesting that the 18F-GE180 uptake in human brain is more likely substantially derived from microglial activation, instead of merely a marker of BBB integrity. Collectively, the evidence of higher 18F-GE180 SUVRs in regions prone to tau pathology and its relevance with brain amyloid suggested the potential utility of 18F-GE180 to detect pathological changes since the early stage.
There are limitations with the study. First, although the consistent association of 18F-GE180 and 18F-AV45 in human and mice indirectly suggests that neuroinflammation leads to the elevated 18F-GE180 uptake in CI participants as observed in our study, more direct evidence to exclude or adjust for the influence of BBB breakdown would further validate the biological meaning of the findings. We do not have gadolinium-enhanced MRI or postmortem brains available to evaluate the potential influence of BBB breakdown. The serum level of S100b protein is an emerging candidate peripheral marker of BBB permeability [43], and testing its relevance to 18F-GE180 may be an alternative approach to investigate the influence of BBB breakdown on the PET data. Second, our study was conducted with cross-sectional data, longitudinal studies of 18F-GE180 in humans would be beneficial to further consolidate our findings. Third, the number of participants in this study was relatively small. All previous 18F-GE180 studies were reported with cohorts of comparable sizes [21, 27, 28]. The exploratory nature of the current study requires independent studies to confirm the findings. Forth, the 18F-GE180 PET scans were collected up to 2 years after 18F-AV45 PET scans. Amyloidosis in AD is a slow process and its accumulation lasts for more than decades before onset of cognitive syndromes [44], therefore, brain amyloid load was not expected to change substantially in the time gap. In addition, the time gap did not differ between CU and CI groups.
In summary, our study demonstrated the potential utility of in vivo 18F-GE180 PET in detecting the pathological alterations in patients with cognitive impairment and provides evidence supporting that 18F-GE180 uptake in humans might be substantially influenced by an innate immune response, instead of merely a marker of disrupted BBB integrity, although more evidence is required to further examine the robustness of 18F-GE180 in assessing inflammation in human subjects.
ACKNOWLEDGMENTS
The authors have no acknowledgments to report.
FUNDING
This research project was supported by the NIGMS grant P20GM109025, NIA Grant 1RF1AG071566, NIA grant P20AG068053, Cleveland Clinic Keep Memory Alive Young Investigator Award, a private grant from Stacie and Chuck Matthewson, a private grant from Peter and Angela Dal Pezzo, and a private grant from Lynn and William Weidner. JLC is also supported by NINDS grant U01NS093334; NIA grant R01AG053798; NIA grant P30AG072959; NIA grant R35AG71476; Alzheimer’s Disease Drug Discovery Foundation (ADDF); Ted and Maria Quirk Endowment; and the Joy Chambers-Grundy Endowment.
CONFLICT OF INTEREST
JLC has provided consultation to Acadia, Actinogen, Acumen, AlphaCognition, Aprinoia, AriBio, Artery, Biogen, BioVie, Cassava, Cerecin, Diadem, EIP Pharma, Eisai, GemVax, Genentech, GAP Innovations, Janssen, Jocasta, Karuna, Lilly, Lundbeck, LSP, Merck, NervGen, Novo Nordisk, Oligomerix, Optoceutics, Ono, Otsuka, PRODEO, Prothena, ReMYND, Roche, Sage Therapeutics, Signant Health, Simcere, Sunbird Bio, Suven, SynapseBio, TrueBinding, Vaxxinity, and Wren pharmaceutical, assessment, and investment companies.
JKC is an Editorial Board Member of this journal but was not involved in the peer-review process nor had access to any information regarding its peer-review.
All other authors do not have conflict of interest to disclose.
DATA AVAILABILITY
The data supporting the findings of this study are available through data request at https://nevadacntn.org/.
SUPPLEMENTARY MATERIAL
[1] The supplementary material is available in the electronic version of this article: https://dx.doi.org/10.3233/JAD-230631.
REFERENCES
[1] | Patel NS , Paris D , Mathura V , Quadros AN , Crawford FC , Mullan MJ ((2005) ) Inflammatory cytokine levels correlate with amyloid load in transgenic mouse models of Alzheimer’s disease. J Neuroinflammation 2: , 9. |
[2] | Lue LF , Rydel R , Brigham EF , Yang LB , Hampel H , Murphy GM Jr , Brachova L , Yan SD , Walker DG , Shen Y ((2001) ) Inflammatory repertoire of Alzheimer’s disease and nondemented elderly microglia. Glia 35: , 72–79. |
[3] | Guerreiro R , Wojtas A , Bras J , Carrasquillo M , Rogaeva E , Majounie E , Cruchaga C , Sassi C , Kauwe JS , Younkin S ((2013) ) TREM2 variants in Alzheimer’s disease. N Engl J Med 368: , 117–127. |
[4] | Bradshaw EM , Chibnik LB , Keenan BT , Ottoboni L , Raj T , Tang A , Rosenkrantz LL , Imboywa S , Lee M , Von Korff A ((2013) ) CD33 Alzheimer’s disease locus: Altered monocyte function and amyloid biology. Nat Neurosci 16: , 848. |
[5] | Schott JM , Revesz T ((2013) ) Inflammation in Alzheimer’s disease: Insights from immunotherapy. Brain 136: , 2654–2656. |
[6] | Baik SH , Kang S , Son SM , Mook-Jung I ((2016) ) Microglia contributes to plaque growth by cell death due to uptake of amyloid β in the brain of Alzheimer’s disease mouse model. Glia 64: , 2274–2290. |
[7] | Tournier BB, Tsartsalis S, Ceyzériat K, Garibotto V, Millet P ((2020) ) In vivo TSPO signal and neuroinflammation in Alzheimer’s disease. Cells 9: , 1941. |
[8] | Rapic S , Backes H , Viel T , Kummer MP , Monfared P , Neumaier B , Vollmar S , Hoehn M , Van der Linden A , Heneka MT ((2013) ) Imaging microglial activation and glucose consumption in a mouse model of Alzheimer’s disease. Neurobiol Aging 34: , 351–354. |
[9] | Maeda J , Zhang M-R , Okauchi T , Ji B , Ono M , Hattori S , Kumata K , Iwata N , Saido TC , Trojanowski JQ ((2011) ) positron emission tomographic imaging of glial responses to amyloid-β and tau pathologies in mouse models of Alzheimer’s disease and related disorders. J Neurosci 31: , 4720–4730. |
[10] | Takkinen JS , Lopez-Picon FR , Al Majidi R , Eskola O , Krzyczmonik A , Keller T , Löyttyniemi E , Solin O , Rinne JO , Haaparanta-Solin M ((2017) ) Brain energy metabolism and neuroinflammation in ageing APP/PS1-21 mice using longitudinal 18F-FDG and 18F-DPA-714 PET imaging. J Cereb Blood Flow Metab 37: , 2870–2882. |
[11] | Liu B , Le KX , Park M-A , Wang S , Belanger AP , Dubey S , Frost JL , Holton P , Reiser V , Jones PA ((2015) ) detection of age-and disease-related increases in neuroinflammation by 18F-GE180 TSPO microPET imaging in wild-type and Alzheimer’s transgenic mice. J Neurosci 35: , 15716–15730. |
[12] | Sridharan S , Lepelletier F-X , Trigg W , Banister S , Reekie T , Kassiou M , Gerhard A , Hinz R , Boutin H ((2017) ) Comparative evaluation of three TSPO PET radiotracers in a LPS-induced model of mild neuroinflammation in rats. Mol Imaging Biol 19: , 77–89. |
[13] | Dickens AM , Vainio S , Marjamäki P , Johansson J , Lehtiniemi P , Rokka J , Rinne J , Solin O , Haaparanta-Solin M , Jones PA , Trigg W , Anthony DC , Airas L ((2014) ) Detection of microglial activation in an acute model of neuroinflammation using PET and radiotracers 11C-(R)-PK11195 and 18F-GE-180. J Nucl Med 55: , 466–472. |
[14] | Boutin H , Murray K , Pradillo J , Maroy R , Smigova A , Gerhard A , Jones PA , Trigg W ((2015) ) 18F-GE-180: A novel TSPO radiotracer compared to 11C-R-PK11195 in a preclinical model of stroke. Eur J Nucl Med Mol Imaging 42: , 503–511. |
[15] | López-Picón FR , Snellman A , Eskola O , Helin S , Solin O , Haaparanta-Solin M , Rinne JO ((2018) ) Neuroinflammation appears early on PET imaging and then plateaus in a mouse model of Alzheimer disease. J Nucl Med 59: , 509–515. |
[16] | Lucot KL , Stevens MY , Bonham TA , Azevedo EC , Chaney AM , Webber ED , Jain P , Klockow JL , Jackson IM , Carlson ML , Graves EE , Montine TJ , James ML ((2022) ) Tracking innate immune activation in a mouse model of Parkinson’s disease using TREM1 and TSPO PET tracers. J Nucl Med 63: , 1570–1578. |
[17] | Bartos LM , Kirchleitner SV , Blobner J , Wind K , Kunze LH , Holzgreve A , Gold L , Zatcepin A , Kolabas ZI , Ulukaya S , Weidner L , Quach S , Messerer D , Bartenstein P , Tonn JC , Riemenschneider MJ , Ziegler S , von Baumgarten L , Albert NL , Brendel M ((2022) ) 18 kDa translocator protein positron emission tomography facilitates early and robust tumor detection in the immunocompetent SB28 glioblastoma mouse model. Front Med (Lausanne) 9: , 992993. |
[18] | James ML , Belichenko NP , Shuhendler AJ , Hoehne A , Andrews LE , Condon C , Nguyen TV , Reiser V , Jones P , Trigg W , Rao J , Gambhir SS , Longo FM ((2017) ) [(18)F]GE-180 PET detects reduced microglia activation after LM11A-31 therapy in a mouse model of Alzheimer’s disease. Theranostics 7: , 1422–1436. |
[19] | O’Brown NM , Pfau SJ , Gu C ((2018) ) Bridging barriers: A comparative look at the blood-brain barrier across organisms. Genes Dev 32: , 466–478. |
[20] | Zanotti-Fregonara P , Pascual B , Rizzo G , Yu M , Pal N , Beers D , Carter R , Appel SH , Atassi N , Masdeu JC ((2018) ) Head-to-head comparison of 11C-PBR28 and 18F-GE180 for quantification of the translocator protein in the human brain. J Nucl Med 59: , 1260–1266. |
[21] | Xiang X , Wind K , Wiedemann T , Blume T , Shi Y , Briel N , Beyer L , Biechele G , Eckenweber F , Zatcepin A ((2021) ) Microglial activation states drive glucose uptake and FDG-PET alterations in neurodegenerative diseases. Sci Transl Med 13: , eabe5640. |
[22] | Owen DR , Gunn RN , Rabiner EA , Bennacef I , Fujita M , Kreisl WC , Innis RB , Pike VW , Reynolds R , Matthews PM , Parker CA ((2011) ) Mixed-affinity binding in humans with 18-kDa translocator protein ligands. J Nucl Med 52: , 24–32. |
[23] | Albert MS , DeKosky ST , Dickson D , Dubois B , Feldman HH , Fox NC , Gamst A , Holtzman DM , Jagust WJ , Petersen RC ((2011) ) The diagnosis of mild cognitive impairment due to Alzheimer’s disease: Recommendations from the National Institute on Aging-Alzheimer’s Association workgroups on diagnostic guidelines for Alzheimer’s disease. Alzheimers Dement 7: , 270–279. |
[24] | McKhann GM , Knopman DS , Chertkow H , Hyman BT , Jack CR Jr , Kawas CH , Klunk WE , Koroshetz WJ , Manly JJ , Mayeux R ((2011) ) The diagnosis of dementia due to Alzheimer’s disease: Recommendations from the National Institute on Aging-Alzheimer’s Association workgroups on diagnostic guidelines for Alzheimer’s disease. Alzheimers Dement 7: , 263–269. |
[25] | Rauch A , Wiklund J , Lumpkin GT , Frese M ((2009) ) Entrepreneurial orientation and business performance: An assessment of past research and suggestions for the future. Entrepreneurship Theory Practice 33: , 761–787. |
[26] | Landau SM , Mintun MA , Joshi AD , Koeppe RA , Petersen RC , Aisen PS , Weiner MW , Jagust WJ , Alzheimer’s Disease Neuroimaging Initiative ((2012) ) Amyloid deposition, hypometabolism, and longitudinal cognitive decline. Ann Neurol 72: , 578–586. |
[27] | Palleis C , Sauerbeck J , Beyer L , Harris S , Schmitt J , Morenas-Rodriguez E , Finze A , Nitschmann A , Ruch-Rubinstein F , Eckenweber F , Biechele G , Blume T , Shi Y , Weidinger E , Prix C , Bötzel K , Danek A , Rauchmann B-S , Stöcklein S , Lindner S , Unterrainer M , Albert NL , Wetzel C , Rupprecht R , Rominger A , Bartenstein P , Herms J , Perneczky R , Haass C , Levin J , Höglinger GU , Brendel M ((2021) ) assessment of neuroinflammation in 4-repeat tauopathies. Mov Disord 36: , 883–894. |
[28] | Rauchmann BS , Brendel M , Franzmeier N , Trappmann L , Zaganjori M , Ersoezlue E , Morenas-Rodriguez E , Guersel S , Burow L , Kurz C ((2022) ) Microglial activation and connectivity in Alzheimer disease and aging. Ann Neurol 92: , 768–781. |
[29] | Barnes J , Bartlett JW , van de Pol LA , Loy CT , Scahill RI , Frost C , Thompson P , Fox NC ((2009) ) A meta-analysis of hippocampal atrophy rates in Alzheimer’s disease. Neurobiol Aging 30: , 1711–1723. |
[30] | Bailly M , Destrieux C , Hommet C , Mondon K , Cottier J-P , Beaufils E , Vierron E , Vercouillie J , Ibazizene M , Voisin T ((2015) ) Precuneus and cingulate cortex atrophy and hypometabolism in patients with Alzheimer’s disease and mild cognitive impairment: MRI and 18F-FDG PET quantitative analysis using FreeSurfer. Biomed Res Int 2015: , 583931. |
[31] | Iqbal K , Alonso Ad C , Chen S , Chohan MO , El-Akkad E , Gong C-X , Khatoon S , Li B , Liu F , Rahman A ((2005) ) Tau pathology in Alzheimer disease and other tauopathies. Biochim Biophys Acta 1739: , 198–210. |
[32] | Hopp SC , Lin Y , Oakley D , Roe AD , DeVos SL , Hanlon D , Hyman BT ((2018) ) The role of microglia in processing and spreading of bioactive tau seeds in Alzheimer’s disease. J Neuroinflammation 15: , 269. |
[33] | Pascoal TA , Benedet AL , Ashton NJ , Kang MS , Therriault J , Chamoun M , Savard M , Lussier FZ , Tissot C , Karikari TK , Ottoy J , Mathotaarachchi S , Stevenson J , Massarweh G , Schöll M , de Leon MJ , Soucy JP , Edison P , Blennow K , Zetterberg H , Gauthier S , Rosa-Neto P ((2021) ) Microglial activation and tau propagate jointly across Braak stages. Nat Med 27: , 1592–1599. |
[34] | Thal DR , Rüb U , Orantes M , Braak H ((2002) ) Phases of Aβ-deposition in the human brain and its relevance for the development of AD. Neurology 58: , 1791–1800. |
[35] | Thal DR , Beach TG , Zanette M , Heurling K , Chakrabarty A , Ismail A , Smith APL , Buckley C ((2015) ) [18F]flutemetamol amyloid positron emission tomography in preclinical and symptomatic Alzheimer’s disease: Specific detection of advanced phases of amyloid-β pathology. Alzheimers Dement 11: , 975–985. |
[36] | Zanotti-Fregonara P , Pascual B , Rostomily RC , Rizzo G , Veronese M , Masdeu JC , Turkheimer F ((2020) ) Anatomy of 18F-GE180, a failed radioligand for the TSPO protein. Eur J Nucl Med Mol Imaging 47: , 2233–2236. |
[37] | Nicholas R , Brooks D , Owen D ((2020) ) 18F-GE180, a radioligand for the TSPO protein: Not ready for clinical trials in multiple sclerosis. Eur J Nucl Med Mol Imaging 47: , 2242–2243. |
[38] | Visi E , Hinz R , Punter M , Majid A , Gerhard A , Herholz K (2020) Efficacy and mechanism evaluation. In Positron emission tomography to image cerebral neuroinflammation in ischaemic stroke: A pilot study. NIHR Journals Library. Southampton. |
[39] | Unterrainer M , Mahler C , Vomacka L , Lindner S , Havla J , Brendel M , Böning G , Ertl-Wagner B , Kümpfel T , Milenkovic V ((2018) ) TSPO PET with [18F] GE-180 sensitively detects focal neuroinflammation in patients with relapsing–remitting multiple sclerosis. Eur J Nucl Med Mol Imaging 45: , 1423–1431. |
[40] | Albert NL , Unterrainer M , Fleischmann D , Lindner S , Vettermann F , Brunegraf A , Vomacka L , Brendel M , Wenter V , Wetzel C ((2017) ) TSPO PET for glioma imaging using the novel ligand 18F-GE-180: First results in patients with glioblastoma. Eur J Nucl Med Mol Imaging 44: , 2230–2238. |
[41] | Albert NL , Unterrainer M , Kaiser L , Brendel M , Vettermann FJ , Holzgreve A , Bartenstein P ((2020) ) In response to: Anatomy of 18F-GE180, a failed radioligand for the TSPO protein. Eur J Nucl Med Mol Imaging 47: , 2237–2241. |
[42] | Hardy JA , Higgins GA ((1992) ) Alzheimer’s disease: The amyloid cascade hypothesis. Science 256: , 184–185. |
[43] | Koh SX , Lee JK ((2014) ) S100B as a marker for brain damage and blood–brain barrier disruption following exercise. Sports Med 44: , 369–385. |
[44] | Villemagne VL , Burnham S , Bourgeat P , Brown B , Ellis KA , Salvado O , Szoeke C , Macaulay SL , Martins R , Maruff P , Ames D , Rowe CC , Masters CL ((2013) ) Amyloid β deposition, neurodegeneration, and cognitive decline in sporadic Alzheimer’s disease: A prospective cohort study. Lancet Neurol 12: , 357–367. |


