
Fusion of Low-Level Descriptors of Digital Voice Recordings for Dementia Assessment
Abstract
Digital voice recordings can offer affordable, accessible ways to evaluate behavior and function. We assessed how combining different low-level voice descriptors can evaluate cognitive status. Using voice recordings from neuropsychological exams at the Framingham Heart Study, we developed a machine learning framework fusing spectral, prosodic, and sound quality measures early in the training cycle. The model’s area under the receiver operating characteristic curve was 0.832 (±0.034) in differentiating persons with dementia from those who had normal cognition. This offers a data-driven framework for analyzing minimally processed voice recordings for cognitive assessment, highlighting the value of digital technologies in disease detection and intervention.
Digital technologies provide an unparalleled platform for health-related data acquisition and communication [1]. The recent viewpoint by the National Academy of Medicine underscores the potential of digital technologies in their ability to reduce inefficiencies, improve access, reduce costs, increase quality, and create individualized treatment plans [2]. For example, voice recordings offer an attractive modality to assess an individual’s cognitive status. As such, voice signature reflects an individual’s speaking ability, which is in and of itself a complex cognitive skill. Several studies have explored the utilization of an individual’s voice and correlated it with cognitive deficits by extracting essential speech and language features. Most of these methods involve manual derivation of voice-derived measures, often using manual transcription or voice-to-text transcription tools as a precursor to derivation of text-based linguistic features related to fluency, word-finding ability, or grammaticality. The process for deriving such features can be tedious and prone to error [3]. Moreover, quality control of the transcribed text needs to be documented before using them for analysis, and expertise required to perform such a task is not readily available at all locations. Finally, reliance on text-based features limits the generalizability of any solution across multiple languages/cultures. Development of a computational framework that could process voice recordings with minimal manual effort and involving features that are more universal can be useful for dementia screening in low-resource areas, where culturally appropriate assessment tools are inadequate, and in settings where large volumes of data would otherwise need to be manually processed.
Machine learning approaches offer powerful decision-making potential due to their ability to process different modalities of data and derive patterns that can map to specific outcomes. Several machine learning-based studies have reported high model performance in classifying the cognitive status of individuals based on their voice. A study by König and colleagues recorded voices while individuals were performing a controlled semantic fluency task, and trained machine learning classifiers to identify those with normal cognition (NC), mild cognitive impairment (MCI), and Alzheimer’s disease (AD) [4]. Although overall model accuracy was high, input features to the authors’ models were based on manual annotation, followed by auto-extraction of linguistic features. Shimoda and colleagues developed a machine learning prediction model to identify AD risk using voice data collected from daily conversations to derive vocal variables related to silent interval, pitch, intensity, and center of gravity [5]. Our group recently developed interpretable deep learning approaches for dementia detection by computing cepstral features such as Mel-frequency cepstral coefficients (MFCCs) directly on the voice recordings of neuropsychological (NP) test sessions obtained from the Framingham Heart Study (FHS) [6]. This work was a proof-of-concept study that motivated the inclusion of MFCCs as one of the feature types included in the current analysis. We also leveraged natural language processing to identify various stages of dementia based on automated transcription of digital voice recordings [7]. Recently, in another work, we extracted multiple acoustic perturbation measures–including some of those included as features in the current study–from FHS voice recordings and developed a classifier to predict incident dementia [8]. Tavabi and co-workers compared acoustic (e.g., MFCCs, perturbation measures), linguistic (e.g., phrase complexity), and (para)linguistic (e.g., talk time) variables from low- and high-quality automated transcriptions of neuropsychological testing sessions and trained a logistic regression classifier to predict cognitive status [9]. Study results showed improved model performance when acoustic and linguistic features were included as inputs, compared to a demographics-only model. Another important set of findings in the literature has associated abnormalities in low-level acoustic descriptors with higher-order cognitive dysfunction (e.g., reduced scores on tests of global cognitive function, episodic memory, verbal fluency, and attention switching) [10, 11]. Taken together, prior findings cumulatively underscore voice as a strong resource of valuable information to assess an individual’s cognitive status and help identify early signs of cognitive impairment and dementia. The added value of the current study lies in its use of minimally processed voice recordings and fusing of spectral, prosodic, and sound quality metrics as inputs to a convolutional neural network model for dementia classification.
In this work, we developed a computational framework that combines a set of temporally varying low-level descriptors characterizing spectral, prosodic as well as sound quality measures and learns from the combination of these patterns to assess an individual’s cognitive status. To meet this objective, we leveraged digital voice recordings of the NP test sessions conducted on the FHS participants and their cognitive status at the time of the recording and constructed classification models. The NP examinations consist of multiple tests that assess memory, attention, executive function, language, reasoning, visuoperceptual skills, and premorbid intelligence. Typically, each participant undergoes a battery of NP tests at FHS, encompassing assessments such as Demographics, Logical Memory Immediate Recall, Visual Reproduction Immediate Recall, Verbal Paired Associates, Digit Span Forward, Digit Span Backward, Logical Memory Delayed Recall and Multiple Choice, Visual Reproductions Delayed Recall and Multiple Choice, Verbal Paired Associates Recall and Recognition, Similarities, Clock Drawing to Command, Verbal Fluency (FAS), Boston Naming Test, Clock Drawing to Copy, Trails A, Trails B, WRAT-3 READING, Finger Tapping, Block Design (WAIS), Information (WAIS-R), Cookie Theft, Hooper Visual Organization Test, Digit Coding, Digit Symbol Incidental Learning Pairing and Free Recall, Clock Drawing Number Placement, Clock Drawing Time Setting, Math Fluency, Balance Physical Function Test, and Spiral Test. It is important to note that not all tests are administered during every exam visit due to factors such as time constraints or participant limitations. Furthermore, the voice recordings lack annotations, precluding the availability of timestamped information indicating the timing of each test administration in each recording. For further insights into our NP protocol, please refer to our published work [12].
The cognitive status of the participants over time was diagnosed via the FHS dementia diagnostic review panel. The panel consists of at least one neuropsychologist and at least one neurologist. The panel reviews NP and neurological exams, medical records, and family interviews for each participant. Selection for dementia review is based on whether participants have shown evidence of cognitive decline, as has been previously described [13]. A cognitive timeline is created for each participant by using available information to determine a given date for each stage of cognition (e.g., NC/MCI/dementia (DE)). To assign cognitive statuses to the participants at the time of each recording, we identified the nearest diagnosis date that occurred either on or prior to the recording date, or within 180 days after the recording. If the nearest assessment date exceeded 180 days following the recording, but the participant’s cognitive status was confirmed as normal on that date, we classified them as cognitively normal. The diagnosis of dementia was determined using criteria outlined in the Diagnostic and Statistical Manual of Mental Disorders, fourth edition (DSM-IV) and the NINCDS-ADRDA criteria for Alzheimer’s dementia [14].
FHS began to digitally record the audio of NP examinations in 2005. The dataset for this study includes digital voice recordings from September 2005 to March 2020 from the subset of FHS participants who were flagged for dementia review. For this study, we selected only those participants with dated cognitive status (NC/MCI/DE) (Table 1). On each recording, we extracted various low-level descriptors including MFCCs, F0, Log HNR Jitter (local), Jitter (delta) and Shimmer (local). MFCCs are the coefficients that collectively make up the Mel-frequency cepstrum, which serves as an important acoustic feature in many speech processing applications. The MFCCs were generated from 16,000 Hz voice recordings, with a sliding window length of 60 ms, a window step of 10 ms, 26 Mel-filterbank filters, and an FFT length of 512. MFCCs provide information about the spectral envelope of the speech signal and are widely used in automatic speech and speaker recognition. The other descriptors including F0, log HNR, jitter, and shimmer are additional acoustic features that have shown relevance in voice analysis, particularly in the contexts of aging and dementia [15–17]. HNR reflects added noise in the signal (i.e., the proportion of periodic as compared to non-periodic components). Jitter and Shimmer are micro-prosodic variations of fundamental frequency and amplitude (respectively) for harmonic sounds. These descriptors were generated via the openSMILE package from the ComParE 2016 low level descriptors dataset [18].
Table 1
Study population
| Cohort | N | Female | APOE4+ | NC Recordings | MCI Recordings | DE Recordings | Age (y) | Mean MMSE |
| Generation One | 157 | 110 | 30 | 78 | 88 | 100 | 91.5±3.1 | 24.6±4.7 |
| Generation Two | 576 | 321 | 131 | 544 | 419 | 235 | 77.2±8.1 | 26.9±3.5 |
| New Offspring Spouses | 5 | 2 | 0 | 0 | 6 | 4 | 82.7±5.0 | 0.0±0.0 |
| Generation Three | 5 | 1 | 0 | 7 | 1 | 1 | 61.0±10.1 | 0.0±0.0 |
| Omni Generation One | 16 | 5 | 4 | 10 | 9 | 7 | 72.9±8.9 | 25.3±2.6 |
| Omni Generation Two | 1 | 1 | 1 | 0 | 1 | 1 | 75.5±2.1 | 0.0±0.0 |
| Total | 760 | 440 | 166 | 639 | 524 | 348 | 79.6±9.4 | 26.5±3.8 |
For each participant, digital voice recordings of neuropsychological examinations were collected. Here, N represents the number of unique participants. A unique participant may have more than one recording. The mean age (±standard deviation) is reported at the time of the recordings. Mean MMSE scores (±standard deviation) were computed closest to the time of the voice recording. APOE data was unavailable for 6 Generation One participants, 17 Generation Two participants, and 1 New Offspring Spouses participant. MMSE data was not available for New Offspring Spouses and Generation Three participants.
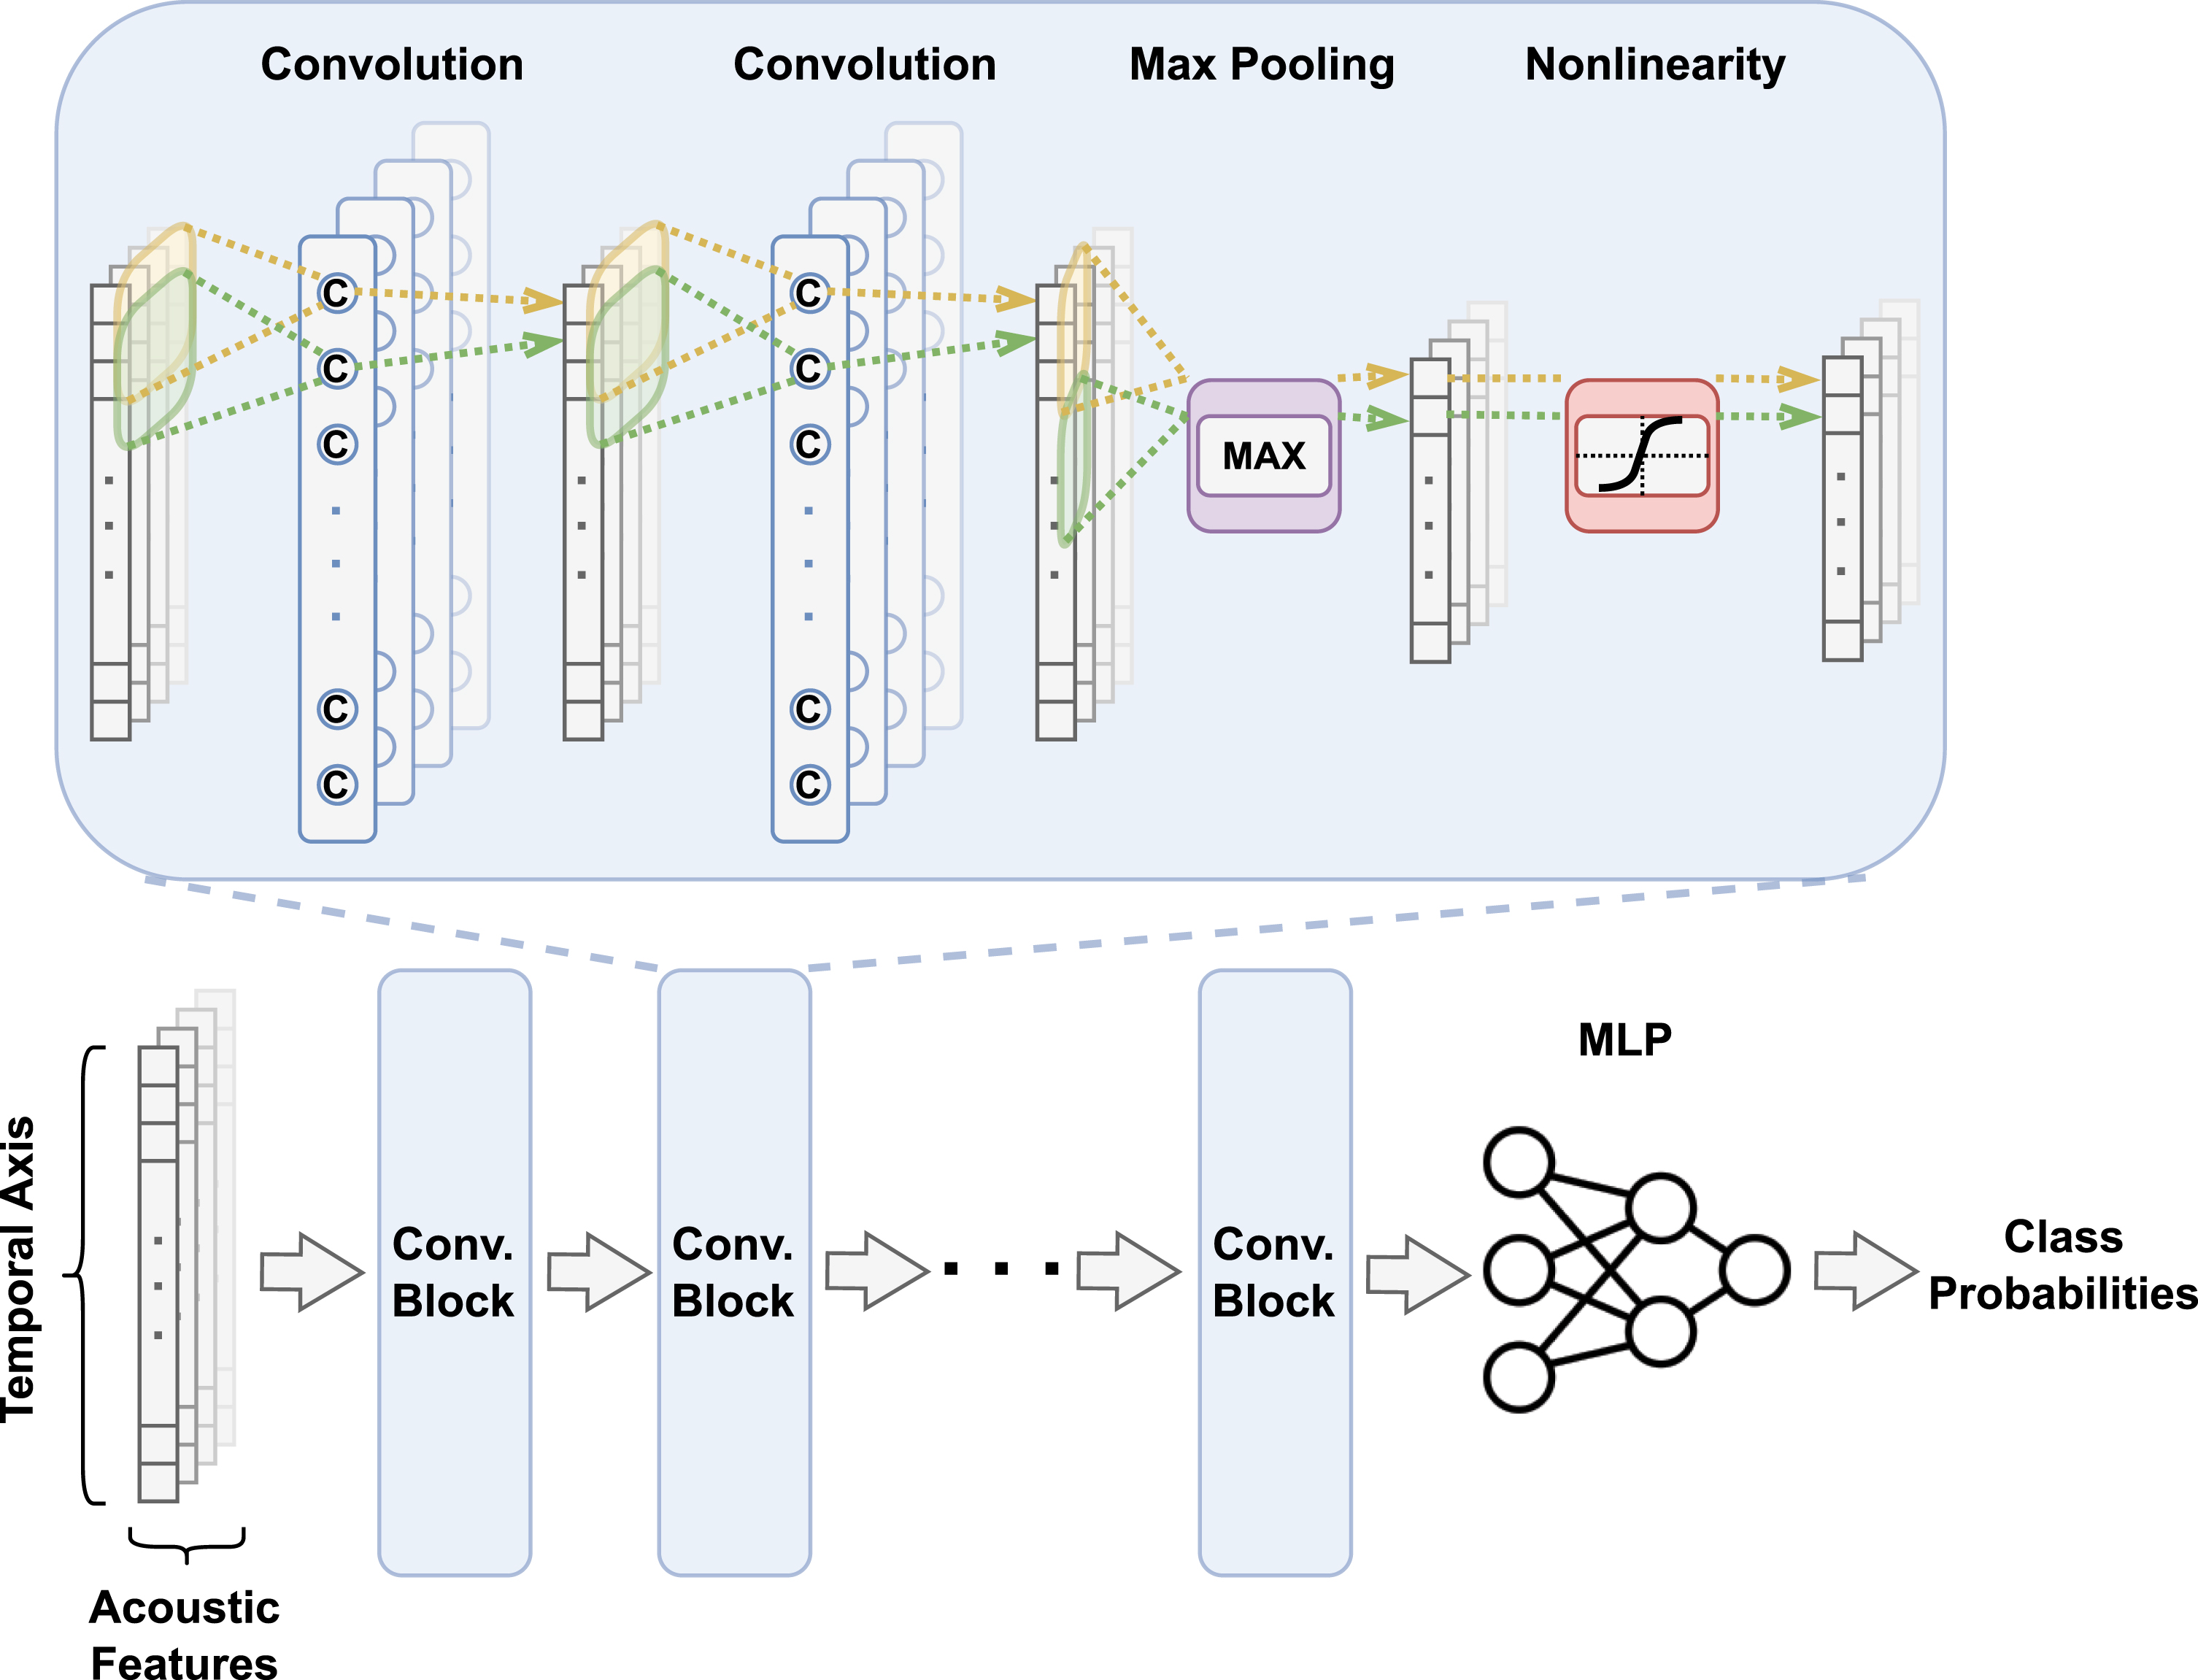
We designed a one-dimensional convolutional neural network (CNN) model for dementia classification (Fig. 1). The model’s primary architecture comprised seven convolutional blocks, with each encompassing two convolutional layers, a max-pooling layer, and an activation function based on the exponential linear unit. The convolutional layers were defined by a filter size of 3, a stride size of 1, and a padding size of 1, while max-pooling layers within the first six blocks were characterized by a filter and stride size of 4. The final block uniquely employed global average pooling to handle audio recordings of varying lengths. By transforming all input into a fixed-length feature vector, this approach streamlined the classification process. Subsequently, we introduced a linear classifier composed of a convolutional and softmax layer. To facilitate a unified CNN input, we amalgamated multiple acoustic features by concatenating their temporal sequences along an extra, channel-corresponding dimension. All convolutional blocks within the CNN’s main structure shared identical kernel and stride sizes, preserving the output size due to the convolution operation with stride 1. Therefore, downsampling relied solely on max pooling layers, each reducing the input length by a factor of 4. To enhance the overall model performance, we applied batch normalization directly to the input, replacing z-score normalization and enabling linear remapping of the input to a distribution with non-zero mean and non-zero standard deviation. The final stages of our model involved a global average pooling layer to convert the output into a fixed-length, temporally invariant feature vector, and a linear classifier that generated prediction logits. The models were implemented using PyTorch and constructed on a workstation with a GeForce RTX 2080 Ti graphics processing unit. The Adam optimizer with learning rate = 1e–4 and betas = (0.99, 0.999) was applied to train the CNN model. The models were trained using 5-fold cross-validation. Data was split at the participant level for each fold and then all of a given participant’s recordings were included in each fold. We generated receiver operating characteristic (ROC) and precision-recall (PR) curves based on the cross-validated model predictions, and reported various model performance metrics over the model runs. Additionally, we trained random forest (RF) models on fixed-length features to serve as a baseline. The RF models were trained via 5-fold cross-validation and were split at the participant-level.
Fig. 1
Convolutional neural network. The input to the neural network is a set of vectors representing temporally varying features of an entire voice recording. Early feature fusion is performed such that the convolutional operator processes the features together during the entire training cycle. After a series of convolutional steps, the learned features are fed into a multilayer perceptron followed by associating it with the output label of interest to estimate class-level probabilities.
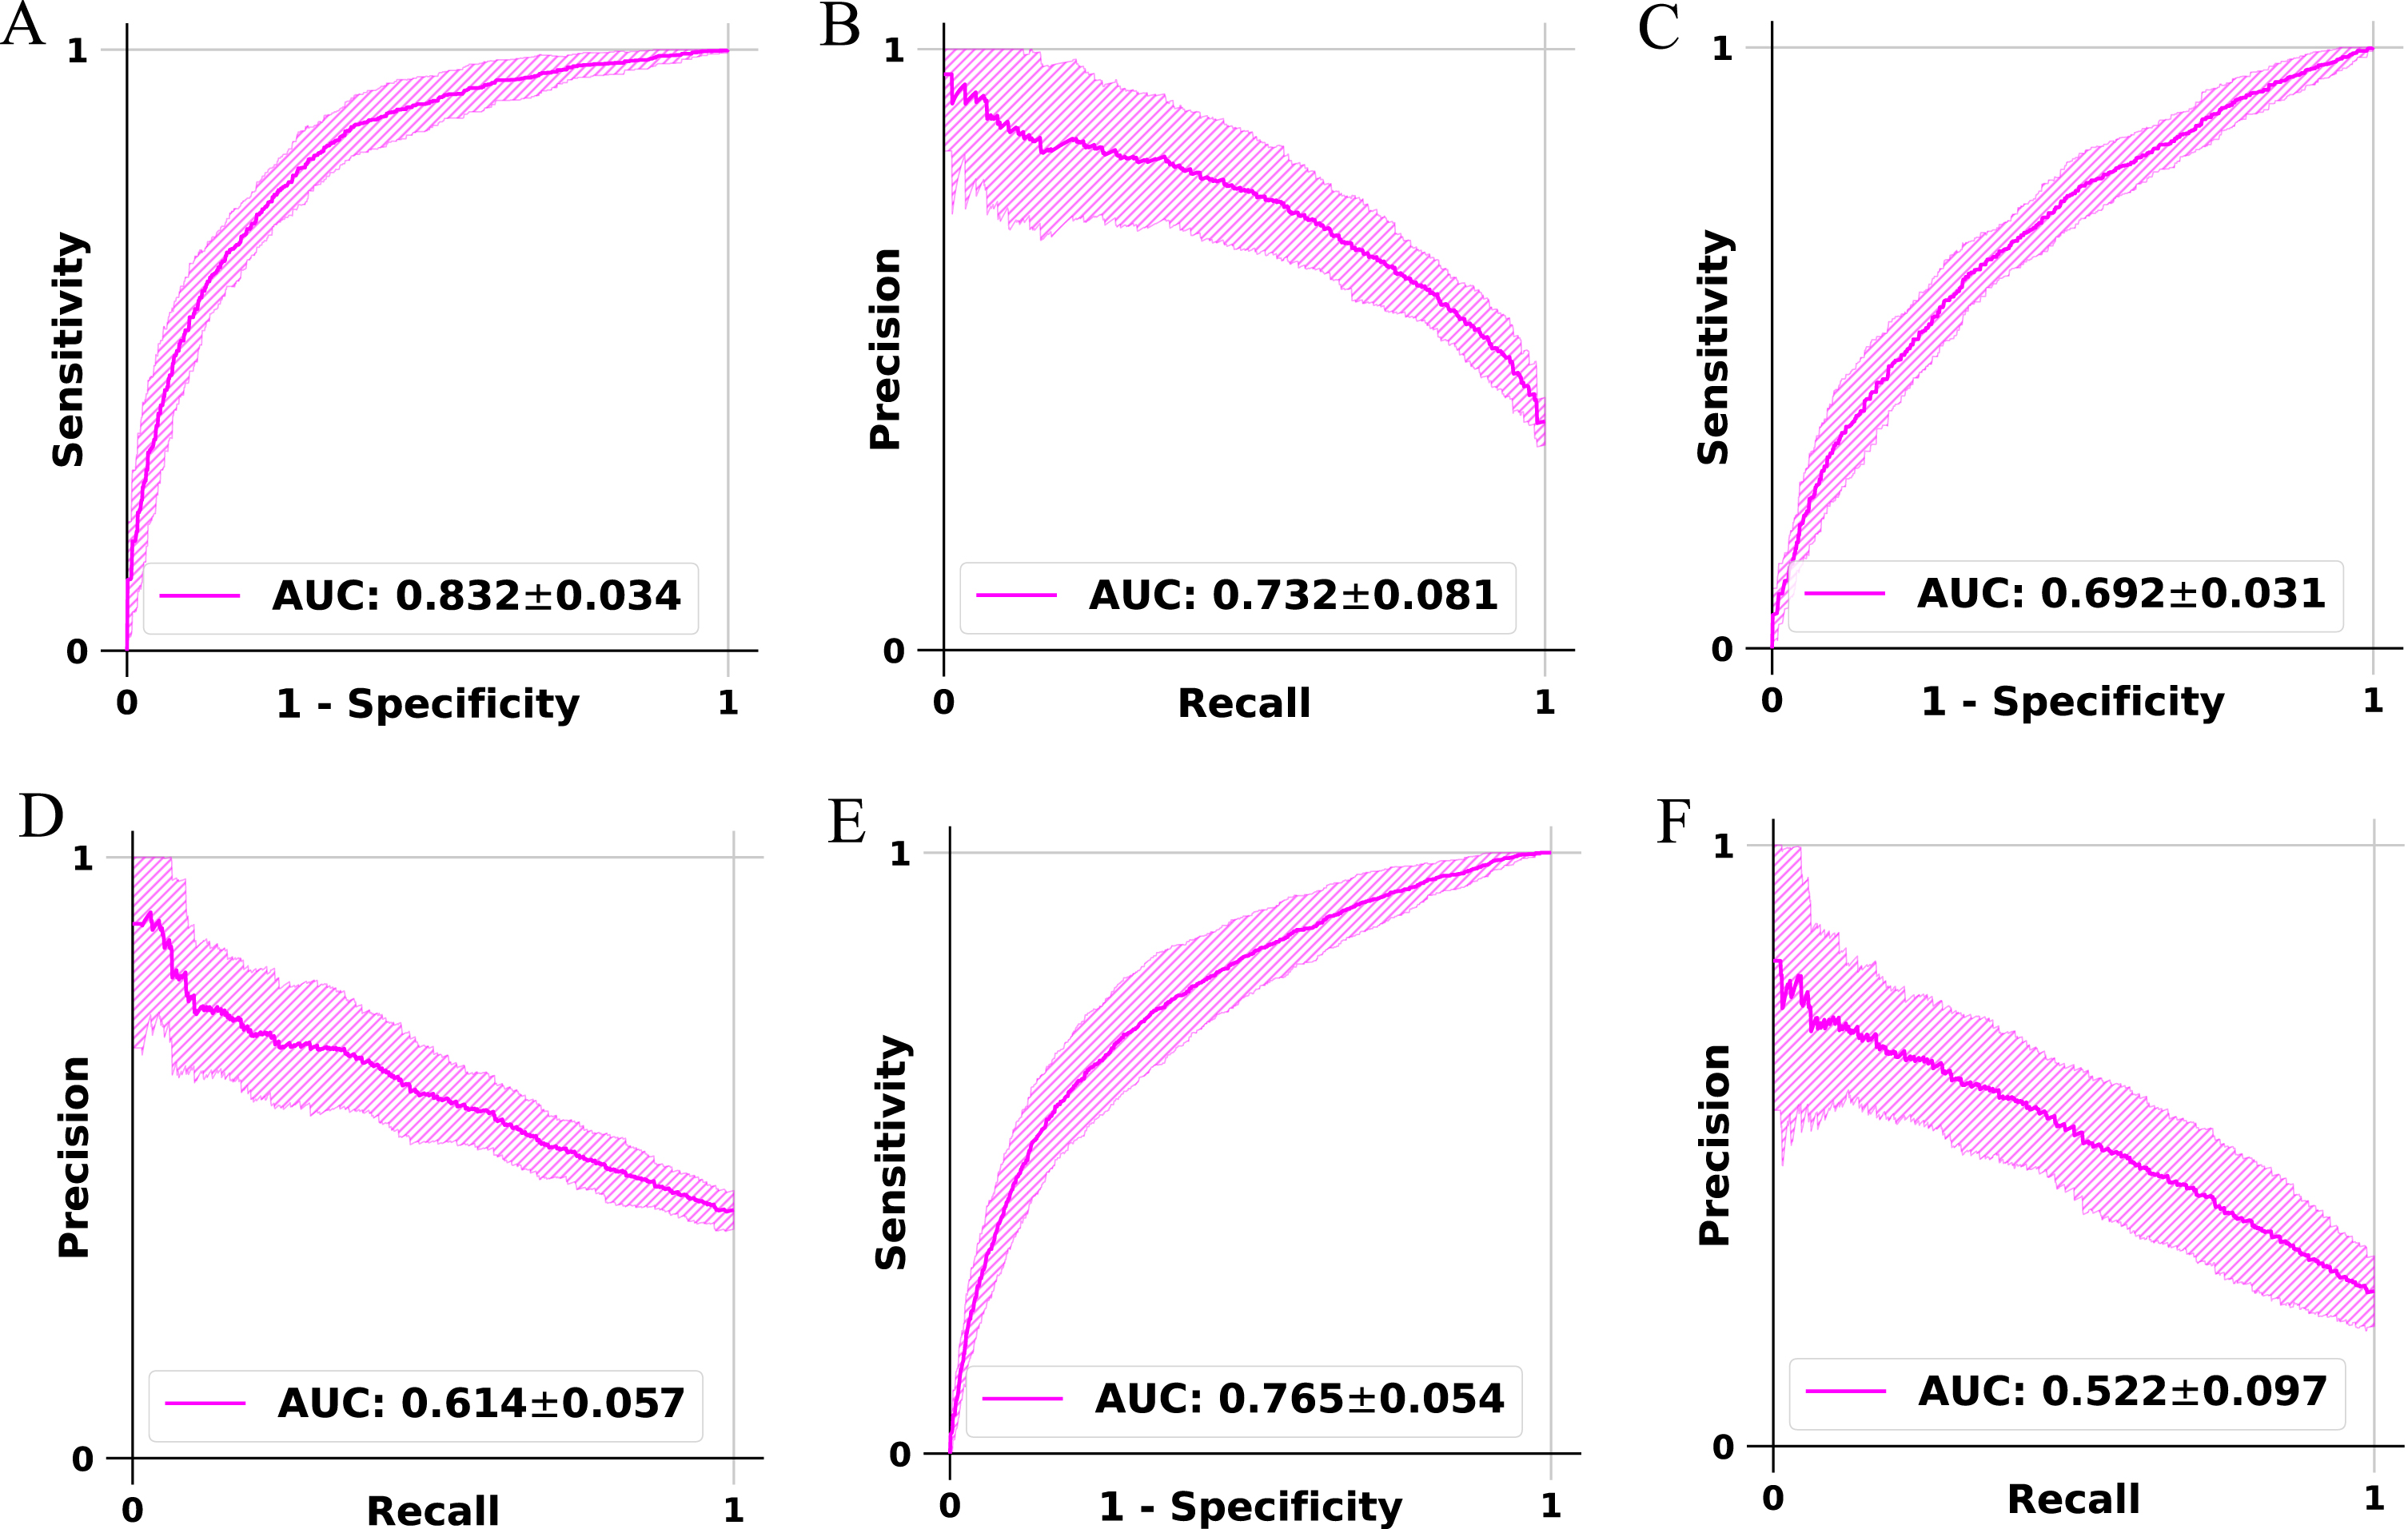
Our fusion framework CNN that was trained and validated on the FHS voice recordings demonstrated consistent performance across the different data splits used for 5-fold cross-validation (Fig. 2). The model achieved an accuracy of 76.6% (±2.6%) for classifying NC versus DE and 65.8% (±3.1%) for MCI versus DE classification and 77.4% (±3.5%) for non-demented (NDE) (NC+MCI) versus DE classification. The balanced accuracy for NC versus DE was 73.9% (±3.3%) and 62.3% (±4.1%) for MCI versus DE and 66.7% (±4.3%) for NDE versus DE. Sensitivity, which measures the ability to correctly identify positive cases, was 64.1% (±10.2%) for NC versus DE and was 46.1% (±15.9%) for MCI versus DE and was 46.5% (±12.8%) for NDE versus DE. Specificity, indicating the ability to correctly identify negative cases, was 83.7% (±6.2%) for NC versus DE and 78.5% (±10.9%) for MCI versus DE and was 86.9% (±7.1%) for NDE versus DE. Precision, representing the proportion of true positive predictions, was 69.1% (±8.7%) for NC versus DE and was 61.4% (±9.4%) for MCI versus DE and was 53.5% (±10.5%) for NDE versus DE. The F1 score, defined as the harmonic mean of precision and sensitivity, was 65.4% (±5.4%) for NC versus DE and was 50.0% (±11.8%) for MCI versus DE and was 47.9% (±8.0%) for NDE versus DE. The weighted F1 score, considering class imbalance, was 76.3% (±2.8%) for NC versus DE and was 64.0% (±4.1%) for MCI versus DE and was 76.8% (±2.8%) for NDE versus DE. The Matthews correlation coefficient (MCC) was 0.489 (±0.059) for NC versus DE and was 0.270 (±0.069) for MCI versus DE and was 0.352 (±0.075) for NDE versus DE. The precision-recall AUC was 0.732 (±0.081) for NC versus DE and was 0.614 (±0.057) for MCI versus DE and was 0.522 (±0.097) for NDE versus DE. The ROC AUC was 0.832 (±0.034) for NC versus DE and was 0.692 (±0.031) for MCI versus DE and was 0.765 (±0.054) for NDE versus DE, demonstrating the overall performance of the computational framework in dementia classification (Fig. 2). The full performance metrics of the fusion framework CNN models on the low-level descriptors are also listed in Supplementary Table 1. Additional fusion models were trained on both low-level descriptors and demographics (age, sex, education). The full performance results for the additional models have been reported for all three tasks: NC versus DE (Supplementary Table 2), MCI versus DE (Supplementary Table 3), and NDE versus DE (Supplementary Table 4). Several random forest (RF) models were trained on openSMILE functionals data (ComParE 2016 feature set) [19, 20], which consist of 6373 features that summarize windowed low-level descriptors into several values for each descriptor. The full performance results for the RF models are reported for all three tasks: NC versus DE (Supplementary Table 5), MCI versus DE (Supplementary Table 6), and NDE versus DE (Supplementary Table 7). The top ten important features in the RF models are reported across all three tasks: openSMILE functionals (Supplementary Table 8), openSMILE functionals and age (Supplementary Table 9), openSMILE functionals and demographics (Supplementary Table 10). The feature importance for the RF models that were trained on demographics is as such: NC versus DE (age 83.9%, education 12.2%, sex 3.9%), MCI versus DE (age 84.3%, education 12.0%, sex 3.7%), and NDE versus DE (age 82.6%, education 14.3% and sex 3.1%).
Fig. 2
Model performance. Receiver operating characteristic (ROC) and precision-recall (PR) curves of the convolutional network trained to perform classification of persons with normal cognition from those with cognitive impairment, classification of persons with mild cognitive impairment from those with dementia, and classification of persons with dementia from those who do not have dementia. On each model, a 5-fold cross-validation was performed and the model predictions (mean±standard deviation) were generated on the test data, followed by the creation of the ROC and PR curves. The plots A and B denote the ROC and PR curves for the model that performed classification of NC versus DE cases. The plots C and D denote the ROC and PR curves for the model for the classification of MCI versus DE cases. The plots E and F denote the ROC and PR curves for the model that performed classification of NDE versus DE cases.
Using a series of energy-, spectral-, and voicing-related low-level descriptors that describe the prosodic, spectral, and sound quality related features of voice, we trained our convolutional framework so that features were learned early in the training cycle to assess an individual’s cognitive status. These features were obtained by applying a large set of statistical functions to acoustic low-level descriptors. The low-level descriptors cover a broad set of descriptors from the fields of speech processing, information retrieval, and general sound analysis [21]. For example, MFCCs are frequently used in automatic speech recognition and speaker identification [22]. Spectral statistical descriptors, such as spectral variance and spectral flux, are often used in multimedia analysis, and are part of the descriptor set proposed in the MPEG-7 multimedia content description standard. Loudness and energy-related features are important for various tasks such as speech and speaker recognition and emotion recognition. The same holds true for the sound quality descriptors (which are used to discriminate between harmonic and noise-like sounds) and the fundamental frequency and psychoacoustic sharpness. The latter is a well-known feature in sound analysis. Jitter and shimmer are used in voice pathology analysis but are also good descriptors of general sound quality. Both jitter and shimmer are sensitive to subtle variations in vocal fold vibrations, providing objective measures of irregularities in timing and amplitude. Importantly, low-level descriptors such as MFCCs, F0, HNR, jitter, and shimmer metrics have been successfully used in prior AD literature to differentiate MCI and dementia states from normal aging [15–17]. Furthermore, our results demonstrated that within CNN models, the addition of age and other demographic features (e.g., sex) only marginally improved the performance in comparison to the CNN models that utilized only the low-level voice descriptors, lending confidence in the importance of such features as markers of cognitive decline.
Our approach has the following advantages. Our early fusion strategy allows us to combine any number of temporally varying features with variable lengths, thereby enabling hierarchical learning of disease-specific patterns during the training process. Moreover, our model does not require voice-to-text translators or manually derived features, both of which are time-consuming and need additional software tools and/or subject matter expertise. These aspects uniquely position our framework in contrast to other analytic models attempting to assess cognitive status using derived measures of voice. Importantly, the flexibility of our framework allows researchers to incorporate additional low-level descriptors of voice as they become available.
Our study has a few limitations. FHS is a controlled research environment wherein an expert clinical team follows curated protocols and engages the cohort participants. Specifically, the voice data are based on recordings of neuropsychological test sessions, and they do not necessarily represent conversations in a routine living environment. Also, we acknowledge that the minimal manual editing in our automated pipeline may make it difficult to distinguish whether the classifier diagnosis is solely influenced by the participant’s voice characteristics or if the clinician’s characteristics also play a role. Another limitation of the current study is the possibility that the input features to the model may be sensitive to a generalized disease state rather than to dementia per se. Thus, it is important not to overgeneralize results to imply that these same features would aid classification of AD compared to other DE types or non-dementia disease states. Nonetheless, these conversations exemplify natural speech and the data that we collected enabled us to test our hypotheses and build novel frameworks for dementia assessment. We believe such studies are necessary precursors before touting the value of voice technologies for monitoring brain health.
In conclusion, our proposed deep learning approach can perform early fusion of temporally varying features of voice and accurately classify an individual’s cognitive status. Such approaches that rely minimally on technical or clinical expertise as well as eliminate the need of manual translation of voice recordings to derived measures can facilitate the development of assistive tools for dementia care, especially in resource-limited settings.
ACKNOWLEDGMENTS
The authors have no acknowledgments to report.
FUNDING
This project was supported by grants from the Karen Toffler Charitable Trust, the American Heart Association (20SFRN35460031), the National Institutes of Health (RF1-AG062109, P30-AG073104, R01-HL159620, R21-CA253498, R43-DK134273, RF1-AG072654, U19-AG068753, F32-DC020342 and P30-AG013846), the National Science Foundation under grants CCF-2200052, DMS-1664644, and IIS-1914792, and a pilot award from the National Institute on Aging’s Artificial Intelligence and Technology Collaboratories (AITC) for Aging Research program.
CONFLICT OF INTEREST
VBK is a consultant to the Davos Alzheimer’s Collaborative and AstraZeneca, and there is no scientific overlap with this project. RA is an Editorial Board Member of this journal but was not involved in the peer-review process nor had access to any information regarding its peer-review. RA is also a consultant to the Davos Alzheimer’s Collaborative, a scientific advisor to Signant Health, and a scientific advisory and consultant to Biogen and NovoNordisk; there is no scientific overlap with this project. SK is a co-founder of Constant Therapy, and there is no scientific overlap with this project. The remaining authors have no conflicts of interest to report.
DATA AVAILABILITY
Data in this study cannot be shared publicly due to regulations of local ethical committees. Data might be made available to researchers upon request. All requests will be evaluated based on institutional and departmental policies. Python scripts are made available on GitHub (https://github.com/vkola-lab/jad2023). MFCCs were generated via the Python Speech Features CUDA library (https://github.com/vkola-lab/python_speech_features_cuda).
SUPPLEMENTARY MATERIAL
[1] The supplementary material is available in the electronic version of this article: https://dx.doi.org/10.3233/JAD-230560.
REFERENCES
[1] | Au R , Kolachalama VB , Paschalidis IC ((2021) ) Redefining and validating digital biomarkers as fluid, dynamic multi-dimensional digital signal patterns. Front Digit Health 3: , 751629. |
[2] | Abernethy A , Adams L , Barrett M , Bechtel C , Brennan P , Butte A , Faulkner J , Fontaine E , Friedhoff S , Halamka J , Howell M , Johnson K , Long P , McGraw D , Miller R , Lee P , Perlin J , Rucker D , Sandy L , Savage L , Stump L , Tang P , Topol E , Tuckson R , Valdes K ((2022) ) The promise of digital health: Then, now, and the future. NAM Perspect 2022: , 10.3233/CH-211286.. |
[3] | Zhou L , Fraser KC , Rudzicz F (2016) Speech Recognition in Alzheimer’s Disease and in its Assessment. In Interspeech 2016, pp. 1948-1952. |
[4] | Konig A , Linz N , Troger J , Wolters M , Alexandersson J , Robert P ((2018) ) Fully automatic speech-based analysis of the semantic verbal fluency task. Dement Geriatr Cogn Disord 45: , 198–209. |
[5] | Shimoda A , Li Y , Hayashi H , Kondo N ((2021) ) Dementia risks identified by vocal features via telephone conversations: A novel machine learning prediction model. PLoS One 16: , e0253988. |
[6] | Xue C , Karjadi C , Paschalidis IC , Au R , Kolachalama VB ((2021) ) Detection of dementia on voice recordings using deep learning: A Framingham Heart Study. Alzheimers Res Ther 13: , 146. |
[7] | Amini S , Hao B , Zhang L , Song M , Gupta A , Karjadi C , Kolachalama VB , Au R , Paschalidis IC ((2023) ) Automated detection of mild cognitive impairment and dementia from voice recordings: A natural language processing approach. Alzheimers Dement 19: , 946–955. |
[8] | Xue C , Karjadi C , Miller MI , Cordella C , Au R , Kolachalama VB (2022) Association of acoustic pertur- bation measures with dementia status: A Framingham Heart Study. In Alzheimer’s Association International Conference, San Diego, CA, USA. |
[9] | Tavabi N , Stuck D , Signorini A , Karjadi C , Al Hanai T , Sandoval M , Lemke C , Glass J , Hardy S , Lavallee M , Wasserman B , Ang TFA , Nowak CM , Kainkaryam R , Foschini L , Au R ((2022) ) Cognitive digital biomarkers from automated transcription of spoken language. J Prev Alzheimers Dis 9: , 791–800. |
[10] | Mahon E , Lachman ME ((2022) ) Voice biomarkers as indicators of cognitive changes in middle and later adulthood. Neurobiol Aging 119: , 22–35. |
[11] | Fu Z , Haider F , Luz S (2020) Predicting Mini-Mental Status Examination scores through paralinguistic acoustic features of spontaneous speech. In 2020 42nd Annual International Conference of the IEEE Engineering in Medicine&Biology Society (EMBC), pp. 5548-5552. |
[12] | Au R , Piers RJ , Devine S ((2017) ) How technology is reshaping cognitive assessment: Lessons from the Framingham Heart Study. Neuropsychology 31: , 846–861. |
[13] | Yuan J , Maserejian N , Liu Y , Devine S , Gillis C , Massaro J , Au R , Bondi M ((2021) ) Severity distribution of Alzheimer’s disease dementia and mild cognitive impairment in the Framingham Heart Study. J Alzheimers Dis 79: , 807–817. |
[14] | McKhann G , Drachman D , Folstein M , Katzman R , Price D , Stadlan EM ((1984) ) Clinical diagnosis of Alzheimer’s disease: Report of the NINCDS-ADRDA Work Group* under the auspices of Department of Health and Human Services Task Force on Alzheimer’s Disease. Neurology 34: , 939–939. |
[15] | Meilan JJG , Martinez-Sanchez F , Carro J , Carcavilla N , Ivanova O ((2018) ) Voice markers of lexical access in mild cognitive impairment and Alzheimer’s disease. Curr Alzheimer Res 15: , 111–119. |
[16] | Fraser KC , Meltzer JA , Rudzicz F , Garrard P ((2015) ) Linguistic features identify Alzheimer’s disease in narrative speech. J Alzheimers Dis 49: , 407–422. |
[17] | Meghanani A , CS A , Ramakrishnan AG (2021) An exploration of Log-Mel spectrogram and MFCC features for Alzheimer’s dementia recognition from spontaneous speech. In 2021 IEEE Spoken Language Technology Work- shop (SLT), Shenzhen, China, pp. 670-677. |
[18] | Eyben F , Wöllmer M , Schuller B (2010) Opensmile: The munich versatile and fast open-source audio feature extractor. In Proceedings of the 18th ACM International Conference on Multimedia, pp. 1459-1462. |
[19] | Weninger F , Eyben F , Schuller BW , Mortillaro M , Scherer KR ((2013) ) On the acoustics of emotion in audio: What speech, music, and sound have in common. Front Psychol 4: , 292. |
[20] | Eyben F ((2016) ) . Springer Theses. Real-time Speech and Music Classification by Large Audio Feature Space Extraction. |
[21] | Weninger F , Eyben F , Schuller BW , Mortillaro M , Scherer KR ((2013) ) On the acoustics of emotion in audio: What speech, music, and sound have in common. Front Psychol 4: , 292. |
[22] | Zhen B , Wu X , Liu Z , Chi H (2000) On the importance of components of the MFCC in speech and speaker recogni- tion. In 6th International Conference on Spoken Language Processing (ICSLP 2000), vol. 2, pp. 487-490. |


