
Exploring Shared Biomarkers of Myocardial Infarction and Alzheimer’s Disease via Single-Cell/Nucleus Sequencing and Bioinformatics Analysis
Abstract
Background:
Patients are at increased risk of dementia, including Alzheimer’s disease (AD), after myocardial infarction (MI), but the biological link between MI and AD is unclear.
Objective:
To understand the association between the pathogenesis of MI and AD and identify common biomarkers of both diseases.
Methods:
Using public databases, we identified common biomarkers of MI and AD. Least absolute shrinkage and selection operator (LASSO) regression and protein-protein interaction (PPI) network were performed to further screen hub biomarkers. Functional enrichment analyses were performed on the hub biomarkers. Single-cell/nucleus analysis was utilized to further analyze the hub biomarkers at the cellular level in carotid atherosclerosis and AD datasets. Motif enrichment analysis was used to screen key transcription factors.
Results:
26 common differentially expressed genes were screened between MI and AD. Function enrichment analyses showed that these differentially expressed genes were mainly associated with inflammatory pathways. A key gene, Regulator of G-protein Signaling 1 (RGS1), was obtained by LASSO regression and PPI network. RGS1 was confirmed to mainly express in macrophages and microglia according to single-cell/nucleus analysis. The difference in expression of RGS1 in macrophages and microglia between disease groups and controls was statistically significant (p < 0.0001). The expression of RGS1 in the disease groups was upregulated with the differentiation of macrophages and microglia. RelA was a key transcription factor regulating RGS1.
Conclusion:
Macrophages and microglia are involved in the inflammatory response of MI and AD. RGS1 may be a key biomarker in this process.
INTRODUCTION
The incidence of cardiovascular diseases is increasing year by year worldwide. Myocardial infarction (MI), a critical condition among cardiovascular diseases, has a high lethality rate. According to statistics, about 9 million people died of MI worldwide in 2019 [1]. With an increased understanding of the disease, opening blocked vessels to restore blood flow supply is gradually becoming a mainstream treatment strategy [2, 3], effectively reducing mortality from MI. However, at the same time, patients may face myocardial damage from complications such as ischemia-reperfusion and coronary restenosis [3, 4]. Therefore, the academic community is still exploring better treatment options.
Alzheimer’s disease (AD) is a neurodegenerative disorder. Although its incidence has declined in recent years because of the control of risk factors, the number of people with the disease continues to rise as the aging problem. In the United States, AD is already the fifth leading cause of death in the elderly [5]. AD is the leading cause of dementia in the elderly population [5], but it was actually only 100 years ago that Alzheimer found characteristic neurotic plaques and pathological changes of amyloidosis in brain specimens from patients with dementia [6]. Early symptoms of AD are dominated by episodic memory impairment, attention deficit, and progressive aphasia. It has been reported that the pathological manifestations of AD appear decades before the symptoms [7–9]. And some studies have shown that patients with AD have heterogeneity in their cognitive deficits due to the different pathological manifestations [10, 11], which obviously makes the timing and accuracy of the diagnosis of AD difficult. The medications currently available for the treatment of AD are primarily used to relieve patients’ symptoms, and antipsychotic intervention may be required in patients with more severe aggressive symptoms [5]. However, the use of antipsychotics has been reported to increase the chance of stroke and death in patients with dementia [12] and has been shown to induce AMI [13]. Based on the current understanding of AD mechanisms, existing clinical drug studies have focused on amyloidosis and pathological tau [14–19]. The approval of Aducanumab and Lecanemab, two amyloid-β-targeted drugs, in the United States has given clinicians more options in treating AD patients [20, 21], but it comes with high costs and risks such as brain hemorrhage [22].
The inflammatory theory is one of the mechanisms of atherosclerotic plaque formation. Signaling pathways including NF-κB and transforming growth factor beta (TGF-β) have been found to be involved in the inflammatory response after a heart attack [23, 24]. For AD, the mechanism is still unclear, and more studies have suggested that AD is associated with β-amyloidosis and pathological modification of tau [25–27], followed by concomitant neuroinflammation and glial cell proliferation [28]. The involvement of inflammation in the pathogenesis of AD has been demonstrated [29]. Researchers have found that the levels of pro-inflammatory cytokines such as IL-1β, IL-6, and TNF-α are elevated in the cerebrospinal fluid of AD patients compared to normal [30]. A systematic review showed that coronary heart disease may mildly to moderately raise the risk of suffering from dementia, including Alzheimer’s disease, but the biological link between the two is unclear [31]. Inflammation as a common mechanism in both diseases makes some connection between them. Cohort studies have been performed showing that after coronary events, patients experience a cognitive decline [32], which may be associated with cerebrovascular lesions and neuroinflammation due to the release of inflammatory cytokines and chemokines after MI [33, 34].
Bioinformatic analysis is a technique based on data from gene sequencing to discover disease-associated genes and explore possible mechanisms. Single-cell RNA sequencing (scRNA-seq) and single-nucleus RNA sequencing (snRNA-seq) are gene sequencing performed on a single-cell basis, allowing the discovery of differences at the cell level [35]. Our study utilized public databases to identify differentially expressed genes (DEGs) of MI and AD, and further analyzed common DEGs with scRNA-seq and snRNA-seq datasets to explore possible associations in the development of both diseases.
MATERIALS AND METHODS
Data processing
We obtained MI bulk RNA-seq dataset (GSE66360 [36]), AD bulk RNA-seq dataset (GSE5281 [37–40]), carotid atherosclerosis (CA) scRNA-seq dataset (GSE159677 [41]), and AD snRNA-seq dataset (GSE157827 [42]) from Gene Expression Omnibus (GEO) database (https://www.ncbi.nlm.nih.gov/geo/). All datasets were derived from human samples. GSE66360 contains 43 samples (22 normal samples and 21 MI samples), GSE5281 contains 161 samples (74 normal samples and 87 AD samples), GSE159677 contains 6 samples (3 atherosclerotic core (AC) samples and 3 patient-matched proximal adjacent (PA) samples). We obtained 4 samples in GSE157827 (2 AD samples and 2 normal samples). The characteristics of the four datasets were listed in the text (Supplementary Table 1).
Identification of DEGs and functional enrichment analysis
Using the “limma” package, DEGs for MI and AD were identified by comparing the expression of GSE66360 and GSE5281, respectively. DEGs adjusted for p < 0.05 and |log2 FC|>1 were considered statistically significant. DEGs of the two diseases were taken as intersection and the obtained genes were subjected to Gene Ontology (GO) and Kyoto Encyclopedia of Genes and Genomes (KEGG) functional enrichment analysis with the “clusterProfiler” package in R software, and p < 0.05 was considered to indicate statistical significance.
Screening and GSEA of hub genes
LASSO regression in the “glmnet” package was used to build machine learning models respectively for MI and AD based on the datasets GSE66360 and GSE5281. STRING (http://string-db.org/) is a database that integrates a large amount of known and predicted protein-protein association data [43]. The DEGs of MI and AD were entered into the STRING database with species limited to “Homo sapiens”, interaction scores ≥0.4, and non-interacting targets were removed to finalize the protein-protein-interaction (PPI) network. Cytoscape (version 3.10.0) is an open-source software for analyzing and visualizing networks [44]. The PPI network obtained from STRING was imported into Cytoscape, and the degree of each node was calculated using the cytoNCA plugin. The nodes with one digit after the median or higher degree were taken as core nodes. To screen the hub genes, candidate genes and core nodes were intersected to obtain the common hub diagnostic genes for both diseases. Also, the “ggpubr” package was used to determine the differential expression of hub genes and p < 0.05 was considered statistically significant.
To explore the signaling pathways associated with hub genes in disease progression, we performed gene set enrichment analysis (GSEA) of key genes in each of the two diseases by the “clusterProfiler” package, and p < 0.05 was considered statistically significant.
ScRNA-seq/snRNA-seq data preprocessing
ScRNA-seq and snRNA-seq data were read with the “Seurat” [45] package. Low-quality cells were excluded by 1) features <200 and >4000 (CA dataset), features <200 and >5000 (AD dataset), and 2) mitochondrial genes >10%.
After normalizing the cells obtained from the screening, 2,000 hypervariable genes were found through the “FindVariableFeatures” function. After the data centering process, principal component analysis (PCA) was performed with the 2,000 hypervariable genes. By using an appropriate number of principal components (15 in CA and 20 in AD) to reduce dimensions of dataset, the samples were integrated by the “Harmony” function to remove batch effects [46]. Afterward, cells were clustered via the “FindNeighbors” and the “FindClusters” functions.
Manual annotation and atherosclerosis-related DEGs
The “FindAllMarkers” function was used to find DEGs between cell clusters, with the top 10 DEGs of each cluster as a reference for annotation. CellMarker (http://biocc.hrbmu.edu.cn/CellMarker/ or http://bio-bigdata.hrbmu.edu.cn/CellMarker/) is a database that collates data from 100,000 published papers to provide a comprehensive and accurate resource of cell markers for cell types in tissues of human and mouse [47, 48]. We combined the “singleR” package with CellMarker database to manually annotate cell clusters and display the results on a UMAP plot.
Subsequently, the “FindMarkers” function was used to find CA-related DEGs between the atherosclerotic core (AC) group and the proximal adjacent (PA) group. Atherosclerosis (AS)-associated DEGs were obtained by taking the intersection of MI-related and CA-related DEGs. The expression of AS-associated DEGs in each cell cluster of the CA dataset was scored with the “PercentageFeatureset” function.
Expression of hub genes in CA and AD and pseudotime analysis
In the previous analysis we found that the common DEGs of MI and CA had the highest expression score in macrophages, which is consistent with previous studies on the important role of macrophages in the formation of atherosclerosis. According to the current literature review, microglia, as macrophages of the central nervous system (CNS), also play an important role in the progression of AD [5], so we compared the expression of the obtained hub genes between the macrophages in atherosclerosis and the microglia in AD.
We extracted macrophages and microglia as subjects in single-cell/nucleus datasets of CA and AD, respectively. Randomly selected mean expression >0.1 and dispersion empirical >1 * dispersion fit cells were used for pseudotime analysis. After that, the dimensionality of the cells was reduced by the “DDRTree” method, and then the cells were sorted using the “orderCells” function. Finally, we used the “plot cell trajectory” function in “monocle” package to visualize the differentiation trajectory of the cells. The “plot genes in pseudotime” function was used to visualize the changes in gene expression in the differentiation trajectory.
Prediction of key transcription factors
To further investigate the molecular insight, we screened transcription factors (TFs) that bind to our key genes through the NetworkAnalyst (https://www.networkanalyst.ca/) platform [49]. In combination with the immune cells associated with hub genes in our study, the “ggalluvial” package was used to construct a Sankey diagram of TFs-Genes-Immune cells.
There is a base preference for the binding of TFs to genes. Motif enrichment analysis can obtain regular linkage patterns in complex interaction networks [50]. The “RcisTarget” package which based on motif enrichment analysis was used to find key TFs related to gene sets by gene-motif ranking and annotation of TFs. Then, we visualized the regulatory network of genes and TFs through the “visNetwork” package.
Statistical analysis
The R software was used to perform statistical analyses. Differential expression analysis was performed based on the moderate t-test with the “limma” package. Functional enrichment analysis was assessed based on the hypergeometric test via the “clusterProfiler” package. The p-value correction for multiple tests was performed using the Benjamin-Hochberg (BH) procedure. Adobe Illustrator (AI) 2020 was used to edit the figures.
RESULTS
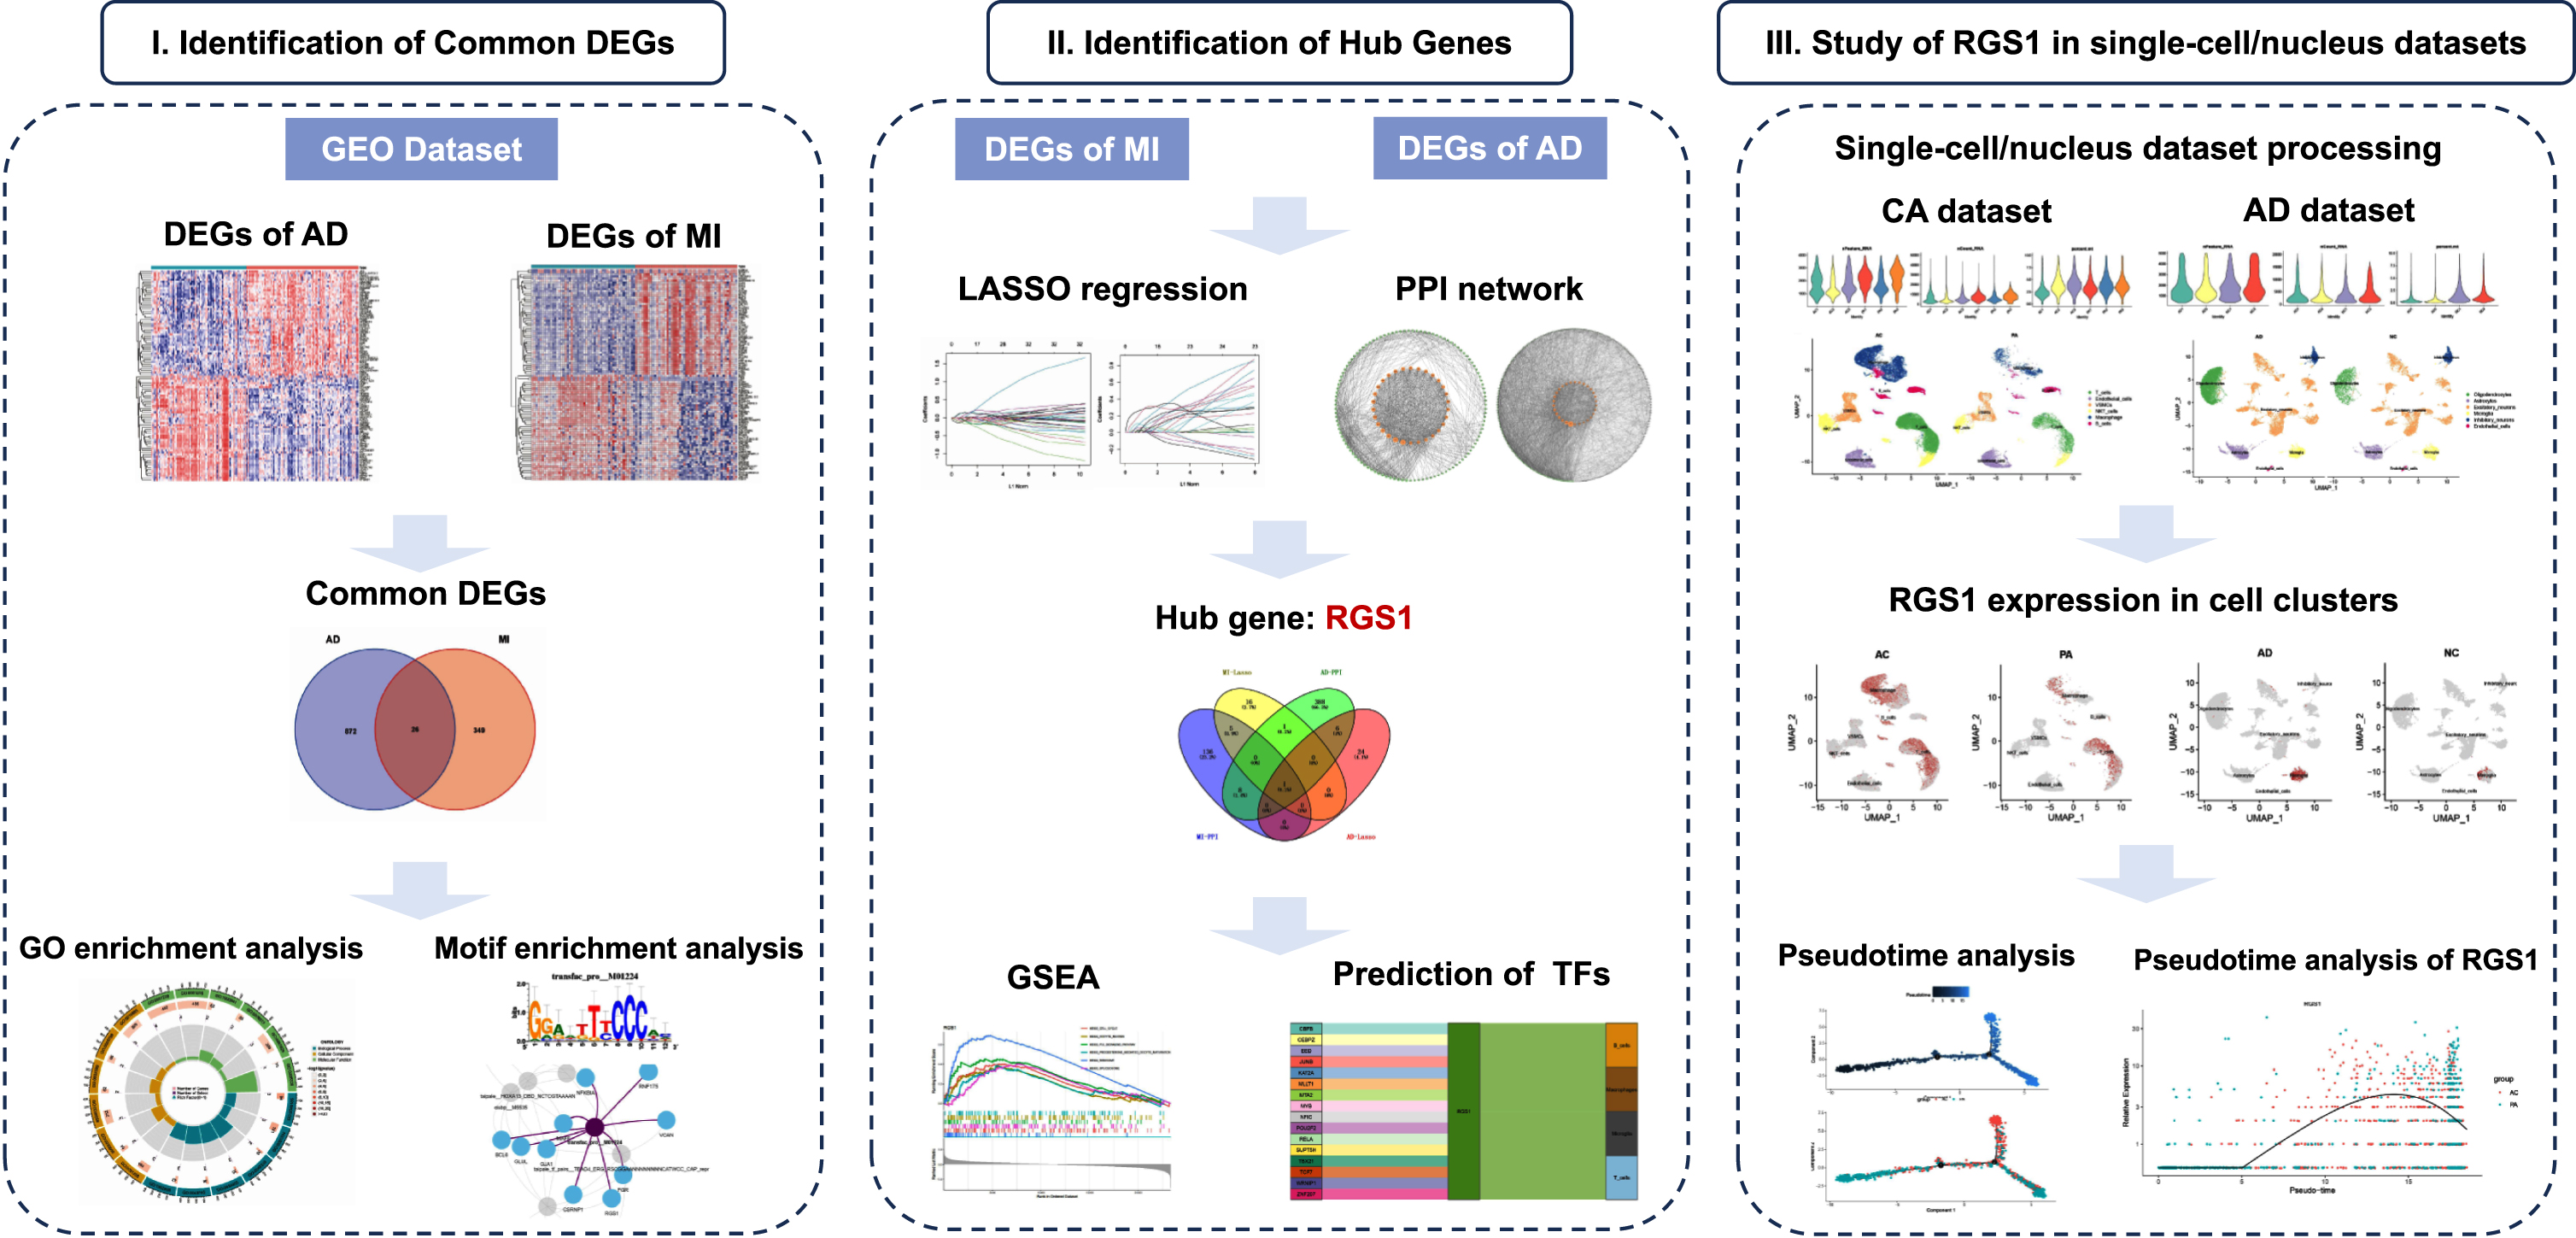
Our flow chart is shown in Fig. 1.
Fig. 1
Flow chart of this study.
3.1Identification of DEGs and functional enrichment analysis
We used the “limma” package to identify DEGs in the MI and AD datasets and plotted heatmaps separately. 375 DEGs of MI and 898 DEGs of AD were identified (Fig. 2A, B). The expression of these genes differed significantly between groups. The results were shown in heatmap with red color indicating higher expression levels and blue color indicating lower expression levels. The DEGs of the two diseases were taken to intersect to obtain 26 common DEGs (Supplementary Table 2) between MI and AD (Fig. 2C).
Fig. 2
A) Heatmap of DEGs in AD. B) Heatmap of DEGs in MI. C) Venn diagram shows that 26 genes are identified from the intersection of DEGs in MI and AD. D) Circle plot of GO enrichment analysis of common DEGs.
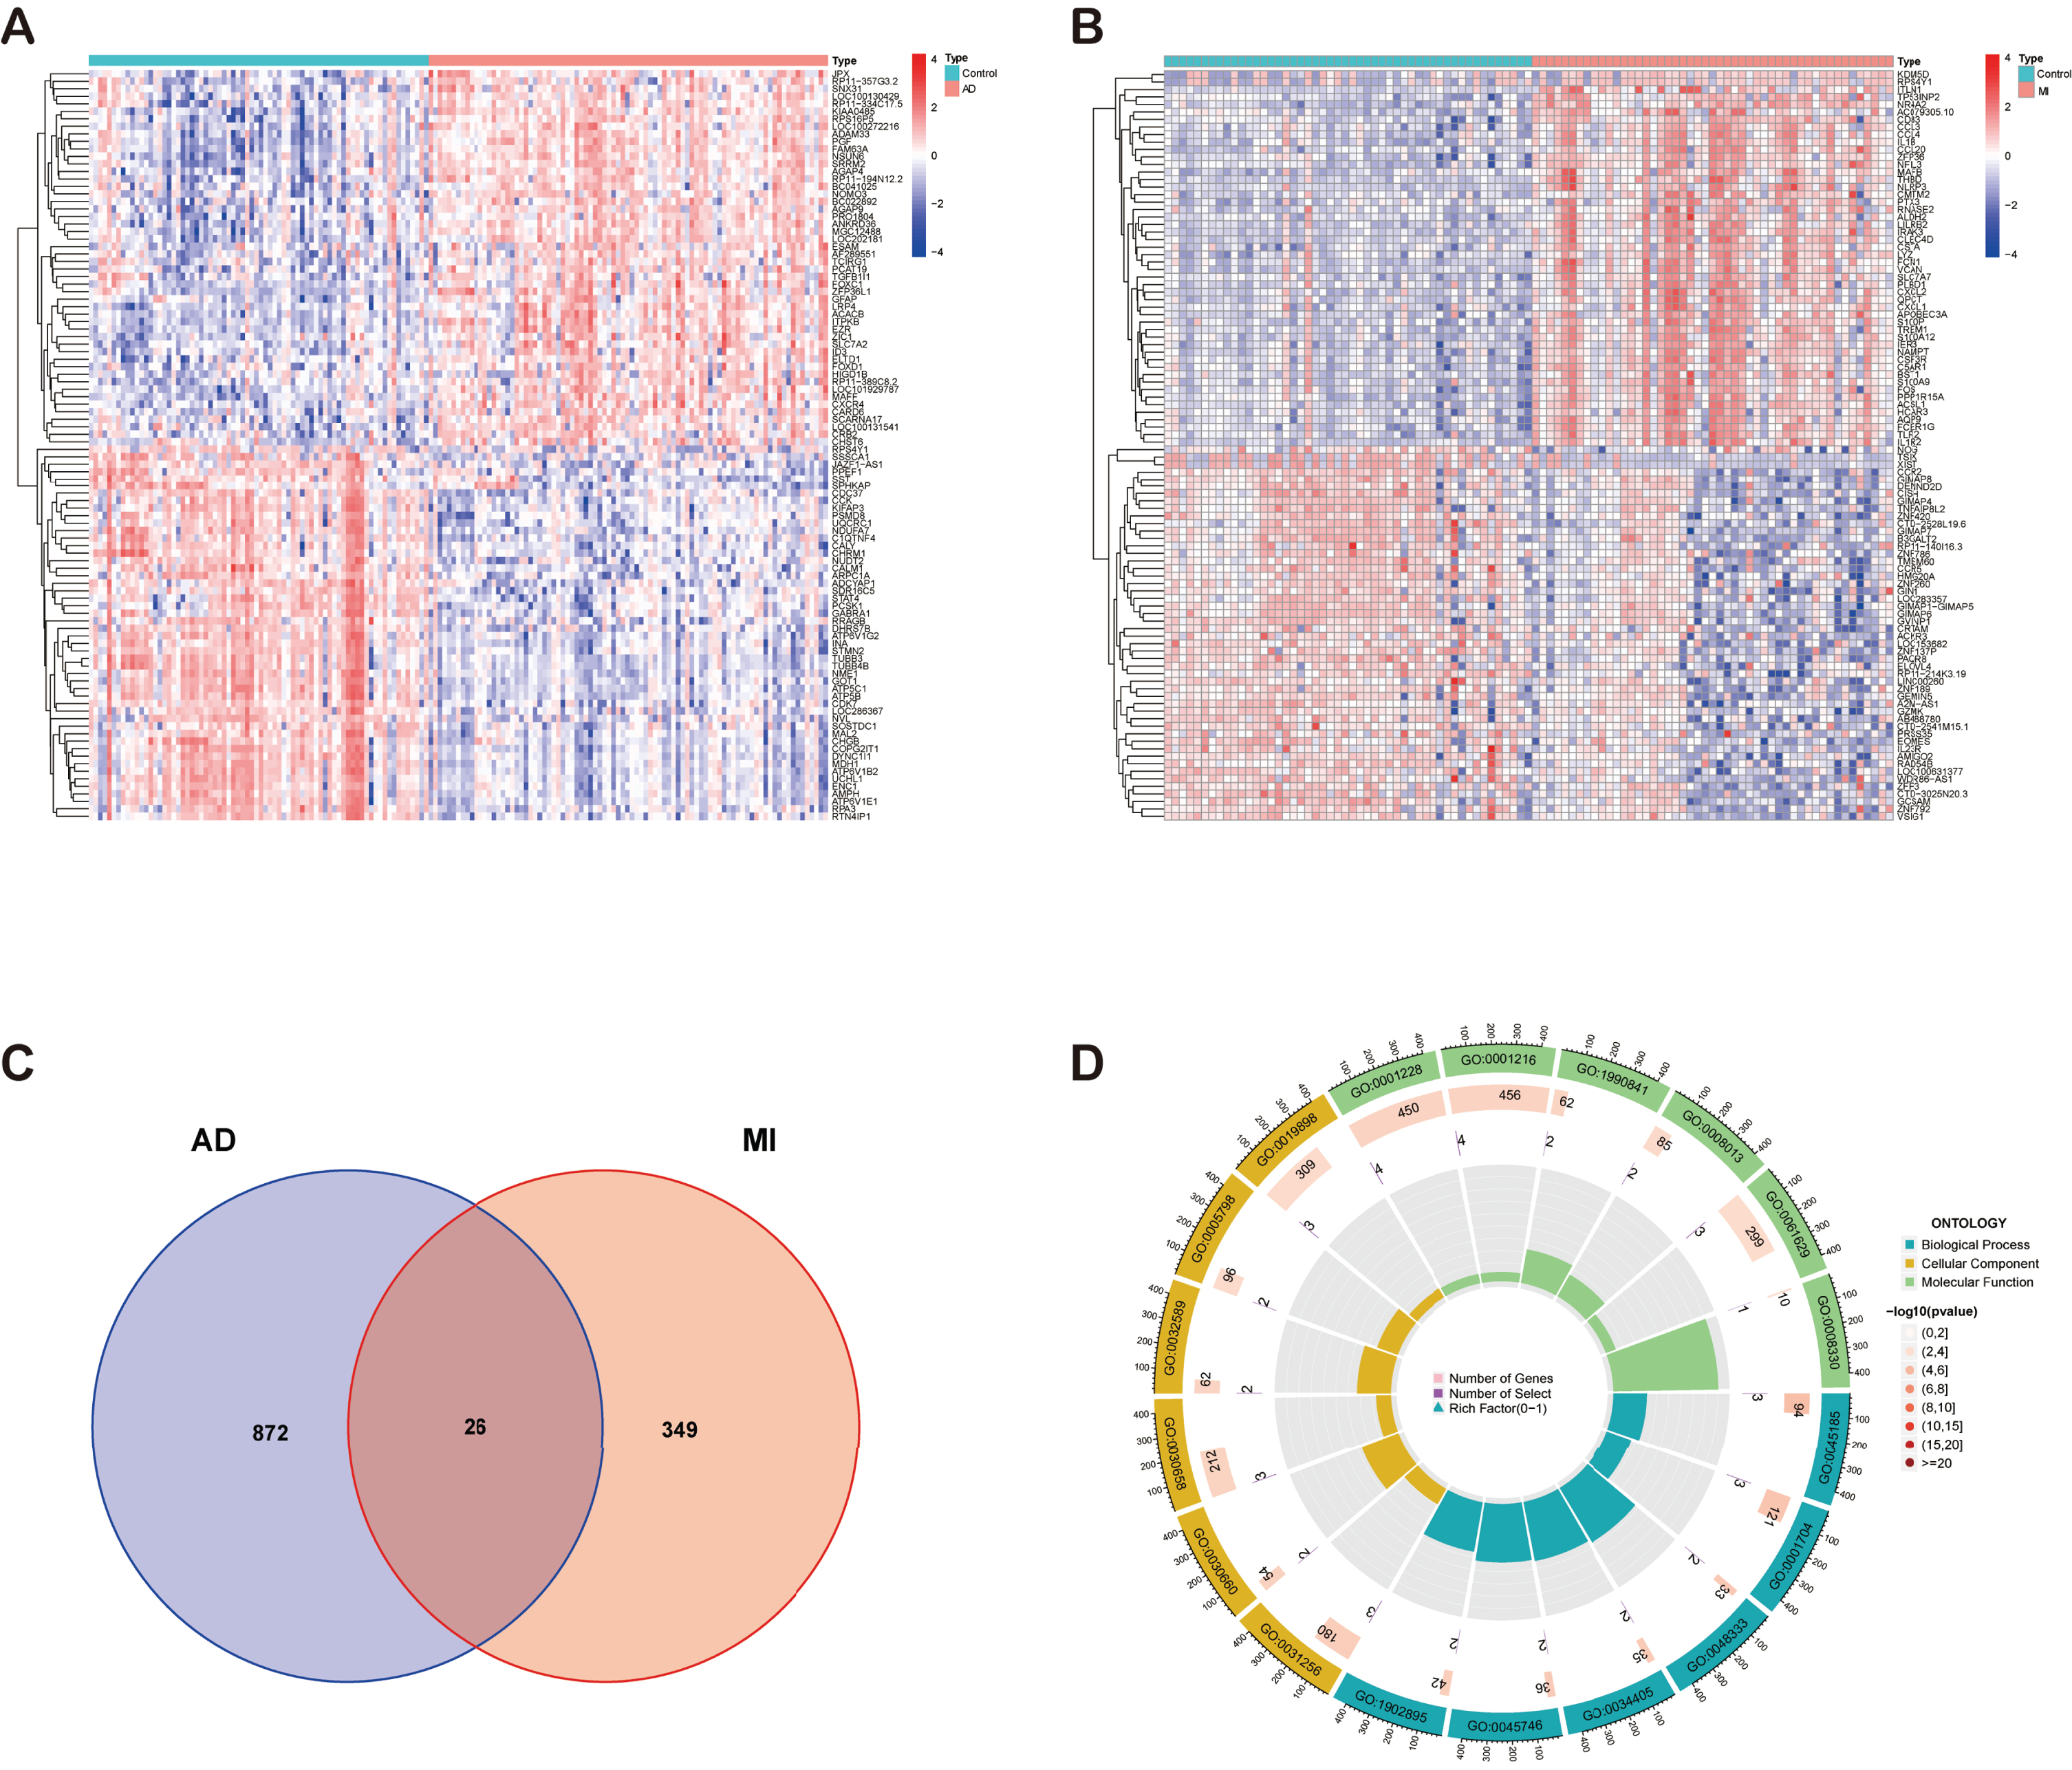
Subsequently, the common DEGs were subjected to GO (Supplementary Table 3) and KEGG (Supplementary Table 4) functional enrichment analyses by the “clusterProfiler” package in R software. p < 0.05 was considered to indicate statistical significance. Figure 2D shows the circle plot of GO enrichment analysis, and the enriched pathways were mainly inflammation-related.
Identification and GSEA of hub genes
LASSO regression was used for the MI and AD datasets separately to screen the candidate genes for each of the two diseases (Fig. 3A, B). 23 candidate genes were obtained in the MI dataset, and 31 candidate genes were obtained in the AD dataset (Supplementary Table 5).
Fig. 3
A) Biomarkers screening in the LASSO model. The number of genes (n = 31) corresponding to the lowest point of the curve was the most suitable for AD diagnosis. B) LASSO regression obtained 23 genes which were most suitable for MI diagnosis. C) Venn diagram shows the hub gene, RGS1, which was identified from the intersection of genes in AD and MI using LASSO model and PPI network. D) GSEA of RGS1 in AD dataset. E) GSEA of RGS1 in MI dataset. PPI, protein-protein interaction; AD, Alzheimer’s disease; MI, myocardial infarction.
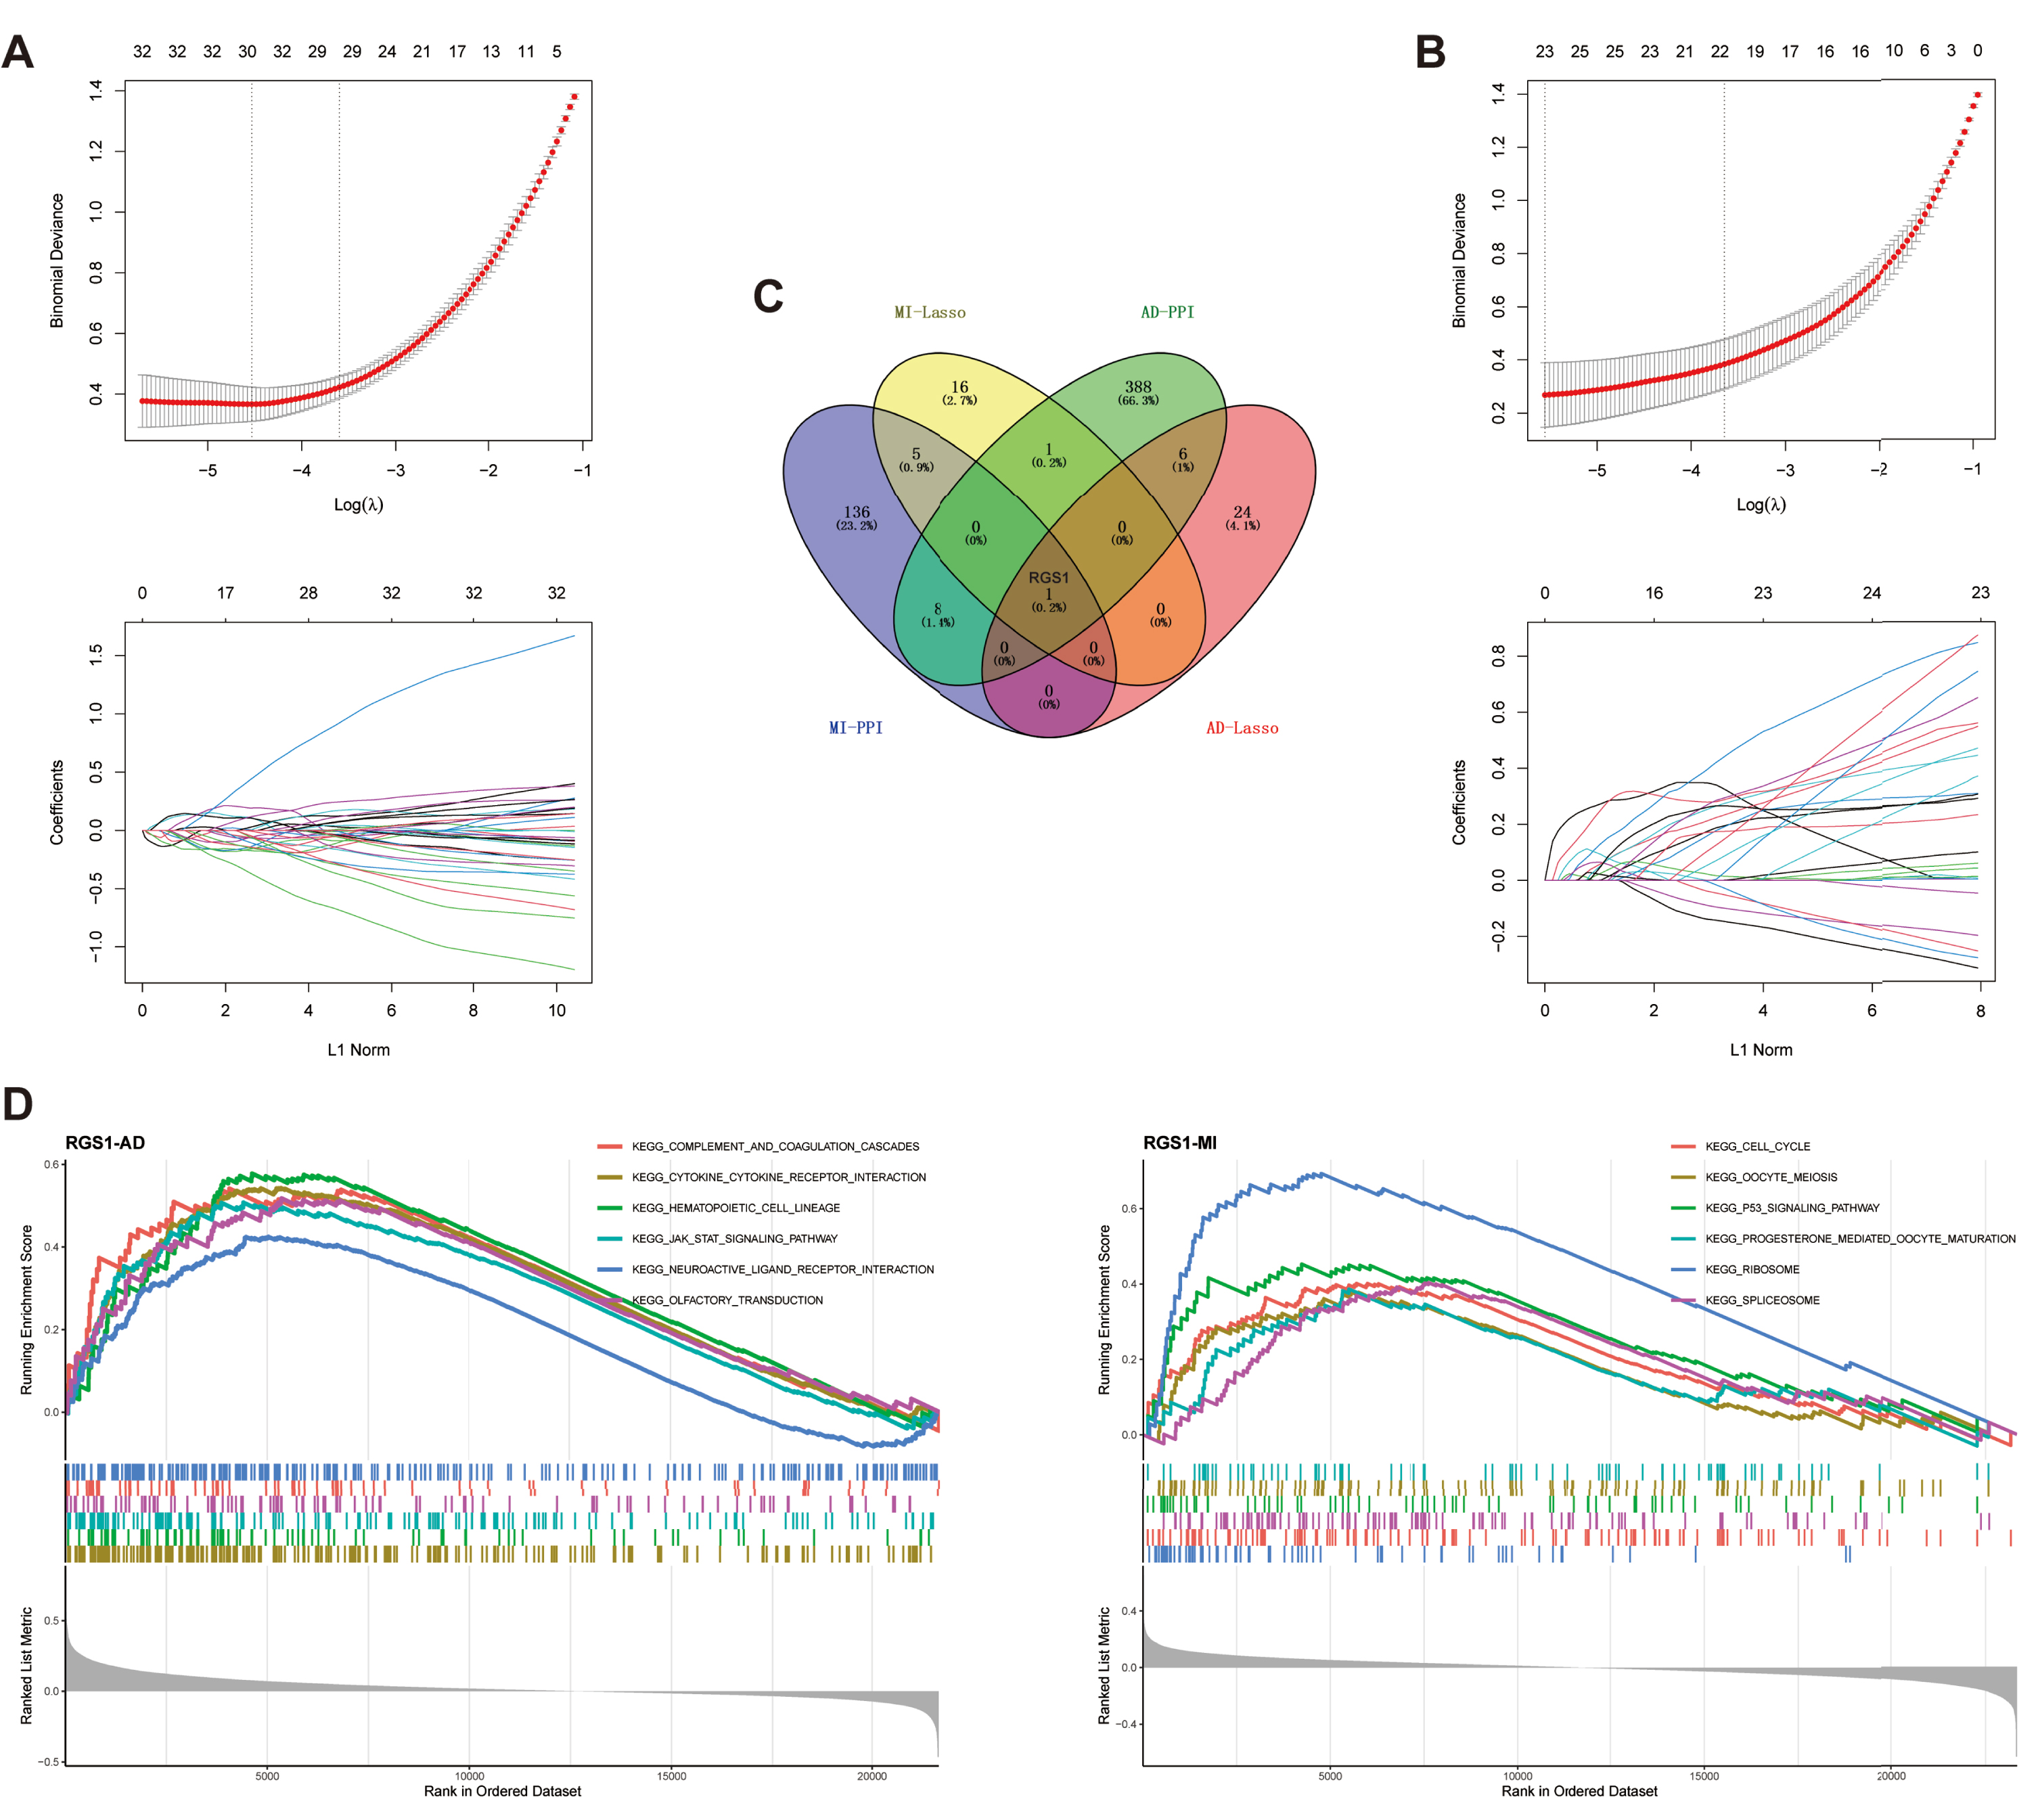
PPI networks were constructed using STRING to analyze 375 DEGs from MI and 898 DEGs from AD, respectively. The interaction network for MI included 322 nodes and 2,861 edges, and the interaction network for AD included 798 nodes and 4,266 edges. Next, we used the cytoNCA plugin to screen core nodes in MI with degree ≥8 and in AD with degree ≥6 (Supplementary Table 6). The network of core nodes was visualized with Cytoscape software (Supplementary Figure 1).
The candidate genes and core nodes of the two diseases were intersected to obtain one hub gene, regulator of G-protein signaling 1 (RGS1) (Fig. 3C).
GSEA was performed by comparing the target genes with a predefined set of genes to obtain the pathways and regulatory trends of target gene enrichment [51]. In AD, RGS1 was mainly associated with complement and coagulation cascade responses, cytokine receptors, hematopoietic cell profiles, JAK-STAT signaling pathways, neuroactive ligand receptor interactions, and olfactory transmission, which were upregulated with elevated expression of RGS1 (Fig. 3D). In MI, RGS1 was mainly associated with the cell cycle, cell meiosis, p53 signaling pathway, progesterone mediated oocyte maturation, ribosome, and spliceosome, which were also upregulated with elevated expression of RGS1 (Fig. 3D).
Quality control and dimension reduction clustering of CA scRNA-seq dataset
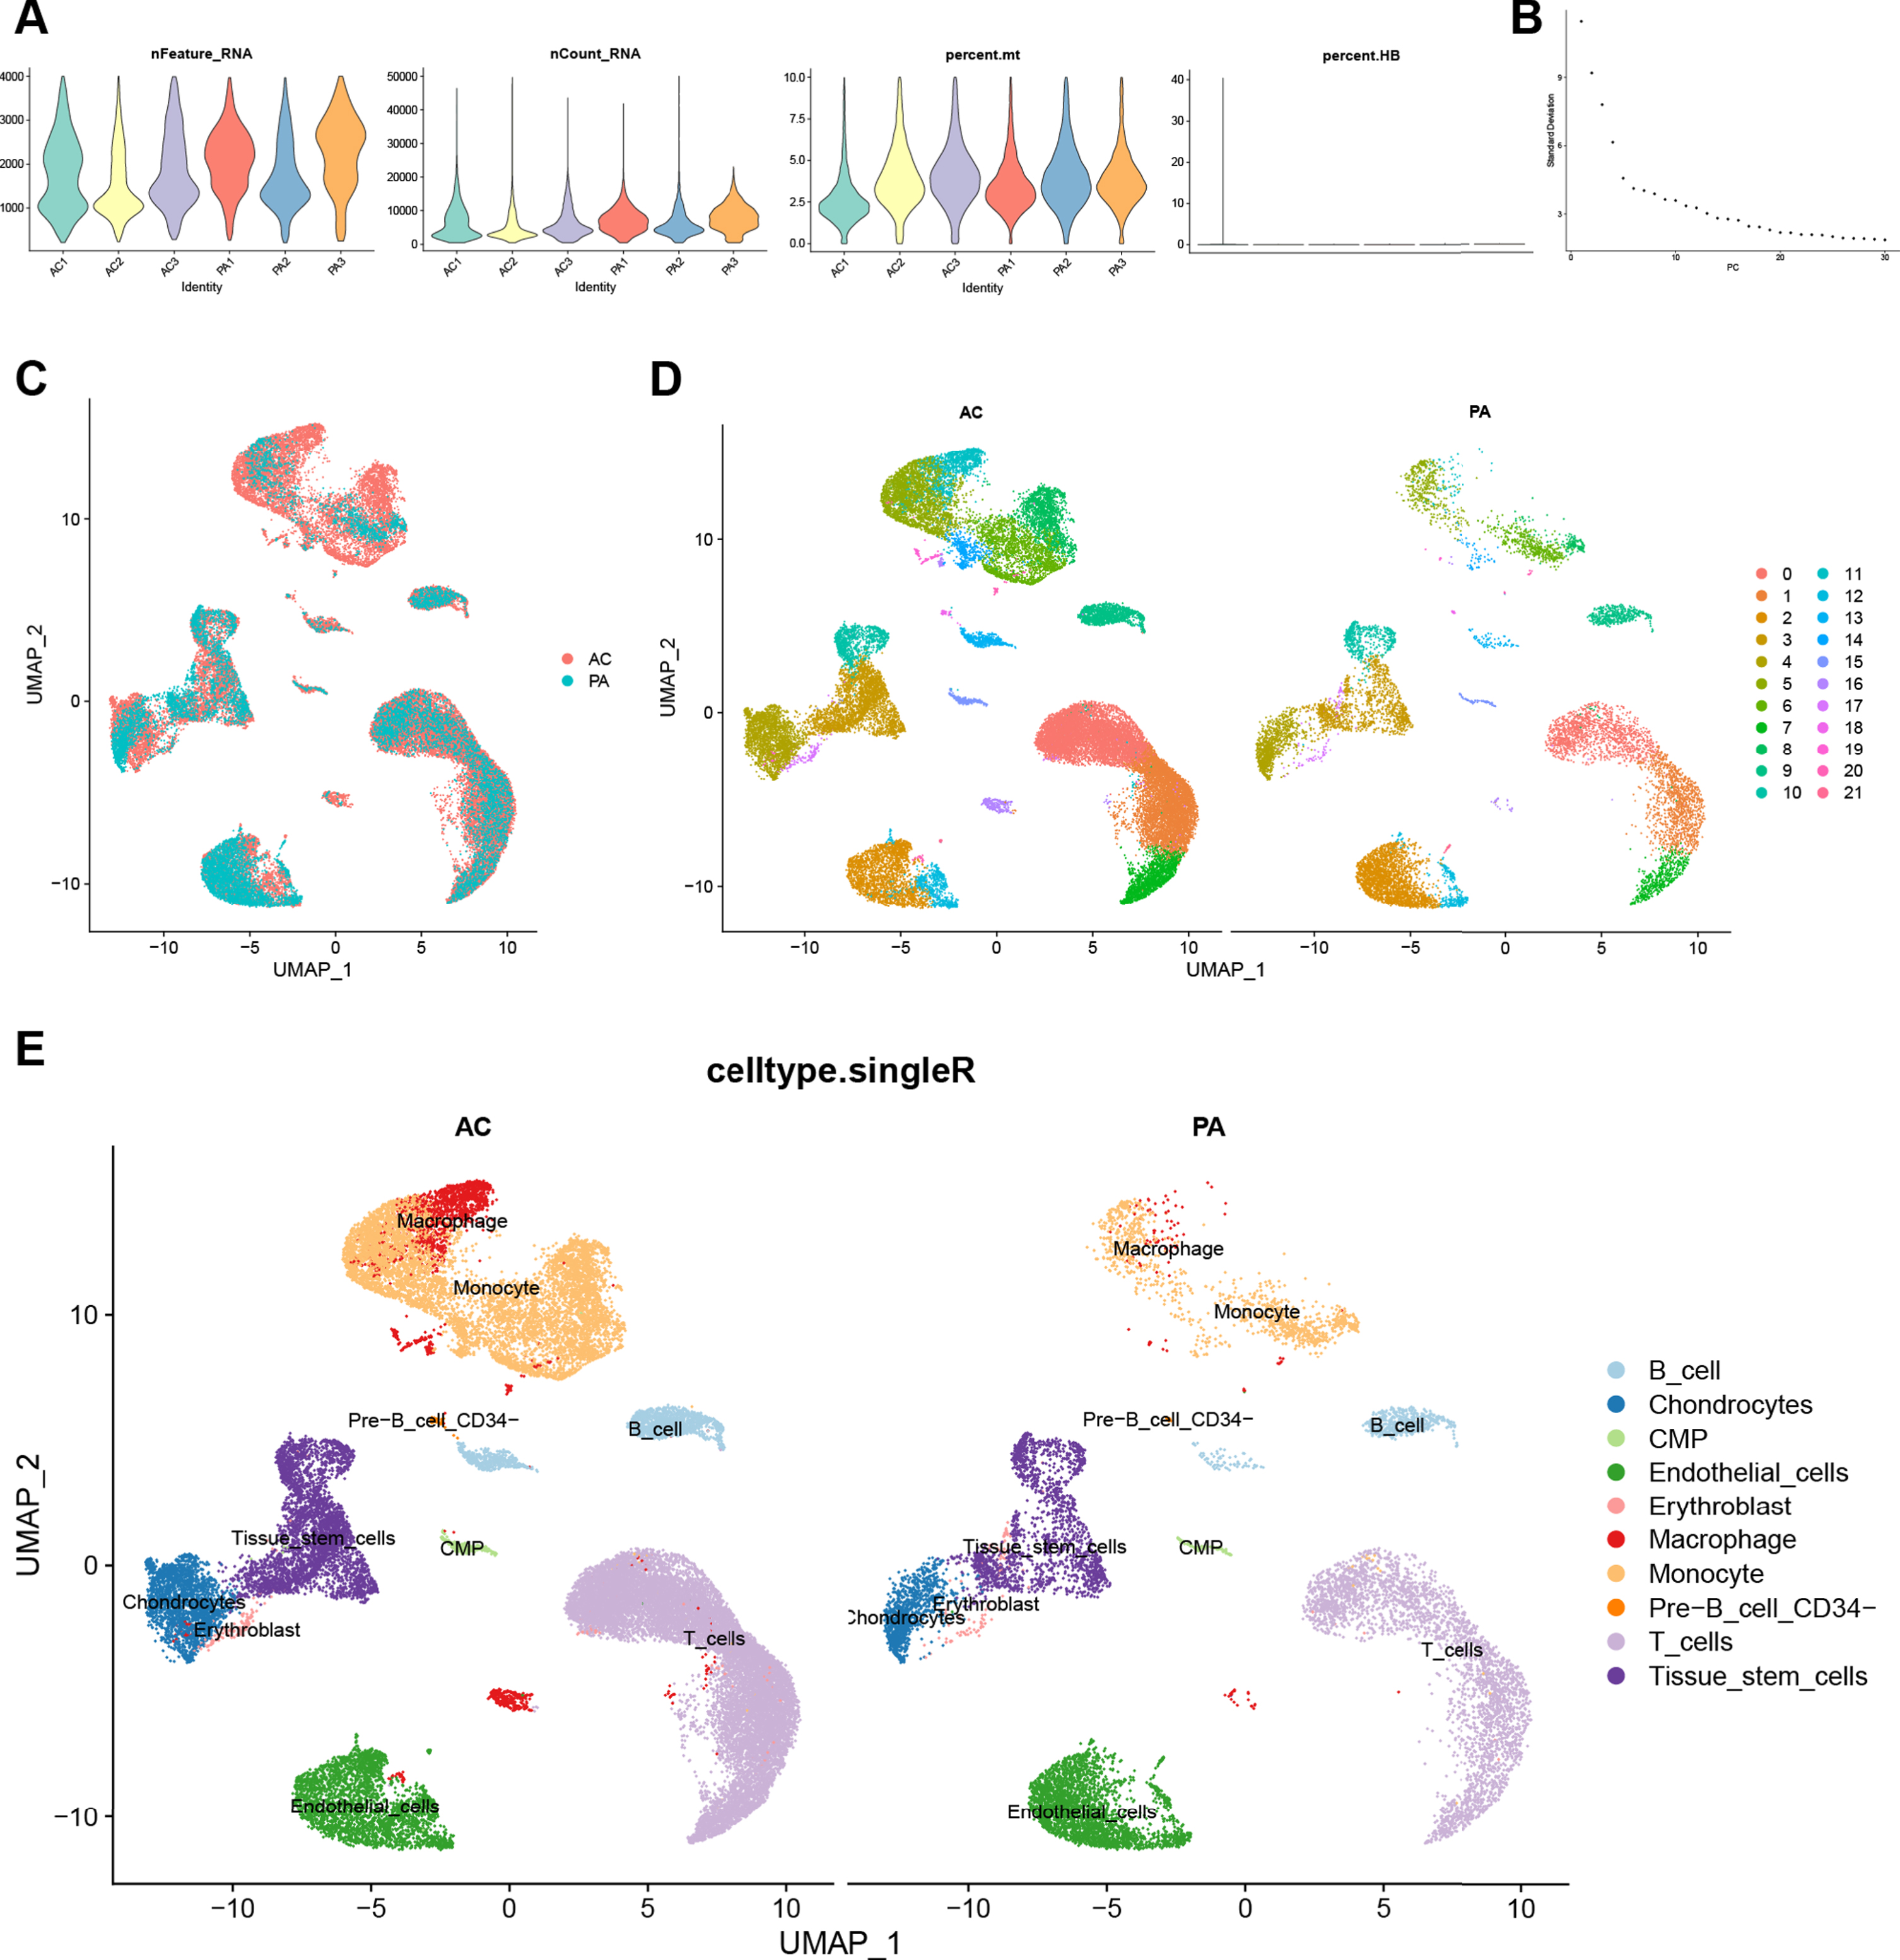
We performed quality control on the CA scRNA-seq dataset. The result is shown in Fig. 4A, and a total of 45,492 cells were included in the subsequent analysis according to the screening criteria. The Elbow plot of the principal components in the PCA analysis is shown in Fig. 4B. There was a clear inflection point at the 15th principal component, so the first 15 principal components were used for dimensionality reduction. As shown in the UMAP plot (Fig. 4C), the cell clusters in the AC and PA groups in the CA dataset overlapped, indicating that batch effects were eliminated during data integration. After clustering, the CA dataset was divided into 22 clusters based on the UMAP plot with different colors representing different cell clusters (Fig. 4D). Figure 4E shows the results of cell cluster annotation using the “singleR” package. The machine annotation classified cell populations into B cells, Chondrocytes, Common Myeloid Progenitors (CMP), Endothelial cells, Erythroblast, Macrophages, Monocytes, pre-B cell CD34, T cells, and Tissue stem cells (Supplementary Table 7).
Fig. 4
Quality control, cell clustering, and annotation of CA single-cell data. A) Violin plot shows cell characteristics after quality control. B) Elbow plot for the single cell data. The top 30 PCs were shown. C) Batch effect between AC and PA data eliminated by harmony. D) Cells in dataset were classified into 22 clusters. E) Cells were annotated by the “singleR” package reference Human Primary Cell Atlas Data. CA, carotid atherosclerosis; AC, atherosclerotic core; PA, proximal adjacent.
Manual annotation and AS-related DEGs
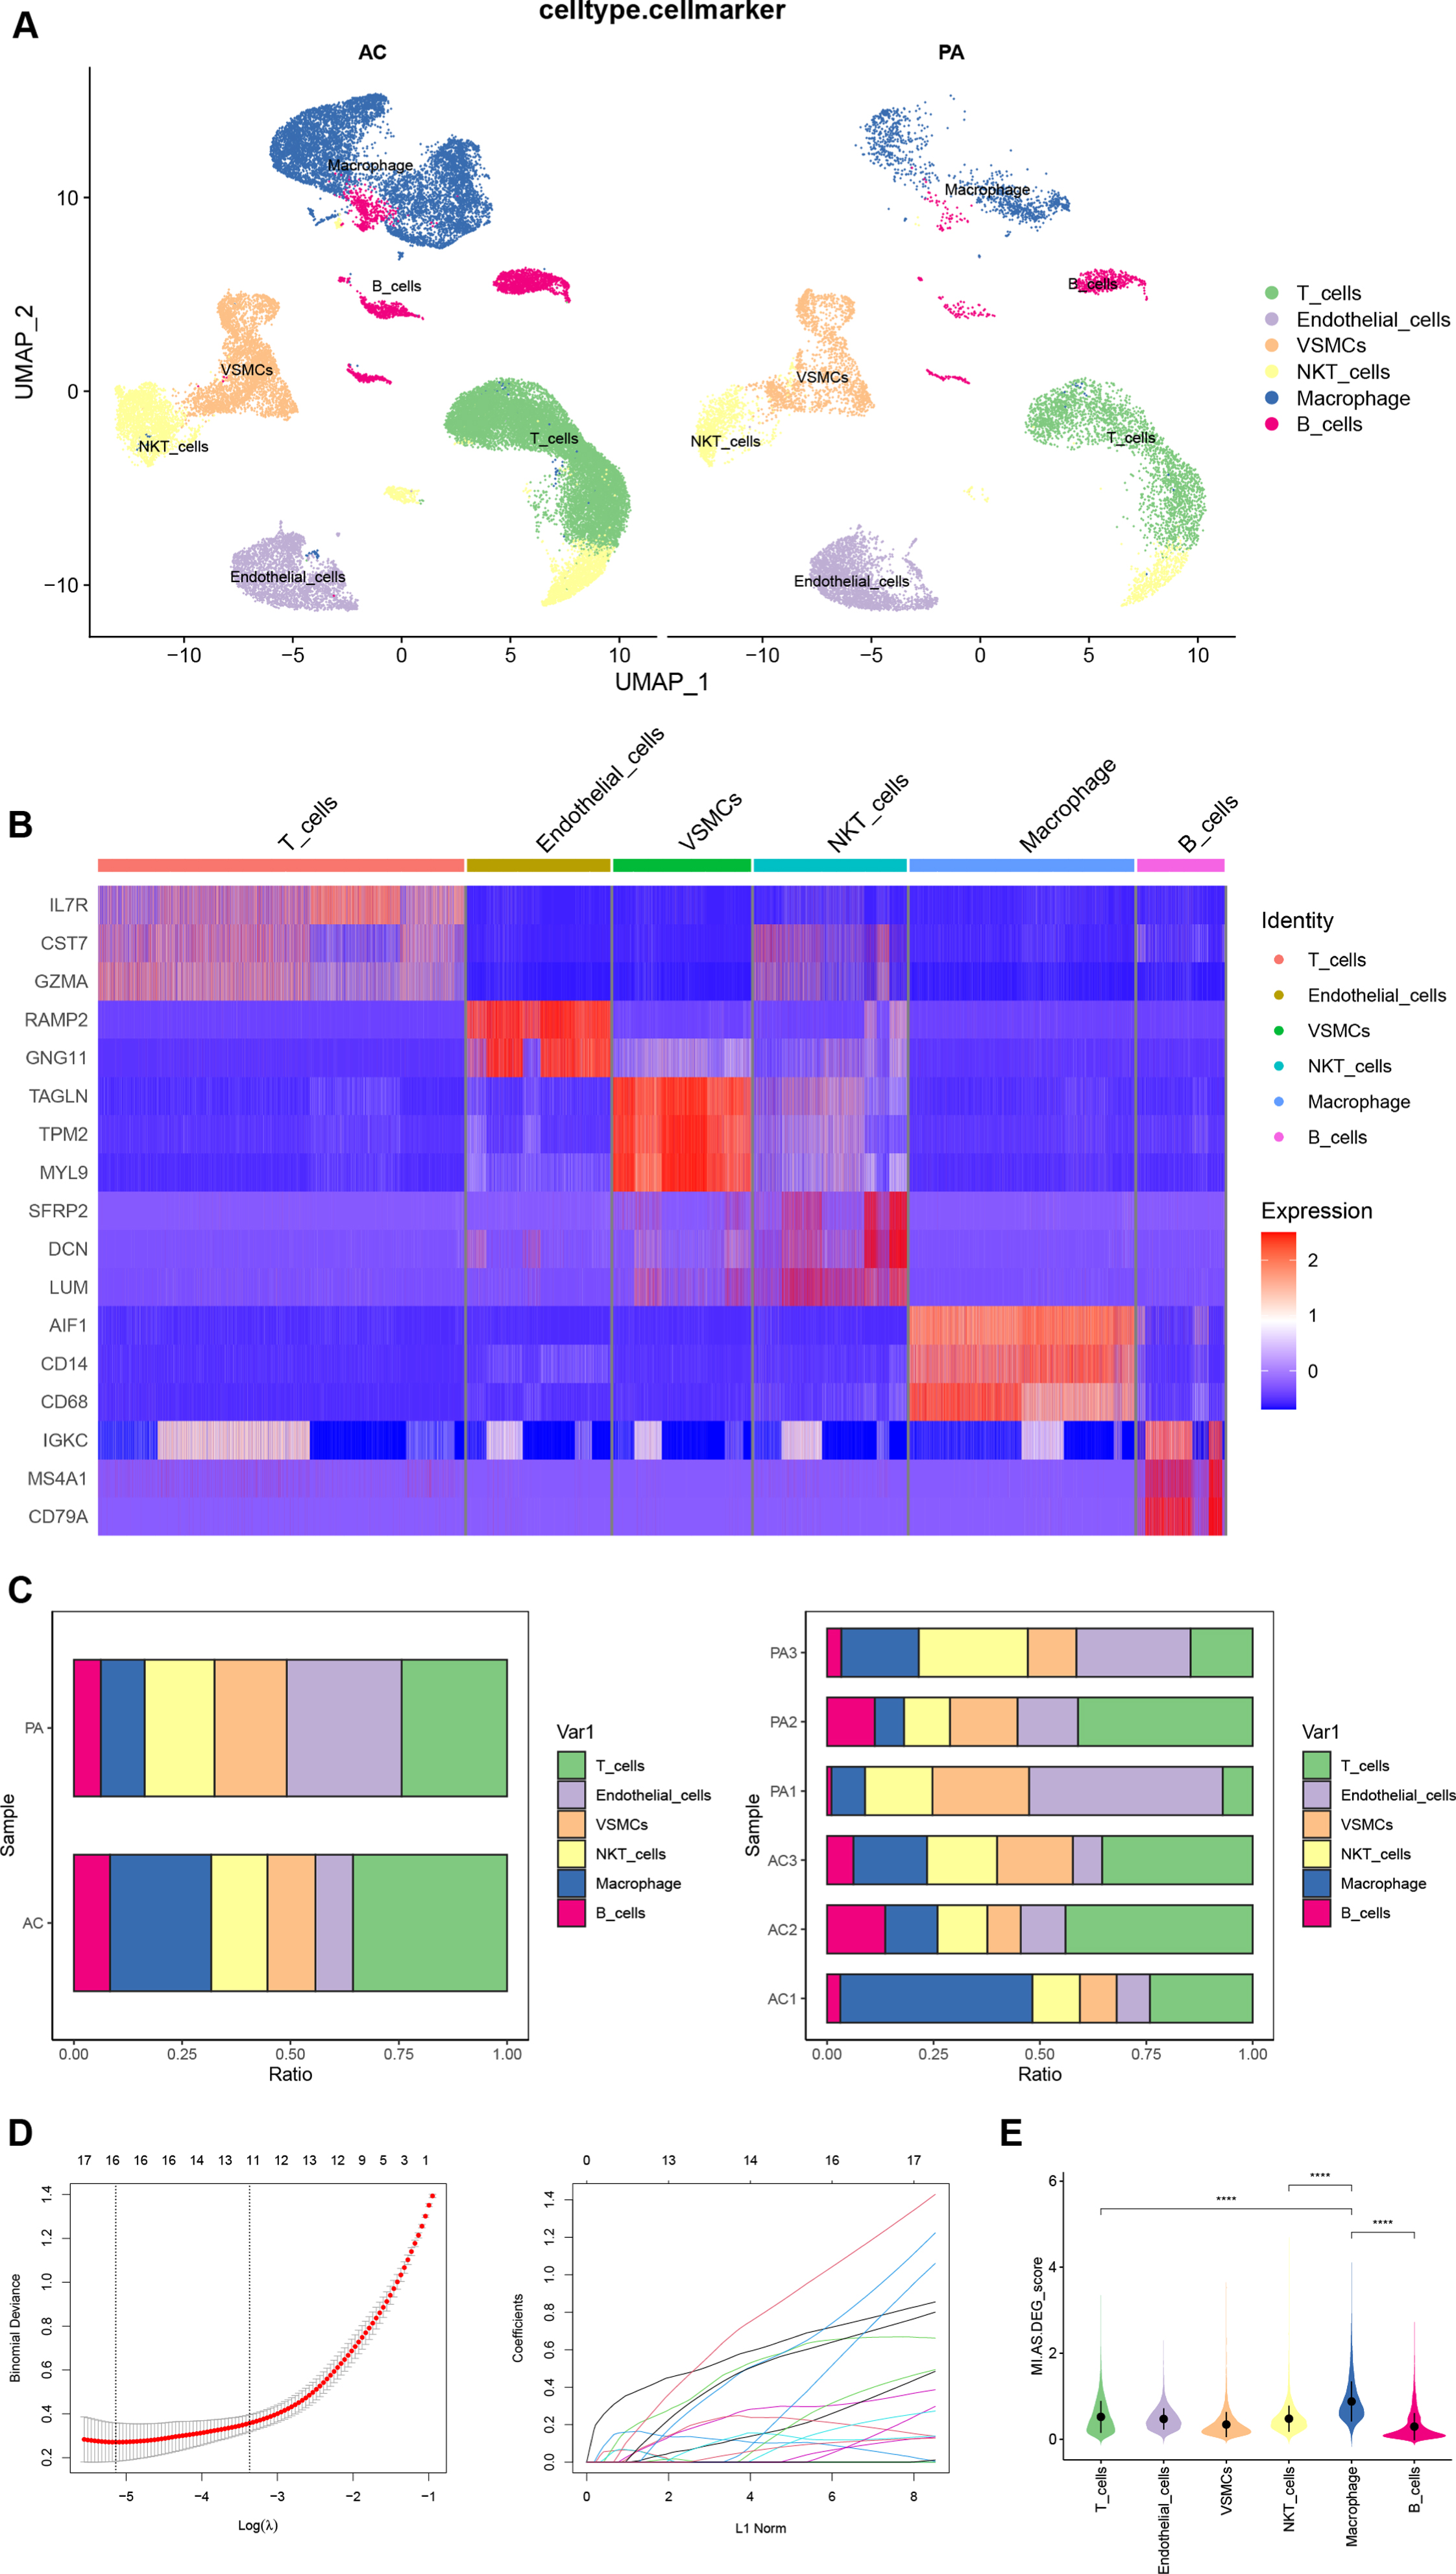
The “FindAllmarkers” function obtained the top 10 DEGs in each of the 22 cell clusters of the CA dataset. Combining the CellMarker database and the annotation results of “singleR”, we manually annotated the cell clusters (Fig. 5A). Cell clusters 0 and 1 were identified as T cells; 2, 12, 21 as endothelial cells; 3, 10 as vascular smooth muscle cells; 4, 7, 16, 17 as NKT cells; 5, 6, 8, 11, 19, 20 as macrophages; and 9, 13, 14, 15, 18 as B cells. We finally chose IL7R, CST7, and GZMA as markers for T cells; RAMP2 and GNG11 as markers for endothelial cells; TAGLN, TPM2, and MYL9 as markers for vascular smooth muscle cells; SFRP2, DCN, and LUM as markers for NKT cells; AIF1, CD14, and CD68 as markers for macrophages; IGKC, MS4A1, and CD79A as markers for B cells. The heatmap shows the expression of our final selected markers in cell clusters, and the markers differed significantly between cell clusters (Fig. 5B). Figure 5C shows the differences in the percentage of each cell cluster between groups and samples in the CA dataset. The “FindMarkers” function found 725 DEGs in the CA dataset (Supplementary Table 8). Intersection with MI-related DEGs was taken and 16 DEGs (Supplementary Table 9) were filtered by LASSO regression (Fig. 5D). The 16 DEGs were considered as AS-related DEGs. Referring to the manually annotated results, the expression of AS-related DEGs in 6 cell types of the CA dataset was scored and visualized with violin plots (Fig. 5E). The expression score of AS-related DEGs was higher in macrophages than in other cell clusters, and the differences between macrophages and other cell types were statistically significant (p < 0.0001).
Fig. 5
A) Manual annotation of cell clusters in CA with reference to previous studies. B) The heatmap shows good specificity of the cellular marker genes. C) The bars depict the percentage of each cell type in each group and patient. D) Biomarkers screening in the LASSO model. The number of genes (n = 16) corresponding to the lowest point of the curve was the most suitable for MI diagnosis. E) The violin plot demonstrates the expression of DEGs between CA and MI in each cell cluster. CA, carotid atherosclerosis; MI, myocardial infarction.
Processing and manual annotation of AD SnRNA-seq dataset
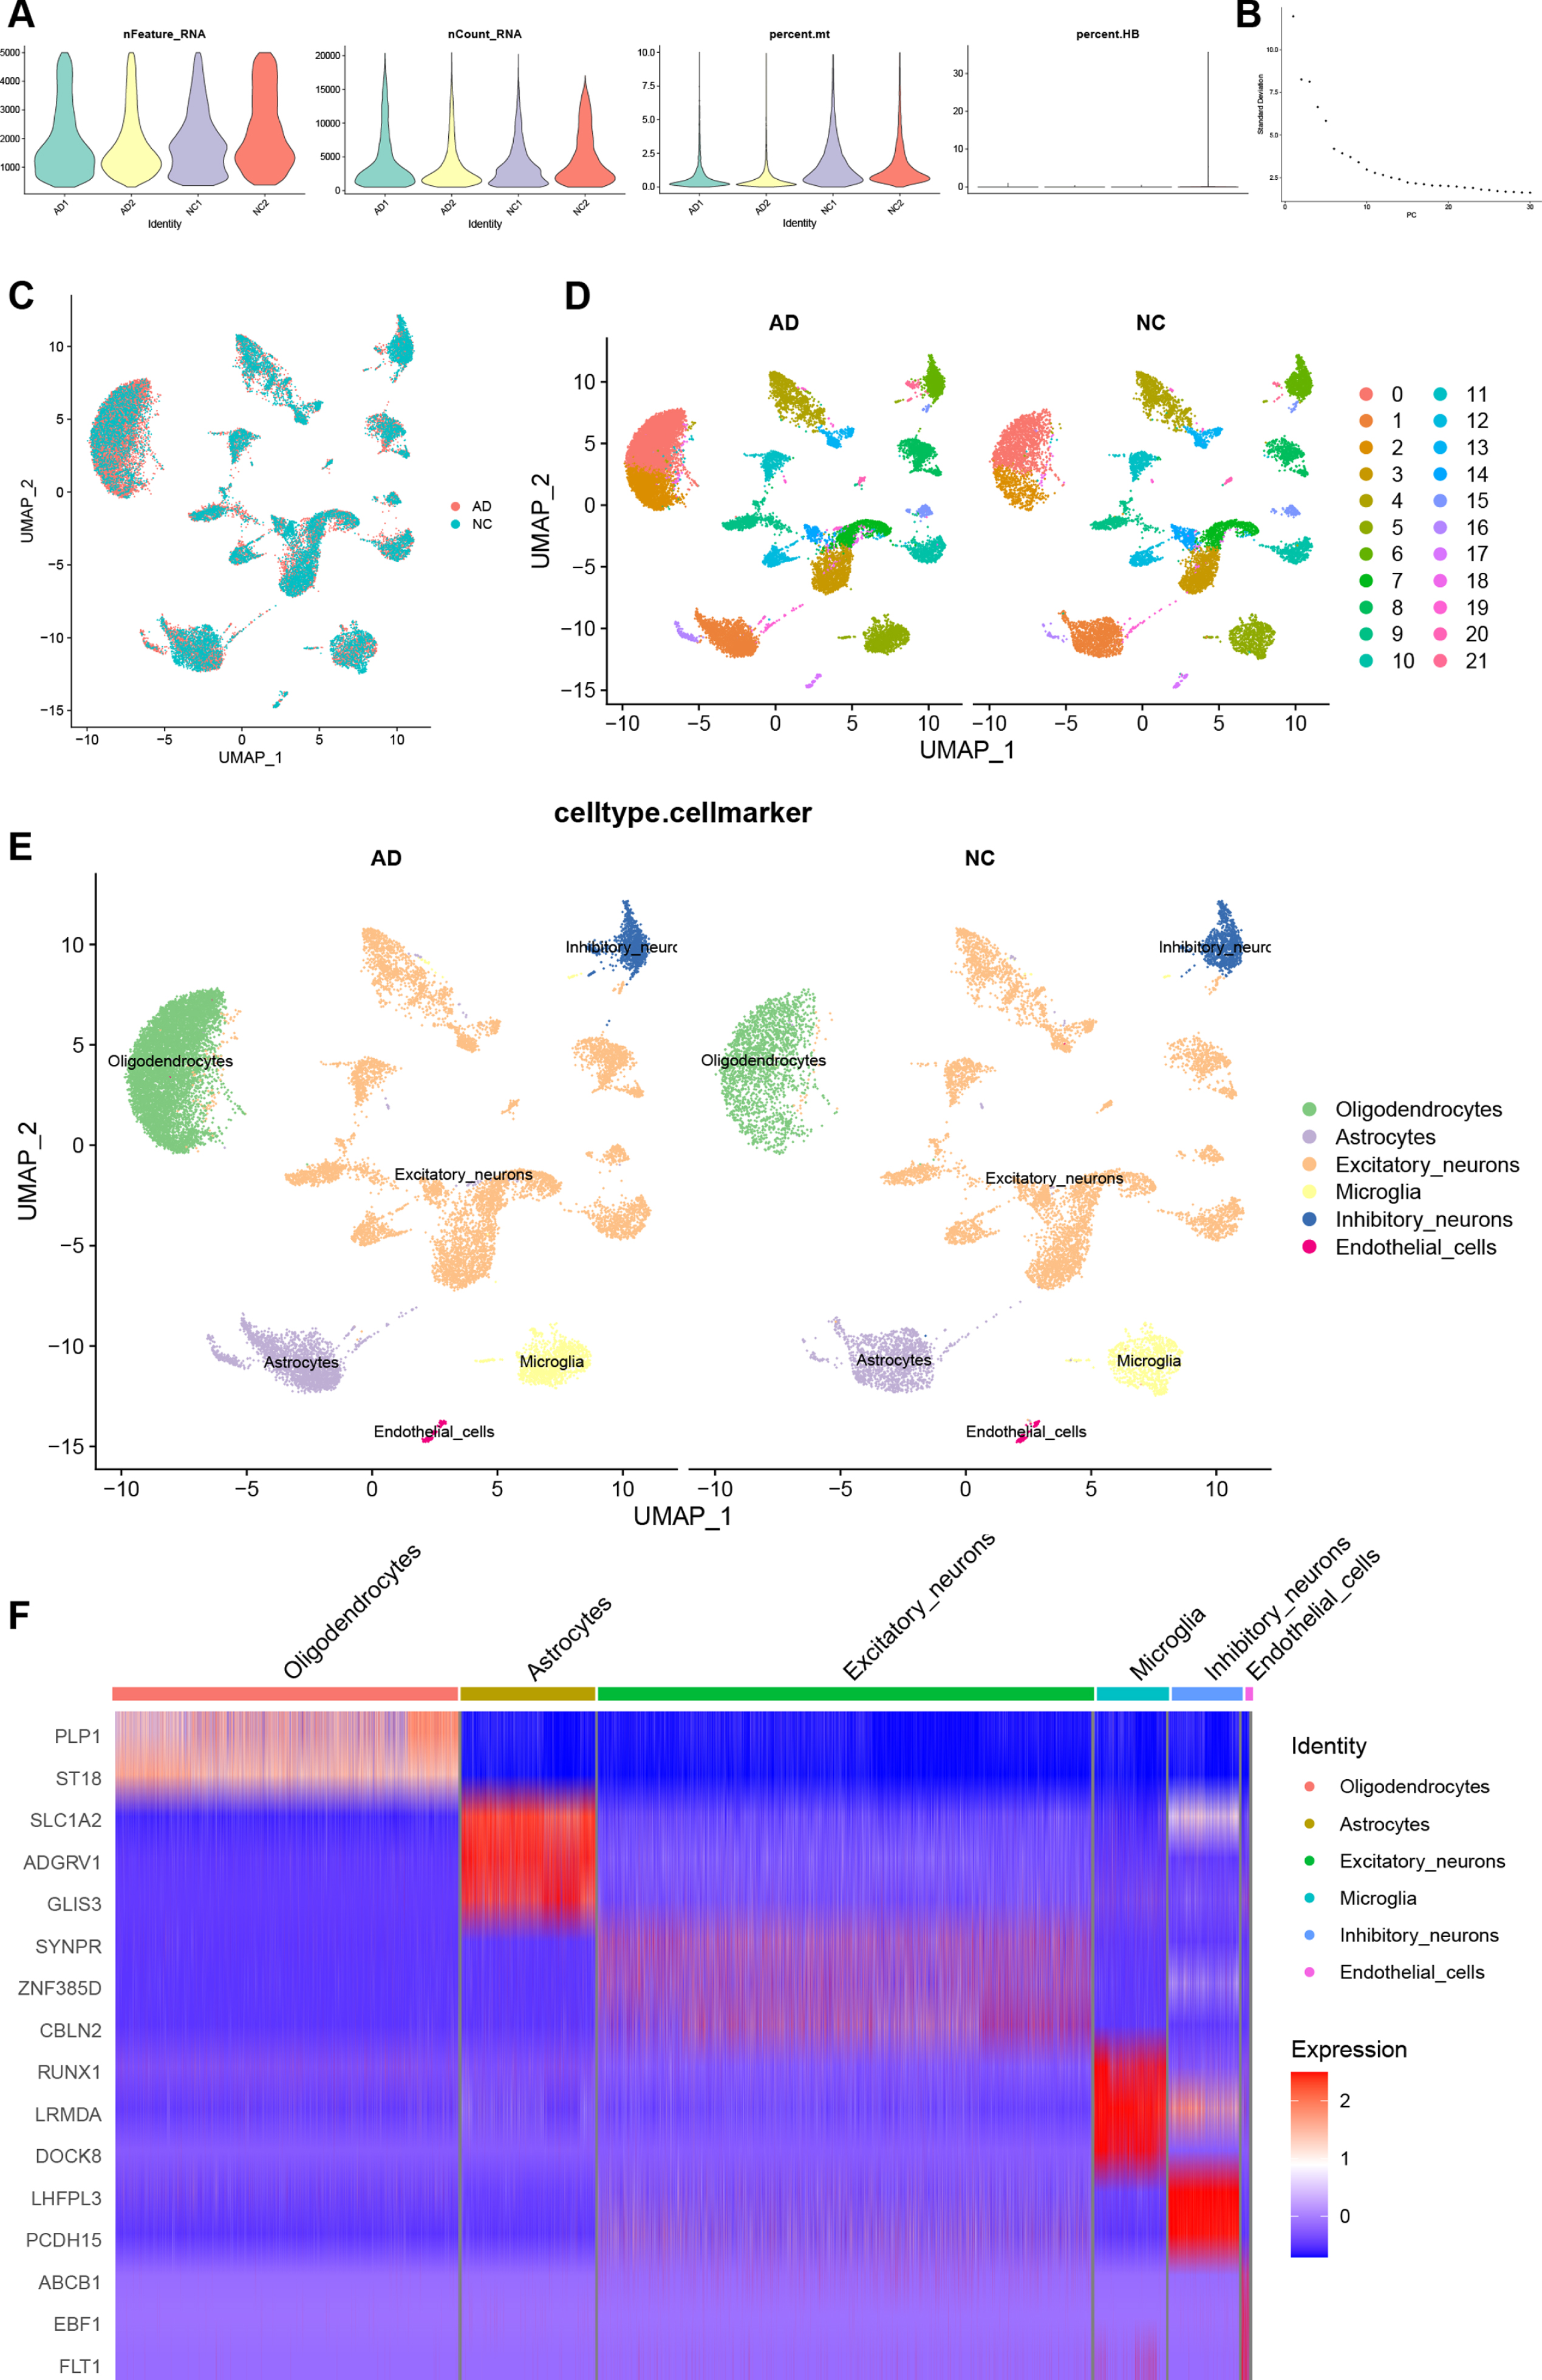
To compare the expression of RGS1 in the AD at the single-cell level, we obtained an AD snRNA-seq dataset GSE157827 from the GEO database. First, we performed quality control on the AD snRNA-seq dataset similarly. Figure 6A shows the AD dataset after quality control, and a total of 31,488 cells were screened. Figure 6B shows the principal component Elbow plots for PCA analysis of the AD dataset. The AD dataset showed a clear inflection point at the 20th principal component, and the first 20 principal components were used for dimensionality reduction. The UMAP plot of Fig. 6C demonstrates the removal of batch effects. The AD dataset was divided into 22 cell clusters (Fig. 6D). After manual annotation with reference to singleR results (Supplementary Table 10) and markers from previous literature, the cell clusters in the AD dataset were identified as excitatory neurons, inhibitory neurons, microglia, oligodendrocytes, astrocytes, and endothelial cells (Fig. 6E). Clusters 3, 4, 7–15, 18, 20 were identified as excitatory neurons; 6, 21 as inhibitory neurons; 0, 2 as oligodendrocytes; 1, 16, 19 as astrocytes; 5 as microglia; and 17 as endothelial cells. The expressions of markers for cell types in each cell cluster are shown in a heatmap (Fig. 6F). We selected SYNPR, ZNF385D, and CBLN2 as markers for excitatory neurons; LHFPL3, PCDH15 as markers for inhibitory neurons; PLP1, ST18 as markers for oligodendrocytes; SLC1A2, ADGRV1, GLIS3 as markers for astrocytes; RUNX1, LRMDA, DOCK8 as markers for microglia; ABCB1, EBF1, FLT1 as markers for endothelial cells. In the heatmap, red is upregulated and blue is downregulated, and markers of various cells were mainly highly expressed in their respective cell populations.
Fig. 6
Quality control, cell clustering, and annotation of AD snRNA-seq data. A) Violin diagram shows cell characteristics after quality control. B) Elbow plot for the single cell data. The top 30 PCs were shown. C) Batch effect between AC and PA data eliminated by harmony. D) Cells in dataset was classified into 22 clusters. E) Manual annotation of cell clusters in AD with reference to previous studies. F) The heatmap shows good specificity of the cellular marker genes. AD, Alzheimer’s disease.
Expression of hub gene and pseudotime analysis
The Feature Plot shows the expression of RGS1 in CA and AD, and the ochre dots represent cells expressing RGS1 (Fig. 7A, Fig. 8A). In CA, RGS1 expressed mainly in macrophages, B cells, and T cells (Fig. 7A), while in AD, the cell cluster expressing RGS1 was almost exclusively microglia (Fig. 8A). After that, we scored the expression of RGS1 in macrophages and microglia in the disease and control groups, respectively. In both types of cells, the expression of RGS1 was higher in the disease group than in the control group (Figs. 7B, 8B). We obtained the same trend in the bulk RNA-seq datasets of MI and AD (Supplementary Figure 2).
Fig. 7
A) Feature plot shows the expression of RGS1 in different cell clusters of CA. The ochre dots indicate the expression of RGS1 in this cell cluster. B) There was a difference in the expression of RGS1 in macrophages in the two groups, and the difference was statistically significant. ****p < 0.0001. C–E) Pseudotime analysis of macrophages in GSE159677. C) Timing differences in cell differentiation. Darker blue represents an earlier stage of differentiation, while lighter blue indicates a later stage of differentiation. D) Differentiation of AC macrophages from PA macrophages. E) Timing differences in the expression of RGS1 in different groups. It was upregulated in the AC group and downregulated over time in the PA group. CA, carotid atherosclerosis; AC, atherosclerotic core; PA, proximal adjacent.
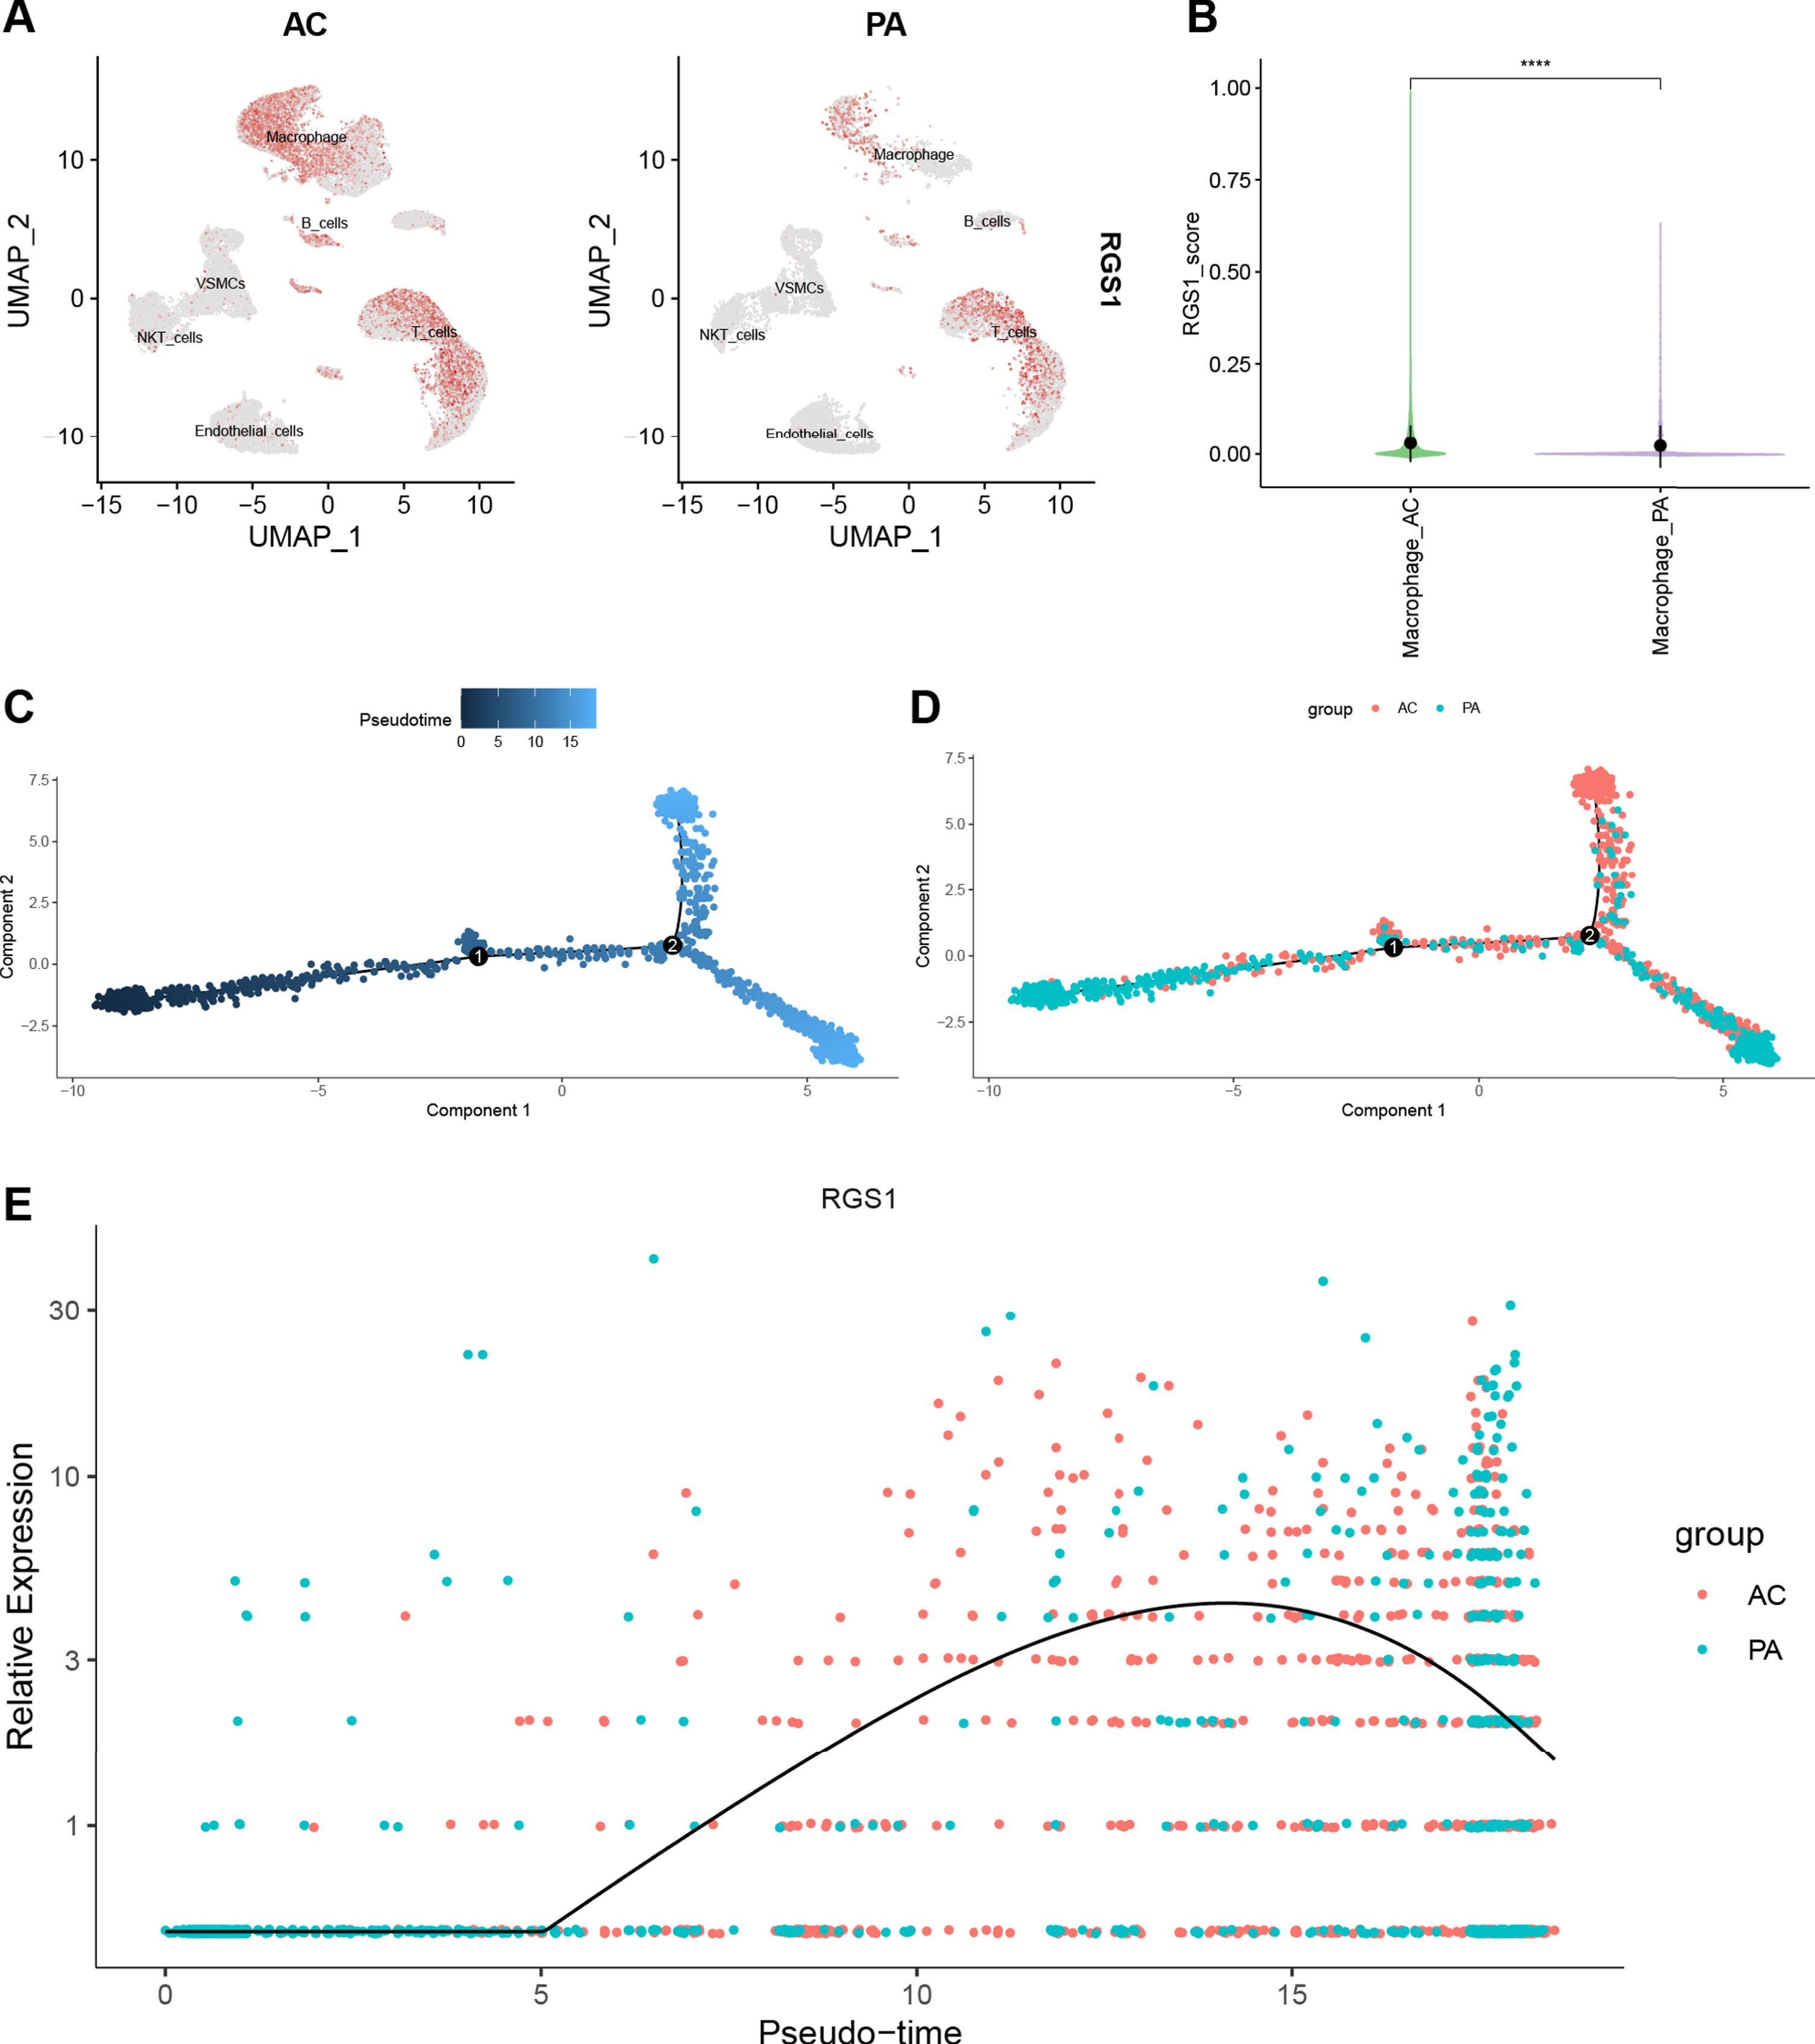
Fig. 8
A) Feature plot shows the expression of RGS1 in different cell clusters of AD. The ochre dots demonstrate that RGS1 expressed almost exclusively in microglia. B) There was a difference in the expression of RGS1 in microglia in the two groups, and the difference was statistically significant. ****p < 0.0001. C–E) Analysis of pseudotime in GSE159677. C) Timing differences in cell differentiation. Darker blue represents an earlier stage of differentiation, while lighter blue indicates a later stage of differentiation. D) Differentiation of AD microglia from NC microglia. E) Timing differences in the expression of RGS1 in different groups. It was upregulated in the AD group and downregulated in the NC group. AD, Alzheimer’s disease; NC, normal control.

With the “monocle” package we have performed pseudotime analysis of macrophages and microglia. The “monocle” package simulates the possible trajectories of cellular differentiation based on changes in gene expression levels in the cells, with color shades representing chronological order. As shown in Fig. 7C, the color of the trajectory becomes lighter from left to right, representing the direction of macrophage differentiation. Macrophages in the AC group were more distributed in a branch in the second half of the trajectory (Fig. 7D). We speculated that this branch was pro-inflammatory M1 macrophages. The temporal order of the trajectories of microglia was from right to left (Fig. 8C). Microglia in the AD group were mainly distributed in the latter half of the trajectories (Fig. 8D).
We used curves to show the changes in the expression level of RGS1 in the obtained trajectories (Figs. 7E, 8E). The x-axis of the curves indicates the chronological order and the y-axis presents the expression level. Because of the large difference in the distribution of cells from two groups in the trajectory, we suggested that the elevated expression level of RGS1 may promote the pro-inflammatory differentiation of macrophages and microglia and thus participate in the development of the disease.
Construction of Sankey diagram and prediction of key TF
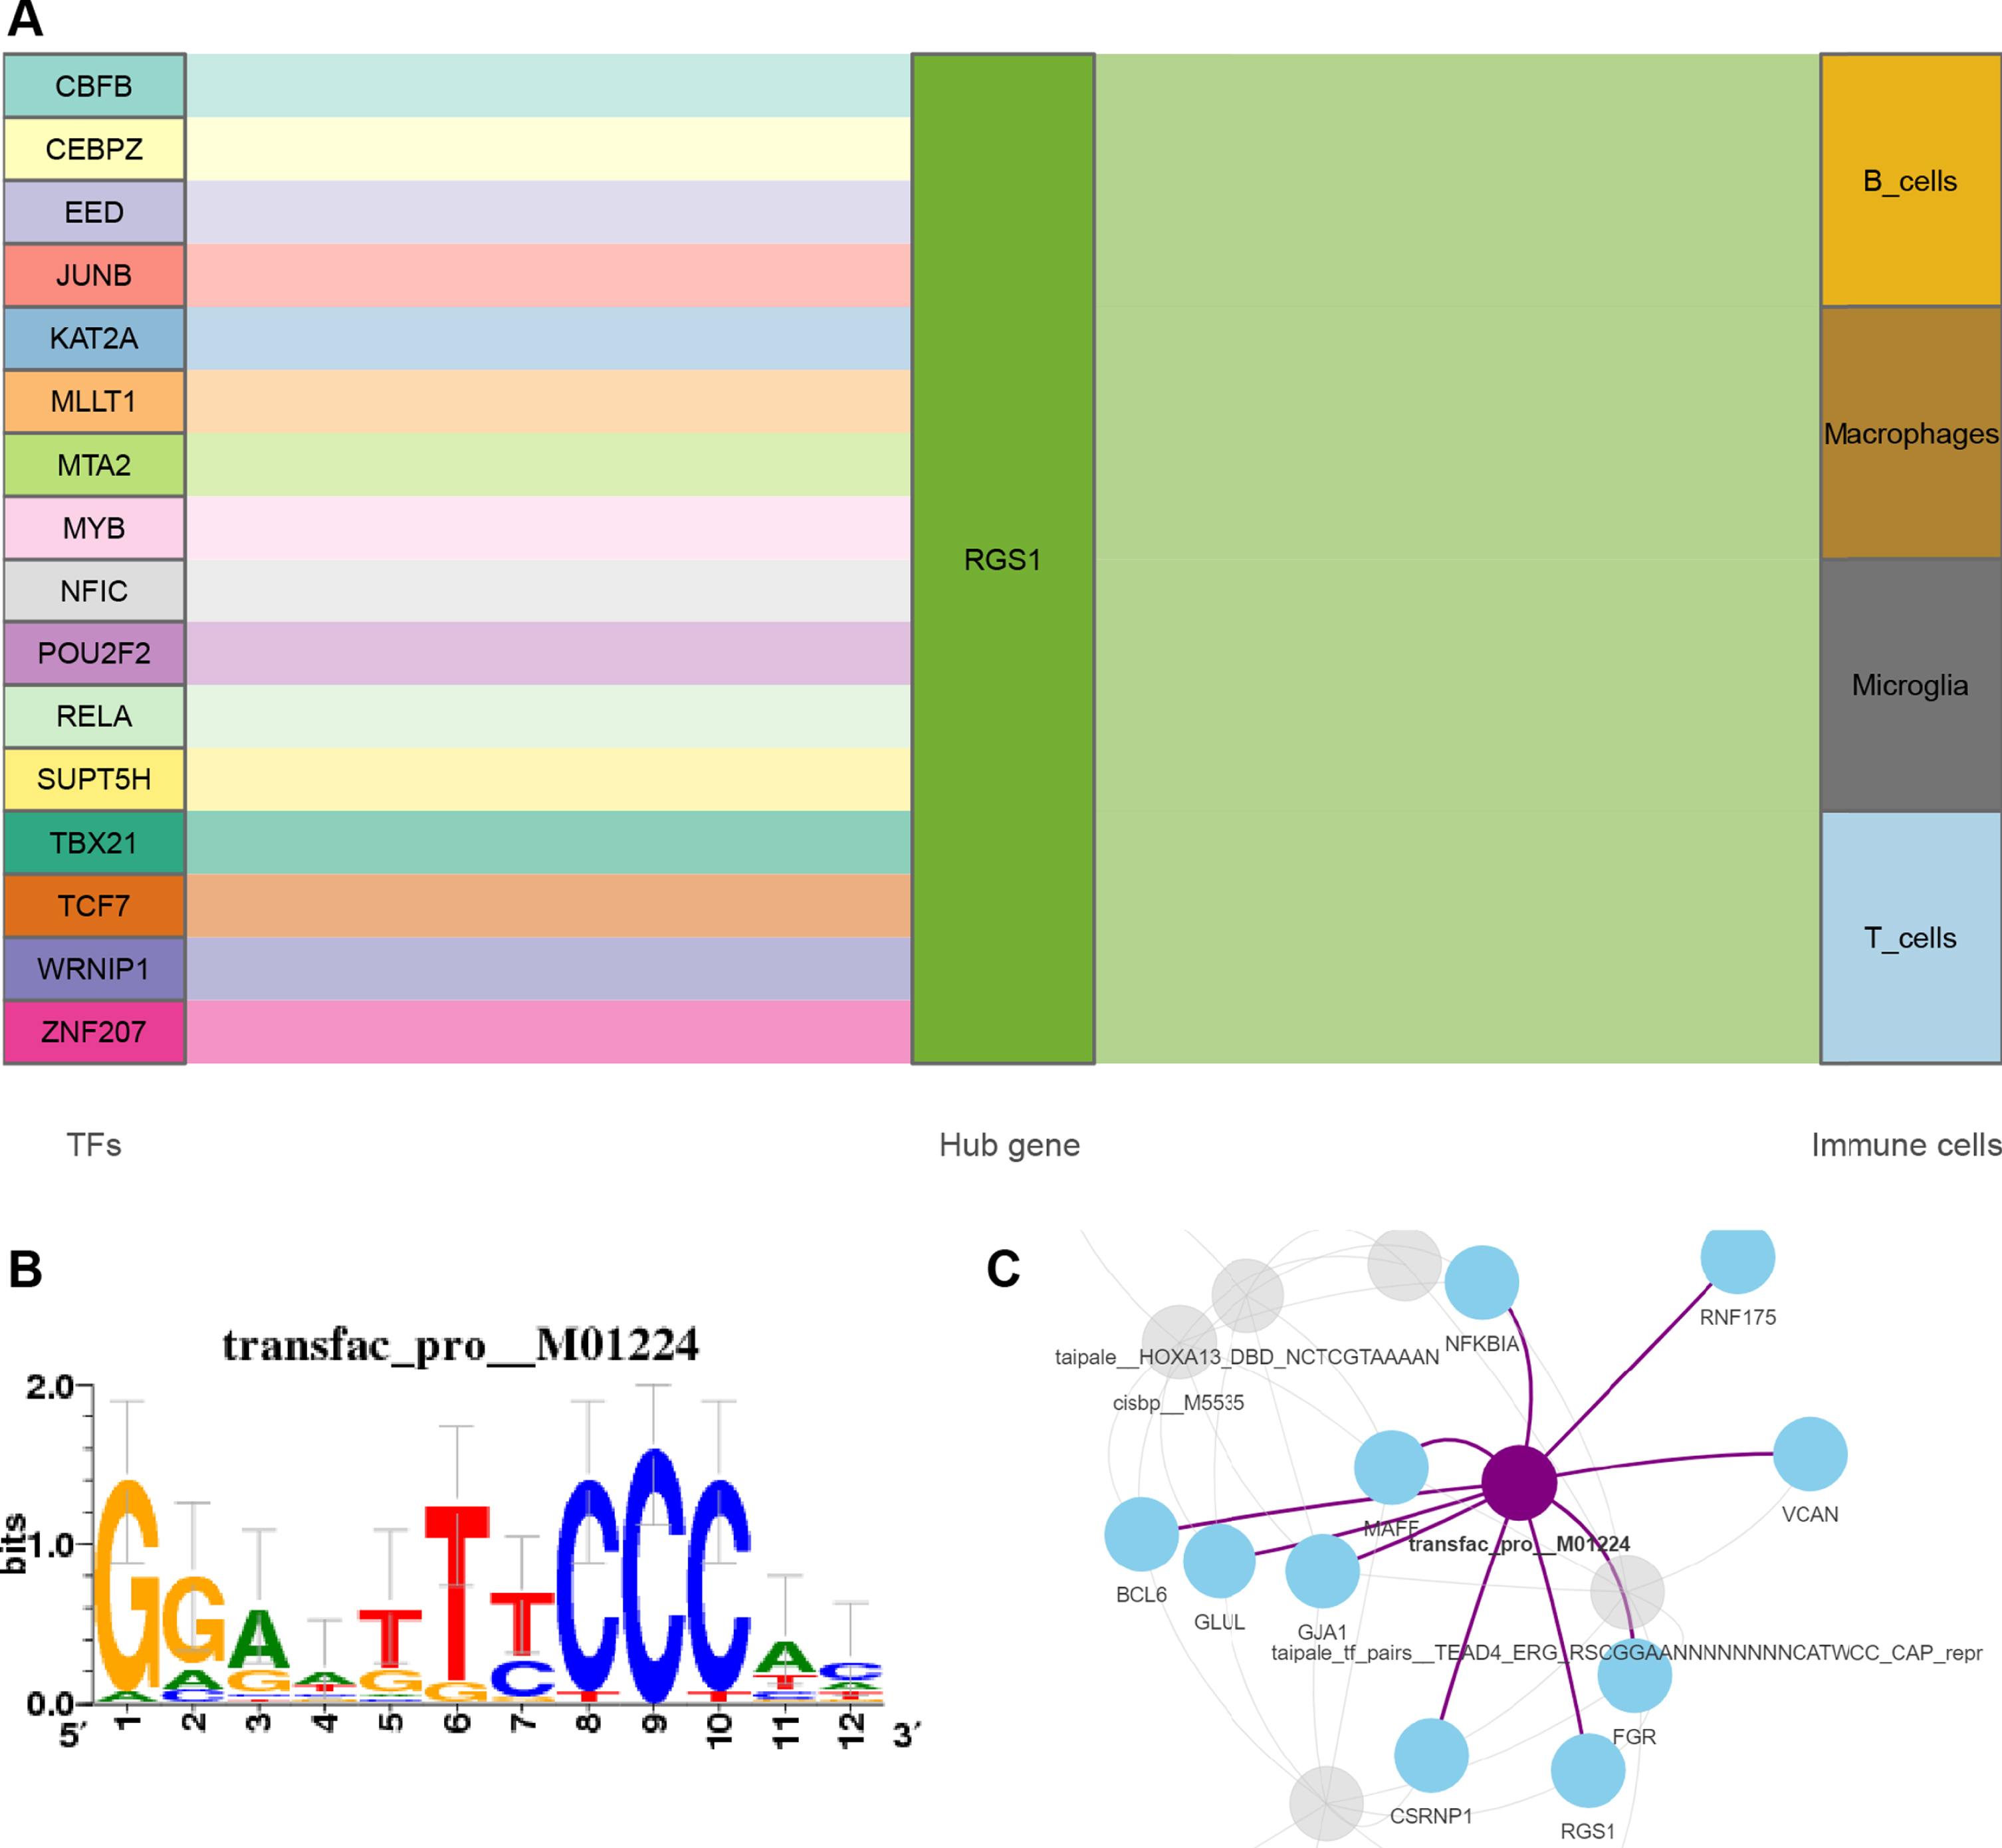
We obtained 16 TFs that may regulate the expression of RGS1 through the online platform [49]. A Sankey diagram was then constructed to show the relationship between TFs, RGS1, and immune cells (Fig. 9A). The 26 common DEGs of MI and AD were included in the motif enrichment analysis, by which RelA (NES = 6.12, Supplementary Table 11) was obtained as a possible key TF. The binding site of RelA is shown in Fig. 9B. Figure 9C demonstrates the regulatory network of RelA with genes.
Fig. 9
A) Sankey diagram shows the flow among TFs, genes, and immune cells. The TF-gene interaction was obtained from Networkanalysis. B) The sequence features obtained from motif enrichment analysis. The high and low bases in the graph indicate the likelihood of the occurrence of that base in the motif sequence. C) Regulatory network of RelA and genes.
DISCUSSION
Both MI and AD are high-mortality diseases and patients may have suffered irreversible damage at the time of diagnosis. A study showed that patients with MI had elevated odds of co-occurring vascular dementia, which was not associated with other causes of dementia [52]. However, limitations on the accuracy of the diagnosis of AD and the mean follow-up time may have an impact on the final results, as the symptoms of AD may appear much later than the pathological changes. In addition, it has been shown that in patients with dementia vascular lesions and pathological manifestations of AD are often concomitant [53, 54]. We suggest that the effects of coronary artery disease on the cerebral vasculature and the inflammatory response after MI are associated with the development of AD, complicating the pathological changes in patients with dementia after MI. Exploration of biomarkers related to both diseases and possible mechanisms may be useful for early diagnosis and treatment.
In enrichment analysis, common DEGs in MI and AD were mainly associated with some inflammatory pathways. Inflammation in both diseases has been investigated in several studies [23, 24, 29], which is identified as myocardial inflammation after MI or neuroinflammation in AD. Macrophages are one of the main immune cells involved in the post-infarction inflammatory response. After MI, monocytes in the peripheral circulation are recruited and differentiated into macrophages, which are involved in the destruction of necrotic cardiomyocytes [55, 56]. In vitro, macrophages were induced to polarize into pro-inflammatory M1 subpopulations and inflammation-inhibiting M2 subpopulations [57]. AS is a common pathological mechanism in MI and CA. Studies have shown that macrophages are involved in the formation of AS by causing vascular inflammation [58, 59]. In our results, the expression of 16 common DEGs between MI and CA was higher in macrophages than in other cell populations, which is consistent with the findings that macrophages are involved in AS [60, 61].
Microglia is a type of macrophage unique to the CNS [62], involved in neuronal demyelination and regeneration in the CNS [63], and engulfs dying neurons to maintain brain homeostasis [64]. Similarly, microglia can differentiate into neurotoxic and neuroprotective states [65]. Activated microglia are involved in a variety of neurodegenerative and neuroinflammatory diseases, including AD [66]. In AD, amyloid-β degeneration and tau protein promote microglia activation to clear lesions, but a large number of lesions would leave the CNS in a long-term chronic inflammatory state [5]. The triggering receptor expressed on myeloid cell 2 (TREM2) is a transmembrane glycoprotein on microglia, a study has shown that soluble TREM2 (the cleavage product of TREM2, sTREM2) level is elevated in both cerebrospinal fluid and peripheral blood among patients with AD compared to normal [67]. Another study has shown that the expression of both microglia and peripheral monocytes can be regulated by PILRB and LRRK2 [68]. As two types of cells with similar origins, macrophages and microglia may have synergistic effects in the inflammatory response to both diseases. To explore the role of our key genes in regulating both cells, we conducted a follow-up study.
We screened for the possible hub gene regulator of G-protein signaling 1 (RGS1) by LASSO regression and PPI network. RGS1 is a member of the RGS family that functions by binding to G protein-coupled receptor/G protein complexes and is associated with various diseases such as atherosclerosis, depression, and schizophrenia [69]. Our results showed that the expression of RGS1 was upregulated in both MI and AD patients, especially in the patients’ macrophages and microglia. In a mouse model of arthritis, inhibition of RGS1 expression with short hairpin RNA (shRNA) inactivated the Toll-like receptors (TLR) signaling pathway which suppressed inflammatory responses and angiogenesis [70]. An animal experiment has shown that RGS1 can inhibit the chemotaxis of macrophages, making macrophages more likely to accumulate at sites of inflammation during chronic inflammation, thereby promoting atherosclerosis formation [71]. A study demonstrated that the expression of RGS1 was upregulated during macrophage M1 polarization [71], which was consistent with the results of our pseudotime analysis. In our study, RGS1 was enriched in the p53 pathway in MI patients. It has been shown that the p53 pathway may increase cardiac fibrosis in rats with MI [72], and p53 acetylation has also been proven to promote macrophage M1 polarization [73]. RGS1 was also found to be a possible marker of AD in the periphery in a previous study, but the exact mechanism is unclear [74]. The JAK-STAT pathway, enriched in AD patients in our study, was shown to be associated with neuroinflammation in AD [75] and overactivation of microglia [57]. Recent studies have identified this pathway as a potential therapeutic target for AD [76, 77]. Microglia as a type of leukocyte also express multiple chemokine receptors [78], which are G protein-coupled receptors. We suggest that RGS1 has a macrophage-like regulatory mechanism on microglia, which causes microglia to accumulate locally by desensitizing chemokine receptors, resulting in chronic neuroinflammation.
We found in the single-cell analysis of CA that the expression of RGS1 was also associated with B cells and T cells. Various subsets of B cells and T cells have been shown to have both promotional and inhibitory effects on atherosclerosis [79–81]. Regulatory T cells (Tregs) can inhibit inflammatory cytokine production after MI [82], whereas acute suppression of T cell infiltration after MI has also been shown to alleviate infarct wall thinning and improve cardiac function [83]. B1 cells secreting IgM inhibited lipid uptake by macrophages and release of inflammatory cytokines to limit inflammation [84]. While the transfer of B2 cells to B cells lacking ApoE -/- mice revealed a significant increase in atherosclerosis [81]. A study has shown an accelerated return of B cells to lymph nodes in RGS1-/- mice compared to wild-type B cells [85], resulting in less B cell retention at the site of inflammation. In contrast, high expression of RGS1 was found in intestinal T cells from patients with colitis [86]. All these findings may be related to the homing of lymphocytes which affected by RGS1 desensitization of chemokine receptors. However, an animal experiment [71] showed that the phenotypic regulation of T and B cells by RGS1 in atherosclerosis was not significant, and that B cells and T cells may not play a major role in inflammation after MI.
TFs are proteins that attach to specific genes and regulate the rate of transcription of genetic information [87]. According to the results, RGS1 was regulated by a total of 16 TFs. Referring to the motif enrichment analysis of 26 DEGs between MI and AD, RelA may be the most important TF in both diseases. RelA/p65, which is involved in constituting NF-κB [88], has been shown to be associated with AS by promoting the proliferation and migration of vascular smooth muscle cells [89]. Saikosaponin inhibits NF-κB-mediated inflammatory signaling pathways by reducing the mRNA transcriptional activity of RelA/p65 thereby reducing neuroinflammation [90]. RelA may be involved in the progression of MI and AD through the regulation of RGS1, but it needs more relevant research to explore the mechanism.
Our study identified RGS1 as a potential therapeutic target for MI and AD. The binding of RGS1 to G proteins accelerates the termination of cellular signaling and exacerbates disease by causing macrophages and microglia to aggregate. RGS1 inhibitors may be able to competitively bind RGS1 to ameliorate chronic inflammation in both diseases. A previous study on the structure of RGS1 and Gα proteins has made this idea feasible [91]. However, the selectivity of the inhibitor is dependent on specific cysteine residues [92] and dynamics [93] of the RGS protein, which remains a challenge.
There are still limitations in this study due to the lack of validation in clinical or animal studies. Future research will combine molecular biology and pathophysiology to validate the predicted potential key targets and pathways.
Conclusion
Our study shows that macrophages and microglia are involved in the inflammatory response in MI and AD, respectively. RGS1, which is regulated by RelA, may be an important target to intervene in this pathological process.
ACKNOWLEDGMENTS
The authors thank the researchers for sharing the data used in this study, and the participants included in the public dataset. The authors also thank the GEO datasets for providing the data.
FUNDING
This study was supported by grants from the National Natural Science Foundation of China [No. 82204987].
CONFLICT OF INTEREST
The authors have no conflict of interest to report.
DATA AVAILABILITY
The data used to support the findings of this study are included in the article and Supplementary Material.
SUPPLEMENTARY MATERIAL
[1] The supplementary material is available in the electronic version of this article: https://dx.doi.org/10.3233/JAD-230559.
REFERENCES
[1] | Roth GA , Mensah GA , Fuster V ((2020) ) The global burden of cardiovascular diseases and risks. J Am Coll Cardiol 76: , 2980–2981. |
[2] | Mackman N , Bergmeier W , Stouffer GA , Weitz JI ((2020) ) Therapeutic strategies for thrombosis: New targets and approaches. Nat Rev Drug Discov 19: , 333–352. |
[3] | Doenst T , Haverich A , Serruys P , Bonow RO , Kappetein P , Falk V , Velazquez E , Diegeler A , Sigusch H ((2019) ) PCI and CABG for treating stable coronary artery disease. J Am Coll Cardiol 73: , 964–976. |
[4] | Thygesen K , Alpert JS , Jaffe AS , Chaitman BR , Bax JJ , Morrow DA , White HD ((2018) ) Fourth universal definition of myocardial infarction. Circulation 138: , e618–e651. |
[5] | ((2022) ) 2022 Alzheimer’s disease facts and figures. Alzheimers Dement 18: , 700–789. |
[6] | Bondi MW , Edmonds EC , Salmon DP ((2017) ) Alzheimer’s disease: Past, present, and future. J Int Neuropsychol Soc 23: , 818–831. |
[7] | Villemagne VL , Burnham S , Bourgeat P , Brown B , Ellis KA , Salvado O , Szoeke C , Macaulay SL , Martins R , Maruff P , Ames D , Rowe CC , Masters CL ((2013) ) Amyloid β deposition, neurodegeneration, and cognitive decline in sporadic Alzheimer’s disease: A prospective cohort study. Lancet Neurol 12: , 357–367. |
[8] | Barthélemy NR , Li Y , Joseph-Mathurin N , Gordon BA , Hassenstab J , Benzinger TLS , Buckles V , Fagan AM , Perrin RJ , Goate AM , Morris JC , Karch CM , Xiong C , Allegri R , Mendez PC , Berman SB , Ikeuchi T , Mori H , Shimada H , Shoji M , Suzuki K , Noble J , Farlow M , Chhatwal J , Graff-Radford NR , Salloway S , Schofield PR , Masters CL , Martins RN , O Connor A , Fox NC , Levin J , Jucker M , Gabelle A , Lehmann S , Sato C , Bateman RJ , McDade E ((2020) ) A soluble phosphorylated tau signature links tau, amyloid and the evolution of stages of dominantly inherited Alzheimer’s disease. Nat Med 26: , 398–407. |
[9] | Mather M , Harley CW ((2016) ) The locus coeruleus: Essential for maintaining cognitive function and the aging brain. Trends Cogn Sci 20: , 214–226. |
[10] | Edmonds EC , Eppig J , Bondi MW , Leyden KM , Goodwin B , Delano-Wood L , McDonald CR ((2016) ) Heterogeneous cortical atrophy patterns in MCI not captured by conventional diagnostic criteria. Neurology 87: , 2108–2116. |
[11] | Hoenig MC , Bischof GN , Seemiller J , Hammes J , Kukolja J , Onur ÖA , Jessen F , Fliessbach K , Neumaier B , Fink GR , van Eimeren T , Drzezga A ((2018) ) Networks of tau distribution in Alzheimer’s disease. Brain 141: , 568–581. |
[12] | Maust DT , Kim HM , Seyfried LS , Chiang C , Kavanagh J , Schneider LS , Kales HC ((2015) ) Antipsychotics, other psychotropics, and the risk of death in patients with dementia. JAMA Psychiatry 72: , 438. |
[13] | Lin S , Chen C , Tsang H , Lee C , Yang P , Cheng K , Li D , Wang C , Hsieh Y , Yang W ((2014) ) Association between antipsychotic use and risk of acute myocardial infarction. Circulation 130: , 235–243. |
[14] | Doody RS , Raman R , Farlow M , Iwatsubo T , Vellas B , Joffe S , Kieburtz K , He F , Sun X , Thomas RG , Aisen PS , Siemers E , Sethuraman G , Mohs R ((2013) ) A phase 3 trial of semagacestat for treatment of Alzheimer’s disease. N Engl J Med 369: , 341–350. |
[15] | Forlenza OV , Radanovic M , Talib LL , Gattaz WF ((2019) ) Clinical and biological effects of long-term lithium treatment in older adults with amnestic mild cognitive impairment: Randomised clinical trial. Br J Psychiatry 215: , 668–674. |
[16] | Lacosta A , Pascual-Lucas M , Pesini P , Casabona D , Pérez-Grijalba V , Marcos-Campos I , Sarasa L , Canudas J , Badi H , Monleón I , San-José I , Munuera J , Rodríguez-Gómez O , Abdelnour C , Lafuente A , Buendía M , Boada M , Tárraga L , Ruiz A , Sarasa M ((2018) ) Safety, tolerability and immunogenicity of an active anti-Aβ40 vaccine (ABvac40) in patients with Alzheimer’s disease: A randomised, double-blind, placebo-controlled, phase I trial. Alzheimers Res Ther 10: , 12. |
[17] | Kocis P , Tolar M , Yu J , Sinko W , Ray S , Blennow K , Fillit H , Hey JA ((2017) ) Elucidating the Aβ42 anti-aggregation mechanism of action of tramiprosate in Alzheimer’s disease: Integrating molecular analytical methods, pharmacokinetic and clinical data. CNS Drugs 31: , 495–509. |
[18] | Tsai RM , Miller Z , Koestler M , Rojas JC , Ljubenkov PA , Rosen HJ , Rabinovici GD , Fagan AM , Cobigo Y , Brown JA , Jung JI , Hare E , Geldmacher DS , Natelson-Love M , McKinley EC , Luong PN , Chuu EL , Powers R , Mumford P , Wolf A , Wang P , Shamloo M , Miller BL , Roberson ED , Boxer AL ((2020) ) Reactions to multiple ascending doses of the microtubule stabilizer TPI-287 in patients with Alzheimer disease, progressive supranuclear palsy, and corticobasal syndrome. JAMA Neurol 77: , 215. |
[19] | Wilcock GK , Gauthier S , Frisoni GB , Jia J , Hardlund JH , Moebius HJ , Bentham P , Kook KA , Schelter BO , Wischik DJ , Davis CS , Staff RT , Vuksanovic V , Ahearn T , Bracoud L , Shamsi K , Marek K , Seibyl J , Riedel G , Storey JMD , Harrington CR , Wischik CM ((2017) ) Potential of low dose leuco-methylthioninium bis(hydromethanesulphonate) (LMTM) monotherapy for treatment of mild Alzheimer’s disease: Cohort analysis as modified primary outcome in a phase III clinical trial. J Alzheimers Dis 61: , 435–457. |
[20] | Dhillon S ((2021) ) Aducanumab: First approval. Drugs 81: , 1437–1443. |
[21] | Hoy SM ((2023) ) Lecanemab: First approval. Drugs 83: , 359–365. |
[22] | Villain N , Planche V , Levy R ((2022) ) High-clearance anti-amyloid immunotherapies in Alzheimer’s disease. Part 1: Meta-analysis and review of efficacy and safety data, and medico-economical aspects. Rev Neurol (Paris) 178: , 1011–1030. |
[23] | Goumans M , Ten Dijke P ((2018) ) TGF-β signaling in control of cardiovascular function. Cold Spring Harb Perspect Biol 10: , a022210. |
[24] | Hayes JD , Flanagan JU , Jowsey IR ((2005) ) Glutathione transferases. Annu Rev Pharmacol Toxicol 45: , 51–88. |
[25] | Iqbal K , Liu F , Gong C ((2016) ) Tau and neurodegenerative disease: The story so far. Nat Rev Neurol 12: , 15–27. |
[26] | Petrella C , Di Certo MG , Barbato C , Gabanella F , Ralli M , Greco A , Possenti R , Severini C ((2019) ) Neuropeptides in Alzheimer’s disease: An update. Curr Alzheimer Res 16: , 544–558. |
[27] | Benilova I , De Strooper B ((2013) ) Promiscuous Alzheimer’s amyloid: Yet another partner. Science 341: , 1354–1355. |
[28] | Li R ((2004) ) Tumor necrosis factor death receptor signaling cascade is required for amyloid-protein-induced neuron death. J Neurosci 24: , 1760–1771. |
[29] | Baufeld C , O Loughlin E , Calcagno N , Madore C , Butovsky O ((2018) ) Differential contribution of microglia and monocytes in neurodegenerative diseases. J Neural Transm 125: , 809–826. |
[30] | Brosseron F , Krauthausen M , Kummer M , Heneka MT ((2014) ) Body fluid cytokine levels in mild cognitive impairment and Alzheimer’s disease: A comparative overview. Mol Neurobiol 50: , 534–544. |
[31] | Wolters FJ , Segufa RA , Darweesh SKL , Bos D , Ikram MA , Sabayan B , Hofman A , Sedaghat S ((2018) ) Coronary heart disease, heart failure, and the risk of dementia: A systematic review and meta-analysis. Alzheimers Dement 14: , 1493–1504. |
[32] | Xie W , Zheng F , Yan L , Zhong B ((2019) ) Cognitive decline before and after incident coronary events. J Am Coll Cardiol 73: , 3041–3050. |
[33] | Guillen I , Blanes M , Gomez-Lechon MJ , Castell JV ((1995) ) Cytokine signaling during myocardial infarction: Sequential appearance of IL-1 beta and IL-6. Am J Physiol Regul Integr Comp Physiol 269: , R229–R235. |
[34] | Thackeray JT , Hupe HC , Wang Y , Bankstahl JP , Berding G , Ross TL , Bauersachs J , Wollert KC , Bengel FM ((2018) ) Myocardial inflammation predicts remodeling and neuroinflammation after myocardial infarction. J Am Coll Cardiol 71: , 263–275. |
[35] | Hemberg M ((2018) ) Single-cell genomics. Brief Funct Genomics 17: , 207–208. |
[36] | Muse ED , Kramer ER , Wang H , Barrett P , Parviz F , Novotny MA , Lasken RS , Jatkoe TA , Oliveira G , Peng H , Lu J , Connelly MC , Schilling K , Rao C , Torkamani A , Topol EJ ((2017) ) A whole blood molecular signature for acute myocardial infarction. Sci Rep 7: , 12268. |
[37] | Liang WS , Dunckley T , Beach TG , Grover A , Mastroeni D , Walker DG , Caselli RJ , Kukull WA , McKeel D , Morris JC , Hulette C , Schmechel D , Alexander GE , Reiman EM , Rogers J , Stephan DA ((2007) ) Gene expression profiles in anatomically and functionally distinct regions of the normal aged human brain. Physiol Genomics 28: , 311–322. |
[38] | Liang WS , Reiman EM , Valla J , Dunckley T , Beach TG , Grover A , Niedzielko TL , Schneider LE , Mastroeni D , Caselli R , Kukull W , Morris JC , Hulette CM , Schmechel D , Rogers J , Stephan DA ((2008) ) Alzheimer’s disease is associated with reduced expression of energy metabolism genes in posterior cingulate neurons. Proc Natl Acad Sci U S A 105: , 4441–4446. |
[39] | Readhead B , Haure-Mirande J , Funk CC , Richards MA , Shannon P , Haroutunian V , Sano M , Liang WS , Beckmann ND , Price ND , Reiman EM , Schadt EE , Ehrlich ME , Gandy S , Dudley JT ((2018) ) Multiscale analysis of independent alzheimer’s cohorts finds disruption of molecular, genetic, and clinical networks by human herpesvirus. Neuron 99: , 64–82.e7. |
[40] | Liang WS , Dunckley T , Beach TG , Grover A , Mastroeni D , Ramsey K , Caselli RJ , Kukull WA , McKeel D , Morris JC , Hulette CM , Schmechel D , Reiman EM , Rogers J , Stephan DA ((2008) ) Altered neuronal gene expression in brain regions differentially affected by Alzheimer’s disease: A reference data set. Physiol Genomics 33: , 240–256. |
[41] | Alsaigh T , Evans D , Frankel D , Torkamani A ((2022) ) Decoding the transcriptome of calcified atherosclerotic plaque at single-cell resolution. Commun Biol 5: , 1084. |
[42] | Lau S , Cao H , Fu AKY , Ip NY ((2020) ) Single-nucleus transcriptome analysis reveals dysregulation of angiogenic endothelial cells and neuroprotective glia in Alzheimer’s disease. Proc Natl Acad Sci U S A 117: , 25800–25809. |
[43] | Szklarczyk D , Morris JH , Cook H , Kuhn M , Wyder S , Simonovic M , Santos A , Doncheva NT , Roth A , Bork P , Jensen LJ , von Mering C ((2017) ) The STRING database in 2017: Quality-controlled protein-protein association networks, made broadly accessible. Nucleic Acids Res 45: , D362–D368. |
[44] | Shannon P , Markiel A , Ozier O , Baliga NS , Wang JT , Ramage D , Amin N , Schwikowski B , Ideker T ((2003) ) Cytoscape: A software environment for integrated models of biomolecular interaction networks. Genome Res 13: , 2498–2504. |
[45] | Stuart T , Butler A , Hoffman P , Hafemeister C , Papalexi E , Mauck WM , Hao Y , Stoeckius M , Smibert P , Satija R ((2019) ) Comprehensive integration of single-cell data. Cell 177: , 1888–1902.e21. |
[46] | Korsunsky I , Millard N , Fan J , Slowikowski K , Zhang F , Wei K , Baglaenko Y , Brenner M , Loh P , Raychaudhuri S ((2019) ) Fast, sensitive and accurate integration of single-cell data with Harmony. Nat Methods 16: , 1289–1296. |
[47] | Zhang X , Lan Y , Xu J , Quan F , Zhao E , Deng C , Luo T , Xu L , Liao G , Yan M , Ping Y , Li F , Shi A , Bai J , Zhao T , Li X , Xiao Y ((2019) ) CellMarker: A manually curated resource of cell markers in human and mouse. Nucleic Acids Res 47: , D721–D728. |
[48] | Hu C , Li T , Xu Y , Zhang X , Li F , Bai J , Chen J , Jiang W , Yang K , Ou Q , Li X , Wang P , Zhang Y ((2023) ) CellMarker 2.0: An updated database of manually curated cell markers in human/mouse and web tools based on scRNA-seq data. Nucleic Acids Res 51: , D870–D876. |
[49] | Zhou G , Soufan O , Ewald J , Hancock REW , Basu N , Xia J ((2019) ) NetworkAnalyst 3.0: A visual analytics platform for comprehensive gene expression profiling and meta-analysis. Nucleic Acids Res 47: , W234–W241. |
[50] | Milo R , Shen-Orr S , Itzkovitz S , Kashtan N , Chklovskii D , Alon U ((2002) ) Network motifs: Simple building blocks of complex networks. Science 298: , 824–7. |
[51] | Subramanian A , Tamayo P , Mootha VK , Mukherjee S , Ebert BL , Gillette MA , Paulovich A , Pomeroy SL , Golub TR , Lander ES , Mesirov JP ((2005) ) Gene set enrichment analysis: A knowledge-based approach for interpreting genome-wide expression profiles. Proc Natl Acad Sci U S A 102: , 15545–15550. |
[52] | Sundbøll J , Horváth-Puó E , Adelborg K , Schmidt M , Pedersen L , Bøtker HE , Henderson VW , Toft Sørensen H ((2018) ) Higher risk of vascular dementia in myocardial infarction survivors. Circulation 137: , 567–577. |
[53] | Brenowitz WD , Hubbard RA , Keene CD , Hawes SE , Longstreth WT , Woltjer RL , Kukull WA ((2017) ) Mixed neuropathologies and estimated rates of clinical progression in a large autopsy sample. Alzheimers Dement 13: , 654–662. |
[54] | Kapasi A , DeCarli C , Schneider JA ((2017) ) Impact of multiple pathologies on the threshold for clinically overt dementia. Acta Neuropathol 134: , 171–186. |
[55] | Peet C , Ivetic A , Bromage DI , Shah AM ((2020) ) Cardiac monocytes and macrophages after myocardial infarction. Cardiovasc Res 116: , 1101–1112. |
[56] | Dutta P , Nahrendorf M ((2015) ) Monocytes in myocardial infarction. Arterioscler Thromb Vasc Biol 35: , 1066–1070. |
[57] | Murray PJ , Allen JE , Biswas SK , Fisher EA , Gilroy DW , Goerdt S , Gordon S , Hamilton JA , Ivashkiv LB , Lawrence T , Locati M , Mantovani A , Martinez FO , Mege J , Mosser DM , Natoli G , Saeij JP , Schultze JL , Shirey KA , Sica A , Suttles J , Udalova I , van Ginderachter JA , Vogel SN , Wynn TA ((2014) ) Macrophage activation and polarization: Nomenclature and experimental guidelines. Immunity 41: , 14–20. |
[58] | Shao B , Han B , Zeng Y , Su D , Liu C ((2016) ) The roles of macrophage autophagy in atherosclerosis. Acta Pharmacol Sin 37: , 150–156. |
[59] | Aiello RJ , Bourassa PK , Lindsey S , Weng W , Natoli E , Rollins BJ , Milos PM ((1999) ) Monocyte chemoattrnt protein-1 accelerates atherosclerosis in Apolipoprotein E-deficient mice. Arterioscler Thromb Vasc Biol 19: , 1518–1525 acta. |
[60] | Tabas I , Bornfeldt KE ((2016) ) Macrophage phenotype and function in different stages of atherosclerosis. Circ Res 118: , 653–667. |
[61] | Groh L , Keating ST , Joosten LAB , Netea MG , Riksen NP ((2018) ) Monocyte and macrophage immunometabolism in atherosclerosis. Semin Immunopathol 40: , 203–214. |
[62] | van Furth R , Cohn ZA , Hirsch JG , Humphrey JH , Spector WG , Langevoort HL ((1972) ) The mononuclear phagocyte system: A new classification of macrophages, monocytes, and their precursor cells. Bull World Health Organ 46: , 845–52. |
[63] | Lloyd AF , Davies CL , Holloway RK , Labrak Y , Ireland G , Carradori D , Dillenburg A , Borger E , Soong D , Richardson JC , Kuhlmann T , Williams A , Pollard JW , des Rieux A , Priller J , Miron VE ((2019) ) Central nervous system regeneration is driven by microglia necroptosis and repopulation. Nat Neurosci 22: , 1046–1052. |
[64] | Takahashi K , Rochford CDP , Neumann H ((2005) ) Clearance of apoptotic neurons without inflammation by microglial triggering receptor expressed on myeloid cells-2. J Exp Med 201: , 647–657. |
[65] | Luo X , Chen S ((2012) ) The changing phenotype of microglia from homeostasis to disease. Transl Neurodegener 1: , 9. |
[66] | Liddelow SA , Guttenplan KA , Clarke LE , Bennett FC , Bohlen CJ , Schirmer L , Bennett ML , Münch AE , Chung W , Peterson TC , Wilton DK , Frouin A , Napier BA , Panicker N , Kumar M , Buckwalter MS , Rowitch DH , Dawson VL , Dawson TM , Stevens B , Barres BA ((2017) ) Neurotoxic reactive astrocytes are induced by activated microglia. Nature 541: , 481–487. |
[67] | Bekris LM , Khrestian M , Dyne E , Shao Y , Pillai JA , Rao SM , Bemiller SM , Lamb B , Fernandez HH , Leverenz JB ((2018) ) Soluble TREM2 and biomarkers of central and peripheral inflammation in neurodegenerative disease. J Neuroimmunol 319: , 19–27. |
[68] | Sun J , Hou Y , Zhang Y , Wang L , Liu L , Sun B , Yuan H ((2018) ) Genetic variants associated with neurodegenerative diseases regulate gene expression in immune cell CD14+ monocytes. Front Genet 9: , 666. |
[69] | Squires KE , Montañez-Miranda C , Pandya RR , Torres MP , Hepler JR ((2018) ) Genetic analysis of rare human variants of regulators of G protein signaling proteins and their role in human physiology and disease. Pharmacol Rev 70: , 446–474. |
[70] | Hu X , Tang J , Zeng G , Hu X , Bao P , Wu J , Liang Y , Deng W , Tang Y ((2019) ) RGS1 silencing inhibits the inflammatory response and angiogenesis in rheumatoid arthritis rats through the inactivation of Toll-like receptor signaling pathway. J Cell Physiol 234: , 20432–20442. |
[71] | Patel J , McNeill E , Douglas G , Hale AB , de Bono J , Lee R , Iqbal AJ , Regan-Komito D , Stylianou E , Greaves DR , Channon KM ((2015) ) RGS1 regulates myeloid cell accumulation in atherosclerosis and aortic aneurysm rupture through altered chemokine signalling. Nat Commun 6: , 6614. |
[72] | Gao L , Wang L , Liu Z , Jiang D , Wu S , Guo Y , Tao H , Sun M , You L , Qin S , Cheng X , Xie J , Chang G , Zhang D ((2020) ) TNAP inhibition attenuates cardiac fibrosis induced by myocardial infarction through deactivating TGF-β1/Smads and activating P53 signaling pathways. Cell Death Dis 11: , 44. |
[73] | Zhou Y , Que K , Zhang Z , Yi ZJ , Zhao PX , You Y , Gong J , Liu Z ((2018) ) Iron overloaded polarizes macrophage to proinflammation phenotype through ROS/acetyl-p53 pathway. Cancer Med 7: , 4012–4022. |
[74] | Leandro GS , Evangelista AF , Lobo RR , Xavier DJ , Moriguti JC , Sakamoto-Hojo ET ((2018) ) Changes in expression profiles revealed by transcriptomic analysis in peripheral blood mononuclear cells of Alzheimer’s disease patients. J Alzheimers Dis 66: , 1483–1495. |
[75] | Nevado-Holgado AJ , Ribe E , Thei L , Furlong L , Mayer M , Quan J , Richardson JC , Cavanagh J , Lovestone S ((2019) ) Genetic and real-world clinical data, combined with empirical validation, nominate Jak-Stat signaling as a target for Alzheimer’s disease therapeutic development. Cells 8: , 425. |
[76] | Rusek M , Smith J , El-Khatib K , Aikins K , Czuczwar SJ , Pluta R ((2023) ) The role of the JAK/STAT signaling pathway in the pathogenesis of Alzheimer’s disease: New potential treatment target. Int J Mol Sci 24: , 864. |
[77] | Varma VR , Desai RJ , Navakkode S , Wong L , Anerillas C , Loeffler T , Schilcher I , Mahesri M , Chin K , Horton DB , Kim SC , Gerhard T , Segal JB , Schneeweiss S , Gorospe M , Sajikumar S , Thambisetty M ((2023) ) Hydroxychloroquine lowers Alzheimer’s disease and related dementias risk and rescues molecular phenotypes related to Alzheimer’s disease. Mol Psychiatry 28: , 1312–1326. |
[78] | Balashov KE , Rottman JB , Weiner HL , Hancock WW ((1999) ) CCR5(+) and CXCR3(+) T cells are increased in multiple sclerosis and their ligands MIP-1alpha and IP-10 are expressed in demyelinating brain lesions. Proc Natl Acad Sci U S A 96: , 6873–6878. |
[79] | Caligiuri G , Nicoletti A , Poirier B , Hansson GK ((2002) ) Protective immunity against atherosclerosis carried by B cells of hypercholesterolemic mice. J Clin Invest 109: , 745–753. |
[80] | Major AS , Fazio S , Linton MF ((2002) ) B-lymphocyte deficiency increases atherosclerosis in LDL receptor–null mice. Arterioscler Thromb Vasc Biol 22: , 1892–1898. |
[81] | Kyaw T , Tay C , Khan A , Dumouchel V , Cao A , To K , Kehry M , Dunn R , Agrotis A , Tipping P , Bobik A , Toh B ((2010) ) Conventional B2 B cell depletion ameliorates whereas its adoptive transfer aggravates atherosclerosis. J Immunol 185: , 4410–4419. |
[82] | Zhuang R , Meng Q , Ma X , Shi S , Gong S , Liu J , Li M , Gu W , Li D , Zhang X , Wang Z , Ge X , Tang J , Lin F , Liang X , Zheng L , Liu Z , Zhou X ((2022) ) CD4+FoxP3+CD73+ regulatory T cell promotes cardiac healing post-myocardial infarction. Theranostics 12: , 2707–2721. |
[83] | Houssari M , Dumesnil A , Tardif V , Kivelä R , Pizzinat N , Boukhalfa I , Godefroy D , Schapman D , Hemanthakumar KA , Bizou M , Henry J , Renet S , Riou G , Rondeaux J , Anouar Y , Adriouch S , Fraineau S , Alitalo K , Richard V , Mulder P , Brakenhielm E ((2020) ) Lymphatic and immune cell cross-talk regulates cardiac recovery after experimental myocardial infarction. Arterioscler Thromb Vasc Biol 40: , 1722–1737. |
[84] | Upadhye A , Sturek JM , McNamara CA ((2020) ) 2019 Russell Ross Memorial Lecture in Vascular Biology. Arterioscler Thromb Vasc Biol 40: , 309–322. |
[85] | Han S , Moratz C , Huang N , Kelsall B , Cho H , Shi C , Schwartz O , Kehrl JH ((2005) ) Rgs1 and Gnai2 regulate the entrance of B lymphocytes into lymph nodes and B cell motility within lymph node follicles. Immunity 22: , 343–354. |
[86] | Gibbons DL , Abeler-Dörner L , Raine T , Hwang I , Jandke A , Wencker M , Deban L , Rudd CE , Irving PM , Kehrl JH , Hayday AC ((2011) ) Cutting edge: Regulator of G protein signaling-1 selectively regulates gut T cell trafficking and colitic potential. J Immunol 187: , 2067–2071. |
[87] | Lambert SA , Jolma A , Campitelli LF , Das PK , Yin Y , Albu M , Chen X , Taipale J , Hughes TR , Weirauch MT ((2018) ) The human transcription factors. Cell 172: , 650–665. |
[88] | Korc M ((2016) ) RelA: A tale of a stitch in time. J Clin Invest 126: , 2799–2801. |
[89] | Wang J , Hu X , Hu X , Gao F , Li M , Cui Y , Wei X , Qin Y , Zhang C , Zhao Y , Gao Y ((2021) ) MicroRNA-520c-3p targeting of RelA/p65 suppresses atherosclerotic plaque formation. Int J Biochem Cell Biol 131: , 105873. |
[90] | Park WH , Kang S , Piao Y , Pak CJ , Oh MS , Kim J , Kang MS , Pak YK ((2015) ) Ethanol extract of Bupleurum falcatum and saikosaponins inhibit neuroinflammation via inhibition of NF-κB. J Ethnopharmacol 174: , 37–44. |
[91] | Soundararajan M , Willard FS , Kimple AJ , Turnbull AP , Ball LJ , Schoch GA , Gileadi C , Fedorov OY , Dowler EF , Higman VA , Hutsell SQ , Sundström M , Doyle DA , Siderovski DP ((2008) ) Structural diversity in the RGS domain and its interaction with heterotrimeric G protein α-subunits. Proc Natl Acad Sci U S A 105: , 6457–6462. |
[92] | Blazer LL , Zhang H , Casey EM , Husbands SM , Neubig RR ((2011) ) A nanomolar-potency small molecule inhibitor of regulator of G-protein signaling proteins. Biochemistry 50: , 3181–3192. |
[93] | Mohammadi M , Mohammadiarani H , Shaw VS , Neubig RR , Vashisth H ((2019) ) Interplay of cysteine exposure and global protein dynamics in small-molecule recognition by a regulator of G-protein signaling protein. Proteins 87: , 146–156. |


