
Reconceptualization of the Erlangen Score for the Assessment of Dementia Risk: The ERlangen Score
Abstract
Background:
The established Erlangen Score (ES) for the interpretation of cerebrospinal fluid (CSF) biomarkers in the diagnostics of Alzheimer’s disease (AD) uses markers of amyloidopathy and tauopathy, equally weighted to form an easy-interpretable ordinal scale. However, these biomarkers are not equally predictive for AD.
Objective:
The higher weighting of the Aβ42/Aβ40 ratio, as a reconceptualized ERlangen Score (ERS), was tested for advantages in diagnostic performance.
Methods:
Non-demented subjects (N = 154) with a mean follow up of 5 years were assigned to a group ranging from 0 to 4 in ES or ERS. Psychometric trajectories and dementia risk were assessed.
Results:
The distribution of subjects between ES and ERS among the groups differed considerably, as grouping allocated 32 subjects to ES group 2, but only 2 to ERS group 2. The discriminative accuracy between the ES (AUC 73.2%, 95% CI [64.2, 82.2]) and ERS (AUC 72.0%, 95% CI [63.1, 81.0]) for dementia risk showed no significant difference. Without consideration of the Aβ42/Aβ40 ratio in ES grouping, the optimal cut-off of the ES shifted to ≥2.
Conclusions:
The ERS showed advantages over the ES in test interpretation with comparable overall test performance, as fewer cases were allocated to the intermediate risk group. The established cut-off of ≥2 can be maintained for the ERS, whereas it must be adjusted for the ES when determining the Aβ42/Aβ40 ratio.
INTRODUCTION
A biological definition of Alzheimer’s disease (AD) with surrogate markers for amyloid plaques and neurofibrillary tangles has been proposed to detect and treat early-stage AD [1–7]. These surrogate markers, such as decreased amyloid-β (Aβ) 42, decreased ratio of Aβ42 to Aβ40 (Aβ42/Aβ40), or elevated tau with phosphorylated threonine at position 181 (pTau) in cerebrospinal fluid (CSF) are changed years before the onset of cognitive deficits [8,9]. Therefore, a biological definition could allow therapy at the stages of subjective (SCI) or mild cognitive impairment (MCI) [10].
A disadvantage of a biological definition with different variables is the resulting number of possible combinations in which the parameters are not congruently changed. Especially in the case of the widespread AT(N) classification with its nominal scale [11], this results in combinations whose clinical significance and relation to AD are difficult to interpret. The Erlangen Score (ES) [12–14], which was established before the AT(N) classification, has the advantage of an ordinal scale, so that higher scores in non-demented individuals are associated with a higher risk of AD and dementia onset, respectively. The Erlangen Score is a sum score of two categories, amyloidopathy (lowered Aβ42 or Aβ42/Aβ40) and tauopathy (increased total tau (tTau) or pTau), with three characteristics: normal (0), borderline pathological (1), and definitive pathological (2). The resulting scale from ES 0 to 4 provides the clinician with an easily interpretable and well-established prediction of the patient’s risk of progression to dementia [12–17]. However, for the test interpretation, the scores 2 and 3 of the ES are combined into a category indicating intermediate risk for the presence of AD, which complicates the decision-making compared with a binary outcome. Furthermore, since the introduction of the ES, it has become increasingly apparent that the variables are not equally indicative of the risk of AD. Individuals with increased pTau and tTau without amyloidopathy have a significantly lower risk of developing dementia than individuals with positive surrogate markers for amyloidopathy [18, 19]. This biomarker constellation has been described as suspected non-Alzheimer pathology (SNAP), since the association to AD is unclear. In cohorts of cognitively healthy individuals or with MCI, the proportion of SNAP is nearly a quarter [20]. Consequently, the presence of amyloidopathy appears to be central to the presence of AD, but Aβ42, in contrast to the Aβ42/Aβ40 ratio as a surrogate marker for amyloidopathy is also decreased in other neurodegenerative diseases, like Lewy body dementia, frontotemporal dementia or idiopathic intracranial hypertension [21–23]. Furthermore, the Aβ42/Aβ40 ratio seemed to be changed sooner than the Aβ42 level in AD [24]. Unfortunately, the Aβ42/Aβ40 ratio was not routinely determined in several large cohorts, such as Alzheimer’s Disease Neuroimaging Initiative (ADNI), and is not yet part of all diagnostic standards and recommendations.
The requirement for a revision of the Erlangen score should accordingly take into account (I) that an unambiguous statement regarding the risk of dementia can be made for as many individuals as possible, (II) that individuals with SNAP have a lower risk of dementia, and (III) that the Aβ42/Aβ40 ratio is superior to the Aβ42 level in terms of sensitivity and specificity. Furthermore, the possibility of determining the risk of dementia in cohorts in which the Aβ42/Aβ40 ratio has not been determined should be retained (IV). Therefore, we propose to consider the Aβ42/Aβ40 ratio in a second step to the established Erlangen Score and to increase or decrease it by one point accordingly, provided that the value 0 is not undercut and the value 4 is not exceeded. This study compares the psychometric trajectories and dementia risk of the established score with those of the revised version to determine whether the concept version performs better.
MATERIALS AND METHODS
Study population
Individuals were enrolled at the memory department of the clinic for psychiatry and psychotherapy of the Friedrich-Alexander-University Erlangen-Nuremberg from April 2010 to April 2022. Participants were required to have a complete CSF examination available for Aβ42, the Aβ42/Aβ40 ratio, pTau181, and tTau, a structural brain scan and a neuropsychological assessment within 6 months. Only participants with SCI or MCI and at least one follow-up visit more than 12 months from baseline were included. The inclusion criteria were described in detail by Oberstein et al. [25]. The follow-up period was 12 to 145 months. The study protocol Nr. 3987 was approved by the clinical ethics committee of the University of Erlangen-Nuremberg. The patients/participants provided their written informed consent to participate in this study.
Neuropsychological assessment
All participants of the Erlangen cohort were assessed using the German version of the Consortium to Establish a Registry for Alzheimer’s Disease neuropsychological battery plus (CERAD-NB+) [26]. The rate of missing tests varied between 10.2% for Mini-Mental Status Examination (MMSE) and 33.6% for phonemic fluency. A total of 643 examinations was available from 152 subjects.
CSF ELISA
The concentrations of Aβ40 and Aβ42 in CSF were determined with commercially available ELISAs from IBL International (Hamburg, Germany) and Fujirebio Europe (formerly Innogenetics, Ghent, Belgium), respectively. The Aβ ELISAs used only detect Aβ starting at Asp1, i.e., Aβ1 - 42 and Aβ1 - 40, respectively. The abbreviations Aβ42 and Aβ42/Aβ40 ratio used in this manuscript therefore refer to the respective Aβ 1-x peptide variants until further notice. Total tau and pTau181 in CSF were measured with ELISAs from Fujirebio Europe. The calculation and values of the cut-offs and borderline zones are given elsewhere [12, 25].
Erlangen score
The Erlangen Score was formed using the criteria described by Lewzuk et al. [7, 12]. Values for amyloidopathy (decreased Aβ42 or Aβ42/Aβ40 ratio) and tauopathy (increased pTau181 or tTau) are classified as normal (0), borderline (1), or definitely pathological (2). Classification is based on the cut-off values of the respective laboratory, with borderline values defined as a result within 10% of the threshold value (i.e., 10% decrease in Aβ42 and/or Aβ42/40 or 10% increase in tTau and/or pTau181). If Aβ42 and the Aβ42/Aβ40 ratio are assigned different values, only the higher value is used for the amyloidopathy assessment. The same applies to pTau181 and tTau in the tauopathy score. The values for amyloidopathy and tauopathy are added to give a total score, which accordingly ranges from 0 to 4. An ES of 0 indicates “no neurochemical evidence for AD”, an ES of 1 means “neurochemically unlikely AD”. ES 2 and ES 3 are interpreted as “neurochemically possible AD”, an ES 4 as “neurochemically probable AD”. For the revision of the Erlangen score, the Aβ42/Aβ40 ratio was not taken into account in the first step and the value was formed as before, i.e., using only the Aβ42 level, neglecting the Aβ42/Aβ40 ratio. In the second step, the Aβ42/Aβ40 ratio was evaluated as normal (–1) or pathological (1) and added to the result, provided that the value did not fall below 0 and did not exceed 4. In these cases, the values 0 and 4, respectively, were retained.
Statistics
Linear mixed-effect models (LMEM) were calculated for both the ES and the ERS for group 1 to 4 with group 0 as reference to assess whether the change in individual CERAD-NB+subtest scores differed between the groups. For the mixed-effects modelling, observations were at the bottom level (level one) while they were nested within the level two variable patient. Fixed effects were the ES and ERS groups, respectively, time from baseline in years, and the interaction term between time from baseline and ES and ERS groups, respectively. The models were specified with a random intercept, i.e., subject identification number, and slope, i.e., time from baseline in years. The CERAD-NB+sub scores (MMSE, Word List Memory, Word List Delayed Recall, Constructional Praxis Recall, Phonematic verbal fluency) were used as dependent variables.
To assess the effect of the different Erlangen scores on the risk of progression to dementia, Cox proportional hazard analyses were performed, corrected for MMSE and age at baseline, sex, and years of education. Survival was defined as the interval between enrolment and progression to dementia, which was defined as an MMSE below 25 and the impairment of daily life activities. The proportional hazards assumption was assessed using Schoenfeld residuals.
To assess the predictive validity of ES or ERS scores, receiver operating characteristic (ROC) curves including area under the curve (AUC) analysis were determined with conversion to dementia as a positive condition. The nonparametric method of DeLong et al. was used to compare the AUC in a paired samples scenario [26]. The Youden’s index was used in conjunction with the ROC analysis to determine an optimal threshold value of the ES or ERS in terms of a dichotomous classification between low and high dementia risk.
Missing data were replaced by multiple imputation, as implemented in SPSS. Otherwise, missing data were handled using the maximum likelihood estimation of Cox proportional hazard models and LMEM.
Statistics was performed using SPSS (version 28.0; SPSS, Chicago, IL, USA). We used the TRIPOD checklist when writing our report [27].
RESULTS
152 non-demented subjects from the Erlangen memory clinic were included in this study. A flowchart of the study participants is shown in Supplementary Figure 1.
Participants' baseline characteristics
The study’s population comprised 58 females (38.2 %) and 94 males (61.8 %) with a mean age at baseline of 66.0±9.7 years. The median MMSE at baseline was 28 with an interquartile range (IQR) of 3. The frequencies and baseline demographics for each ES and ERS group respectively are shown in Table 1. Compared with the ES, the ERS had substantially fewer individuals classified as category 2 (Table 1 and Fig. 1). The change in algorithm from ES to ERS also resulted in more subjects being assigned to group 3 than to group 4, which was mainly due to the different evaluation of subjects with a pathological change in the Aβ42/Aβ40 ratio but normal Aβ42 levels (n = 35). Age and MMSE at baseline differed significantly between the groups in both the ES and the ERS (Table 1). The years of education differed only between the ES groups (Table 1).
Table 1
Study population characteristics
| 0 | 1 | 2 | 3 | 4 | ||||||||||||||||||||
| ES | ERS | ES | ERS | ES | ERS | ES | ERS | ES | ERS | ES | ERS | |||||||||||||
| n (female) | 55 (22) | 65 (26) | 9 (4) | 29 (6) | 32 (7) | 2 (1) | 10 (2) | 37 (17) | 46 (23) | 19 (8) | χ2 (4) = 7.956 | p = 0.093 | χ2 (4) = 5.039 | p = 0.0283 | ||||||||||
| M | SD | M | SD | M | SD | M | SD | M | SD | M | SD | M | SD | M | SD | M | SD | M | SD | |||||
| Age [y] | 61 | 8 | 61 | 8 | 61 | 9 | 66 | 9 | 67 | 9 | 73 | 11 | 64 | 8 | 71 | 8 | 72 | 8 | 71 | 10 | F (147,4) = 11.714 | p < 0.001 | F (147,4) = 11.714 | p < 0.001 |
| Education [y] | 14 | 3 | 14 | 3 | 14 | 3 | 15 | 3 | 15 | 3 | 14 | 2 | 16 | 3 | 14 | 4 | 13 | 3 | 14 | 4 | F (147,4) = 2.749 | p = 0.031 | F (147,4) = 0.626 | p = 0.645 |
| Md | IQR | Md | IQR | Md | IQR | Md | IQR | Md | IQR | Md | IQR | Md | IQR | Md | IQR | Md | IQR | Md | IQR | |||||
| MMSE | 28 | 2 | 28 | 2 | 28 | 2 | 28 | 3 | 27.5 | 3 | 27 | 28 | 1.75 | 28 | 2 | 27 | 2.25 | 27 | 2.25 | H = 34.901, df = 4 | p = 0.032 | H = 10.206, df = 4 | p = 0.037 | |
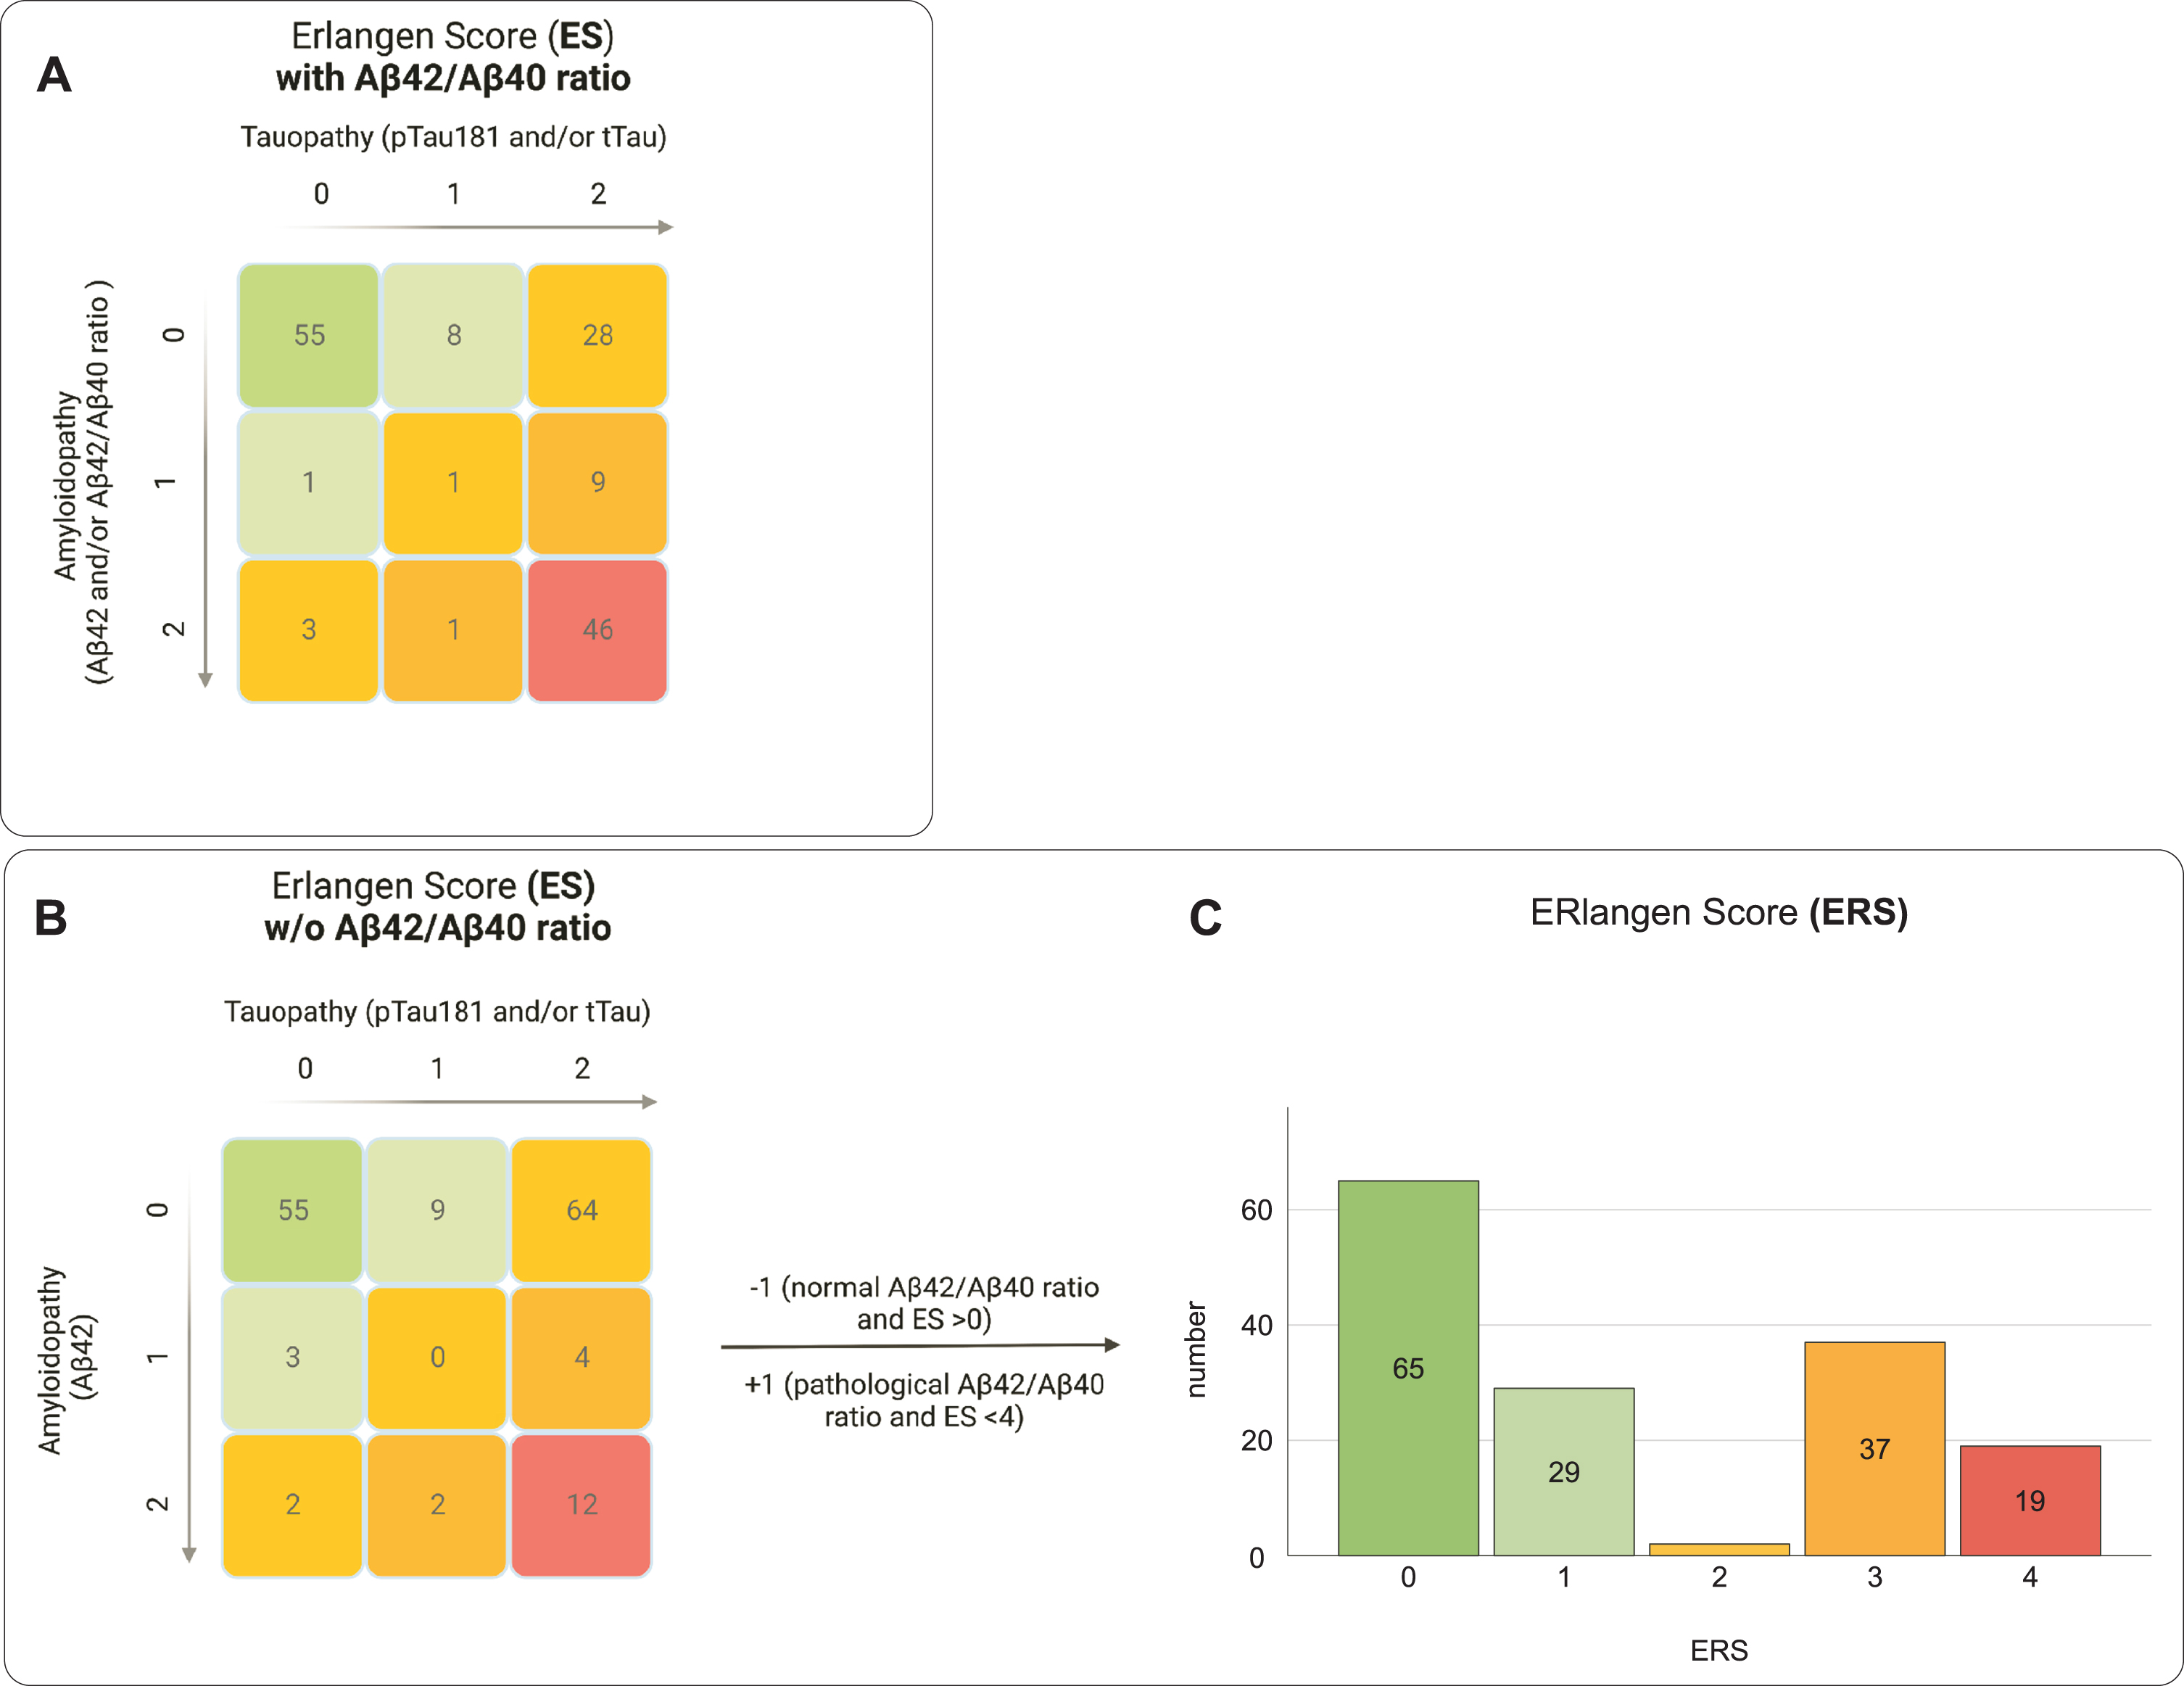
Fig. 1
Comparison of the grouping of the study population using the established Erlangen Score (ES) and the reconceptualized ERlangen Score (ERS). The ES was calculated with (A) and without (B) consideration of the Aβ42/Aβ40 ratio. The ERS was calculated in two steps. In step 1, the score is calculated as in the ES, but without considering the Aβ42/Aβ40 ratio, i.e., as in Fig. 1B. In the second step, in case of a pathological or normal Aβ42/Aβ40 ratio, +1 or –1 is added, provided the value is not below 0 or exceeds 4. By changing the weighting of the Aβ42/Aβ40 ratio in the ERS, substantially fewer participants were assigned to the intermediary risk group (yellow group) compared to the ES. The score of the ES can be derived by summing values for amyloidopathy and tauopathy (0 = normal, 1 = borderline pathological, 2 = definitive pathological). Colors indicate assumed dementia risk: low (green), mild (light green), intermediate (yellow), increased (orange) or probable (red).
In pairwise comparisons for the ES groups, group 3 was significantly older than group 0, p < 0.001, MDiff = 11.101, 95% CI [6.24, 15.96], and group 1, p < 0.001, MDiff = 11.171, 95% CI [2.31, 20.03]. In pairwise comparisons for the ERS groups, both group 3 and group 4 were significantly older compared to group 0, p < 0.001, MDiff = 10.058, 95% CI [3.56, 16.56] and p < 0.001, MDiff = 9.314, 95% CI [4.18, 14.45]. In both the ES and the ERS, group 4 performed significantly worse in MMSE in comparison to group 0, z = 3.449, p = 0.006 and z = 2.891, p = 0.038. All other Bonferroni-adjusted post-hoc analyses revealed no significant differences between the groups of the ES and the ERS scores, respectively.
Psychometric trajectories of the different ES and ERS groups
For both the ES and the ERS, the cross-sectional and longitudinal associations of each group with selected items of the CERAD-NB+, i.e., MMSE, Word List Memory, Word List Delayed Recall, Constructional Praxis Recall, and Phonematic Verbal Fluency Test were examined using LMEM with group 0 as the reference group (Fig. 2).
Fig. 2
Cognitive trajectories by Erlangen Score (ES) and ERlangen Score (ERS). For all CERAD-NB+subtests shown, the z-score was used for the linear mixed-effects model analyses of the ES (left) and the ERS (right). The cognitive trajectories are not shown for ERS group 2 because it included only two individuals. Exact p-values and 95% confidence interval are given in Supplementary Table 1. MMSE, z-score of the Mini-Mental State Examination; σ, standard deviation.
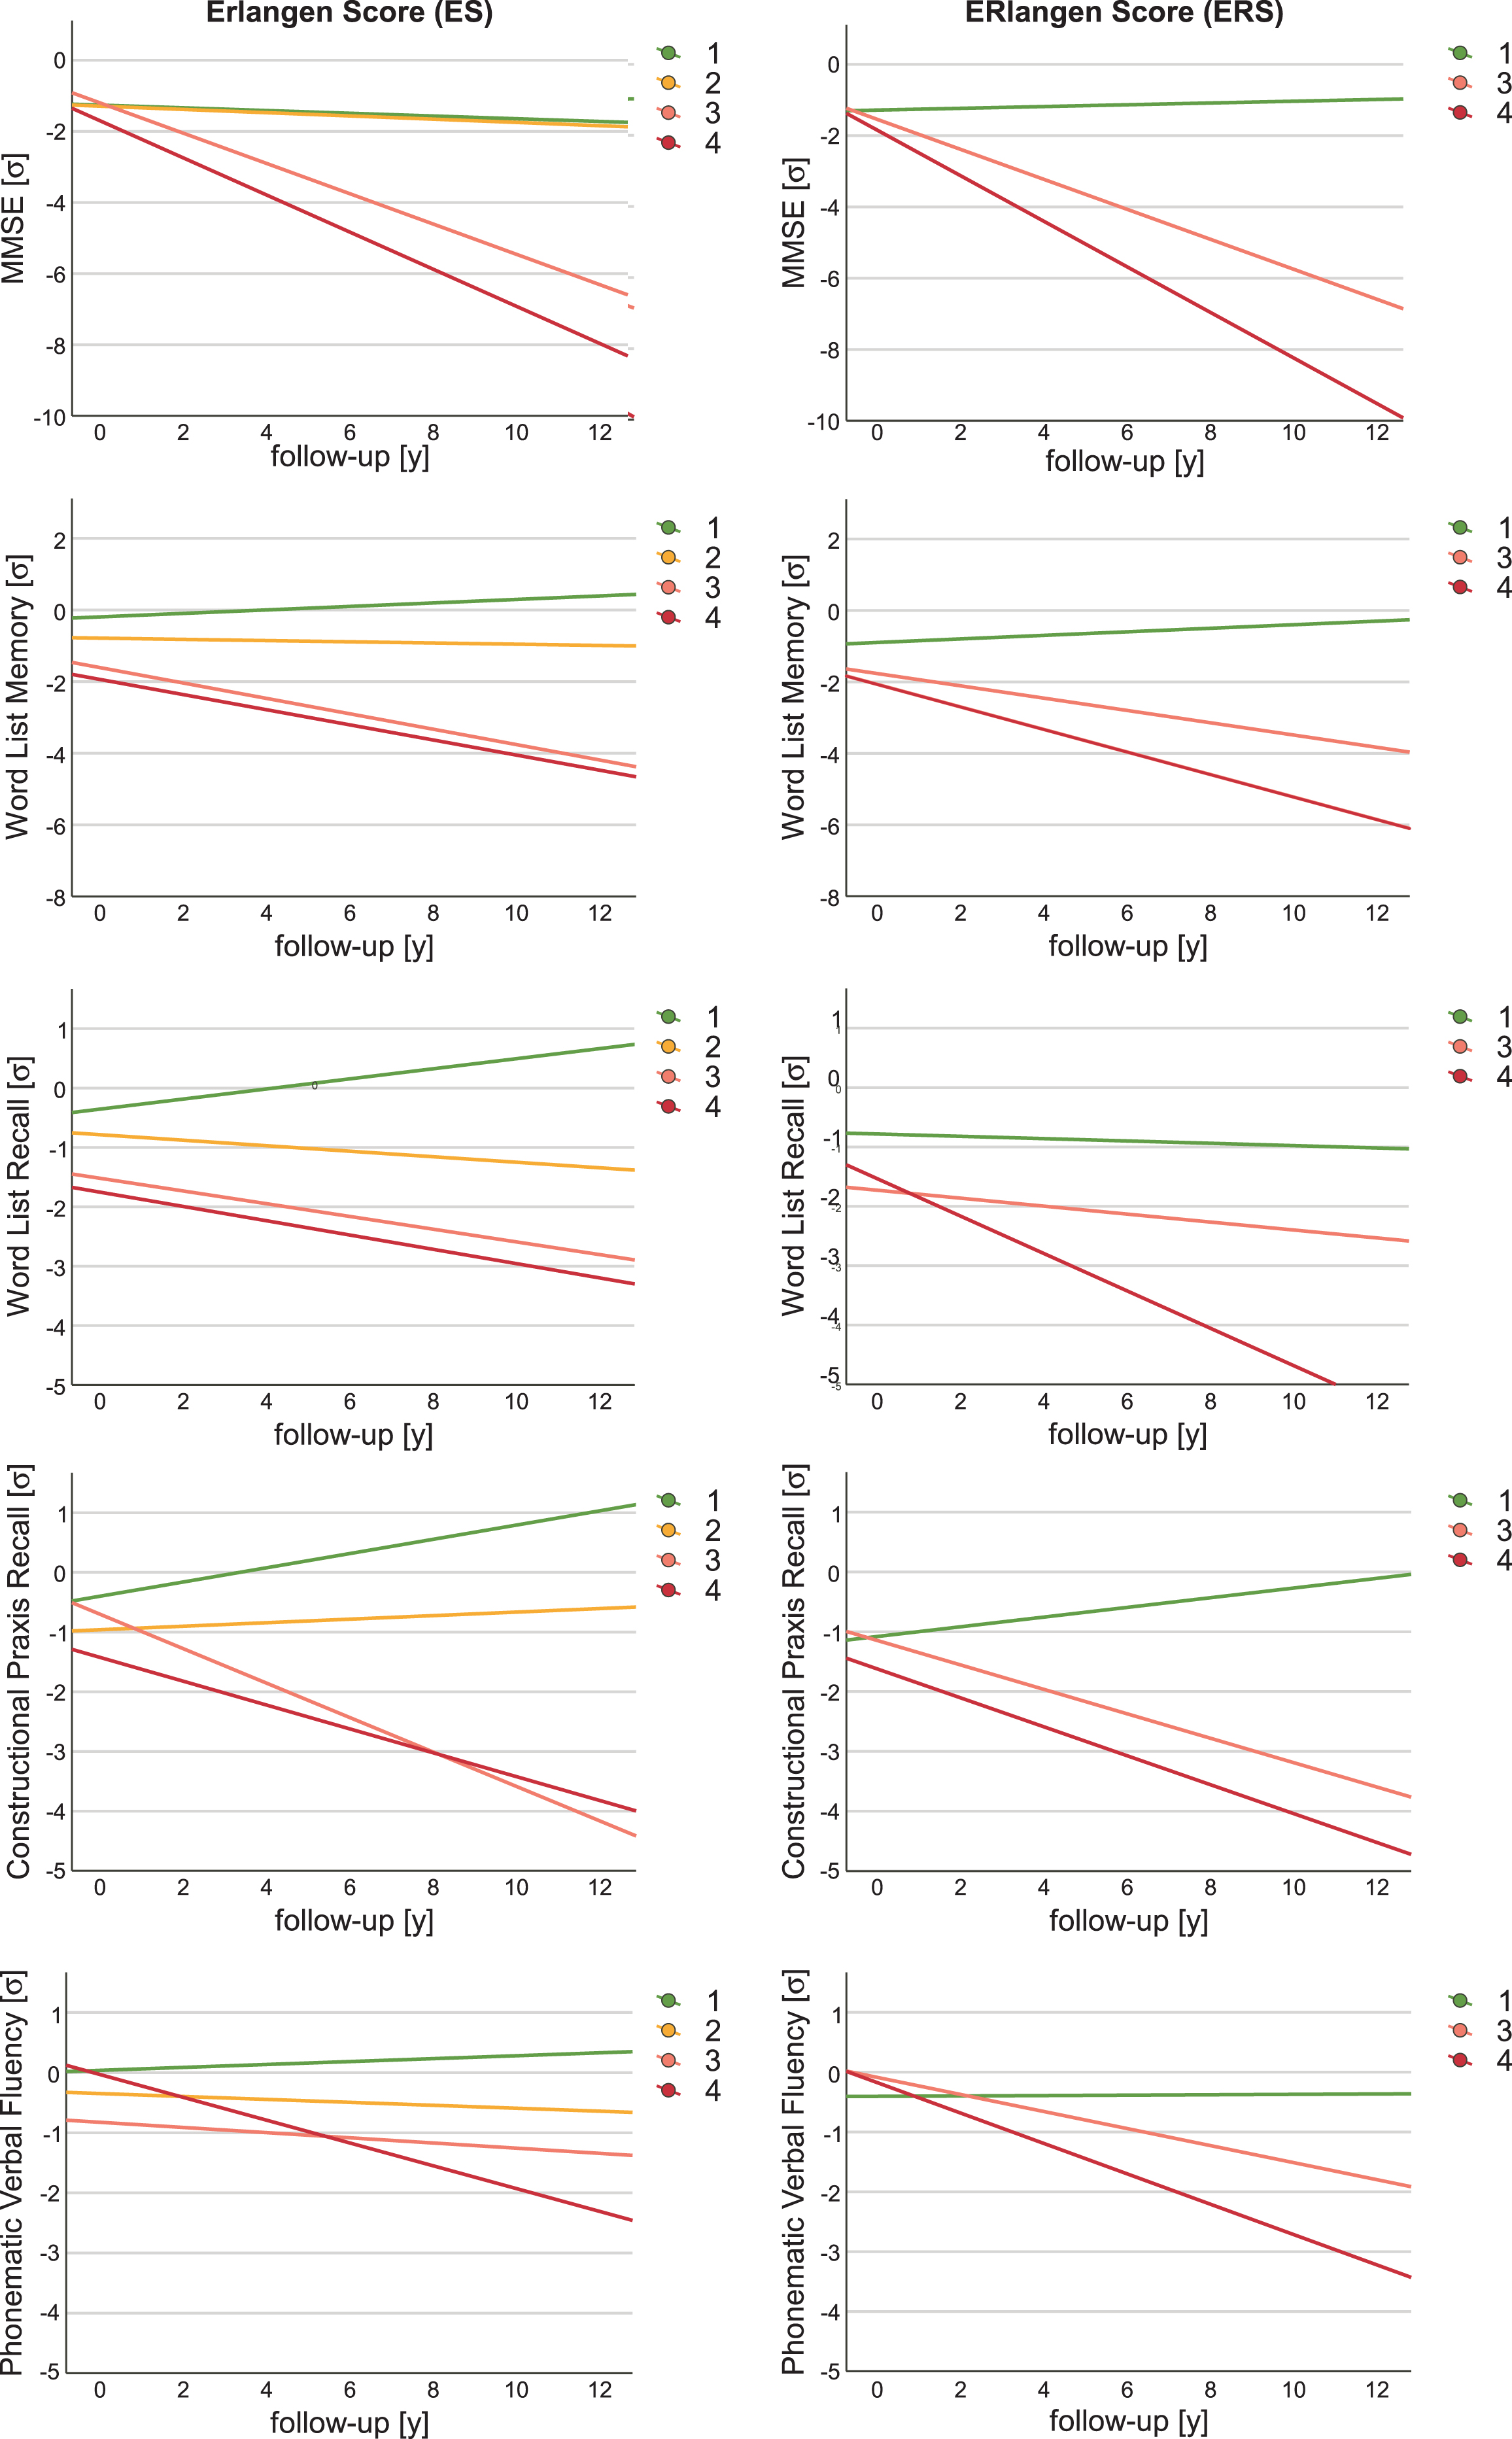
The trajectories of MMSE and Word List Memory in both ES and ERS group 4 were significantly worse than in the respective biomarker-negative control group. Moreover, when considering the ES group 4, the trajectories of Phonematic Verbal Fluency Test were significantly worse, and for the ERS group 4, additionally those of the Word List Delayed Recall. The longitudinal trajectories of MMSE also indicated significantly poorer outcome in both ES and ERS for group 3 compared to the control group. In addition, the ERS group 3 showed significantly worse trajectories in Constructional Praxis Delayed Recall and Phonematic Verbal Fluency Test. The different allocation of individuals to ERS compared to ES also resulted in all trajectories of the examined psychometric tests being more negative in group 4, i.e., the group with all altered biomarkers, than in group 3, which consisted mainly of patients with a pathological Aβ42/Aβ40 ratio and pTau or tTau but normal Aβ42, but without reaching statistical significance. There were only two individuals in the ERS group 2, both of whom had worsened trajectories of MMSE, MDiff = –1.066, 95% CI [–1.556, –0.557], Word List Memory, MDiff = –0.913, 95% CI [–2.790, –0.243], and Constructional Praxis Recall, MDiff = –0.696, 95% CI [–1.370, –0.022]. The results for ES group 2, which included 32 subjects, indicated no significant difference between the CERAD-NB + subtest at baseline and their trajectories compared with group 0. A complete list of all LMEM results for the CERAD-NB+subtests is shown in Supplementary Table 1. In addition, an LMEM analysis was also performed for the ES without considering the Aβ42/Aβ40 ratio (Supplementary Table 2).
Dementia risk of the different ES and ERS groups
The risk of dementia in groups 0 to 4 was examined in a preliminary analysis using Kaplan Meyer curves and compared between each group of both ES and ERS scores by univariate and multivariate Cox regression models with the covariates age, sex, education, and MMSE at baseline (Fig. 3).
Fig. 3
Comparison of dementia risk between the Erlangen Score (ES) and the reconceptualized ERlangen Score (ERS). Kaplan-Meier curves show the risk of dementia onset in nondemented individuals by ES (A) and ERS groups (B). Nondemented individuals with an ES of 1 or 2 showed no increased risk of dementia onset compared with controls. For both ES and ERS, dementia risk was increased in groups 3 and 4. This was confirmed when comparing hazard ratios for the occurrence of dementia between groups 1 to 4 versus the control group in a univariate and a multivariate Cox regression model with age, education and MMSE at baseline as covariates for the ES (C) and the ERS (D).
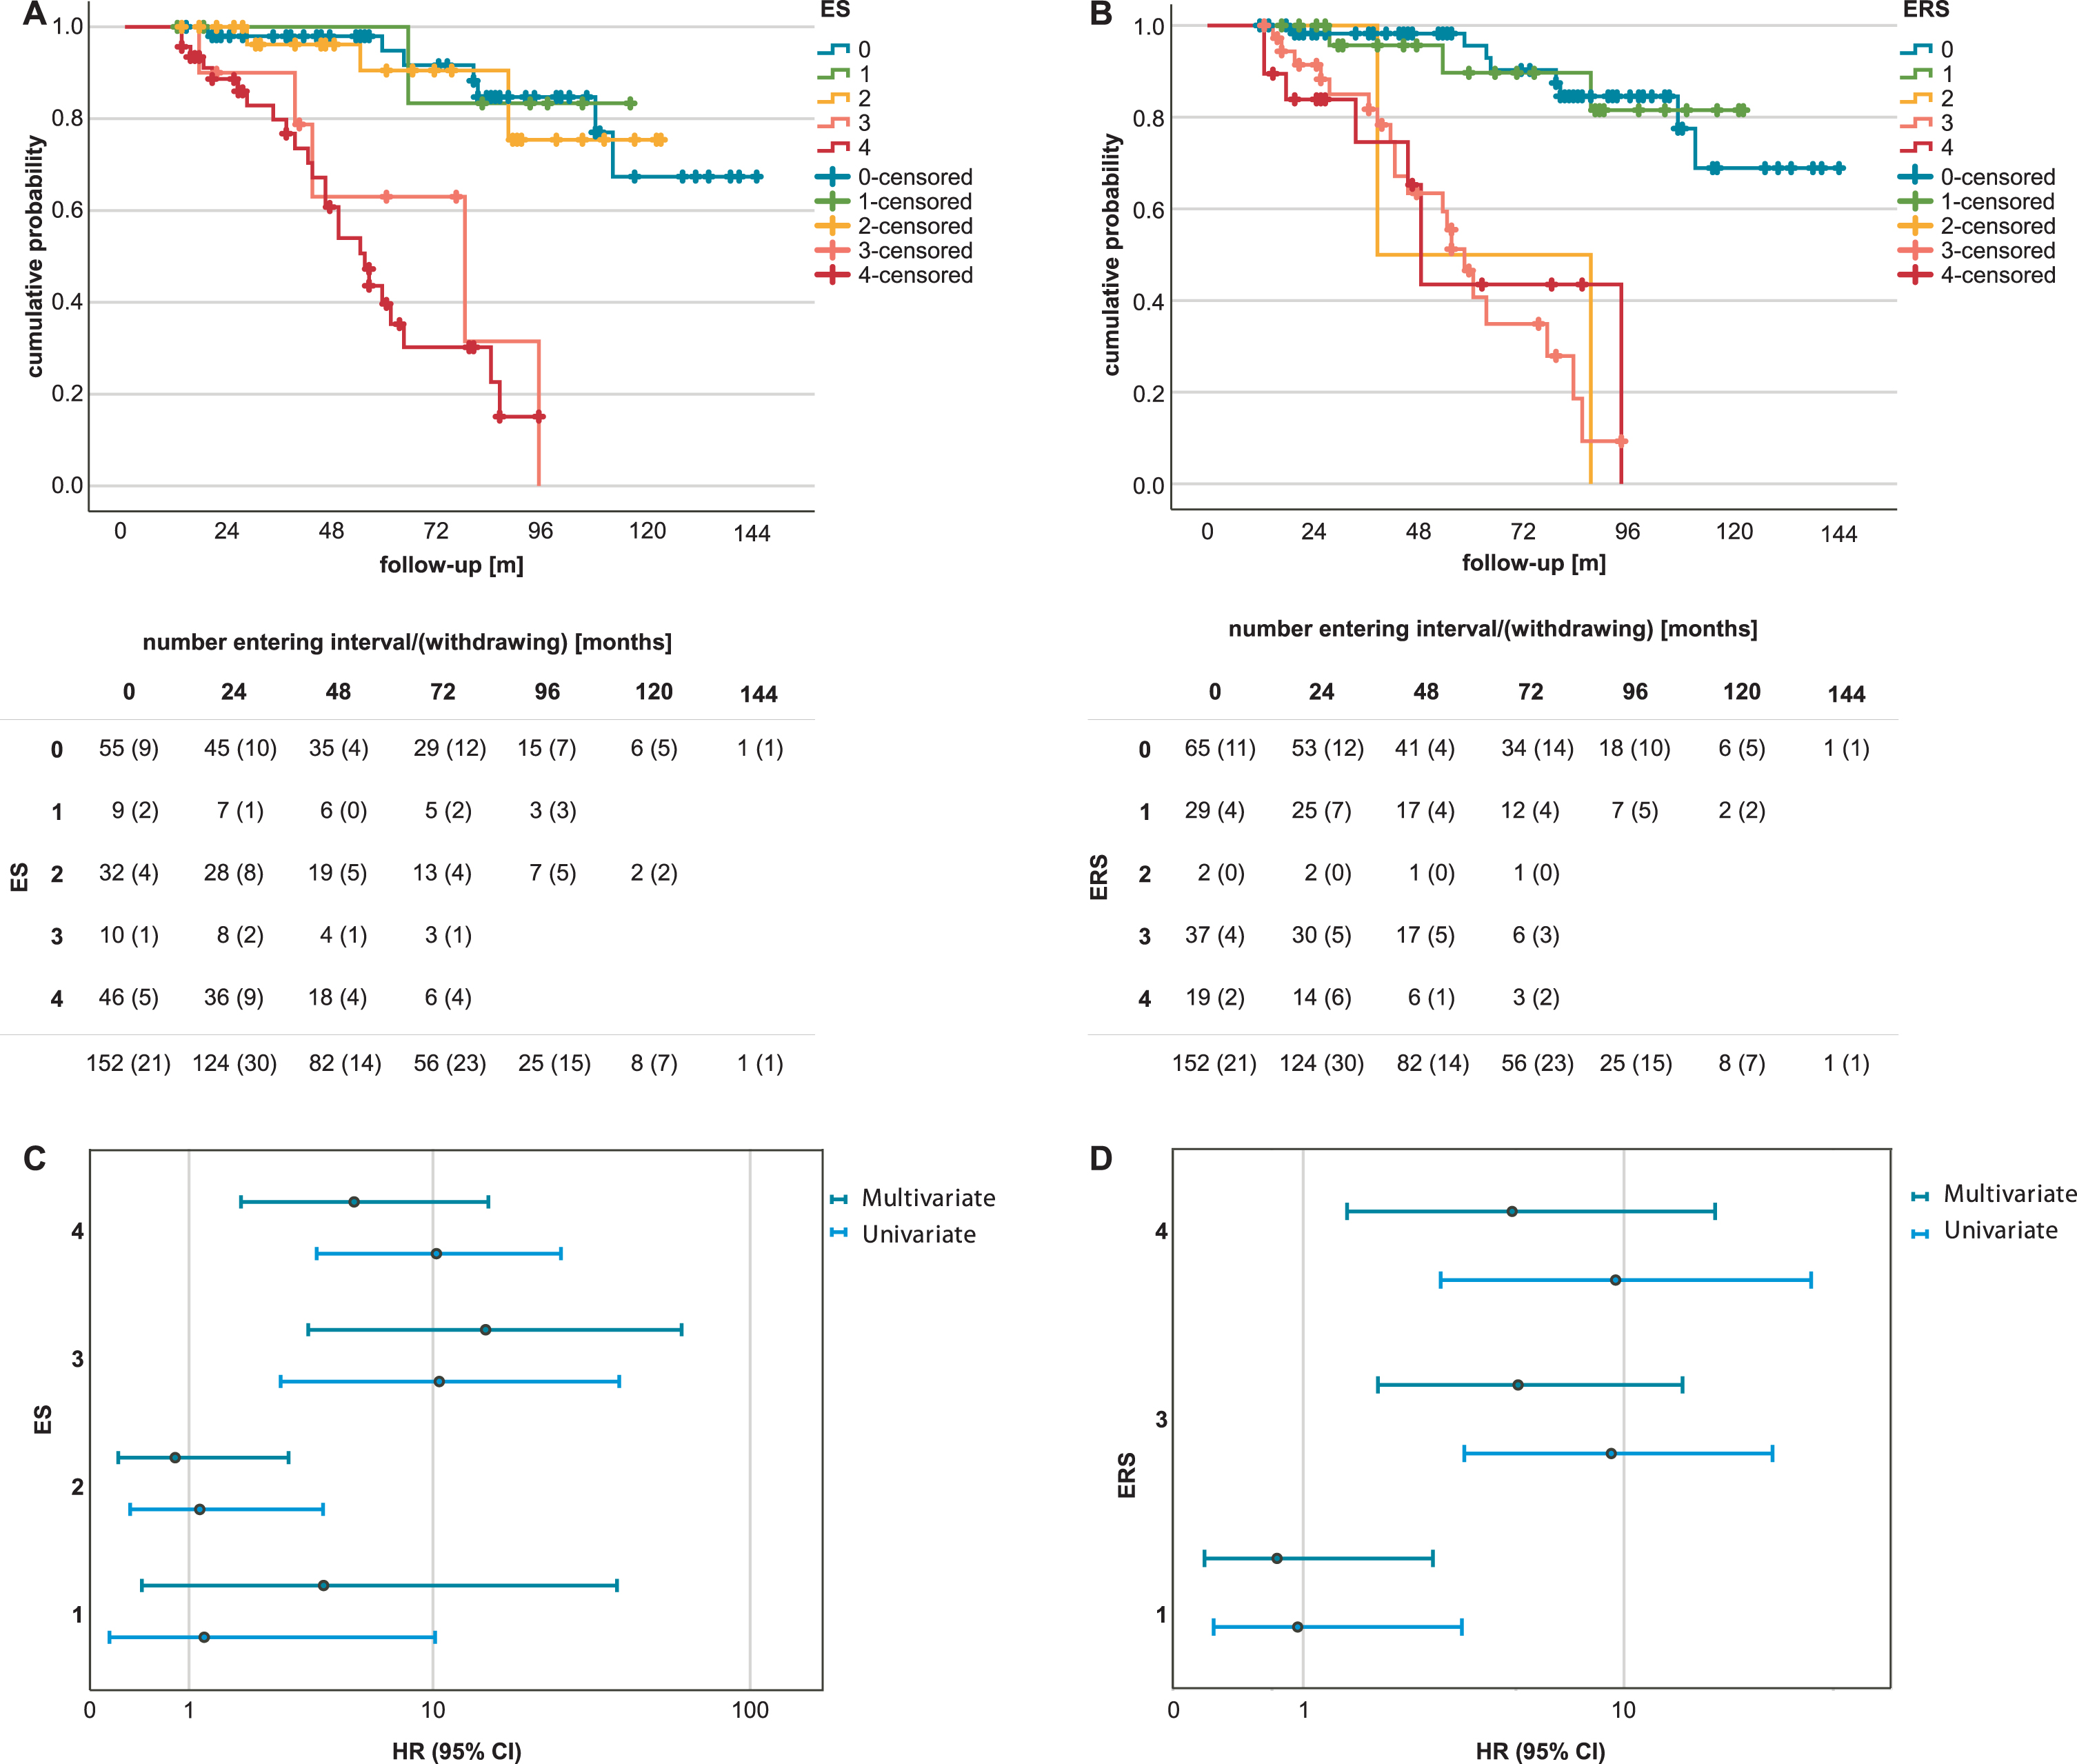
Subjects with ES scores 3, p < 0.001, adjusted hazard ratio (HR) 14.93, 95% CI [3.6, 61.5], and 4, p = 0.002, HR 5.3, 95% CI [1.9, 15.2], had a significantly higher risk of dementia than the control group with ES score 0. Similarly, the risk of dementia was also found to be significantly increased in groups 3 and 4 of the ERS compared with group 0, p < 0.001, HR 5.3, 95% CI [2.0, 14.0], and p = 0.008, HR 5.1, 95% CI [1.5, 16.9], respectively. Forty-one individuals (27.0%) progressed to dementia during the follow-up period, including the two individuals in ERS group 2. Of the 32 subjects with ES 2, three progressed to dementia during the follow-up period. Once the Aβ42/Aβ40 ratio was not considered in the calculation of the ES, group 2 showed a significant increase in the risk of dementia compared to the control group, HR 2.93, 95% CI [1.14, 7.53] (Supplementary Figure 2).
Discriminative ability of the ES and the ERS for dementia risk
The ROC curves for both the ES and the ERS were analysed to assess their predictive ability for dementia risk. The area under the curve (AUC) was 73.2%, 95% CI [64.2, 82.2], for the ES and 72.0%, 95% CI [63.1, 81.0], for the ERS score, respectively. The predicted risk of dementia determined by ROC analyses showed no significant difference between the ES and the ERS, z = 0.811, p = 0.417. The optimal cut-off value for a dichotomous difference between low and high dementia risk determined with the Youden index was 3 for the ES and 2 for the ERS. At the respective optimal cut-off values, the ES had a sensitivity of 71% and a specificity of 76%, and the ERS had a sensitivity of 73% and a specificity of 75%. If the existing cut-off value for “neurochemically possible AD” is used, i.e., cut-off at 2, the ES showed a slightly better sensitivity of 81% but a reduced specificity of 50.5%.
DISCUSSION
In this study, the reconceptualized ERlangen Score (ERS) showed advantages over the Erlangen Score (ES) in test interpretation with comparable overall test performance, as more cases in the ERS were assigned a definite dementia risk and fewer cases remained in the intermediate risk group, e.g., a score of 2 or the middle scale point. Thus, the separate weighting of the Aβ42/Aβ40 ratio improved group assignment in terms of interpretation of findings, whereas there was no significant difference between the ES and the ERS with respect to the prognosis of dementia risk and psychometric trajectories when findings were assessed using the ordinal scale with 5 items.
In this cohort, individuals with an ES of 2 did not show an increased risk of dementia compared with the control group, so that the previous interpretation of the ES in terms of an intermediate risk of dementia did not apply to them [13, 14]. However, if only the CSF-Aβ42 level and not the Aβ42/Aβ40 ratio was used for the evaluation of amyloidopathy, the established interpretation of the ES proved its validity, since group 2 showed a dementia risk and psychometric trajectories that were between the groups 0/1 and 3/4. The different results for ES group 2 as a function of Aβ42/Aβ40 ratio are likely due to the higher sensitivity of the Aβ42/Aβ40 ratio for detecting amyloidopathy at early stages of AD compared with Aβ42 levels, leading to misclassification of individuals with pathological Aβ42/Aβ40 ratios and normal Aβ42 levels [7, 28, 29]. Confirming the validity of the ES score without considering the Aβ42/Aβ40 ratio is of importance since only the Aβ42 level and not the Aβ42/Aβ40 ratio was regularly determined in various study cohorts in the past [6, 30, 31]. The ERS continues to take Aβ42 levels into account because the Aβ42/Aβ40 ratio has not been determined in several large cohorts and the ERS should be used as universally as possible. Given the higher sensitivity of the ratio and the indications that a lower Aβ42 level without a pathological Aβ42/Aβ40 ratio was not associated with an increased risk of AD, we recommend that all parameters of the ERS, including the Aβ42/Aβ40 ratio, should always be determined with a view to possible therapy [21, 32]. In ES and ERS, pTau and tTau are interchangeable as their levels in CSF are highly correlated. Especially in the case of high tTau levels, the classification must be checked for the presence of other diseases, especially rapidly progressing neurodegenerative diseases, in order to avoid misclassification [7, 33]. The advantages of the ES compared to other nominal classifications, e.g., the ATN classification, remain in the ERS as well, since thanks to the ordinal scale no categories are formed in which the interpretation of findings is impaired due to incongruent changes in biomarkers. Additionally, ES in the absence of Aβ42/Aβ40 ratio and ERS share the same set of computational procedures, and the estimation of dementia risk can be performed with both scores using identical cut-offs. The accuracy of the ES (73.2%) and ERS (72.0%) is comparable to other established scores such as the Incidence of Dementia Risk Score, the Dementia Risk Score, and the Australian National University Alzheimer’s Disease Risk Index [34]. Future improvement of the test performance of the ERS might be achieved by incorporating additional biomarkers. In that case, the ordinal scale will allow those additional biomarkers to be considered without the groups becoming too small to study due to the various possible combinations of biomarker constellations.
Limitations
The limitations of this study include the study population, which was not a randomly chosen community sample but was generally well educated. The results thus may not be applied to the general population without reserve. Regarding the methods, it should be noted that the CERAD-NB+is standardized for the detection of AD [23]. Since many symptoms of AD can also be observed in other neurodegenerative diseases, it cannot be ruled out that early stages of other neurodegenerative diseases might not have been adequately detected. Another limitation is that no prediction regarding cognitive trajectories and dementia risk is made for ERS 2 because of the small group size.
Conclusion
The reconceptualization of the ES into the ERS is shown to be as valid as the ES with respect to the ordinal scale and allows the established interpretation of the findings to be maintained even when the Aβ42/Aβ40 ratio is determined. By giving more weight to the Aβ42/Aβ40 ratio, it takes into account that pTau181-positive individuals without amyloidopathy have a lower risk of dementia compared with individuals with amyloidopathy.
ACKNOWLEDGMENTS
We would like to thank Stephan Lins, MD, Teresa Siller, MD, Magdalena Kienle, Michaela Lietz, Anna-Lena Haas, and Julian Schwarz very much for their valuable engagement in data collection.
FUNDING
We acknowledge financial support by Deutsche Forschungsgemeinschaft and Friedrich-Alexander-Universität Erlangen-Nürnberg within the funding programme “Open Access Publication Funding”.
CONFLICT OF INTEREST
PL received consultation and/or lecture honoraria from IBL International, Fujirebio Europe, AJ Roboscreen, Biogen, and Roche. PL is an Editorial Board Member of this journal but was not involved in the peer-review process nor had access to any information regarding its peer-review. The other authors declare that the research was conducted in the absence of any commercial or financial relationships that could be construed as a potential conflict of interest.
DATA AVAILABILITY
The data supporting the findings of this study are available within the article and/or its supplementary material. Further datasets generated and/or analysed in the current study are available from the corresponding author upon reasonable request.
SUPPLEMENTARY MATERIAL
[1] The supplementary material is available in the electronic version of this article: https://dx.doi.org/10.3233/JAD-230524.
REFERENCES
[1] | McKhann GM , Knopman DS , Chertkow H , Hyman BT , Jack CR , Kawas CH , Klunk WE , Koroshetz WJ , Manly JJ , Mayeux R , Mohs RC , Morris JC , Rossor MN , Scheltens P , Carrillo MC , Thies B , Weintraub S , Phelps CH ((2011) ) The diagnosis of dementia due to Alzheimer’s disease: Recommendations from the National Institute on Aging-Alzheimer’s Association workgroups on diagnostic guidelines for Alzheimer’s disease. Alzheimers Dement 7: , 263–269. |
[2] | Dubois B , Feldman HH , Jacova C , Hampel H , Molinuevo JL , Blennow K , DeKosky ST , Gauthier S , Selkoe D , Bateman R , Cappa S , Crutch S , Engelborghs S , Frisoni GB , Fox NC , Galasko D , Habert M-O , Jicha GA , Nordberg A , Pasquier F , Rabinovici G , Robert P , Rowe C , Salloway S , Sarazin M , Epelbaum S , Souza LC de , Vellas B , Visser PJ , Schneider L , Stern Y , Scheltens P , Cummings JL ((2014) ) Advancing research diagnostic criteria for Alzheimer’s disease: The IWG-2 criteria. Lancet Neurol 13: , 614–629. |
[3] | Jack CR , Bennett DA , Blennow K , Carrillo MC , Dunn B , Haeberlein SB , Holtzman DM , Jagust W , Jessen F , Karlawish J , Liu E , Molinuevo JL , Montine T , Phelps C , Rankin KP , Rowe CC , Scheltens P , Siemers E , Snyder HM , Sperling R ((2018) ) NIA-AA Research Framework: Toward a biological definition of Alzheimer’s disease. Alzheimers Dement 14: , 535–562. |
[4] | Blennow K , Wallin A , Agren H , Spenger C , Siegfried J , Vanmechelen E ((1995) ) Tau protein in cerebrospinal fluid: A biochemical marker for axonal degeneration in Alzheimer disease? Mol Chem Neuropathol 26: , 231–245. |
[5] | Hampel H , Buerger K , Zinkowski R , Teipel SJ , Goernitz A , Andreasen N , Sjoegren M , DeBernardis J , Kerkman D , Ishiguro K , Ohno H , Vanmechelen E , Vanderstichele H , McCulloch C , Moller H-J , Davies P , Blennow K ((2004) ) Measurement of phosphorylated tau epitopes in the differential diagnosis of Alzheimer disease: A comparative cerebrospinal fluid study. Arch Gen Psychiatry 61: , 95–102. |
[6] | Hansson O , Lehmann S , Otto M , Zetterberg H , Lewczuk P ((2019) ) Advantages and disadvantages of the use of the CSF Amyloid β (Aβ) 42/40 ratio in the diagnosis of Alzheimer’s disease. Alzheimers Res Ther 11: , 34. |
[7] | Lewczuk P , Riederer P , O’Bryant SE , Verbeek MM , Dubois B , Visser PJ , Jellinger KA , Engelborghs S , Ramirez A , Parnetti L , Jack CR , Teunissen CE , Hampel H , Lleó A , Jessen F , Glodzik L , Leon MJ de , Fagan AM , Molinuevo JL , Jansen WJ , Winblad B , Shaw LM , Andreasson U , Otto M , Mollenhauer B , Wiltfang J , Turner MR , Zerr I , Handels R , Thompson AG , Johansson G , Ermann N , Trojanowski JQ , Karaca I , Wagner H , Oeckl P , van Waalwijk Doorn L , Bjerke M , Kapogiannis D , Kuiperij HB , Farotti L , Li Y , Gordon BA , Epelbaum S , Vos SJB , Klijn CJM , van Nostrand WE , Minguillon C , Schmitz M , Gallo C , Lopez Mato A , Thibaut F , Lista S , Alcolea D , Zetterberg H , Blennow K , Kornhuber J ((2018) ) Cerebrospinal fluid and blood biomarkers for neurodegenerative dementias: An update of the Consensus of the Task Force on Biological Markers in Psychiatry of the World Federation of Societies of Biological Psychiatry. World J Biol Psychiatry 19: , 244–328. |
[8] | Bateman RJ , Xiong C , Benzinger TLS , Fagan AM , Goate A , Fox NC , Marcus DS , Cairns NJ , Xie X , Blazey TM , Holtzman DM , Santacruz A , Buckles V , Oliver A , Moulder K , Aisen PS , Ghetti B , Klunk WE , McDade E , Martins RN , Masters CL , Mayeux R , Ringman JM , Rossor MN , Schofield PR , Sperling RA , Salloway S , Morris JC ((2012) ) Clinical and biomarker changes in dominantly inherited Alzheimer’s disease. N Engl J Med 367: , 795–804. |
[9] | Jack CR , Knopman DS , Jagust WJ , Petersen RC , Weiner MW , Aisen PS , Shaw LM , Vemuri P , Wiste HJ , Weigand SD , Lesnick TG , Pankratz VS , Donohue MC , Trojanowski JQ ((2013) ) Tracking pathophysiological processes in Alzheimer’s disease: An updated hypothetical model of dynamic biomarkers. Lancet Neurol 12: , 207–216. |
[10] | Dubois B , Hampel H , Feldman HH , Scheltens P , Aisen P , Andrieu S , Bakardjian H , Benali H , Bertram L , Blennow K , Broich K , Cavedo E , Crutch S , Dartigues J-F , Duyckaerts C , Epelbaum S , Frisoni GB , Gauthier S , Genthon R , Gouw AA , Habert M-O , Holtzman DM , Kivipelto M , Lista S , Molinuevo J-L , O’Bryant SE , Rabinovici GD , Rowe C , Salloway S , Schneider LS , Sperling R , Teichmann M , Carrillo MC , Cummings J , Jack CR ((2016) ) Preclinical Alzheimer’s disease: Definition, natural history, and diagnostic criteria. Alzheimers Dement 12: , 292–323. |
[11] | Jack CR , Bennett DA , Blennow K , Carrillo MC , Feldman HH , Frisoni GB , Hampel H , Jagust WJ , Johnson KA , Knopman DS , Petersen RC , Scheltens P , Sperling RA , Dubois B ((2016) ) A/T/N: An unbiased descriptive classification scheme for Alzheimer disease biomarkers. Neurology 87: , 539–547. |
[12] | Lewczuk P , Esselmann H , Otto M , Maler JM , Henkel AW , Henkel MK , Eikenberg O , Antz C , Krause W-R , Reulbach U , Kornhuber J , Wiltfang J ((2004) ) Neurochemical diagnosis of Alzheimer’s dementia by CSF Aβ42, Aβ42/Aβ40 ratio and total tau. Neurobiol Aging 25: , 273–281. |
[13] | Lewczuk P , Zimmermann R , Wiltfang J , Kornhuber J ((2009) ) Neurochemical dementia diagnostics: A simple algorithm for interpretation of the CSF biomarkers. J Neural Transm (Vienna) 116: , 1163–1167. |
[14] | Somers C , Lewczuk P , Sieben A , van Broeckhoven C , Deyn PP de , Kornhuber J , Martin J-J , Bjerke M , Engelborghs S ((2019) ) Validation of the Erlangen Score algorithm for differential dementia diagnosis in autopsy-confirmed subjects. J Alzheimers Dis 68: , 1151–1159. |
[15] | Baldeiras I , Santana I , Leitão MJ , Vieira D , Duro D , Mroczko B , Kornhuber J , Lewczuk P ((2019) ) Erlangen Score as a tool to predict progression from mild cognitive impairment to dementia in Alzheimer’s disease. Alzheimers Res Ther 11: , 2. |
[16] | Skillbäck T , Kornhuber J , Blennow K , Zetterberg H , Lewczuk P ((2019) ) Erlangen Score predicts cognitive and neuroimaging progression in mild cognitive impairment stage of Alzheimer’s disease. J Alzheimers Dis 69: , 551–559. |
[17] | Lewczuk P , Kornhuber J , Toledo JB , Trojanowski JQ , Knapik-Czajka M , Peters O , Wiltfang J , Shaw LM ((2016) ) Validation of the Erlangen Score algorithm for the prediction of the development of dementia due to Alzheimer’s disease in pre-dementia subjects. J Alzheimers Dis 49: , 887. |
[18] | Burnham SC , Bourgeat P , Doré V , Savage G , Brown B , Laws S , Maruff P , Salvado O , Ames D , Martins RN , Masters CL , Rowe CC , Villemagne VL ((2016) ) Clinical and cognitive trajectories in cognitively healthy elderly individuals with suspected non-Alzheimer’s disease pathophysiology (SNAP) or Alzheimer’s disease pathology: A longitudinal study. Lancet Neurol 15: , 1044–1053. |
[19] | Jack CR , Wiste HJ , Therneau TM , Weigand SD , Knopman DS , Mielke MM , Lowe VJ , Vemuri P , Machulda MM , Schwarz CG , Gunter JL , Senjem ML , Graff-Radford J , Jones DT , Roberts RO , Rocca WA , Petersen RC ((2019) ) Associations of amyloid, tau, and neurodegeneration biomarker profiles with rates of memory decline among individuals without dementia. JAMA 321: , 2316–2325. |
[20] | Soldan A , Pettigrew C , Fagan AM , Schindler SE , Moghekar A , Fowler C , Li Q-X , Collins SJ , Carlsson C , Asthana S , Masters CL , Johnson S , Morris JC , Albert M , Gross AL ((2019) ) ATN profiles among cognitively normal individuals and longitudinal cognitive outcomes. Neurology 92: , e1567–e1579. |
[21] | Pijnenburg YAL , Schoonenboom SNM , Mehta PD , Mehta SP , Mulder C , Veerhuis R , Blankenstein MA , Scheltens P ((2007) ) Decreased cerebrospinal fluid amyloid beta (1-40) levels in frontotemporal lobar degeneration. J Neurol Neurosurg Psychiatry 78: , 735–737. |
[22] | Selnes P , Blennow K , Zetterberg H , Grambaite R , Rosengren L , Johnsen L , Stenset V , Fladby T ((2010) ) Effects of cerebrovascular disease on amyloid precursor protein metabolites in cerebrospinal fluid. Cerebrospinal Fluid Res 7: , 10. |
[23] | Spitzer P , Lang R , Oberstein TJ , Lewczuk P , Ermann N , Huttner HB , Masouris I , Kornhuber J , Ködel U , Maler JM ((2018) ) A specific reduction in Aβ1-42 vs. a universal loss of Aβ peptides in CSF differentiates Alzheimer’s disease from meningitis and multiple sclerosis. Front Aging Neurosci 10: , 152. |
[24] | Lewczuk P , Matzen A , Blennow K , Parnetti L , Molinuevo JL , Eusebi P , Kornhuber J , Morris JC , Fagan AM ((2017) ) Cerebrospinal fluid Aβ42/40 corresponds better than Aβ42 to amyloid PET in Alzheimer’s disease. J Alzheimers Dis 55: , 813–822. |
[25] | Oberstein TJ , Schmidt MA , Florvaag A , Haas A-L , Siegmann E-M , Olm P , Utz J , Spitzer P , Doerfler A , Lewczuk P , Kornhuber J , Maler JM ((2022) ) Amyloid-β levels and cognitive trajectories in non-demented pTau181-positive subjects without amyloidopathy. Brain 145: , 4032–4041. |
[26] | DeLong ER , DeLong DM , Clarke-Pearson DL ((1988) ) Comparing the areas under two or more correlated receiver operating characteristic curves: A nonparametric approach. Biometrics 44: , 837–845. |
[27] | Collins GS , Reitsma JB , Altman DG , Moons KGM ((2015) ) Transparent reporting of a multivariable prediction model for individual prognosis or diagnosis (TRIPOD): The TRIPOD Statement. BMC Med 13: , 1. |
[28] | Beaufils E , Dufour-Rainfray D , Hommet C , Brault F , Cottier J-P , Ribeiro MJ , Mondon K , Guilloteau D ((2013) ) Confirmation of the amyloidogenic process in posterior cortical atrophy: Value of the Aβ42/Aβ40 ratio. J Alzheimers Dis 33: , 775–780. |
[29] | Pannee J , Portelius E , Minthon L , Gobom J , Andreasson U , Zetterberg H , Hansson O , Blennow K ((2016) ) Reference measurement procedure for CSF amyloid beta (Aβ)1-42 and the CSF Aβ1-42/Aβ1-40 ratio – a cross-validation study against amyloid PET. J Neurochem 139: , 651–658. |
[30] | Lei D , Mao C , Li J , Huang X , Sha L , Liu C , Dong L , Xu Q , Gao J ((2022) ) CSF biomarkers for early-onset Alzheimer’s disease in Chinese population from PUMCH dementia cohort. Front Neurol 13: , 1030019. |
[31] | Lehmann S , Delaby C , Boursier G , Catteau C , Ginestet N , Tiers L , Maceski A , Navucet S , Paquet C , Dumurgier J , Vanmechelen E , Vanderstichele H , Gabelle A ((2018) ) Relevance of Aβ42/40 ratio for detection of Alzheimer disease pathology in clinical routine: The PLMR Scale. Front Aging Neurosci 10: , 138. |
[32] | Delaby C , Estellés T , Zhu N , Arranz J , Barroeta I , Carmona-Iragui M , Illán-Gala I , Santos-Santos MÁ , Altuna M , Sala I , Sánchez-Saudinós MB , Videla L , Valldeneu S , Subirana A , Tondo M , Blanco-Vaca F , Lehmann S , Belbin O , Blesa R , Fortea J , Lleó A , Alcolea D ((2022) ) The Aβ1-42/Aβ1-40 ratio in CSF is more strongly associated to tau markers and clinical progression than Aβ1-42 alone. Alzheimers Res Ther 14: , 20. |
[33] | Thompson AGB , Mead SH ((2019) ) Review: Fluid biomarkers in the human prion diseases. Mol Cell Neurosci 97: , 81–92. |
[34] | You J , Zhang Y-R , Wang H-F , Yang M , Feng J-F , Yu J-T , Cheng W ((2022) ) Development of a novel dementia risk prediction model in the general population: A large, longitudinal, population-based machine-learning study. EClinicalMedicine 53: , 101665. |


