
Gene Co-Expression Analysis of Multiple Brain Tissues Reveals Correlation of FAM222A Expression with Multiple Alzheimer’s Disease-Related Genes
Abstract
Background:
Alzheimer’s disease (AD) is the most common form of dementia in the elderly marked by central nervous system (CNS) neuronal loss and amyloid plaques. FAM222A, encoding an amyloid plaque core protein, is an AD brain atrophy susceptibility gene that mediates amyloid-β aggregation. However, the expression interplay between FAM222A and other AD-related pathway genes is unclear.
Objective:
Our goal was to study FAM222A’s whole-genome co-expression profile in multiple tissues and investigate its interplay with other AD-related genes.
Methods:
We analyzed gene expression correlations in Genotype-Tissue Expression (GTEx) tissues to identify FAM222A co-expressed genes and performed functional enrichment analysis on identified genes in CNS system.
Results:
Genome-wide gene expression profiling identified 673 genes significantly correlated with FAM222A (p < 2.5×10⁻⁶) in 48 human tissues, including 298 from 13 CNS tissues. Functional enrichment analysis revealed that FAM222A co-expressed CNS genes were enriched in multiple AD-related pathways. Gene co-expression network analysis for identified genes in each brain region predicted other disease associated genes with similar biological function. Furthermore, co-expression of 25 out of 31 AD-related pathways genes with FAM222A was replicated in brain samples from 107 aged subjects from the Aging, Dementia and TBI Study.
Conclusion:
This gene co-expression study identified multiple AD-related genes that are associated with FAM222A, indicating that FAM222A and AD-associated genes can be active simultaneously in similar biological processes, providing evidence that supports the association of FAM222A with AD.
INTRODUCTION
It has been increasingly recognized that Alzheimer’s disease (AD) is a genetically dichotomous disease, with more than 90% of the late-onset sporadic form inherited in a non-Mendelian fashion (LOAD), and less than 10% of AD early-onset familial form showing classical Mendelian inheritance (EOAD) [1]. The pathophysiological process of AD is believed to begin years before the diagnosis of clinical dementia [2]. Quantitative structural magnetic resonance imaging (MRI) has been extensively used for assessment of AD-related structural differences in selective brain regions [3]. Our recent cross-phenotype association analysis of MRI measures and genotypes from the Alzheimer’s Disease Neuroimaging Initiative (ADNI) identified a new single nucleotide polymorphism rs117028417 on FAM222A associated with AD-related imaging quantitative traits [4], which was replicated in the Enhancing NeuroImaging Genetics through Meta-Analysis (ENIGMA) consortium cohort [5]. Despite a marginal association with AD diagnosis in the International Genomics of Alzheimer’s Project (I-GAP) [6], FAM222A rs117028417 has a significant association with longitudinal changes in brain amyloid deposition in AD patients [4]. The protein encoded by FAM222A, we named Aggregatin, is predominantly expressed in the central nervous system (CNS) [4]. Remarkably, Aggregatin accumulates within the center of amyloid plaques, physically interacts with amyloid-β (Aβ), facilitates Aβ aggregation, and regulates the formation of amyloid deposits and associated neuroinflammation and cognitive deficits in the AD mouse model [4]. Taken together, these results support the important role of FAM222A and its encoded Aggregatin in AD pathogenesis.
Gene co-expression analysis, an algorithm able to associate functionally related genes from gene expression data [7], has been increasingly used to discern transcriptional regulatory programs, prioritize candidate disease genes, understand underlying pathomechanisms, and identify biomarkers or therapeutic targets in wide range of human diseases including AD [8–11]. Although gene co-expression analysis do not necessarily provide information about the causality relationships between genes, differential co-expression analysis among various tissues have been used to improve prediction of tissue related disease and functions [12]. Brain function is governed by precise regulation of gene expression across anatomically distinct structures. Study of gene co-expression profiles for region-specific processes in non-pathological brain tissue can be used to associate gene of unknown function with biological process and disease prediction [13]. In addition, postmortem analysis of gene expression profile in brains of patients with AD have suggested multiple significant biological mechanisms and disease promoting pathways [14–16]. Analysis of the local and global alterations in the gene co-expression profile in normal and pathological brain tissues is helpful to understand gene’s biological and physiological function and potential role in the disease.
Our previous study on the pathomechanisms of FAM222A and its encoded Aggregatin have primarily concentrated on its pathophysiological function in brain amyloid deposition, with relatively limited investigation of its expression association with other neurodegeneration or AD related risk genes. We conducted gene co-expression analysis for FAM222A from the Genotype-Tissue Expression (GTEx) RNA-seq data [17] to better understand gene expression levels across individuals and diverse tissues. The GTEx project donors were 20 to 70 years of age, averaging 53.4 years [17]. Most of the donors died from traumatic injury, cerebrovascular and heart disease, with a small proportion dying from liver, renal, respiratory, and neurological diseases [17]. We conducted gene co-expression network and pathway enrichment analysis to gain mechanistic insight using identified genes co-expressed with FAM222A in multiple brain tissues. Additionally, the results were validated in both traumatic brain injury (TBI) (healthy) and AD (pathologic) cases from a unique aged population-based cohort from the Adult Changes in Though (ACT) study.
METHODS
The Genotype-Tissue Expression (GTEx) project
Fully processed, filtered, and normalized gene expression data from 49 tissues and cell lines were downloaded from the Genotype-Tissue Expression project portal (version 8) (https://www.gtexportal.org). Only genes with twenty or more donors with expression estimates >0.1 Reads per Kilo-base of transcript (RPKM) and an aligned read count of six or more within each tissue were considered significantly expressed. Within each tissue, the distribution of RPKMs in each sample was quantile-transformed using the average empirical distribution observed across all samples. Expression measurements for each gene in each tissue were subsequently transformed to the quantile of the standard normal distribution.
Gene co-expression network analysis
Pearson correlation analysis were conducted between genome-wide genes with FAM222A in each tissue. The Pearson’s correlation coefficient and the corresponding p-value were calculated for each pair of genes. The genes that correlated with FAM222A with p≤2.5×10⁻⁶ were defined as statistically significant. For the genes identified significantly correlated with FAM222A in 13 brain tissues, co-expression networks for each tissue were constructed by computing Pearson’s correlation between each pair of genes. The pairs of genes with correlation p≤2.5×10⁻⁶ were defined as connected. R package “visNetwork”, available at https://github.com/datastorm-open/visNetwork, were used to visualize the network in each brain tissue.
Protein-protein interaction (PPI) network analysis
The search tool for retrieval of interacting genes (STRING) (http://string-db.org) database, which integrates both known and predicted PPIs, can be applied to predict functional interactions of proteins [18]. To seek potential interactions between genes identified significantly correlated with FAM222A in different brain tissues, The STRING tool was employed. Active interaction sources, including gene oncology, KEGG pathway, subcellular localization database, tissue expression database, disease-gene associations mined from literature and WikiPathway were applied to construct the PPI networks. Pathway enrichment analyses for the genes identified significantly correlated with FAM222A in 13 brain tissues were conducted using Enrichr (http://amp.pharm.mssm.edu/Enrichr/). Enrichr is a web-based tool that conduct intuitive enrichment analysis providing various types of visualization summaries of collective functions of gene lists [19]. The significant terms and pathways were selected from the threshold of adjusted p < 0.05.
The Aging, Dementia and Traumatic Brain Injury study
The Aging, Dementia and TBI study is a detailed neurological, molecular, and transcriptomic characterization of brains of control and TBI exposure from a unique aged population-based cohort from the ACT study. This study was developed by a consortium consisting of the University of Washington, Kaiser Permanente Washington Health Research Institute, and the Allen Institute for Brain Science, and was supported by the Paul G. Allen Family Foundation. This freely available resource (https://aging.brain-map.org/) presents a systematic and extensive data set of study participant RNA sequencing (RNA-seq) analysis of hippocampus, neocortex, and white matter of forebrain. Specific methodological details are available on the “Document” tab at https://aging.brain-map.org/.
For gene expression data, 377 samples collected from cortical grey (parietal and temporal) and white matter (parietal) and hippocampus from a total of 107 brains. The donors age ranged from 78 to 100+ years old and included 44 females and 63 males. Based on the DSM-IV diagnostic criterion for clinical significance, there were 30 individuals diagnosed with AD, 12 with multiple etiologies of TBI, 4 with vascular cause, 3 with other medical cause, 2 with other unknown cause, and 56 were non-dementia controls. The details of normalized gene-level FPKM values of RNAseq gene expression data generation was available at https://help.brain-map.org/display/aging/Documentation.
To replicate the correlations of AD-related genes with FAM222A in GTEx, Pearson correlation analysis of 31 identified genes expression with FAM222A were conducted in the aging, dementia and TBI studies, 107 donors for four brain regions: temporal neocortex (TCx), white matter of forebrain (FWM), hippocampus (HIP), and parietal neocortex (PCx). The significant threshold was empirical p-value adjusting multiple tests by Bonferroni correction (p < 0.05/124 = 4.0×10⁻⁴).
RESULTS
FAM222A co-expression analysis across 48 tissues and cells lines in GTEx data
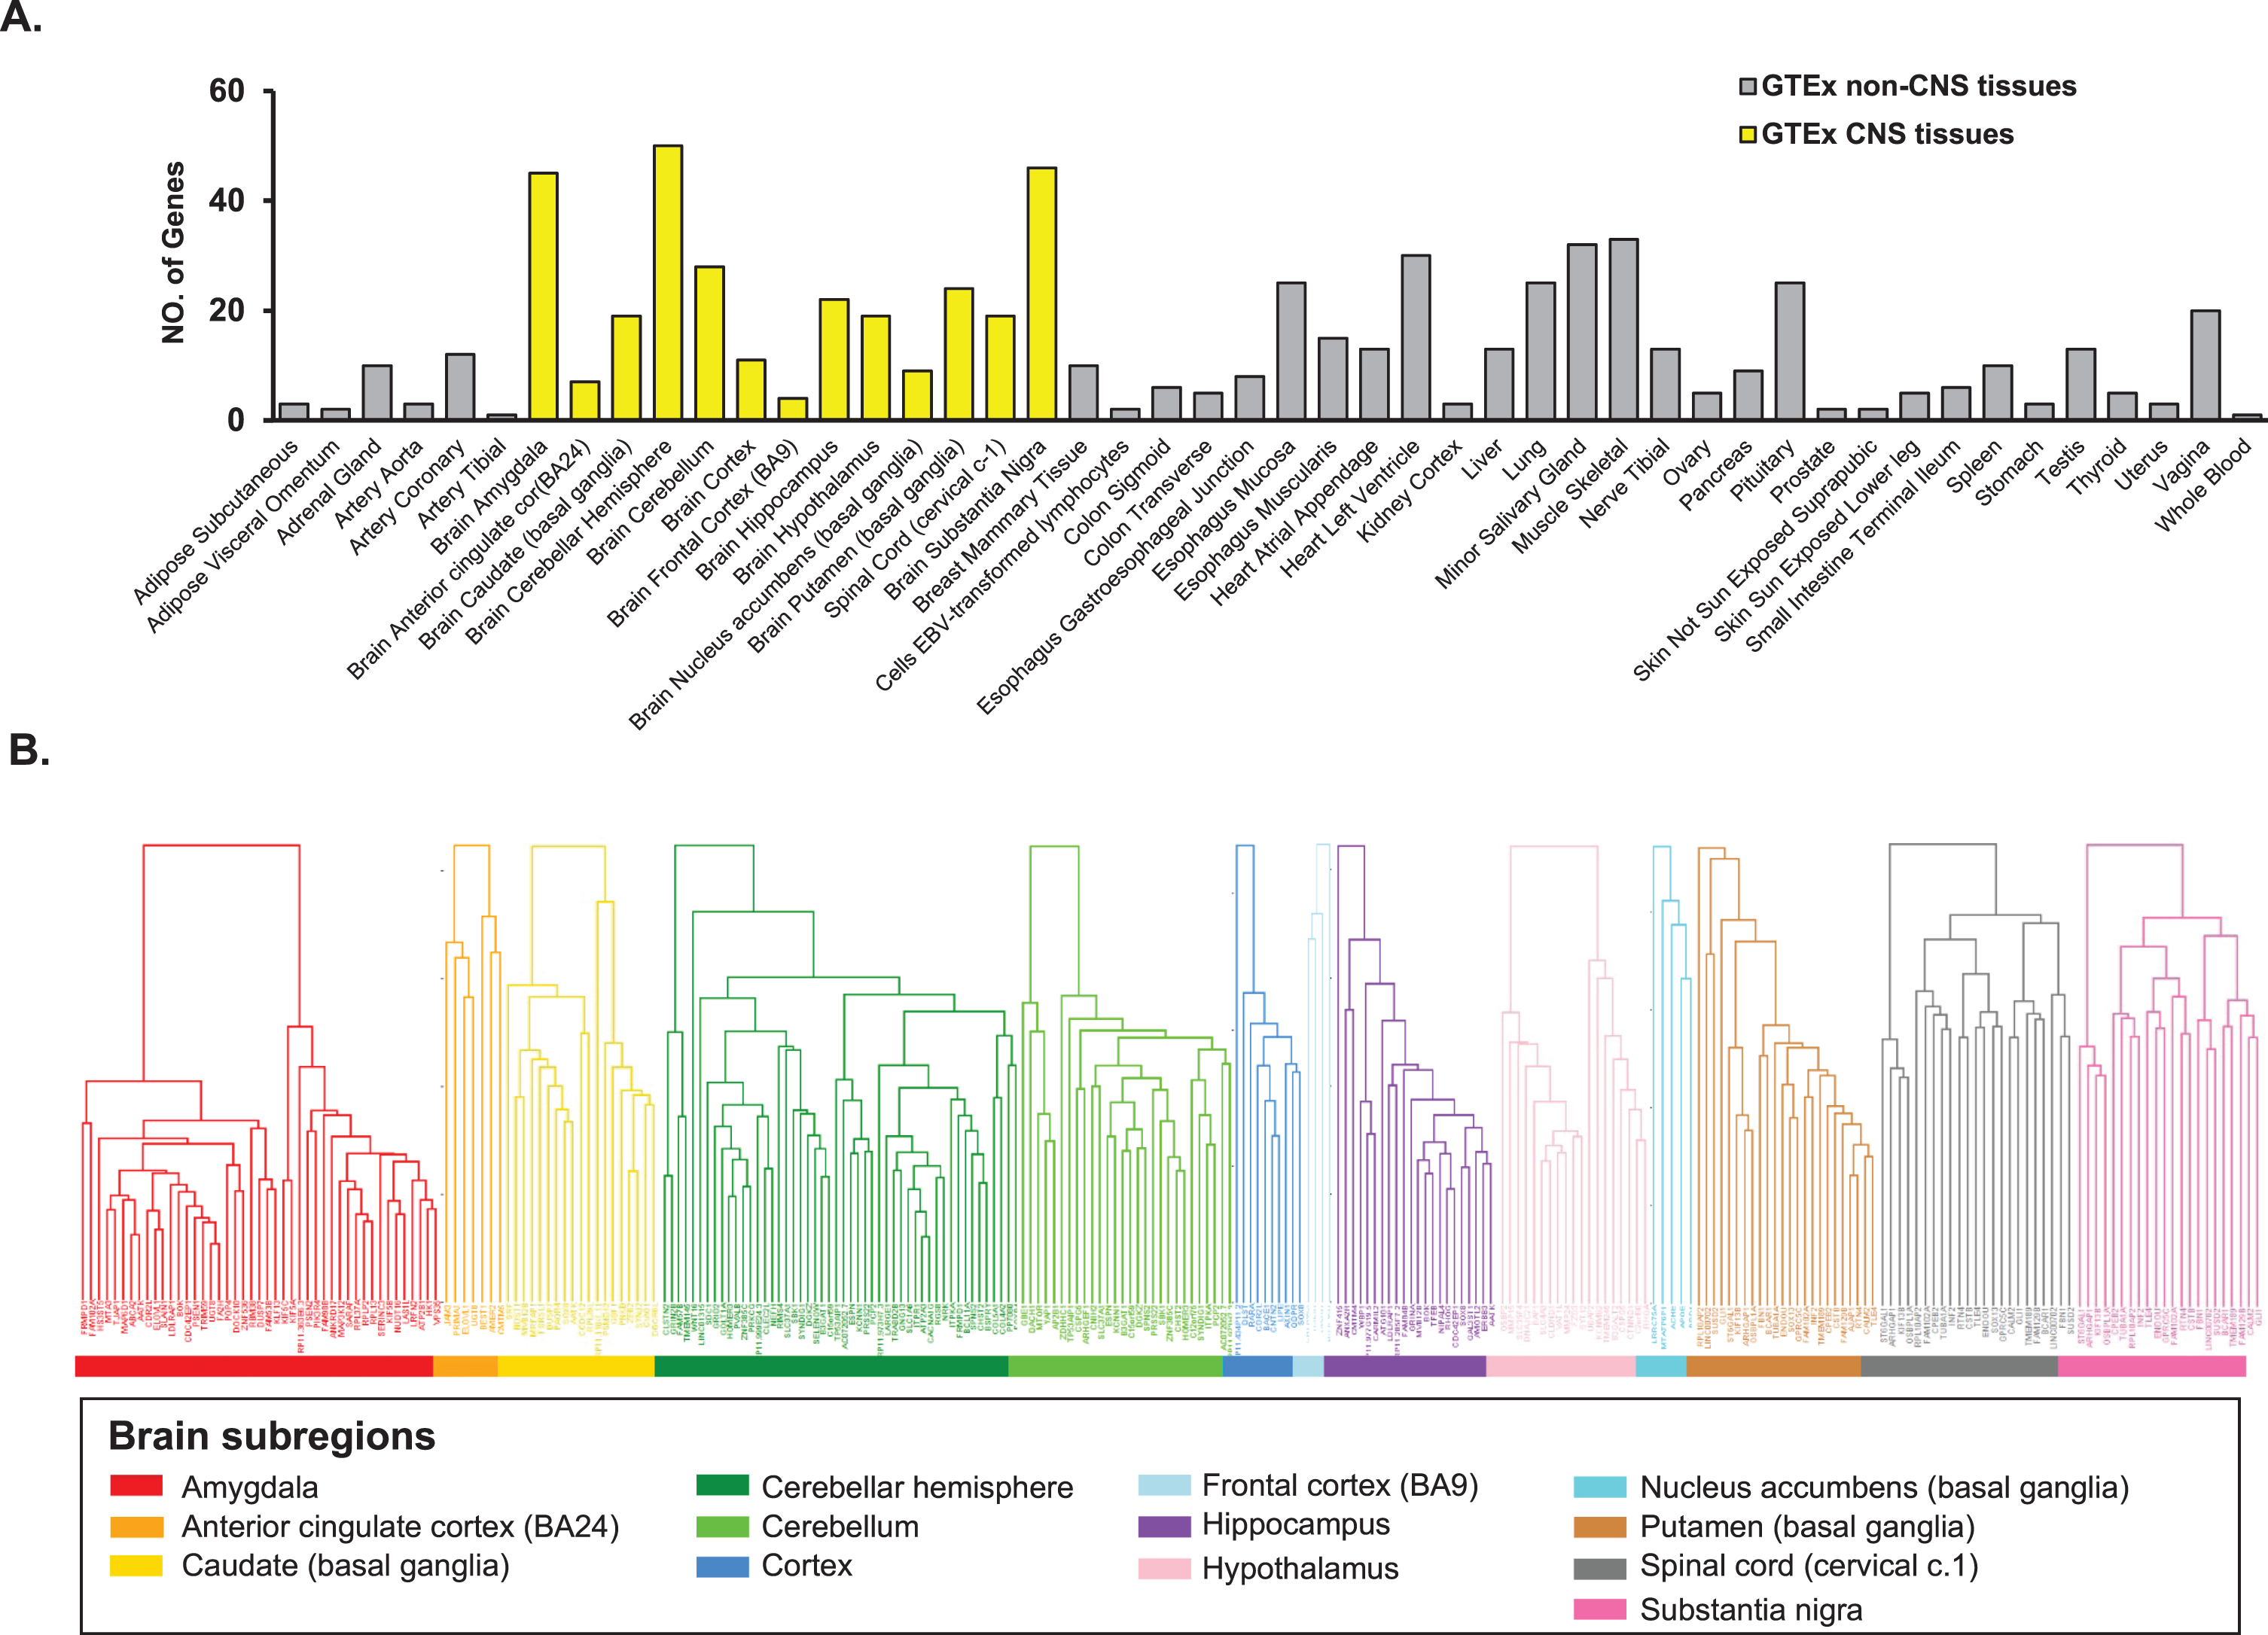
We conducted whole-genome gene co-expression analysis for FAM222A across 48 tissues available in GTEx v8 data including approximately 984 postmortem donors with genotype information and 17,832 RAN-seq samples and identified genes that are correlated with FAM222A in transcription expression level. There were 673 genes that were transcriptionally correlated with FAM222A in 48 GTEx tissues (p < 2.5×10⁻⁶), in which 298 genes were identified from 13 central nervous system (CNS) tissues (Figs. 1, 2A; Supplementary Table 1). The average number of genes identified co-expressed with FAM222A in 13 CNS tissues was significantly higher than 35 other tissues (p = 9.8×10⁻³) (Fig. 2A), suggesting FAM222A is more functional active in brain tissues.
Fig. 1
Flowchart of the gene-coexpression analysis. AD, Alzheimer’s Disease; GTEx, The Genotype-Tissue Expression (GTEx) project; CNS, central nervious system; TBI, traumatic brain injury.
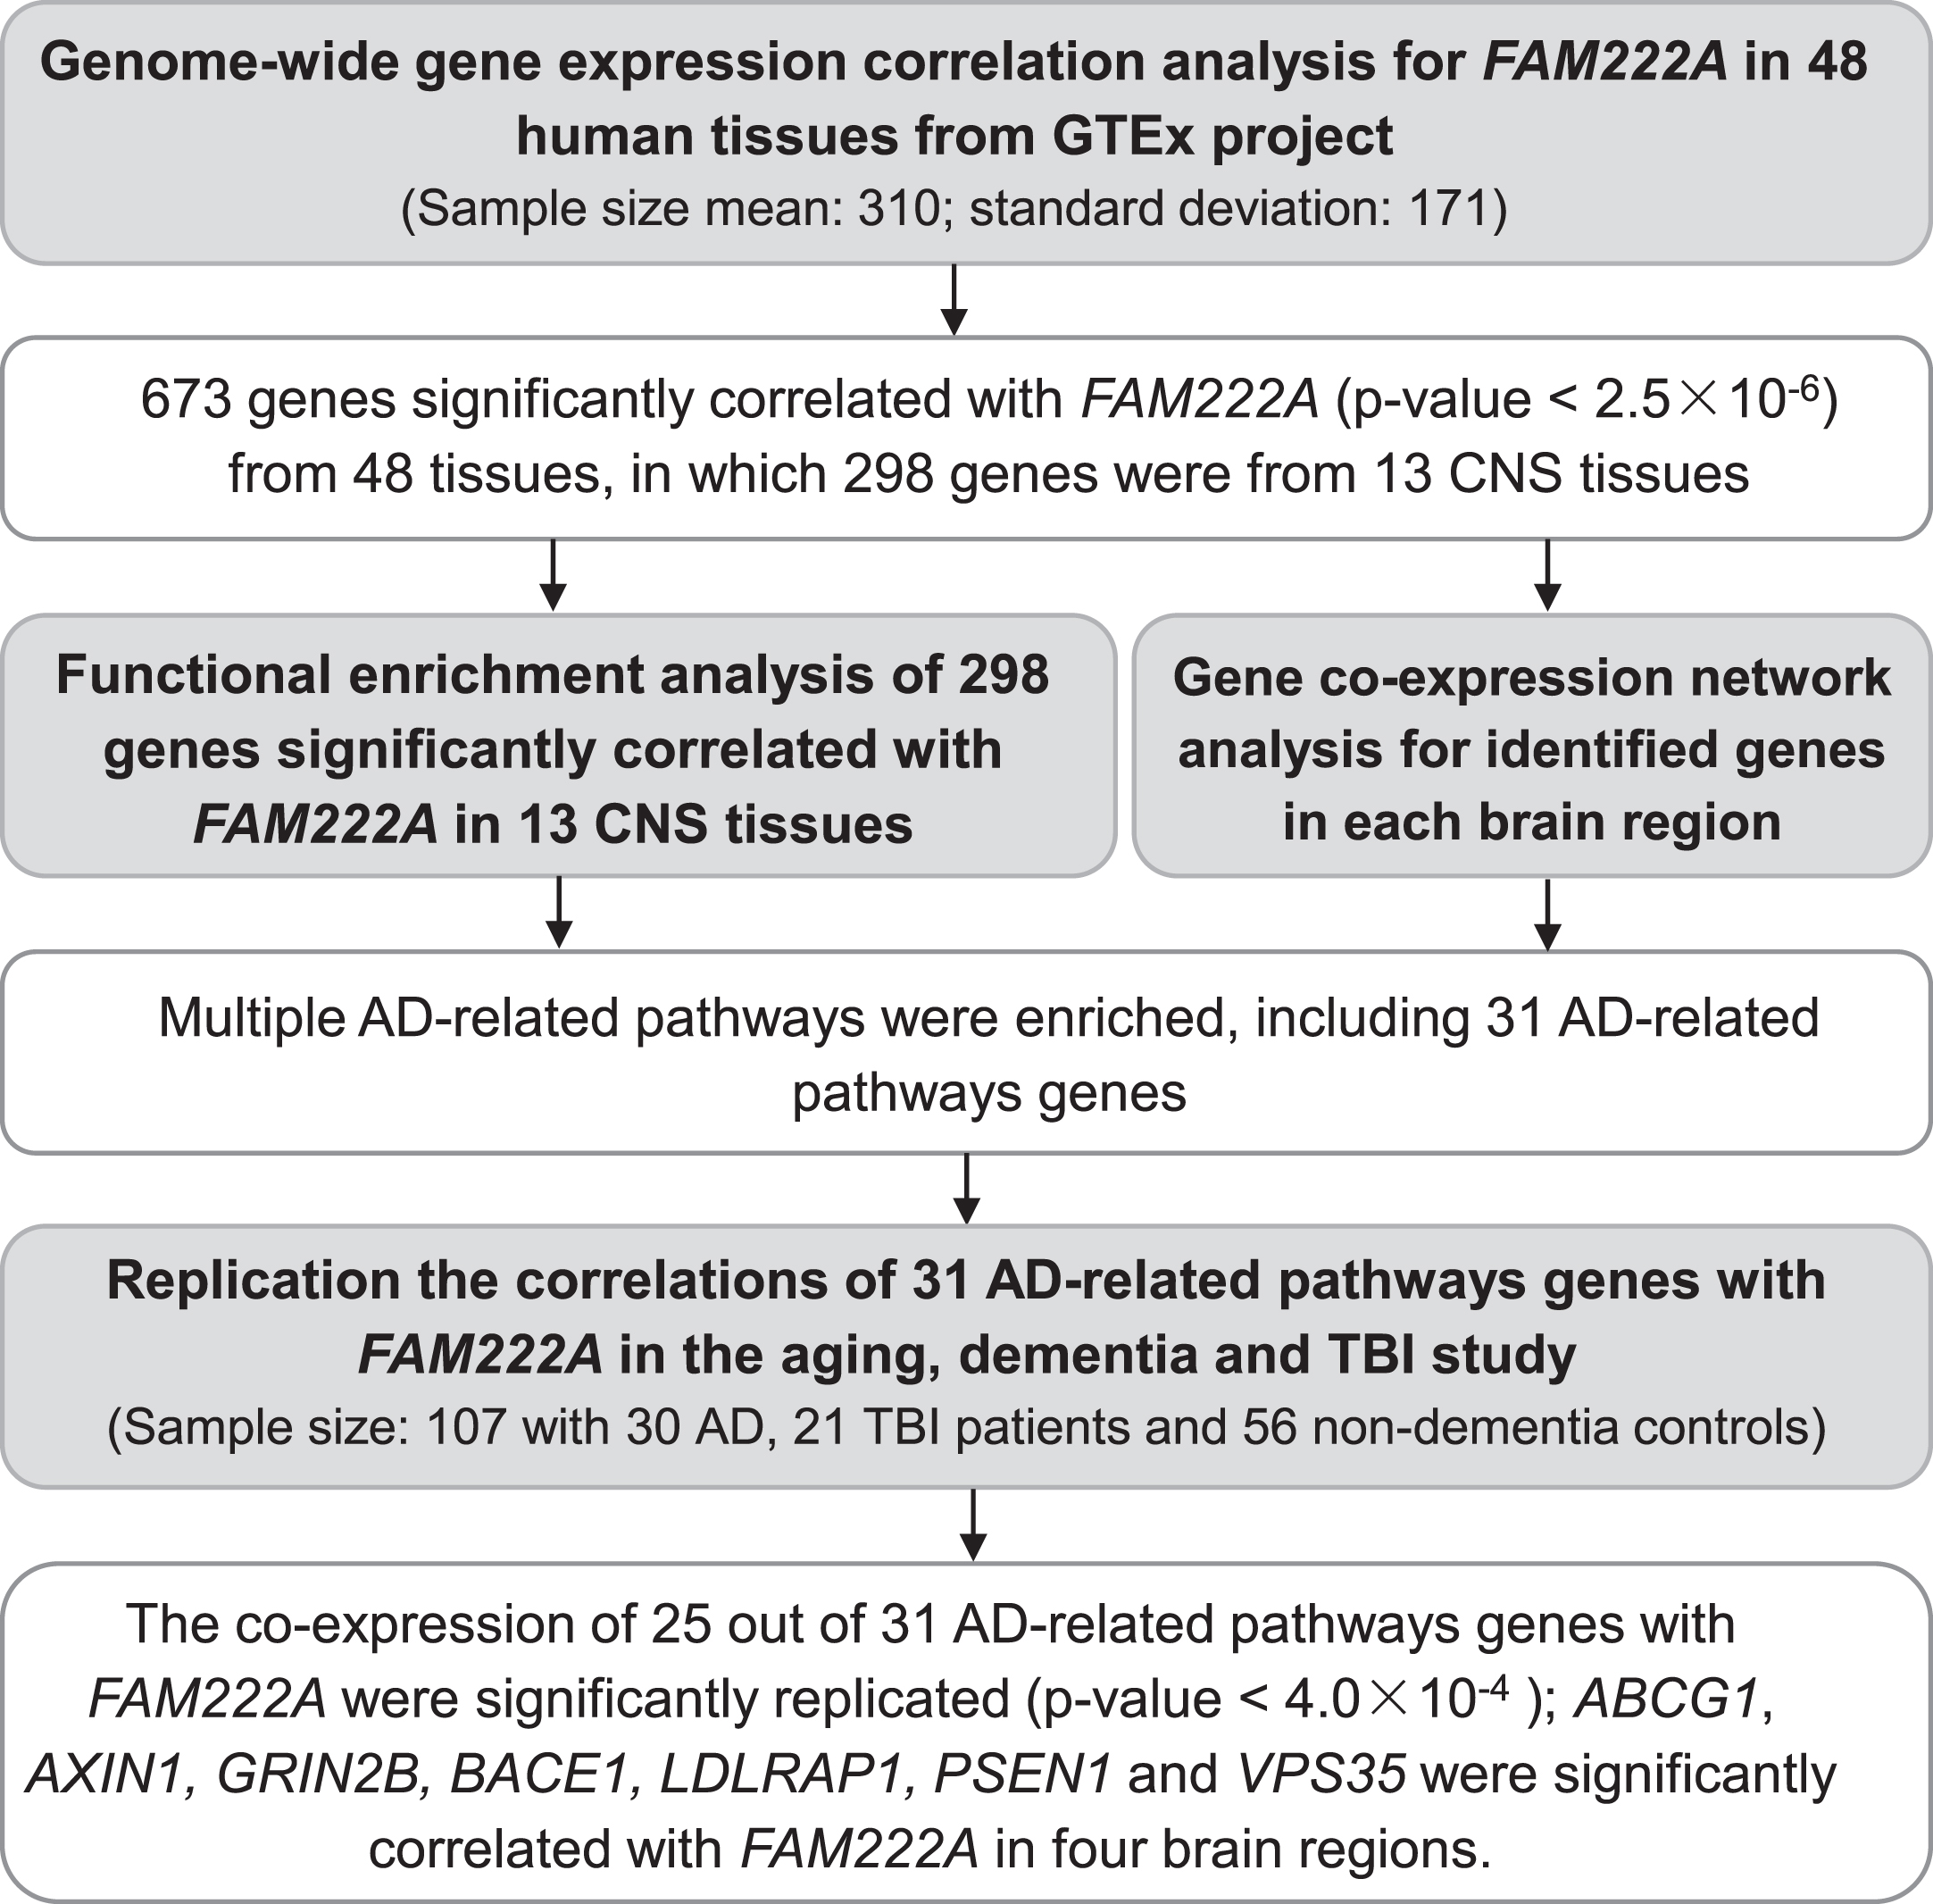
Fig. 2
Genes with expression significantly correlated with FAM222A in GTEx tissues. A) Number of genes with expression significantly correlated with FAM222A in 48 GTEx tissues (Pearson correlation p≤2.5×10⁻⁶). The mean number of genes identified in 13 brain tissues are significantly larger than genes identified in other GTEx tissues (p = 1.7×10⁻³). B) Hierarchical clustering analysis for genes with expression significantly correlated with FAM222A in 13 brain tissues.
Genes co-expressed with FAM222A were enriched in AD related pathways
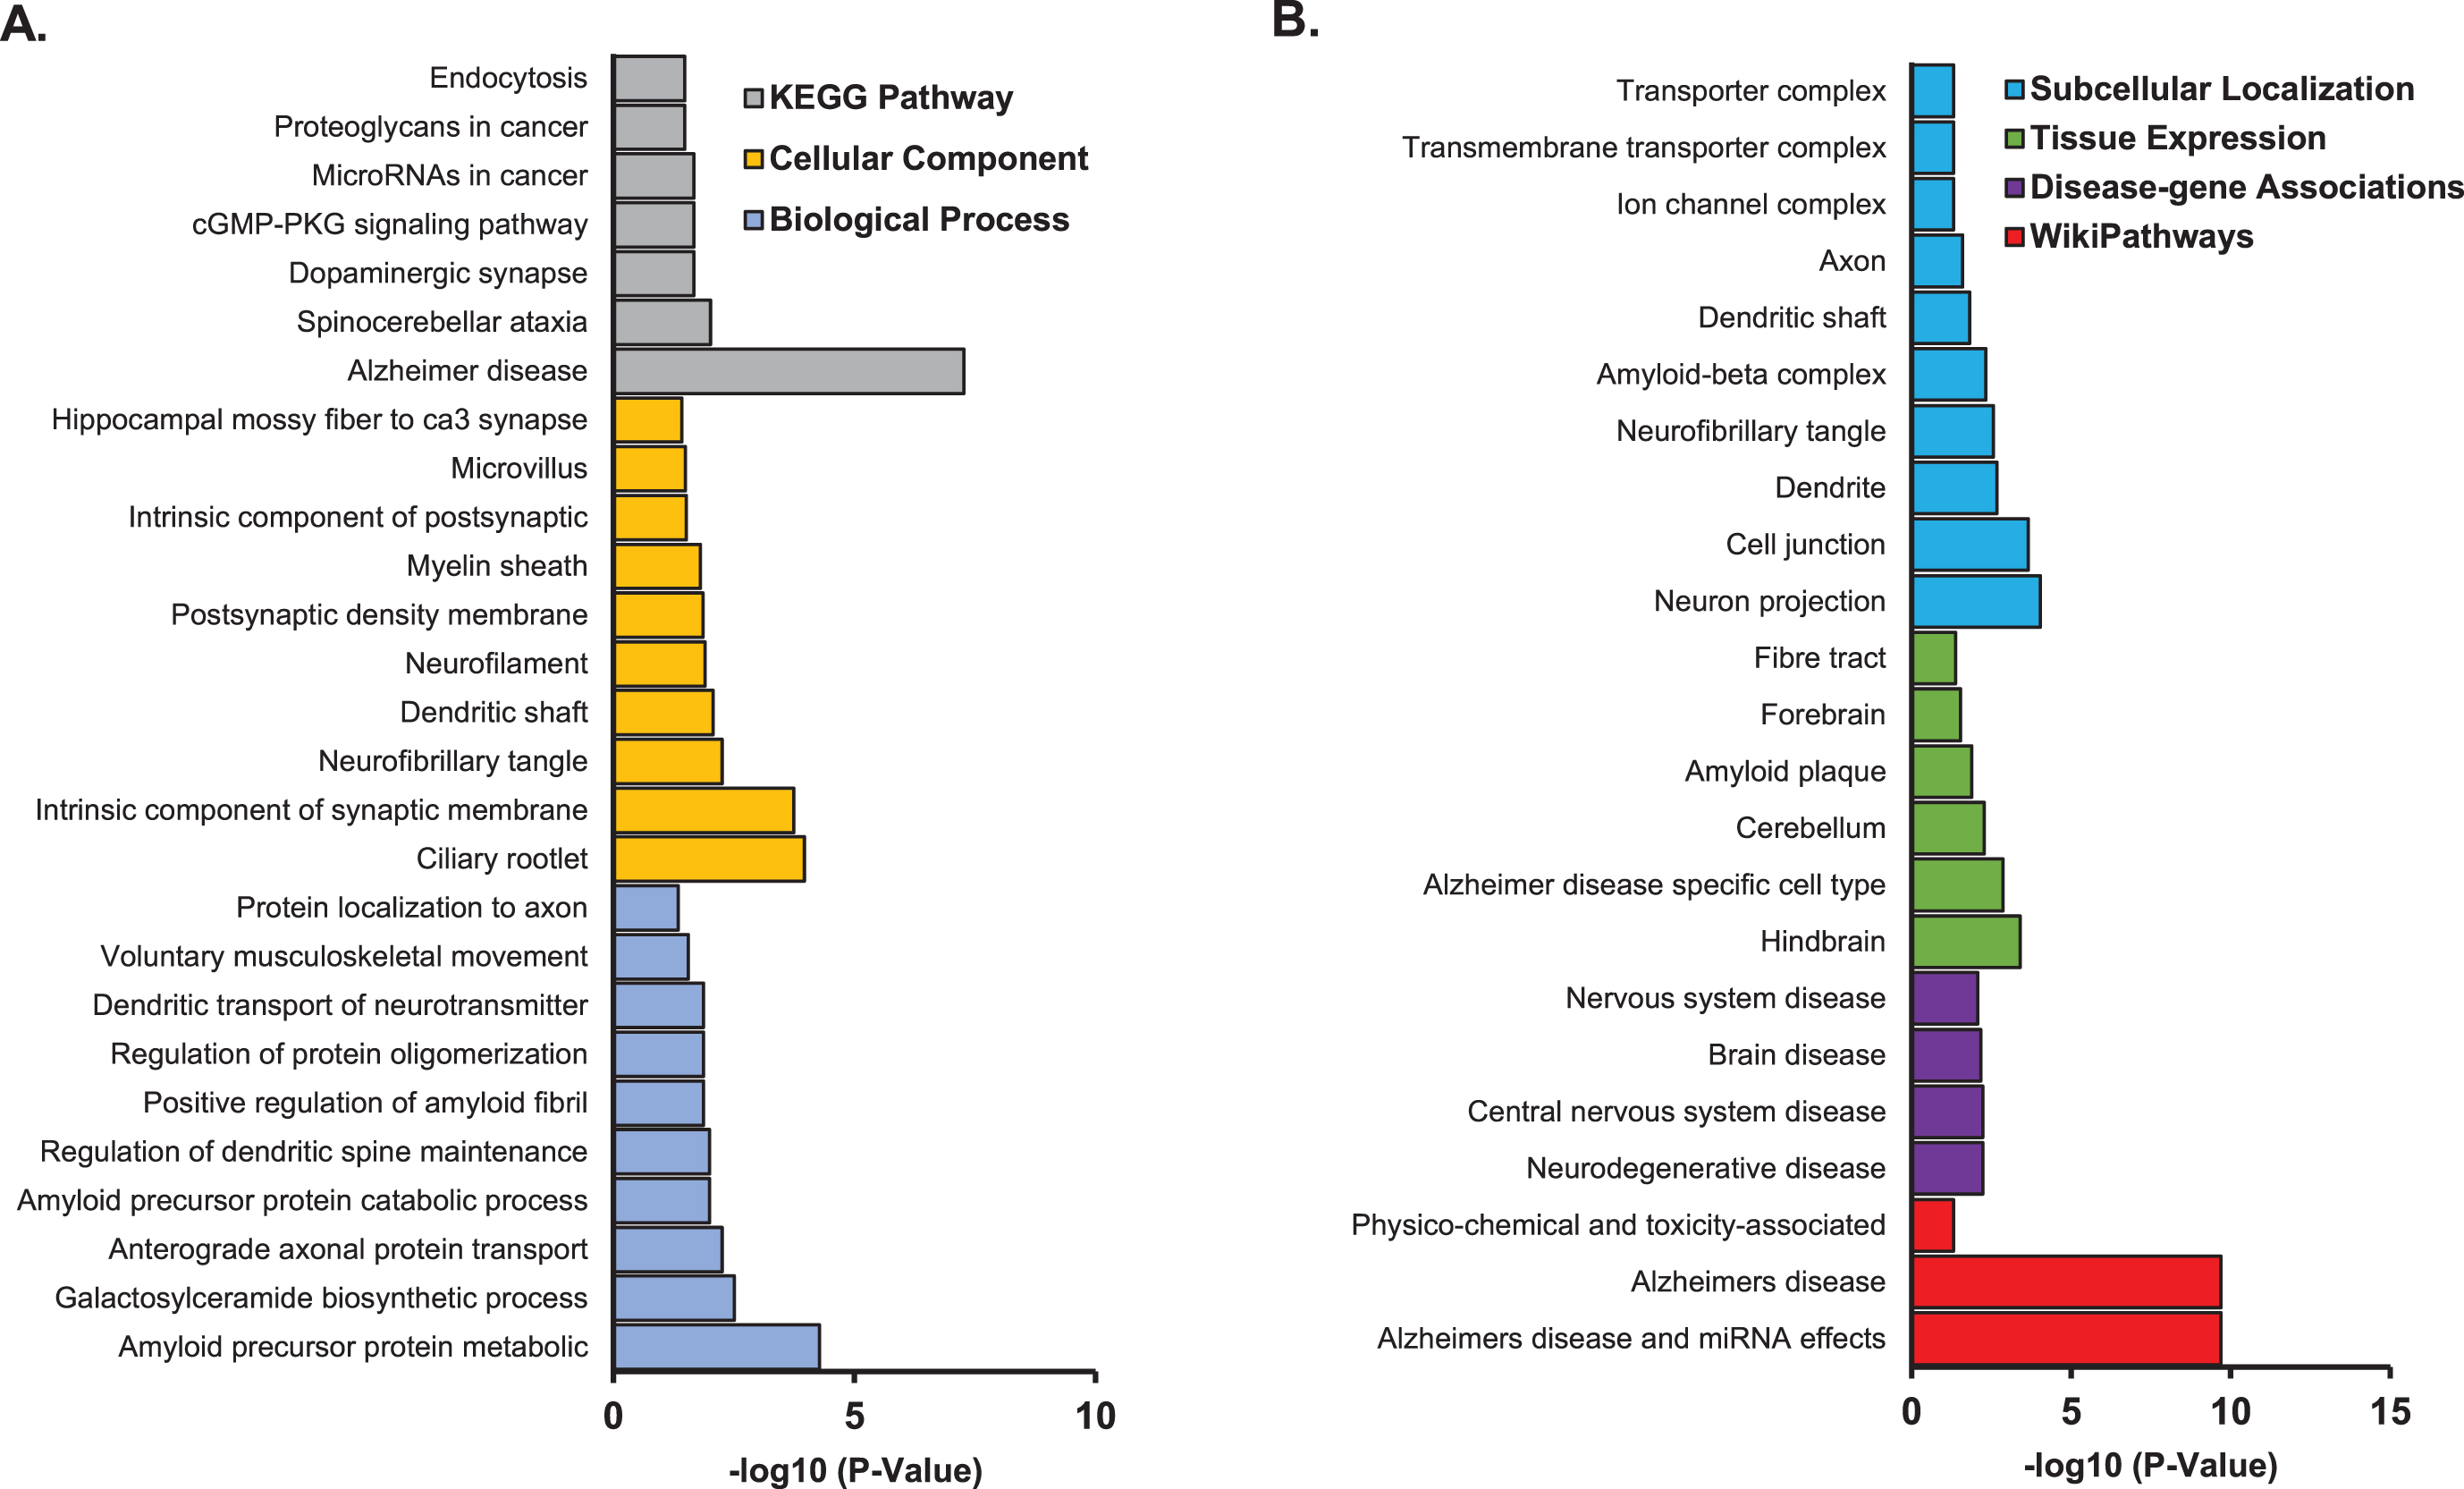
Pathway enrichment analysis was performed on the 298 genes from the 13 CNS tissues using STRING database (Supplementary Table 1). We found enrichment of amyloid precursor protein metabolic process (p = 5.3×10⁻⁵), galactosylceramide biosynthetic process (p = 3.1×10⁻³), and anterograde axonal protein transport (p = 1.3×10⁻²) in GO Term biological process pathways. Ciliary rootlet (p = 1.1×10⁻⁴), intrinsic component of synaptic membrane (p = 1.8×10⁻⁴), and neurofibrillary tangle (p = 5.6×10⁻³) were enriched in GO Term cellular component pathways. Alzheimer’s disease (p = 5.4×10⁻⁸), spinocerebellar ataxia (p = 9.6×10⁻³), and dopaminergic synapse pathways (p = 2.1×10⁻²) were enriched in KEGG pathways (Fig. 3A). Other AD related pathways were identified including amyloid precursor protein catabolic process (p = 1.0×10⁻²); regulation of protein oligomerization (p = 1.4×10⁻²); positive regulation of amyloid fibril formation (p = 1.3×10⁻²); AD and miRNA effects (p = 2.1×10⁻¹⁰); neurodegenerative disease (p = 5.9×10⁻³); amyloid plaque (p = 1.3×10⁻²); AD specific cell type (p = 1.4×10⁻³); and amyloid-β complex (p = 4.7×10⁻³) (Fig. 3B; Supplementary Table 2).
Fig. 3
Pathway enrichment analysis for genes identified with expression significantly associated with FAM222A in 13 brain tissues. A) GO/KEGG enrichment analysis; B) Subcellular localization, tissue expression, disease-gene associations mined from literature and wiki pathway enrichment analysis.
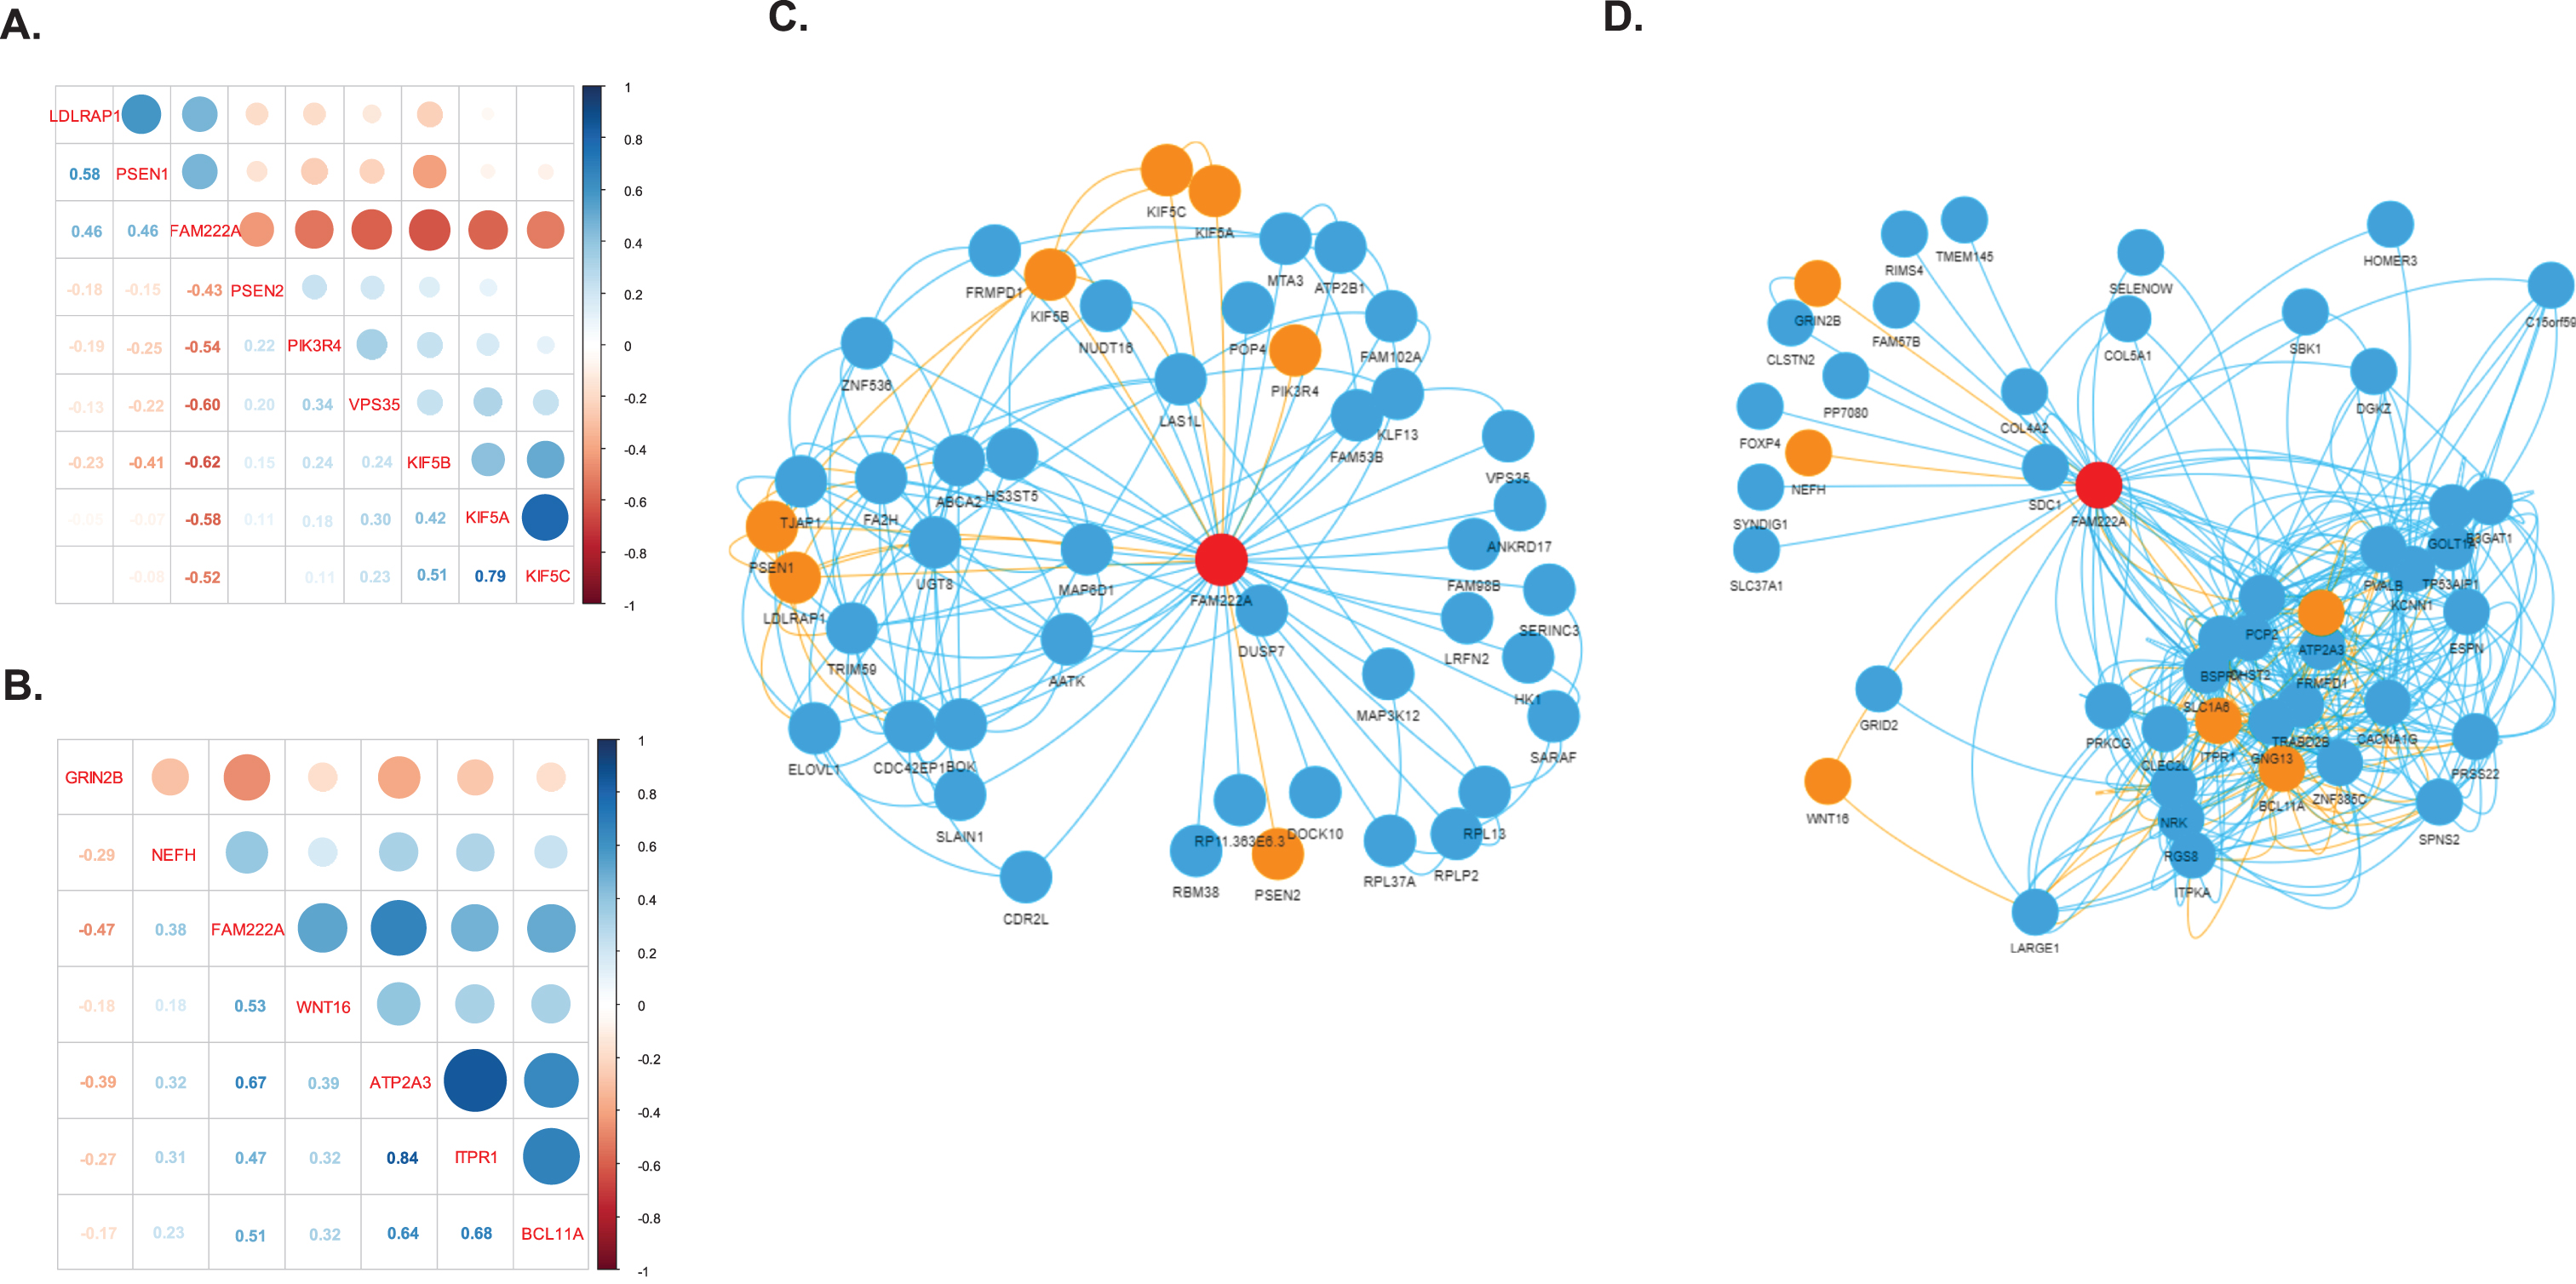
We identified 31 genes co-expressed with FAM222A in brain tissues that were also present in AD related pathways (Table 1). Eight out of 31 genes were identified in amygdala, in which PSEN2, PIK3R4, VPS35, KIF5A, KIF5B, and KIF5C were negatively correlated with FAM222A; and LDLRAP1 and PSEN1 were positively correlated with FAM222A (Fig. 4A). In the network analysis, PSEN2, PIK3R4, and VPS35 were independently correlated with FAM222A and not clustered with other AD related genes (Fig. 4C). KIF5A, KIF5B, KIF5C, LDLRAP1, and PSEN1 were intercorrelated (Fig. 4C). Interestingly, KIF5B was connected to LDLRAP1 through FA2H (Fig. 4C). FA2H is the fatty acid hydroxylase gene and defective FA2H was reported to lead to a novel form of neurodegeneration with brain iron accumulation [20], though FA2H is not present in AD-related pathways. Besides, KIF5B is also connected to PSEN1 through UGT8, which is a member of glycosyltransferase family 8 (Fig. 4C). Other studies have identified associations between mutations in UGT8 and sporadic amyotrophic lateral sclerosis. Specifically isolated dysfunction of a glycosyltransferase is sufficient to cause neurodegenerative disease [21]. Downregulated of UGT8 leads to disruption of myelin synthesis and further lead to neurodegeneration [22]. In cerebellar hemisphere, six genes were identified: NEFH and GRIN2B were independently correlated with FAM222A; and ATP2A3, ITPR1, and BCL11A were interconnected in one cluster (Fig. 4B). WNT16 connected with ATP2A3/ITPR1/BCL11A clusters through LARGE1 and CLEC2L (Fig. 4D). Both ATP2A3 and ITPR1 were involved in the cGMP and calcium signaling pathway, which was reported to be deregulated in AD patients and mouse models [23]. CLEC2L was reported to be downregulated in the entorhinal and temporal lobe cortex in AD patients [24]. The gene co-expression networks of genes identified to be significantly correlated with FAM222A in nine other brain tissues are shown in Supplementary Figure 1. SPPL3, SER1, and EIF3A connected TUBB2B and CLU in spinal cord. NIPAL4 and CDC42EP1 were identified to be significantly correlated with both FAM222A and AD-related gene LDLRAP1 in hippocampus. GLI1 co-expressed with CALM2 in basal ganglia putamen. The potential association between the functionality of these genes and AD merits further investigation.
Table 1
Significant genes correlated with FAM222A in brain tissues and present in Alzheimer’s disease related pathways
| Gene | Tissue | Pearson Correlation Coefficient | p | Sample Size | Pathway | Functional Category |
| ABCG1 | BRNSNG | 0.30 | 1.15E-06 | 114 | Amyloid precursor protein metabolic process; Amyloid precursor protein catabolic process | Biological Process |
| APOE | BRNNCC | 0.30 | 1.60E-06 | 202 | Amyloid precursor protein metabolic process; Amyloid precursor protein catabolic process; Alzheimer disease; Amyloid plaque; Alzheimer disease specific cell type; Amyloid-beta complex; Positive regulation of amyloid fibril formation | Biological Process; KEGG pathway; Tissue expression; Subcellular localization. |
| ATG101 | BRNHPP | 0.33 | 1.90E-06 | 165 | Alzheimer disease | KEGG Pathway |
| ATP2A3 | BRNCHB | 0.67 | 2.35E-14 | 175 | Alzheimer disease | KEGG Pathway |
| AXIN1 | BRNCTXA | 0.54 | 5.03E-10 | 205 | Alzheimer disease | KEGG Pathway |
| BACE1 | BRNCTXA | 0.41 | 2.24E-06 | 205 | Amyloid precursor protein metabolic process; Amyloid precursor protein catabolic process; Alzheimer disease; Amyloid plaque; Alzheimer disease specific cell type; Amyloid-beta complex | Biological Process; KEGG pathway; Tissue expression; Subcellular localization. |
| BCL11A | BRNCHB | –0.51 | 1.00E-06 | 175 | Regulation of protein oligomerization | Biological Process |
| CALM2 | BRNPTM | –0.54 | 1.92E-08 | 170 | Alzheimer disease | KEGG Pathway |
| CAPN2 | BRNSPC | 0.41 | 2.08E-07 | 126 | Alzheimer disease | KEGG Pathway |
| CLU | BRNSPC | –0.27 | 1.84E-06 | 126 | Neurofibrillary tangle; Positive regulation of amyloid fibril formation | Cellular Component; Subcellular Localization; Biological Process |
| FZD3 | BRNHPT | 0.35 | 3.94E-07 | 170 | Alzheimer disease | KEGG Pathway |
| GRIN2B | BRNCHB | –0.47 | 1.94E-06 | 175 | Alzheimer disease | KEGG Pathway |
| IRS1 | BRNSNG | –0.41 | 5.93E-07 | 114 | Alzheimer disease | KEGG Pathway |
| ITPR1 | BRNCHB | 0.47 | 1.29E-06 | 175 | Alzheimer disease | KEGG Pathway |
| KIF5A | BRNAMY | –0.58 | 2.90E-08 | 129 | Alzheimer disease | KEGG Pathway |
| KIF5B | BRNAMY | –0.62 | 1.74E-09 | 129 | Alzheimer disease | KEGG Pathway |
| KIF5C | BRNAMY | –0.52 | 1.62E-06 | 129 | Alzheimer disease | KEGG Pathway |
| LDLRAP1 | BRNAMY | 0.46 | 3.87E-08 | 129 | Amyloid precursor protein metabolic process | Biological Process |
| LDLRAP1 | BRNHPP | 0.36 | 1.49E-06 | 165 | Amyloid precursor protein metabolic process | Biological Process |
| MTOR | BRNCHA | –0.35 | 2.64E-08 | 209 | Alzheimer disease | KEGG Pathway |
| NEFH | BRNCHB | –0.38 | 4.22E-06 | 175 | Neurofibrillary tangle | Cellular Component; Subcellular Localization |
| NEFM | BRNSNG | –0.32 | 5.37E-06 | 114 | Neurofibrillary tangle | Cellular Component; Subcellular Localization |
| PIK3R4 | BRNAMY | –0.54 | 6.12E-07 | 129 | Alzheimer disease | KEGG Pathway |
| PSEN1 | BRNAMY | 0.46 | 2.98E-06 | 129 | Positive regulation of amyloid fibril formation; Amyloid precursor protein metabolic process; Amyloid precursor protein catabolic process; Alzheimer disease; Amyloid plaque; Alzheimer disease specific cell type; Neurofibrillary tangle; Amyloid-beta complex | Biological Process; KEGG Pathway; Tissue Expression; Subcellular Localization |
| PSEN2 | BRNAMY | –0. | 2.22E-06 | 129 | Amyloid precursor protein metabolic process; Amyloid precursor protein catabolic process; Alzheimer’s disease; Alzheimer’s disease specific cell type; Amyloid-beta complex | Biological Process; KEGG pathway; Tissue Expression; Subcellular Localization. |
| PSMD12 | BRNCDT | –0.31 | 1.04E-06 | 194 | Alzheimer disease | KEGG Pathway |
| RTN4 | BRNPTM | 0.33 | 1.08E-06 | 170 | Alzheimer disease | KEGG Pathway |
| TUBA1A | BRNPTM | 0.32 | 1.67E-06 | 170 | Alzheimer disease | KEGG Pathway |
| TUBB2B | BRNSPC | –0.44 | 1.82E-08 | 126 | Alzheimer disease | KEGG Pathway |
| VPS35 | BRNAMY | –0.45 | 1.21E-07 | 129 | Regulation of protein oligomerization | Biological Process |
| WNT16 | BRNCHB | 0.37 | 2.95E-08 | 175 | Alzheimer disease | KEGG Pathway |
| ZDHHC1 | BRNCHA | 0.33 | 1.06E-06 | 209 | Regulation of protein oligomerization | Biological Process |
BRNSNG, Brain - Substantia nigra; BRNNCC, Brain - Nucleus accumbens (basal ganglia); BRNHPP, Brain - Hippocampus; BRNCHB, Brain - Cerebellar hemisphere; BRNCTXA, Brain - Cortex; BRNPTM, Brain - Putamen (basal ganglia); BRNSPC, Brain - Spinal cord (cervical c-1); BRNHPT, Brain - Putamen (basal ganglia); BRNAMY, Brain - Amygdala; BRNCHA, Brain - Cerebellum; BRNCDT, Brain - Caudate (basal ganglia).
Fig. 4
Gene co-expression network. A, B) Correlation matrix plot of genes identified to be significantly co-expressed with FAM222A in brain amygdala (A) and cerebella hemisphere (B) and presented in the KEGG Alzheimer’s disease pathway. C, D) Gene co-expression network of genes identified to be significantly co-expressed with FAM222A in brain amygdala (C), and cerebella hemisphere (D). Nodes represent the gene; edge indicates the pairs of genes are significantly co-expressed (Pearson correlation p < 2.5×10⁻⁶) in the corresponding brain tissue. The red node is FAM222A, the orange node are the genes presented in the KEGG Alzheimer’s disease pathway.
Replication of co-expression between AD-related pathway genes and FAM222A in the Aging, Dementia and TBI Study
The scientific goals of GTEx project required that both donors and their biospecimen present with no evidence of disease [25]. The donor ages ranged from 20 to 79 years, with traumatic injury, cerebrovascular, heart disease and liver, renal respiratory diseases as the primary causes of death [17]. Previous studies have suggested that gene expression profiles in pathological conditions in AD are distinct from heathy tissues [16, 26, 27]. To further study whether the co-expression of AD pathway genes with FAM222A can be replicated in brain tissues from AD patients, we conducted gene co-expression analysis of 31 AD pathway related genes with FAM222A in brain tissues from 107 AD, dementia, or TBI patients and their age-matched controls from the ACT study. The results showed that 25 out of 31 AD genes co-expressed with FAM222A in GTEx subjects can be replicated with consistent Pearson correlation coefficient direction and significant p-value in Aging, Dementia and TBI study (Figs. 1, 5, Table 2). Interestingly, the absolute Pearson correlation coefficients for 21 genes obtained in replication data are larger than those found in the GTEx study samples (Fig. 5).
Fig. 5
Scatterplot of Pearson correlation coefficients between AD-pathway related genes expression levels with FAM222A obtained from GTEx data and ACT data.
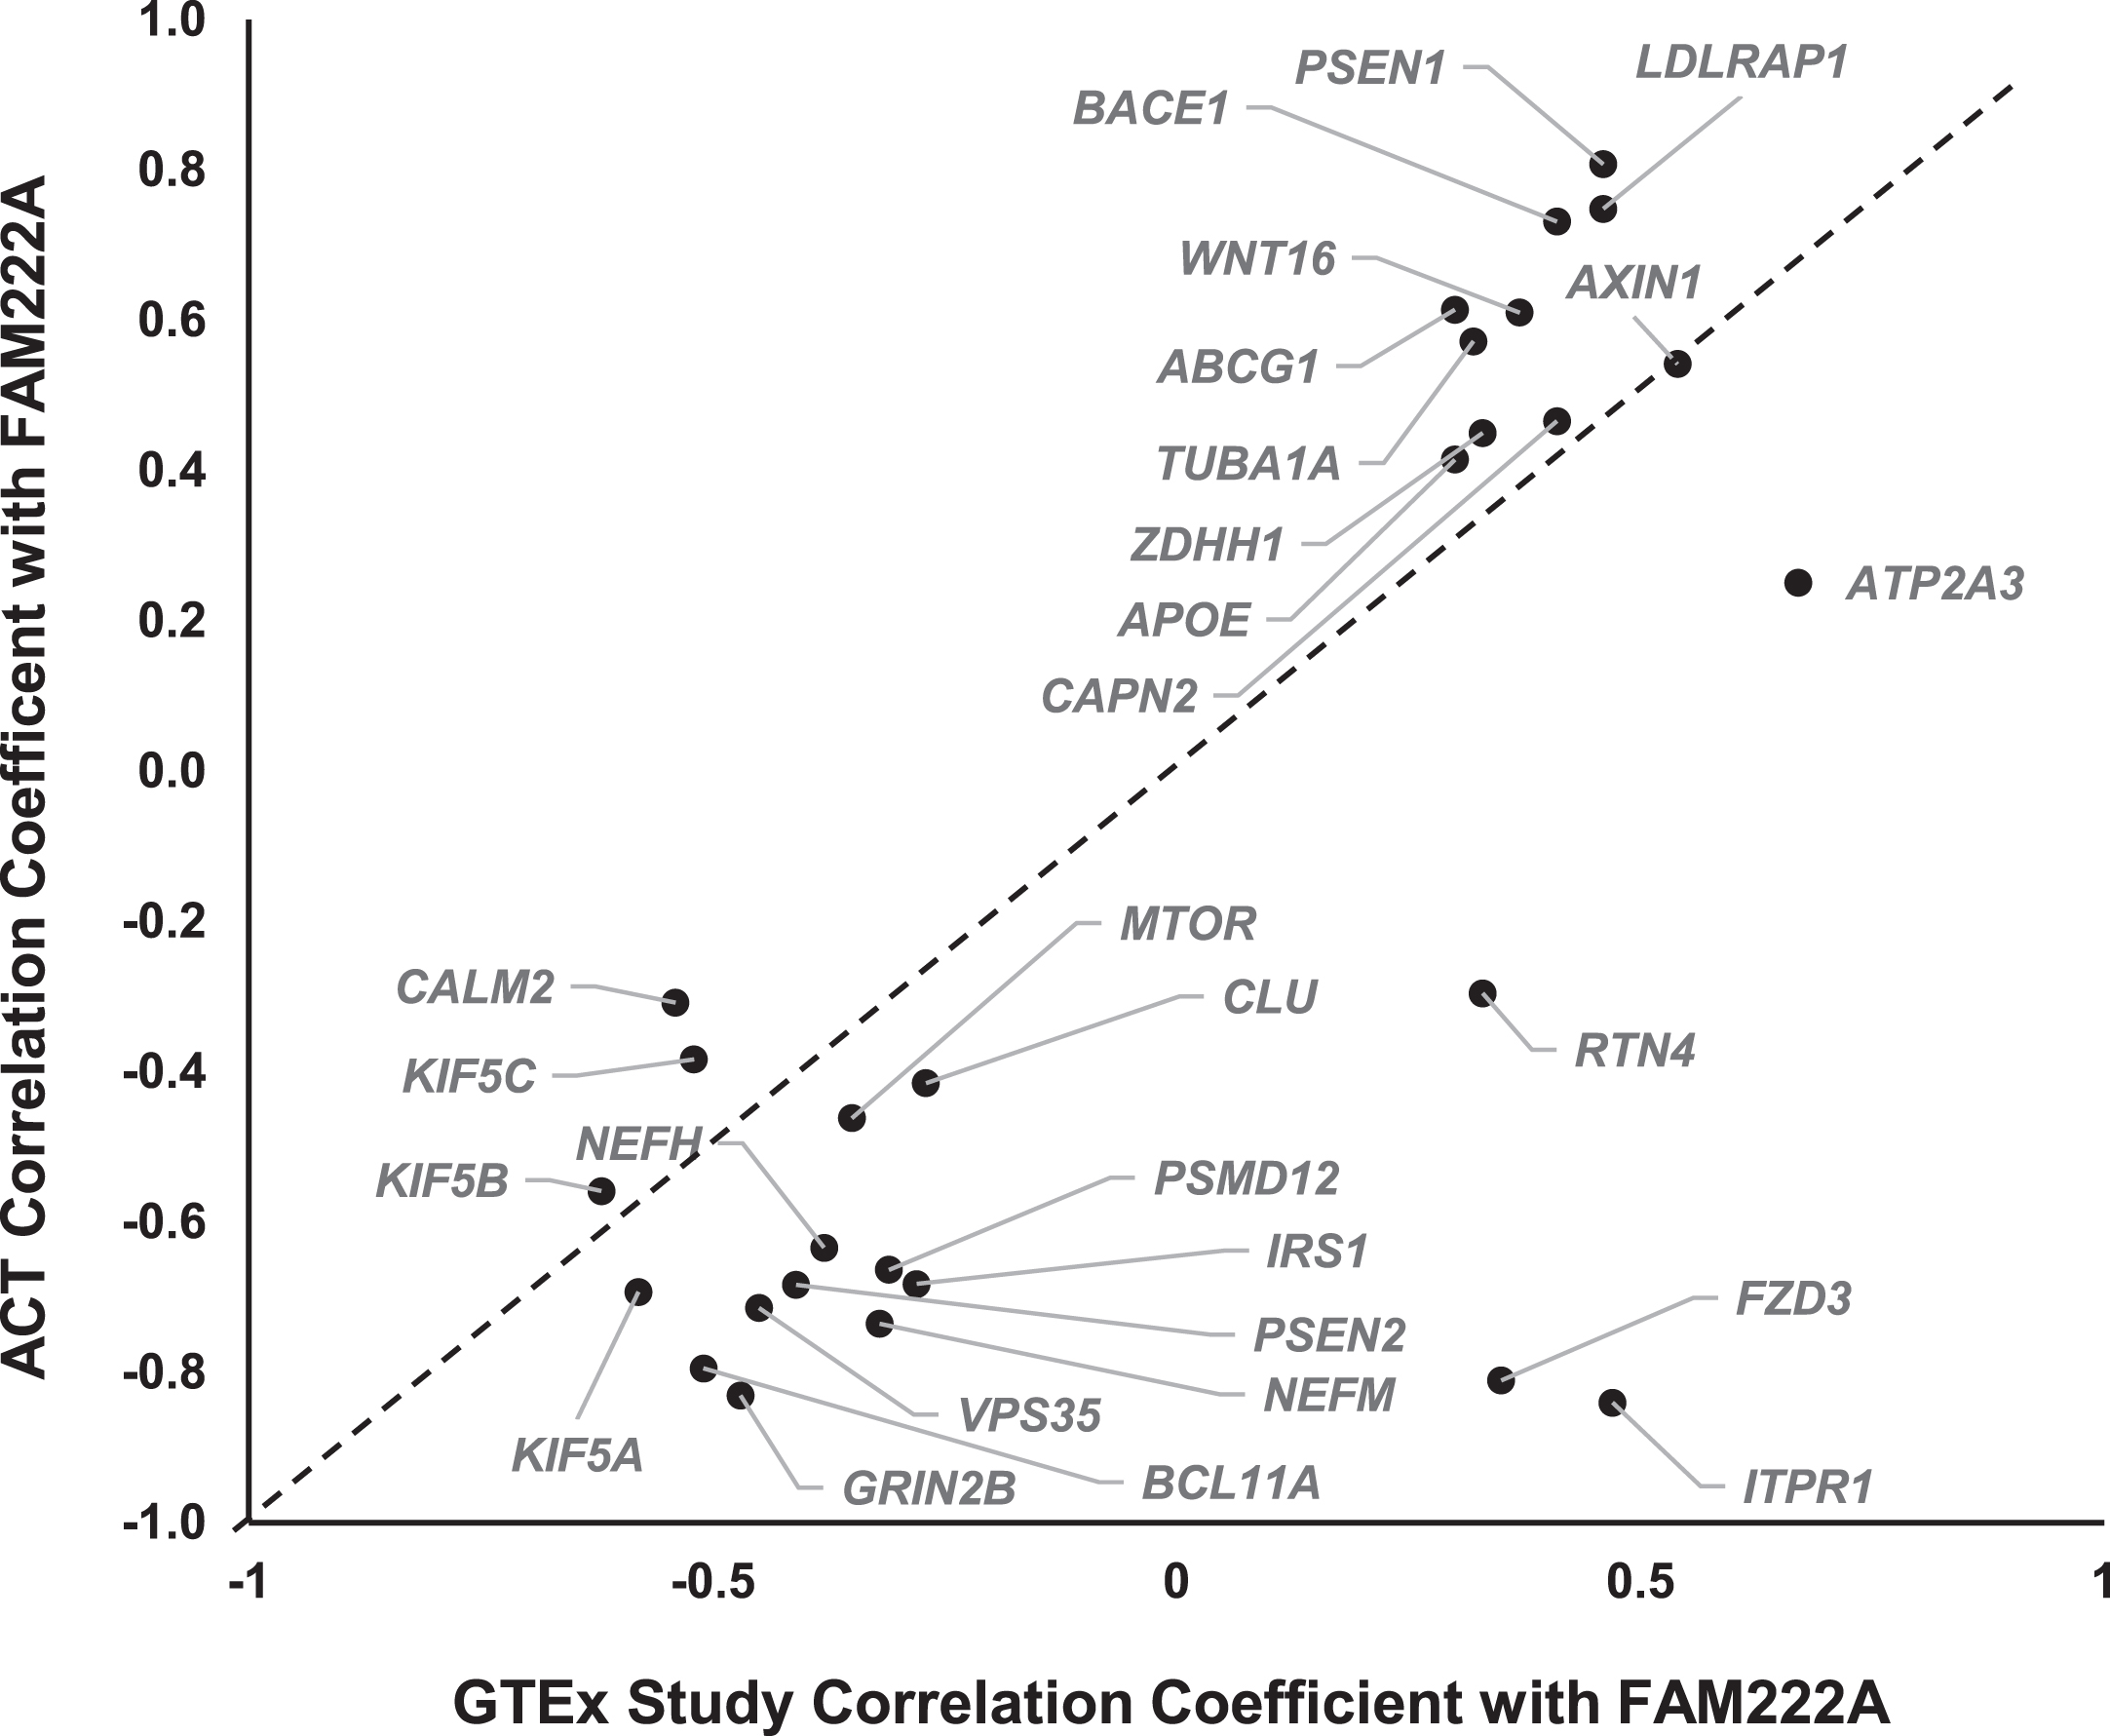
Table 2
AD pathway genes identified to be significantly correlated with FAM222A expression levels in ACT study
| TCx | FWM | HIP | PCx | |||||
| Gene | Correlation Coefficient | p | Correlation Coefficient | p | Correlation Coefficient | p | Correlation Coefficient | p |
| ABCG1 | 0.49 | 2.93E-07 | 0.61 | 5.96E-11 | 0.49 | 4.09E-07 | 0.53 | 5.22E-08 |
| APOE | –0.09 | 4.00E-01 | 0.41 | 3.64E-05 | 0.21 | 4.12E-02 | 0.18 | 9.36E-02 |
| ATP2A3 | –0.06 | 5.83E-01 | 0.25 | 1.54E-03 | 0.24 | 2.19E-03 | –0.11 | 2.89E-01 |
| AXIN1 | 0.36 | 2.70E-04 | 0.54 | 2.07E-08 | 0.37 | 2.69E-04 | 0.40 | 1.01E-04 |
| BACE1 | 0.50 | 1.11E-07 | 0.73 | 8.67E-17 | 0.33 | 1.16E-03 | 0.63 | 3.03E-11 |
| BCL11A | –0.19 | 6.07E-02 | –0.79 | 2.05E-21 | –0.07 | 5.24E-01 | –0.20 | 5.26E-02 |
| CALM2 | –0.31 | 1.93E-03 | –0.13 | 2.12E-01 | –0.27 | 7.33E-03 | –0.15 | 1.59E-01 |
| CAPN2 | 0.15 | 1.34E-01 | 0.47 | 2.54E-06 | 0.12 | 2.42E-01 | 0.07 | 5.26E-01 |
| CLU | –0.05 | 6.12E-01 | –0.42 | 3.51E-05 | 0.02 | 8.66E-01 | –0.01 | 9.59E-01 |
| GRIN2B | –0.47 | 1.07E-06 | –0.83 | 7.28E-25 | –0.39 | 1.22E-04 | –0.50 | 3.59E-07 |
| IRS1 | 0.13 | 1.93E-01 | –0.68 | 4.42E-14 | –0.24 | 1.77E-02 | –0.10 | 3.42E-01 |
| KIF5A | 0.09 | 3.86E-01 | –0.69 | 1.43E-14 | 0.07 | 5.21E-01 | –0.11 | 2.90E-01 |
| KIF5B | –0.50 | 1.06E-07 | –0.56 | 5.97E-09 | –0.40 | 5.82E-05 | –0.36 | 4.95E-04 |
| KIF5C | –0.16 | 1.08E-01 | –0.38 | 1.48E-04 | –0.21 | 4.36E-02 | –0.25 | 1.59E-02 |
| LDLRAP1 | 0.66 | 1.40E-13 | 0.73 | 1.61E-16 | 0.67 | 1.36E-13 | 0.75 | 1.53E-17 |
| MTOR | –0.19 | 5.68E-02 | –0.46 | 3.17E-06 | –0.16 | 1.23E-01 | –0.07 | 4.90E-01 |
| NEFH | –0.06 | 5.51E-01 | –0.63 | 9.10E-12 | –0.10 | 3.46E-01 | –0.10 | 3.66E-01 |
| NEFM | –0.17 | 9.95E-02 | –0.74 | 4.81E-17 | –0.05 | 6.34E-01 | –0.17 | 1.05E-01 |
| PSEN1 | 0.61 | 1.34E-11 | 0.81 | 1.43E-22 | 0.49 | 6.52E-07 | 0.64 | 8.43E-12 |
| PSEN2 | –0.24 | 1.78E-02 | –0.68 | 5.16E-14 | –0.26 | 1.01E-02 | –0.06 | 5.57E-01 |
| PSMD12 | –0.35 | 4.66E-04 | –0.66 | 4.21E-13 | –0.41 | 3.44E-05 | –0.39 | 1.08E-04 |
| TUBA1A | 0.07 | 4.63E-01 | 0.57 | 2.10E-09 | 0.01 | 9.29E-01 | 0.29 | 5.54E-03 |
| VPS35 | –0.36 | 2.20E-04 | –0.71 | 9.16E-16 | –0.45 | 4.19E-06 | –0.39 | 1.40E-04 |
| WNT16 | 0.17 | 9.94E-02 | 0.61 | 7.55E-11 | 0.02 | 8.32E-01 | 0.24 | 2.14E-02 |
| ZDHHC1 | 0.09 | 3.95E-01 | 0.45 | 7.81E-06 | 0.01 | 9.08E-01 | 0.10 | 3.22E-01 |
TCx, temporal neocortex; FWM, white matter of forebrain; HIP, hippocampus; PCx, parietal neocortex.
Among the 25 replicated genes, ABCG1, AXIN1, GRIN2B, BACE1, LDLRAP1, PSEN1, and VPS35 were significantly correlated with FAM222A (p < 4.0×10⁻⁴) in all four brain regions (temporal neocortex, white matter of forebrain, hippocampus, and parietal neocortex) (Table 2). Between expression levels of FAM222A and the seven genes, there was no different expression patterns of those genes among patients with vascular condition, multiple etiologies, other cause induced TBI, AD, and non-dementia controls (Supplementary Figure 2). Among the seven genes, PSEN1, ABCG1, LDLRAP1, and BACE1 all directly involved in AβPP metabolic process and all of them positively correlated with FAM222A expression. ABCG1 gene encodes a cholesterol transporter protein that has been reported to mediate Aβ production [28]. Expression of ABCG1 increased Aβ production for both the amyloidogenic and nonamyloidogenic pathways [28]. PSEN1 encodes the catalytic subunit of the AβPP-processing enzyme γ-secretase, causing familiar AD [29]. BACE1 functions as the primary β-secretase and is essential for Aβ production [30]. AXIN1 involved in the Wnt signaling pathway, whose deregulation lead to synaptic vulnerability in AD [31].
DISCUSSION
Co-expressed genes are usually co-regulated by the same set of regulators and likely involved in related biological processes. Importantly, gene co-expression analysis of healthy samples has been successfully used to reveal novel genes and molecular pathways underlying brain disorders [32]. Seeking to elucidate the underlying molecular mechanism and identify biologically relevant genes associated with FAM222A in a genome-wide manner, we performed gene co-expression analysis for FAM222A using GTEx RNA-seq sequence data of multiple human tissues. The analyses identified 298 FAM222A co-expression genes representing distinct biological pathways largely in the brain and spinal cord that have a molecular connection of FAM222A. Among those CNS genes co-expressed with FAM222A, many neurodegeneration-related genes, especially multiple AD-associated genes, were enriched. As co-expression analysis identifies correlations, this finding indicates that FAM222A and AD-associated genes can be active simultaneously in similar biological processes, and therefore corroborates the relevance of FAM222A to AD. Noteworthily, although our gene co-expression analysis does not necessarily confer information about the casual role of FAM222A, or distinguish between regulatory and regulated genes, it does highlight a potential complex interplay of FAM222A and other AD or neurodegeneration-related genes in healthy brains. We further validated many of the correlations between AD-associated genes with FAM222A in the Aging, Dementia and TBI Study. In this replication study, we found that the magnitude of the correlations for most of the validated genes were larger than GTEx, suggesting that the interplays between FAM222A with other AD-related genes increased in aging, AD, or TBI damaged brain tissues. How the connected biological processes changes in aging and pathological tissues change will need further investigation.
Aggregatin, the protein encoded by FAM222A, was reported to be a plaque core protein directly binding Aβ and facilitating Aβ aggregation, a process thought to be central in AD [4]. The coding variants on FAM222A were found significantly associated with longitudinal increase of brain amyloid deposition [4]. In our analysis, we found that FAM222A expression level was significantly correlated with multiple amyloid precursor protein metabolic process genes including PSEN1, PSEN2, BACE1, APOE, LDLRAP1, and ABCG1 (Table 2). For PSEN1, ABCG1, LDLRAP1, and BACE1, the positive correlation with FAM222A were consistently significant in all four brain tissues from hippocampus and neocortex in the replication aging samples (Supplementary Figure 2). Aggregatin directly binds Aβ and facilitates Aβ aggregation [4]. Aggregating puncta appears concurrently with amyloid plaques and should accumulate in plaques before or concurrent with rather than after the well formation of plaques [4]. It is possible that Aggregatin enhances amyloid deposition which further induces upregulation of Aβ metabolic process pathway and Aβ production.
Another gene identified to be consistently correlated with FAM222A in four brain tissues is VPS35. VPS35, vacuolar sorting protein, is a major component of the retromer complex and important for endosome-to-Golgi retrieval of membrane proteins [33]. VPS35/retromer deficiency was found in the hippocampus of AD patients [34]. It was reported that microglial VPS35-deficiency precipitated AD pathology by impairing disease-associated microglial (DAM) development and DAM mediated Aβ uptake and clearance [35]. In the Aging, Dementia and TBI study, we did not find different expression of VPS35 or FAM222A in 35 AD patients based on the DSM-IV diagnostic criterion. Lower level of VPS35 expression led to decreased DAM-mediated Aβ clearance, further induced increased Aggregatin-facilitated Aβ aggregation. It is interesting that the correlation coefficient between VPS35 and FAM222A in healthy brain tissues from GTEx data was –0.45, whereas the correlation coefficient in aged and diseased brain tissues from the Aging, Dementia and TBI study was –0.71, implying the level of genes interplay and connected biological process increased in AD pathological tissues.
AXIN1 also consistently correlated with FAM222A in four brain tissues in the Aging, Dementia and TBI samples. This gene encodes a cytoplasmic protein which contains a regulation of G-protein signaling (RGS) domain and a disheveled and axin (DIX) domain. The protein functions as a negative regulator of the Wnt signaling pathway [36]. The presenilin proteins were also reported to be negative regulators of canonical Wnt signaling [37]. Genetic common variants in the Wnt receptor LRP6 have been reported to be associated with AD in population-based linkage analyses, and functional study showed the risk alleles lead to decreased β-catenin signaling [38]. Wnt signaling was also reported to inhibit the metabolism of AβPP and enhance phosphorylation of the tau protein [39]. The correlation coefficient between AXIN1 and FAM222A in GTEx and the Aging, Dementia and TBI samples are both 0.54, suggesting that the effects of Wnt signaling to AβPP metabolism might not change in the pathological brain.
Co-expression networks constructed from RNAseq data can identify groups of genes with a tendency to co-activate in the same biological process and further infer gene function. The differential co-expression analysis usually identified genes with varying co-expression partners under different conditions, such as disease states and tissue types [12, 40–42]. The regulatory mechanism of the co-expressed genes can be protein-protein interactions, shared transcription factors (TFs) and their targets, or even similar methylation patterns [43, 44]. The disease-related genes usually have tissue-specific abnormalities [45, 46]. Analyzing the disease-associated module in tissue-specific gene co-expression network can identify potential disease genes. In our gene co-expression network in brain amygdala, FA2H was found correlated with LDLRAP1, KIF5B, and FAM222A (Fig. 3C). FA2H encodes a fatty acid 2-hydroxylase essential for the proper functioning of the nervous system. It introduces a 2-hydroxyl group to the N-acyl chain of a major myelin lipid, galactosylceramide. FA2H knockout mice were morphologically and functionally normal [47]. However, the absence of FA2H lead to gradual demyelination and axonal degeneration [47]. Another gene presented in the gene co-expression network module in brain amygdala is UGT8, which correlated with PSEN1, KIF5B, and FAM222A. A study investigating molecular subtypes of AD in the Mount Sinai/JJ Peters VA Medical Center Brain Bank (MSBB-AD) study and the Religious Orders Study-Memory and Aging Project (ROSMAP) reported UGT8 had a consistent de-regulation direction in multiple brain regions in both the Aβ-predominant and tau NFT-predominant AD subtypes [48]. A genetic epidemiology study conducting family-based linkage and association analyses reported a non-synonymous SNP in UGT8 was highly associated with musical ability [49]. Interestingly, some patients with AD have been reported to preserve musical ability long after losing all other cognitive functions [50]. UGT8 encodes UDP glycosyltransferase 8, an enzyme involved in complex lipid biosynthesis in the myelinating oligodendrocytes [51] and clearance of long-chain ceramides (lcCer). lcCer clearance in neurons was regulated by glucosylceramide synthase (GCS) [52]. Study showed that significant downregulation in glial GCS expression was associated with an increase in UTG8 expression level in AD [53]. Further studies of the roles of FA2H, UTG8, lipid metabolism and myelin synthesis in AD are needed. These studies of the two genes suggest that potential disease genes can be identified through highlighting genes that are correlated with multiple disease genes in gene co-expression network analysis.
The burden test identified eight rare missense variants on FAM222A associated with annual longitudinal changes of CSF phosphorylated tau level in 273 ADNI subjects (p = 0.039) [4]. We found FAM222A co-expressed with three neurofibrillary tangle (NFT) genes, NEFH, NEFM, and CLU. NEFH and NEFM encode neurofilament heavy and medium chains. Neurofilament accumulations were present in axons of lower motor neurons in amyotrophic lateral sclerosis [54], within Lewy bodies in Parkinson’s disease dopaminergic neurons [55] and overlapped with tau NFTs in brains affected by AD [56]. The protein encoded by CLU, clusterin, is a secreted chaperone [57]. Multiple studies have suggested that clusterin interacts and binds to Aβ, alters aggregation and promote Aβ clearance, suggesting a neuroprotective role [58–60]. However, several other studies show that clusterin may actually inhibit the clearance of Aβ and function as a key mediator regulating Aβ-induced neurotoxicity [61–63]. In genome-wide association studies, CLU is the third most significant genetic risk factor for late onset AD and several variants have been identified in CLU. In the AD entorhinal cortex, clusterin co-localized with NFTs, and neurons containing NFTs showed increased expression of CLU [66]. In our study, we found FAM222A negatively correlated with NEFH, NEFM, and CLU in healthy brains from GTEx data (Table 1). In the Aging, Dementia and TBI study, NEFH, NEFM, and CLU were all replicated to be significantly negatively correlated with FAM222A in the forebrain white matter (Table 2). Further studies to assess the physical interaction between Aggregatin and tau, neurofilaments and clusterin, and the role of Aggregatin in tau and neurofilaments aggregation will be important.
In this study, we performed genome-wide co-expression analysis specifically for FAM222A and identified multiple AD, Aβ complex, and NFTs-related pathways. Results indicate that Aggregatin is involved in the accumulation of multiple neurodegenerative disease-specific proteins. This work will guide the future efforts to understand the role of Aggregatin in protein aggregation and pathology of neurodegenerative diseases. There are several limitations to this study. Most notably, the GTEx brain tissues samples are from a variety of ages, with 60% between 60–70 years, 25% between 50–59 years, and 15% between 20–39 years, whereas the validation data sample was from an elder population ranging from 78 to 100+ years. Although we found the absolute correlation coefficient increased in the aging samples, we did not evaluate how the identified gene pairs correlations change with age in GTEx data due to sample size limitations. In the gene co-expression network analysis, because we only input genes correlated with FAM222A, we did not employ the weighted gene co-expression network (WGCNA) method but defined the adjacency matrix using a strict hard threshold of Pearson correlation p-values <2.5×10⁻⁶. The biological function and pathological roles of proteins encoded by genes identified to be simultaneously correlated with both FAM222A and other AD genes need to be further validated and investigated.
ACKNOWLEDGMENTS
The authors have no acknowledgments to report.
FUNDING
The authors received no specific funding for this work.
CONFLICT OF INTEREST
Dr. George Perry is in Synaptogenics Biotech company Scientific Advisory Board and Equity and Nervgen Scientific Advisory Board. Dr. Perry is an Editorial Board Member of this journal but was not involved in the peer-review process nor had access to any information regarding its peer-review.
All other authors have no conflict of interest to report.
DATA AVAILABILITY
All relevant data are within the manuscript and its Supporting Information files.
SUPPLEMENTARY MATERIAL
[1] The supplementary material is available in the electronic version of this article: https://dx.doi.org/10.3233/JAD-221241.
REFERENCES
[1] | Gatz M , Pedersen NL , Berg S , Johansson B , Johansson K , Mortimer JA , Posner SF , Viitanen M , Winblad B , Ahlbom A ((1997) ) Heritability for Alzheimer’s disease: The study of dementia in Swedish twins. J Gerontol A Biol Sci Med Sci 52: , M117–M125. |
[2] | Morris JC ((2005) ) Early-stage and preclinical Alzheimer disease. Alzheimer Dis Assoc Disord 19: , 163–165. |
[3] | Jack CR Jr, Knopman DS , Jagust WJ , Petersen RC , Weiner MW , Aisen PS , Shaw LM , Vemuri P , Wiste HJ , Weigand SD , Lesnick TG , Pankratz VS , Donohue MC , Trojanowski JQ ((2013) ) Tracking pathophysiological processes in Alzheimer’s disease: An updated hypothetical model of dynamic biomarkers. Lancet Neurol 12: , 207–216. |
[4] | Yan T , Liang J , Gao J , Wang L , Fujioka H , Alzheimer Disease Neuroimaging Initiative, Zhu X , Wang X ((2020) ) FAM222A encodes a protein which accumulates in plaques in Alzheimer’s disease. Nat Commun 11: , 411. |
[5] | Hibar DP , Stein JL , Renteria ME , Arias-Vasquez A , Desrivieres S , Jahanshad N , Toro R , Wittfeld K , Abramovic L , Andersson M , et al. ((2015) ) Common genetic variants influence human subcortical brain structures. Nature 520: , 224–229. |
[6] | Lambert JC , Ibrahim-Verbaas CA , Harold D , Naj AC , Sims R , Bellenguez C , DeStafano AL , Bis JC , Beecham GW , Grenier-Boley B , et al. ((2013) ) Meta-analysis of 74,046 individuals identifies 11 new susceptibility loci for Alzheimer’s disease. Nat Genet 45: , 1452–1458. |
[7] | Butte AJ , Kohane IS (1999) Unsupervised knowledge discovery in medical databases using relevance networks. Proc AMIA Symp, 711-715. |
[8] | Hu RT , Yu Q , Zhou SD , Yin YX , Hu RG , Lu HP , Hu BL ((2020) ) Co-expression network analysis reveals novel genes underlying Alzheimer’s disease pathogenesis. Front Aging Neurosci 12: , 605961. |
[9] | Liang JW , Fang ZY , Huang Y , Liuyang ZY , Zhang XL , Wang JL , Wei H , Wang JZ , Wang XC , Zeng J , Liu R ((2018) ) Application of weighted gene co-expression network analysis to explore the key genes in Alzheimer’s disease. J Alzheimers Dis 65: , 1353–1364. |
[10] | Seyfried NT , Dammer EB , Swarup V , Nandakumar D , Duong DM , Yin L , Deng Q , Nguyen T , Hales CM , Wingo T , Glass J , Gearing M , Thambisetty M , Troncoso JC , Geschwind DH , Lah JJ , Levey AI ((2017) ) A multi-network approach identifies protein-specific co-expression in asymptomatic and symptomatic Alzheimer’s disease. Cell Syst 4: , 60–72 e64. |
[11] | van Dam S , Vosa U , van der Graaf A , Franke L , de Magalhaes JP ((2018) ) Gene co-expression analysis for functional classification and gene-disease predictions. Brief Bioinform 19: , 575–592. |
[12] | Pierson E , Consortium GT , Koller D , Battle A , Mostafavi S , Ardlie KG , Getz G , Wright FA , Kellis M , Volpi S , Dermitzakis ET ((2015) ) Sharing and specificity of co-expression networks across 35 human tissues. PLoS Comput Biol 11: , e1004220. |
[13] | Negi SK , Guda C ((2017) ) Global gene expression profiling of healthy human brain and its application in studying neurological disorders. Sci Rep 7: , 897. |
[14] | Loring JF , Wen X , Lee JM , Seilhamer J , Somogyi R ((2001) ) A gene expression profile of Alzheimer’s disease. DNA Cell Biol 20: , 683–695. |
[15] | Lanke V , Moolamalla STR , Roy D , Vinod PK ((2018) ) Integrative analysis of hippocampus gene expression profiles identifies network alterations in aging and Alzheimer’s disease. Front Aging Neurosci 10: , 153. |
[16] | Moradifard S , Hoseinbeyki M , Ganji SM , Minuchehr Z ((2018) ) Analysis of microRNA and gene expression profiles in Alzheimer’s disease: A meta-analysis approach. Sci Rep 8: , 4767. |
[17] | Consortium GT ((2020) ) The GTEx Consortium atlas of genetic regulatory effects across human tissues. Science 369: , 1318–1330. |
[18] | Szklarczyk D , Gable AL , Lyon D , Junge A , Wyder S , Huerta-Cepas J , Simonovic M , Doncheva NT , Morris JH , Bork P , Jensen LJ , Mering CV ((2019) ) STRING v11: Protein-protein association networks with increased coverage, supporting functional discovery in genome-wide experimental datasets. Nucleic Acids Res 47: , D607–D613. |
[19] | Kuleshov MV , Jones MR , Rouillard AD , Fernandez NF , Duan Q , Wang Z , Koplev S , Jenkins SL , Jagodnik KM , Lachmann A , McDermott MG , Monteiro CD , Gundersen GW , Ma’ayan A ((2016) ) Enrichr: A comprehensive gene set enrichment analysis web server 2016 update. Nucleic Acids Res 44: , W90–W97. |
[20] | Kruer MC , Paisan-Ruiz C , Boddaert N , Yoon MY , Hama H , Gregory A , Malandrini A , Woltjer RL , Munnich A , Gobin S , Polster BJ , Palmeri S , Edvardson S , Hardy J , Houlden H , Hayflick SJ ((2010) ) Defective FA2H leads to a novel form of neurodegeneration with brain iron accumulation (NBIA). Ann Neurol 68: , 611–618. |
[21] | Pamphlett R , Morahan JM , Yu B ((2011) ) Using case-parent trios to look for rare de novo genetic variants in adult-onset neurodegenerative diseases. J Neurosci Methods 197: , 297–301. |
[22] | Moll T , Shaw PJ , Cooper-Knock J ((2020) ) Disrupted glycosylation of lipids and proteins is a cause of neurodegeneration. Brain 143: , 1332–1340. |
[23] | Jehle A , Garaschuk O ((2022) ) The interplay between cGMP and calcium signaling in Alzheimer’s disease. Int J Mol Sci 23: , 7048. |
[24] | Jing Q , Zhang H , Sun X , Xu Y , Cao S , Fang Y , Zhao X , Li C ((2021) ) A comprehensive analysis identified hub genes and associated drugs in Alzheimer’s disease. Biomed Res Int 2021: , 8893553. |
[25] | Carithers LJ , Ardlie K , Barcus M , Branton PA , Britton A , Buia SA , Compton CC , DeLuca DS , Peter-Demchok J , Gelfand ET , Guan P , Korzeniewski GE , Lockhart NC , Rabiner CA , Rao AK , Robinson KL , Roche NV , Sawyer SJ , Segre AV , Shive CE , Smith AM , Sobin LH , Undale AH , Valentino KM , Vaught J , Young TR , Moore HM , Consortium GT ((2015) ) A novel approach to high-quality postmortem tissue procurement: The GTEx Project. Biopreserv Biobank 13: , 311–319. |
[26] | Wang S , Qaisar U , Yin X , Grammas P ((2012) ) Gene expression profiling in Alzheimer’s disease brain microvessels. J Alzheimers Dis 31: , 193–205. |
[27] | Yang F , Diao X , Wang F , Wang Q , Sun J , Zhou Y , Xie J ((2020) ) Identification of key regulatory genes and pathways in prefrontal cortex of Alzheimer’s disease. Interdiscip Sci 12: , 90–98. |
[28] | Tansley GH , Burgess BL , Bryan MT , Su Y , Hirsch-Reinshagen V , Pearce J , Chan JY , Wilkinson A , Evans J , Naus KE , McIsaac S , Bromley K , Song W , Yang HC , Wang N , DeMattos RB , Wellington CL ((2007) ) The cholesterol transporter ABCG1 modulates the subcellular distribution and proteolytic processing of beta-amyloid precursor protein. J Lipid Res 48: , 1022–1034. |
[29] | Arber C , Villegas-Llerena C , Toombs J , Pocock JM , Ryan NS , Fox NC , Zetterberg H , Hardy J , Wray S ((2019) ) Amyloid precursor protein processing in human neurons with an allelic series of the PSEN1 intron 4 deletion mutation and total presenilin-1 knockout. Brain Commun 1: , fcz024. |
[30] | Zhang X , Song W ((2013) ) The role of APP and BACE1 trafficking in APP processing and amyloid-beta generation. Alzheimers Res Ther 5: , 46. |
[31] | Wan W , Xia S , Kalionis B , Liu L , Li Y ((2014) ) The role of Wnt signaling in the development of Alzheimer’s disease: A potential therapeutic target? Biomed Res Int 2014: , 301575. |
[32] | Gerring ZF , Gamazon ER , Derks EM , Major Depressive Disorder Working Group of the Psychiatric Genomics Consortium ((2019) ) A gene co-expression network-based analysis of multiple brain tissues reveals novel genes and molecular pathways underlying major depression. PLoS Genet 15: , e1008245. |
[33] | Wen L , Tang FL , Hong Y , Luo SW , Wang CL , He W , Shen C , Jung JU , Xiong F , Lee DH , Zhang QG , Brann D , Kim TW , Yan R , Mei L , Xiong WC ((2011) ) VPS35 haploinsufficiency increases Alzheimer’s disease neuropathology. J Cell Biol 195: , 765–779. |
[34] | Small SA , Kent K , Pierce A , Leung C , Kang MS , Okada H , Honig L , Vonsattel JP , Kim TW ((2005) ) Model-guided microarray implicates the retromer complex in Alzheimer’s disease. Ann Neurol 58: , 909–919. |
[35] | Ren X , Yao L , Wang Y , Mei L , Xiong WC ((2022) ) Microglial VPS35 deficiency impairs Abeta phagocytosis and Abeta-induced disease-associated microglia, and enhances Abeta associated pathology. J Neuroinflammation 19: , 61. |
[36] | Li VS , Ng SS , Boersema PJ , Low TY , Karthaus WR , Gerlach JP , Mohammed S , Heck AJ , Maurice MM , Mahmoudi T , Clevers H ((2012) ) Wnt signaling through inhibition of beta-catenin degradation in an intact Axin1 complex. Cell 149: , 1245–1256. |
[37] | Kang DE , Soriano S , Xia X , Eberhart CG , De Strooper B , Zheng H , Koo EH ((2002) ) Presenilin couples the paired phosphorylation of beta-catenin independent of axin: Implications for beta-catenin activation in tumorigenesis. Cell 110: , 751–762. |
[38] | De Ferrari GV , Papassotiropoulos A , Biechele T , Wavrant De-Vrieze F , Avila ME , Major MB , Myers A , Saez K , Henriquez JP , Zhao A , Wollmer MA , Nitsch RM , Hock C , Morris CM , Hardy J , Moon RT ((2007) ) Common genetic variation within the low-density lipoprotein receptor-related protein 6 and late-onset Alzheimer’s disease. Proc Natl Acad Sci U S A 104: , 9434–9439. |
[39] | Mudher A , Chapman S , Richardson J , Asuni A , Gibb G , Pollard C , Killick R , Iqbal T , Raymond L , Varndell I , Sheppard P , Makoff A , Gower E , Soden PE , Lewis P , Murphy M , Golde TE , Rupniak HT , Anderton BH , Lovestone S ((2001) ) Dishevelled regulates the metabolism of amyloid precursor protein via protein kinase C/mitogen-activated protein kinase and c-Jun terminal kinase. J Neurosci 21: , 4987–4995. |
[40] | Amar D , Safer H , Shamir R ((2013) ) Dissection of regulatory networks that are altered in disease via differential co-expression. PLoS Comput Biol 9: , e1002955. |
[41] | Bhar A , Haubrock M , Mukhopadhyay A , Maulik U , Bandyopadhyay S , Wingender E ((2013) ) Coexpression and coregulation analysis of time-series gene expression data in estrogen-induced breast cancer cell. Algorithms Mol Biol 8: , 9. |
[42] | Kostka D , Spang R ((2004) ) Finding disease specific alterations in the co-expression of genes. Bioinformatics 20: (Suppl 1), i194–199. |
[43] | De Smet R , Marchal K ((2010) ) Advantages and limitations of current network inference methods. Nat Rev Microbiol 8: , 717–729. |
[44] | Yue F , Cheng Y , Breschi A , Vierstra J , Wu W , Ryba T , Sandstrom R , Ma Z , Davis C , Pope BD , Shen Y , Pervouchine DD , Djebali S , Thurman RE , Kaul R , Rynes E , Kirilusha A , Marinov GK , Williams BA , Trout D , Amrhein H , Fisher-Aylor K , Antoshechkin I , DeSalvo G , See LH , Fastuca M , Drenkow J , Zaleski C , Dobin A , Prieto P , Lagarde J , Bussotti G , Tanzer A , Denas O , Li K , Bender MA , Zhang M , Byron R , Groudine MT , McCleary D , Pham L , Ye Z , Kuan S , Edsall L , Wu YC , Rasmussen MD , Bansal MS , Kellis M , Keller CA , Morrissey CS , Mishra T , Jain D , Dogan N , Harris RS , Cayting P , Kawli T , Boyle AP , Euskirchen G , Kundaje A , Lin S , Lin Y , Jansen C , Malladi VS , Cline MS , Erickson DT , Kirkup VM , Learned K , Sloan CA , Rosenbloom KR , Lacerda de Sousa B , Beal K , Pignatelli M , Flicek P , Lian J , Kahveci T , Lee D , Kent WJ , Ramalho Santos M , Herrero J , Notredame C , Johnson A , Vong S , Lee K , Bates D , Neri F , Diegel M , Canfield T , Sabo PJ , Wilken MS , Reh TA , Giste E , Shafer A , Kutyavin T , Haugen E , Dunn D , Reynolds AP , Neph S , Humbert R , Hansen RS , De Bruijn M , Selleri L , Rudensky A , Josefowicz S , Samstein R , Eichler EE , Orkin SH , Levasseur D , Papayannopoulou T , Chang KH , Skoultchi A , Gosh S , Disteche C , Treuting P , Wang Y , Weiss MJ , Blobel GA , Cao X , Zhong S , Wang T , Good PJ , Lowdon RF , Adams LB , Zhou XQ , Pazin MJ , Feingold EA , Wold B , Taylor J , Mortazavi A , Weissman SM , Stamatoyannopoulos JA , Snyder MP , Guigo R , Gingeras TR , Gilbert DM , Hardison RC , Beer MA , Ren B , Mouse EC ((2014) ) A comparative encyclopedia of DNA elements in the mouse genome. Nature 515: , 355–364. |
[45] | Goh KI , Cusick ME , Valle D , Childs B , Vidal M , Barabasi AL ((2007) ) The human disease network. Proc Natl Acad Sci U S A 104: , 8685–8690. |
[46] | Lage K , Hansen NT , Karlberg EO , Eklund AC , Roque FS , Donahoe PK , Szallasi Z , Jensen TS , Brunak S ((2008) ) A large-scale analysis of tissue-specific pathology and gene expression of human disease genes and complexes. Proc Natl Acad Sci U S A 105: , 20870–20875. |
[47] | Potter KA , Kern MJ , Fullbright G , Bielawski J , Scherer SS , Yum SW , Li JJ , Cheng H , Han X , Venkata JK , Khan PA , Rohrer B , Hama H ((2011) ) Central nervous system dysfunction in a mouse model of FA2H deficiency. Glia 59: , 1009–1021. |
[48] | Neff RA , Wang M , Vatansever S , Guo L , Ming C , Wang Q , Wang E , Horgusluoglu-Moloch E , Song WM , Li A , Castranio EL , Tcw J , Ho L , Goate A , Fossati V , Noggle S , Gandy S , Ehrlich ME , Katsel P , Schadt E , Cai D , Brennand KJ , Haroutunian V , Zhang B ((2021) ) Molecular subtyping of Alzheimer’s disease using RNA sequencing data reveals novel mechanisms and targets. Sci Adv 7: , eabb5398. |
[49] | Park H , Lee S , Kim HJ , Ju YS , Shin JY , Hong D , von Grotthuss M , Lee DS , Park C , Kim JH , Kim B , Yoo YJ , Cho SI , Sung J , Lee C , Kim JI , Seo JS ((2012) ) Comprehensive genomic analyses associate UGT8 variants with musical ability in a Mongolian population. J Med Genet 49: , 747–752. |
[50] | Halpern AR , O’Connor MG ((2000) ) Implicit memory for music in Alzheimer’s disease. Neuropsychology 14: , 391–397. |
[51] | Dugas JC , Tai YC , Speed TP , Ngai J , Barres BA ((2006) ) Functional genomic analysis of oligodendrocyte differentiation. J Neurosci 26: , 10967–10983. |
[52] | Han X , D MH , McKeel DW Jr., Kelley J , Morris JC ((2002) ) Substantial sulfatide deficiency and ceramide elevation in very early Alzheimer’s disease: Potential role in disease pathogenesis. J Neurochem 82: , 809–818. |
[53] | Marks N , Berg MJ , Saito M , Saito M ((2008) ) Glucosylceramide synthase decrease in frontal cortex of Alzheimer brain correlates with abnormal increase in endogenous ceramides: Consequences to morphology and viability on enzyme suppression in cultured primary neurons. Brain Res 1191: , 136–147. |
[54] | Delisle MB , Carpenter S ((1984) ) Neurofibrillary axonal swellings and amyotrophic lateral sclerosis. J Neurol Sci 63: , 241–250. |
[55] | Goldman JE , Yen SH , Chiu FC , Peress NS ((1983) ) Lewy bodies of Parkinson’s disease contain neurofilament antigens. Science 221: , 1082–1084. |
[56] | Ishii T , Haga S , Tokutake S ((1979) ) Presence of neurofilament protein in Alzheimer’s neurofibrillary tangles (ANT). An immunofluorescent study. Acta Neuropathol 48: , 105–112. |
[57] | Humphreys DT , Carver JA , Easterbrook-Smith SB , Wilson MR ((1999) ) Clusterin has chaperone-like activity similar to that of small heat shock proteins. J Biol Chem 274: , 6875–6881. |
[58] | Narayan P , Holmstrom KM , Kim DH , Whitcomb DJ , Wilson MR , St George-Hyslop P , Wood NW , Dobson CM , Cho K , Abramov AY , Klenerman D ((2014) ) Rare individual amyloid-beta oligomers act on astrocytes to initiate neuronal damage. Biochemistry 53: , 2442–2453. |
[59] | Merino-Zamorano C , Fernandez-de Retana S , Montanola A , Batlle A , Saint-Pol J , Mysiorek C , Gosselet F , Montaner J , Hernandez-Guillamon M ((2016) ) Modulation of amyloid-beta1-40 transport by ApoA1 and ApoJacross an in vitro model of the blood-brain barrier. JAlzheimers Dis 53: , 677–691. |
[60] | Zandl-Lang M , Fanaee-Danesh E , Sun Y , Albrecher NM , Gali CC , Cancar I , Kober A , Tam-Amersdorfer C , Stracke A , Storck SM , Saeed A , Stefulj J , Pietrzik CU , Wilson MR , Bjorkhem I , Panzenboeck U ((2018) ) Regulatory effects of simvastatin and apoJ on APP processing and amyloid-beta clearance in blood-brain barrier endothelial cells. Biochim Biophys Acta Mol Cell Biol Lipids 1863: , 40–60. |
[61] | Nielsen HM , Mulder SD , Belien JA , Musters RJ , Eikelenboom P , Veerhuis R ((2010) ) Astrocytic A beta 1-42 uptake is determined by A beta-aggregation state and the presence of amyloid-associated proteins. Glia 58: , 1235–1246. |
[62] | Mulder SD , Nielsen HM , Blankenstein MA , Eikelenboom P , Veerhuis R ((2014) ) Apolipoproteins E and J interfere with amyloid-beta uptake byprimary human astrocytes and microglia in vitro. Glia 62: , 493–503. |
[63] | Robbins JP , Perfect L , Ribe EM , Maresca M , Dangla-Valls A , Foster EM , Killick R , Nowosiad P , Reid MJ , Polit LD , Nevado AJ , Ebner D , Bohlooly YM , Buckley N , Pangalos MN , Price J , Lovestone S ((2018) ) Clusterin is required for beta-amyloid toxicity in human iPSC-derived neurons. Front Neurosci 12: , 504. |
[64] | Harold D , Abraham R , Hollingworth P , Sims R , Gerrish A , Hamshere ML , Pahwa JS , Moskvina V , Dowzell K , Williams A , Jones N , Thomas C , Stretton A , Morgan AR , Lovestone S , Powell J , Proitsi P , Lupton MK , Brayne C , Rubinsztein DC , Gill M , Lawlor B , Lynch A , Morgan K , Brown KS , Passmore PA , Craig D , McGuinness B , Todd S , Holmes C , Mann D , Smith AD , Love S , Kehoe PG , Hardy J , Mead S , Fox N , Rossor M , Collinge J , Maier W , Jessen F , Schurmann B , Heun R , van den Bussche H , Heuser I , Kornhuber J , Wiltfang J , Dichgans M , Frolich L , Hampel H , Hull M , Rujescu D , Goate AM , Kauwe JS , Cruchaga C , Nowotny P , Morris JC , Mayo K , Sleegers K , Bettens K , Engelborghs S , De Deyn PP , Van Broeckhoven C , Livingston G , Bass NJ , Gurling H , McQuillin A , Gwilliam R , Deloukas P , Al-Chalabi A , Shaw CE , Tsolaki M , Singleton AB , Guerreiro R , Muhleisen TW , Nothen MM , Moebus S , Jockel KH , Klopp N , Wichmann HE , Carrasquillo MM , Pankratz VS , Younkin SG , Holmans PA , O’Donovan M , Owen MJ , Williams J ((2009) ) Genome-wide association study identifies variants at CLU and PICALM associated with Alzheimer’s disease. Nat Genet 41: , 1088–1093. |
[65] | Zhang P , Qin W , Wang D , Liu B , Zhang Y , Jiang T , Yu C ((2015) ) Impacts of PICALM and CLU variants associated with Alzheimer’s disease on the functional connectivity of the hippocampus in healthy young adults. Brain Struct Funct 220: , 1463–1475. |
[66] | Dunckley T , Beach TG , Ramsey KE , Grover A , Mastroeni D , Walker DG , LaFleur BJ , Coon KD , Brown KM , Caselli R , Kukull W , Higdon R , McKeel D , Morris JC , Hulette C , Schmechel D , Reiman EM , Rogers J , Stephan DA ((2006) ) Gene expression correlates of neurofibrillary tangles in Alzheimer’s disease. Neurobiol Aging 27: , 1359–1371. |


