
Variation in Group Composition Alters an Early-Stage Social Phenotype in hAPP-Transgenic J20 Mice
Abstract
Background:
Altered social behavior is one of the symptoms of Alzheimer’s disease (AD) that results in social withdrawal and loneliness and provides a major burden on patients and their relatives. Furthermore, loneliness is associated with an increased risk to develop AD and related dementias.
Objective:
We aimed to investigate if altered social behavior is an early indicator of amyloid-β (Aβ) pathology in J20 mice, and if co-housing with wild type (WT) mice can positively influence this social phenotype.
Methods:
The social phenotype of group-housed mice was assessed using an automated behavioral scoring system for longitudinal recordings. Female mice were housed in a same-genotype (4 J20 or WT mice per colony) or mixed-genotype (2 J20 mice + 2 WT mice) colony. At 10 weeks of age, their behavior was assessed for five consecutive days.
Results:
J20 mice showed increased locomotor activity and social sniffing, and reduced social contact compared to WT mice housed in same-genotype colonies. Mixed-genotype housing reduced the social sniffing duration of J20 mice, increased social contact frequency of J20 mice, and increased nest hide by WT mice.
Conclusion:
Thus, altered social behavior can be used as an early indicator of Aβ-pathology in female J20 mice. Additionally, when co-housed with WT mice, their social sniffing phenotype is not expressed and their social contact phenotype is reduced. Our findings highlight the presence of a social phenotype in the early stages of AD and indicate a role for social environment variation in the expression of social behavior of WT and J20 mice.
INTRODUCTION
Alzheimer’s disease (AD) is one of the most common forms of dementia, resulting in progressive loss of cognitive functioning. No effective treatment is available yet, but several environmental and lifestyle factors have been identified that may modulate the risk and/or progression of the disease [1–3]. One group of modifiable lifestyle factors associated with AD risk and progression are social health factors (e.g., the frequency of social contact, social support, and the feeling of loneliness) [4–7]. Balouch et al. showed that with declining cognition, AD patients have fewer close friends [4]. In addition, several epidemiological studies have found loneliness to be associated with an increased risk of AD and related dementia [5–7]. Likewise, social isolation of aged mice with AD pathology promoted cognitive dysfunction and AD-related pathology [8].
AD is, among others, characterized by extracellular amyloid-β (Aβ) plaques and intracellular neurofibrillary tau tangles in the brain, starting in the medial temporal lobe after which it affects other cortical and subcortical brain regions. Early detection of the disorder can improve disease management and the quality of life of the patient and their family. However, the slowly progressing pathology is present years before any overt symptoms become apparent. Besides problems in cognitive functions including memory, attention, and orientation, patients with dementia often experience behavioral and psychological symptoms [9]. These include problems with face recognition [10], emotion recognition [11], apathy [12], and social functioning in everyday situations (e.g., initiating contact, expressing opinions) [11]. Thus, aberrant social behavior is both a risk factor and a symptom of AD.
In the current study, we aim to characterize the early social deficits in a mouse model for AD (J20 mice) [13] and to study the impact of the social environment on the behavioral phenotype of these mice. The social behavioral phenotype of mice can be determined by examining the differences in overall social engagement, as reflected, for example, by the time that mice exhibit social contact. We hypothesized that J20 mice display altered social behavior (e.g., reduced social engagement, as reflected by reduced social contact and increased leaving behavior) compared to wild-type (WT) mice and that mixed-genotype housing affects the phenotype. Female mice were used in this study, because AD is more common in females [14] and females are more affected by stress [15], including social stress [16]. J20 mice overexpress the human amyloid precursor protein (hAPP) carrying two familiar AD mutations (Indiana and Swedish mutation) under the control of the PDGFβ-promotor. As a result, cognitive decline has typically been detected from 4–5 months of age [17–19], and Aβ plaques are present from the age of 5–7 months [18]. To date, little is known about their behavioral phenotype at a younger age (<3 months). Moreover, social behavior has not been investigated in J20 mice yet.
Prior studies investigating social behavior in mouse models for AD are limited. Yet, altered social behavior has been observed in several different AD mouse models. For example, Filali et al. (2011) found reduced sociability of 6-month-old male APP-PS1 mice during the Three Chamber Task [20]. Watt et al. (2020) observed reduced sociability in a model for tau pathology (male Tau58/2 mice) [21]. Furthermore, Pietropaolo et al. (2012) found altered social behavior in 3-month-old female APP-PS1 and Tg2576 mice [22]. However, these studies used a simple behavioral task (i.e., Three Chamber Task) only studying limited aspects of social behavior in artificial settings [20, 22]. In the current study, longitudinal behavioral measurements were performed in group-housed young (10-week-old) WT and J20 mice, using the Behavioral Assessment RFID-Integrated Social Tracking Arena (BARISTA) system [23, 24]. The BARISTA system allows for automatic scoring of a wide range of behaviors in detail for individual mice that are group housed, using a combination of RFID data and video tracking and an objective algorithm with minimal interference of the researchers.
For the first time, an in-depth characterization of the social phenotype of young (10-week-old) female J20 mice was assessed in a time window prior to the known onset of cognitive and AD brain pathology. Here, we show that social deficits can be used as an early indicator of AβPP pathology, and that the social phenotype is affected by the composition of the group.
MATERIALS AND METHODS
Animals
In-house-bred female J20 mice and their female WT littermates (C57Bl6) were weaned at 3 weeks of age and distributed over cages at 4 weeks of age [13]. A power analysis based on a previous study from Bove et al. using longitudinal social behavioral recordings was performed to determine the required number of animals, resulting in 8 cages per experimental group [23]. Since J20 animals are at risk of sudden premature death [19, 25, 26], extra cages were included in the groups containing J20 mice. Four breeding rounds were performed to obtain the required number of animals, each resulting in two experimental batches of four cages each. Within each breeding round, each cage got a random cage number (ColonyID), with cages 1–4 being batch 1 and cages 5–8 batch 2, etc. Cage distribution was stratified by litter, age, and genotype to create same-genotype (4 WTsame mice or 4 J20same mice) and mixed-genotype cages (2 J20mix mice co-housed with 2 WTmix) of age-matched mice from different litters. Each group of mice in a cage is referred to as a colony, and each colony consists of four mice. Mice remained in the same colony during the entire experiment. Due to the sudden early death of J20 mice, one J20same cage and 4 mixed-genotype cages were excluded before the start of the experiment. Technical problems during the recording of the experiment (sudden shutdown of the recording computer and missing RFID data due to an unknown hardware problem) led to the exclusion of one WTsame colony, leaving n = 7 cages WTsame, n = 11 cages with J20same, and n = 8 cages with mixed-genotypes for data analysis. Mice were housed in Makrolon type III cages with bedding (Aspen), shredded cardboard nesting material, a cardboard tube, and food and water available ad libitum. Mice were maintained under a 12:12-h light/dark cycle with lights off at 12:00 (during winter time) or 13:00 (during daylight saving time), with controlled temperature (21±2°C) and humidity (55±10%). All animal handling was conducted while wearing gloves. All animal procedures were in accordance with the Ethical Committee of the University of Groningen and were in accordance with the ARRIVE guidelines.
The genotype was determined by PCR analysis of DNA extracted from ear clips at the age of 3 weeks (internal control forward primer oIMR8744 5’-CAAATGTTGCTTGTCTGGTG, internal control reverse primer oIMR8745 5’- GTCAGTCGAGTGCACAGTTT, transgene forward primer oIMR2044 5’-GGTGAGTTTGTAAGTGATGCC, oIMR2045 transgene reverse primer 5’-TCTTCTTCTTCCACCTCAGC). The genotype was reconfirmed using the same method on new ear clip material after terminating the animals at the end of theexperiment.
RFID chip implantation
In order to track and identify the mice in the BARISTA, a sterile and ISO-compliant (ISO11784/85 FDX-B) Radio Frequency Identification (RFID) chip (12 mm long, 2.12 mm diameter) was implanted in the dorsal/caudal flank of each mouse [27]. At 9 weeks of age, mice were shortly anesthetized by isoflurane and the skin around the implantation site was cleaned with chlorhexidine alcohol. By using a specialized syringe with a hollow needle, the RFID chip was injected subcutaneously right under the median of the dorsal/caudal part of the mouse.
Social behavior assessment
Social behavior was assessed using the Behavioral Automated RFID-Integrated Social Tracking Arena (BARISTA), which consisted of an open arena (60×80 cm, 50 cm high walls) with 4 small nesting boxes (7×7×7 cm) and one bigger nesting box (10×10×10 cm) (Fig. 1) [24]. The nest boxes were made of opaque PVC and were connected to the open arena via short tunnels (Ø 4×7 cm). The open arena was covered with a translucent Perspex cover. White and red LEDs were attached to all sides of the cover to ensure equal illumination of the open arena. Light conditions were matched to that of the regular housing room. Two food hoppers and two water bottles are placed on the sides of the open arena to provide ad libitum access to food and water during the experiment. The arena, including the cover and nest boxes, was custom-made at Boehringer Ingelheim according to the design of Peleh et al. [24]. The floor of the open arena was covered with bedding (Aspen). A camera (Basler acA1300-60gmNIR GigE monochrome camera) with an IR pass filter (850 nm) was mounted above the BARISTA to record the behavior. The arena was placed on top of an RFID detection plate containing 24 RFID coils to register RFID chips, allowing identification of the animals. Behaviors in the open arena were automatically assessed with Social Scan (CleverSys Inc., Reston, VA, USA) (Table 1) based on the RFID-supported video tracking, resulting in unbiased and consistent scoring of behaviors. Four BARISTA set-ups were located in the experimental room (60–90 cm apart from each other) and were used simultaneously. The testing order was based on experimental batch order, starting with batch 1. When the mice were 10 weeks old, each colony was housed and recorded in a BARISTA arena for five consecutive days. Mice were left undisturbed, except for short daily welfare and room checks during the second half of the light phase. The recording was started at the first hour of the dark phase and mice are placed in the BARISTA around 15 minutes before. After 120 hours of recording, mice were taken out of the BARISTA and placed back in their original homecage.
Fig. 1
The BARISTA system with bedding on top of the RFID plate (black plate at the bottom). A) The BARISTA with the translucent cover on top of the arena. The white and infrared LED strips (red arrowheads) attached along the sides of the cover ensure equal illumination of the open space. Four smaller nest boxes and one bigger nest box are shown at the bottom of the picture. B) The BARISTA without the lid, showing the entrances of the nest boxes at the top of the picture and the food hoppers on the left side and the water bottles on the right side.
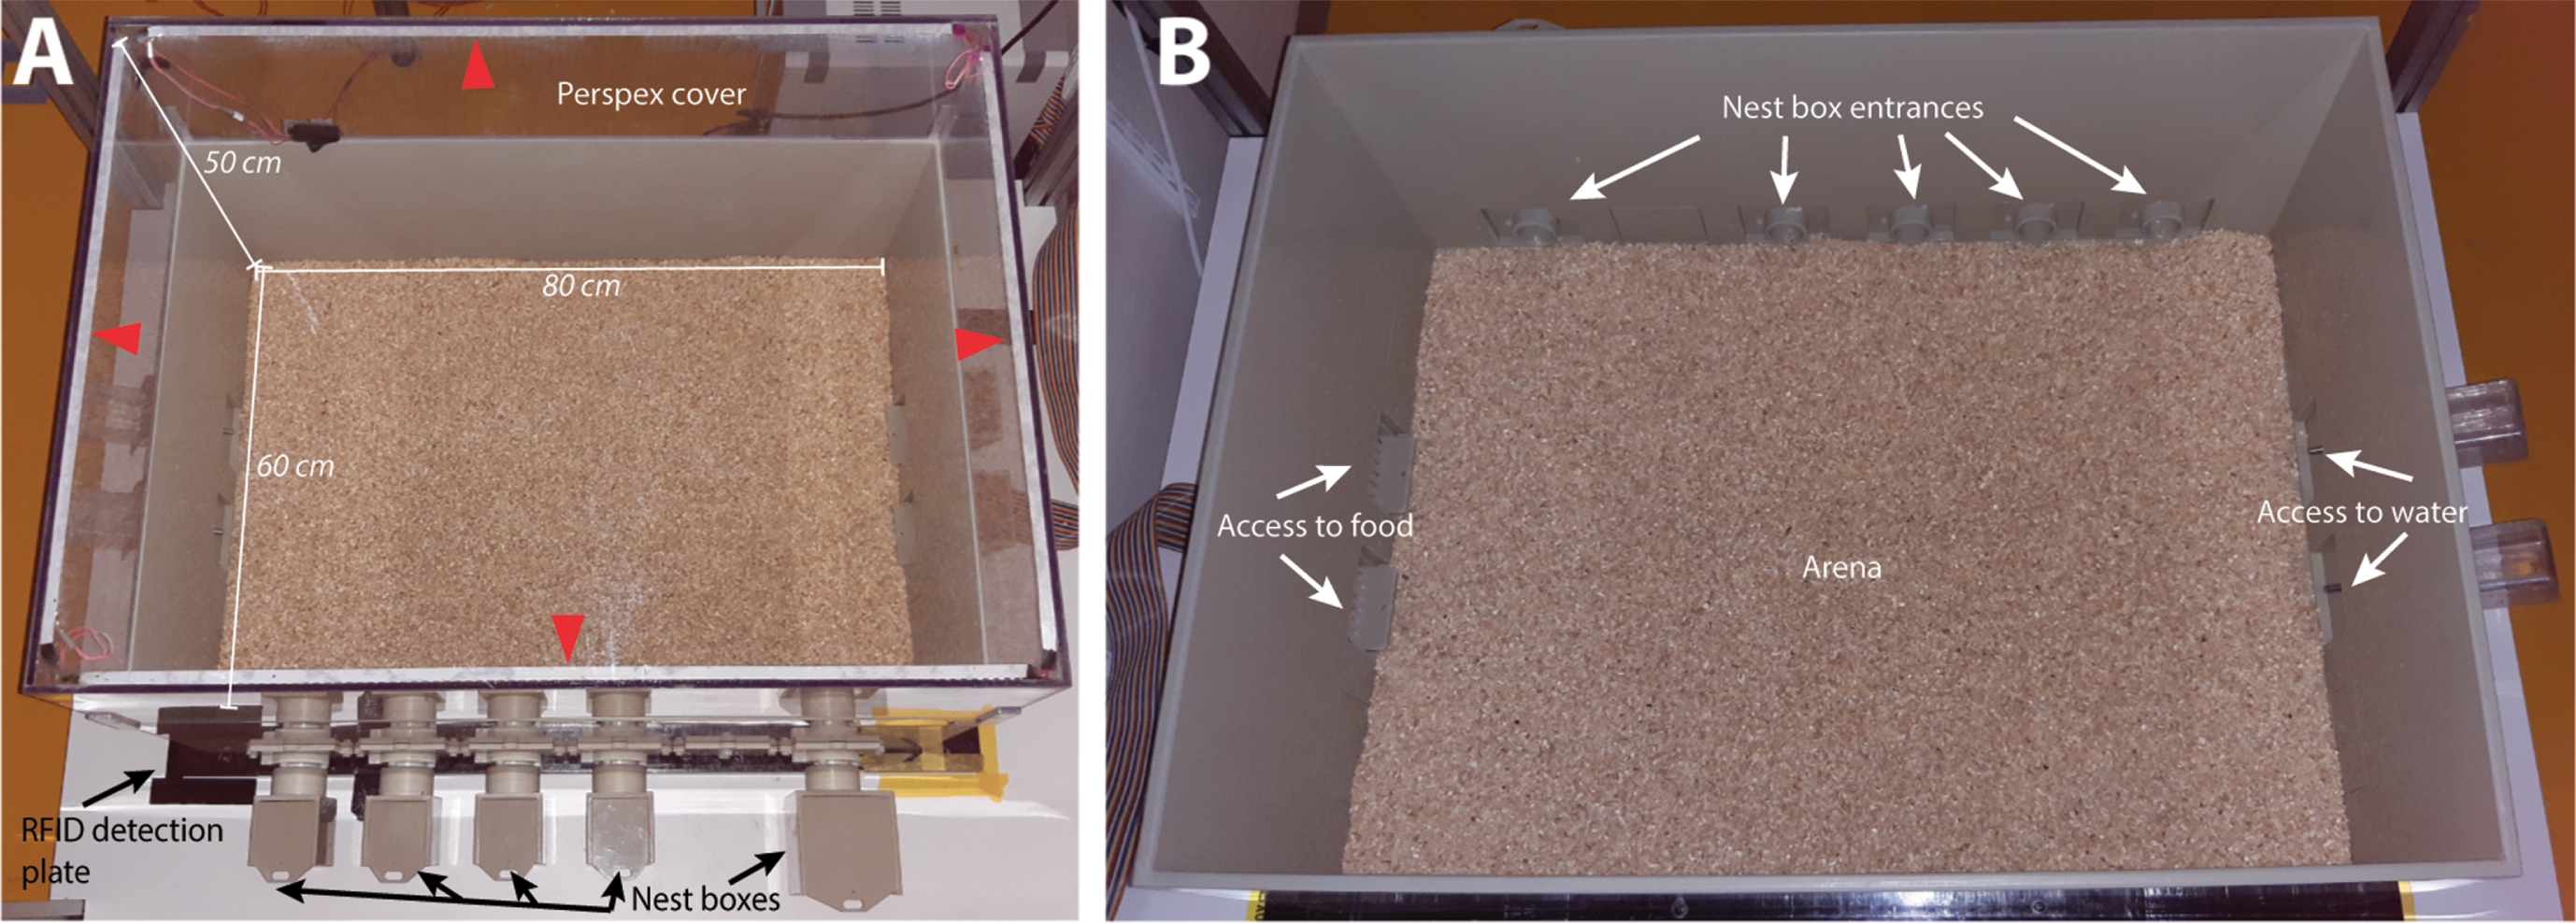
Table 1
Detector settings of Social Scan used for automated behavioral recognition
| Social contact | |
| Distance between center-point of mice | <2 cm |
| Approach | |
| Distance between mice | <100 cm |
| Moving direction (angle) of mouse 1 | <45° |
| Distance traveled by mouse 1 towards mouse 2 | >7 cm |
| Velocity of mouse 1 | >4 cm/s |
| Leave | |
| Distance between mice | <100 cm |
| Moving direction (angle) of mouse 1 | <45° |
| Distance to be traveled by mouse 1 away from mouse 2 | >14 cm |
| Velocity of mouse 1 | >4 cm/s |
| Follow | |
| Distance between mice | <30 cm |
| Moving direction (angle) of mouse 1 | <45° |
| Moving direction (angle) of mouse 2 | >90° |
| Distance to be traveled by mouse 1 and mouse 2 | >7 cm |
| Velocity of mice | >4 cm/s |
| Social sniffing | |
| Distance between mice | <3.5 cm |
| Minimum duration | 0.33 s |
Social contact refers to the physical contact of a mouse with one or more other mice. Approach, leave, and follow behaviors are measured based on movement of one mouse towards or away from another mouse. Social sniffing includes all sniffing of another animal at any location of the body. All these behaviors were only measured in the arena and not in the nest boxes.
Considering the fact that social behavior depends on activity and J20 mice display hyperactivity [18, 19, 28], we started with determining which social behavioral read-outs depend less on motor activity levels. From this analysis, we determined that social contact duration, social sniffing duration, and nest hide duration are less dependent on motor activity levels and, therefore, constitute our main read-outs for social behavior (Supplementary Figure 1).
Data analysis
The first 24 hours of the recording were considered a habituation period and were therefore excluded from the analyses. All the analyses were performed on data from the habitual activity phase of this nocturnal species (dark phase) from days 2–5 (following adaptation to the novel environment).
For the behavioral read-outs (distance moved, social contact, social sniffing duration, and nest hide duration), the total time spent on these behaviors was calculated per hour for each mouse. The mean cumulative duration with SEM of the different behaviors of each animal was plotted per hour using R Studio [29] and the ggplot2 package [30].
In order to determine the effect of genotype and group composition on behavior, the mean total time spent on each behavior per active phase was used for the analysis. This data was analyzed using Linear mixed-effect Modeling with the lmerTest package for R [31]. The models were built based on the hypothesis and experimental design and the assumptions were checked. First, the effect of genotype was assessed in the same-genotype colonies. Genotype and time (active phase 2–5) were included in the model as fixed effects. The time mice spent in the arena (ArenaTime) and distance moved (DistanceMoved) covariates were added to the model if this led to a significant improvement of the model. ColonyID and MouseID were included as random effects with MouseID nested within ColonyID. Different behavioral measures were entered as the dependent variable. Distance moved, social contact (duration and frequency), and sniffing were log-transformed to approach a normal distribution. The specifications for model 1 were asfollows:
DistanceMoved ∼ Genotype + Time + ArenaTime + (1|ColonyID/MouseID)
SocialContact_Duration ∼ Genotype + Time + ArenaTime + DistanceMoved + (1|ColonyID/MouseID)
SocialContact_Frequency ∼ Genotype + Time + ArenaTime + DistanceMoved + (1|ColonyID/MouseID)
SocialSniffing ∼ Genotype + Time + ArenaTime + DistanceMoved + (1|ColonyID/MouseID)
NestHide ∼ Genotype + Time + (1|ColonyID/MouseID)
Second, the effect of the group composition on the genotype was assessed, by examining the interaction between genotype and group composition (same-genotype or mixed-genotype colony) using model 2:
DistanceMoved ∼ Genotype*GroupComposition + Time + ArenaTime + (1|ColonyID/MouseID)
SocialContact_Duration ∼ Genotype*GroupComposition + Time + ArenaTime + DistanceMoved + (1|ColonyID/MouseID)
SocialContact_Frequency ∼ Genotype*GroupComposition + Time + ArenaTime + DistanceMoved + (1|ColonyID/MouseID)
SocialSniffing ∼ Genotype*GroupComposition + Time + ArenaTime + DistanceMoved + (1|ColonyID/MouseID)
NestHide ∼ Genotype*GroupComposition + Time + (1|ColonyID/MouseID)
For both models, treatment contrasts were applied to non-ordered variables (i.e., Genotype and GroupComposition) with ‘WT’ and ‘same-genotype housing’ being the control conditions. Polynomial contrast was applied to ordered variables (i.e., Time). Type-III ANOVA with Satterthwaite’s method was used to generate p-values for mixed models, to test the significance of the fixed effects and their interaction. Post-hoc pairwise comparisons were performed on model 2 using Tukey correction for multiple testing.
The median bout duration of social contact in same-genotype colonies was calculated per colony using the data from the active period of day 2–5. The mean median bout duration of social contact was compared between WT and J20 mice colonies using Type-III ANOVA with Satterthwaite’s method on a linear mixed effect model: medianSocialContact Genotype + Time + (1|ColonyID).
For social sniffing, the duration of a different-genotype social sniffing (a WT mouse sniffing a J20 mouse, or vice versa) relative to a same-genotype social sniffing (a WT mouse sniffing a WT mouse, or a J20 mouse sniffing a J20 mouse) was calculated for each dark phase (dark phase 2–5), considering the 4x higher occurrence of different-genotype interaction compared to same-genotype interaction by dividing those values by 4. The social sniffing within and between genotypes were statistically analyzed using a two-sided Wilcoxon signed-rank test, by comparing the same-genotype social sniffing with different-genotype social sniffing for each dark phase separately.
RESULTS
Increased locomotor activity in J20 mice
Behavioral read-outs can be affected by the motor activity levels of an animal, as many behaviors require movement. From our data, the distance moved was used as a proxy for an animal’s locomotor activity. It is well established from previous research that J20 mice, irrespective of their genetic background, display hyperactivity [18, 19, 28]. Our data showed that 10-week-old J20 mice display significantly elevated activity levels compared to WT mice (β= 0.499, 95% CI[0.301, 0.697], p < 0.0001) (Fig. 2A and Tables 2and 3). Therefore, we started by examining how the social behavior read-outs correlated with distance moved by creating a correlation matrix (Supplementary Figure 1). From this matrix, it became apparent that most behavioral read-outs have a strong positive correlation with distance moved, which hardens disentangling social behavioral differences between animals when their activity level differs. However, social contact, sniffing, and nest hide are less dependent on distance moved and are therefore considered the most direct measures of social behavior in the J20 mouse model. The remaining social behaviors are plotted in Supplementary Figure 2 (same-genotype colonies) and Supplementary Figure 3 (mixed-genotype colonies).
Fig. 2
Social behavior of mice from same-genotype colonies. A–E) Longitudinal recording of social behaviors in same-genotype colonies. The mean cumulative duration/frequency of the behavior per mouse is plotted over time. Error bands represent the standard error of the mean. The black and white bars at the x-axis represent dark- and light phase, respectively. J20same mice display increased distance moved, reduced social contact duration and frequency, and increased social sniffing compared to WTsame mice. For the results of the statistical analyses, see Tables 2 and 3. F) A boxplot of the mean median bout duration of social contact in same-genotype colonies during the analyzed time frames (dark phase 2–5). The mean median bout duration of social contact per dark phase in same-genotype colonies.
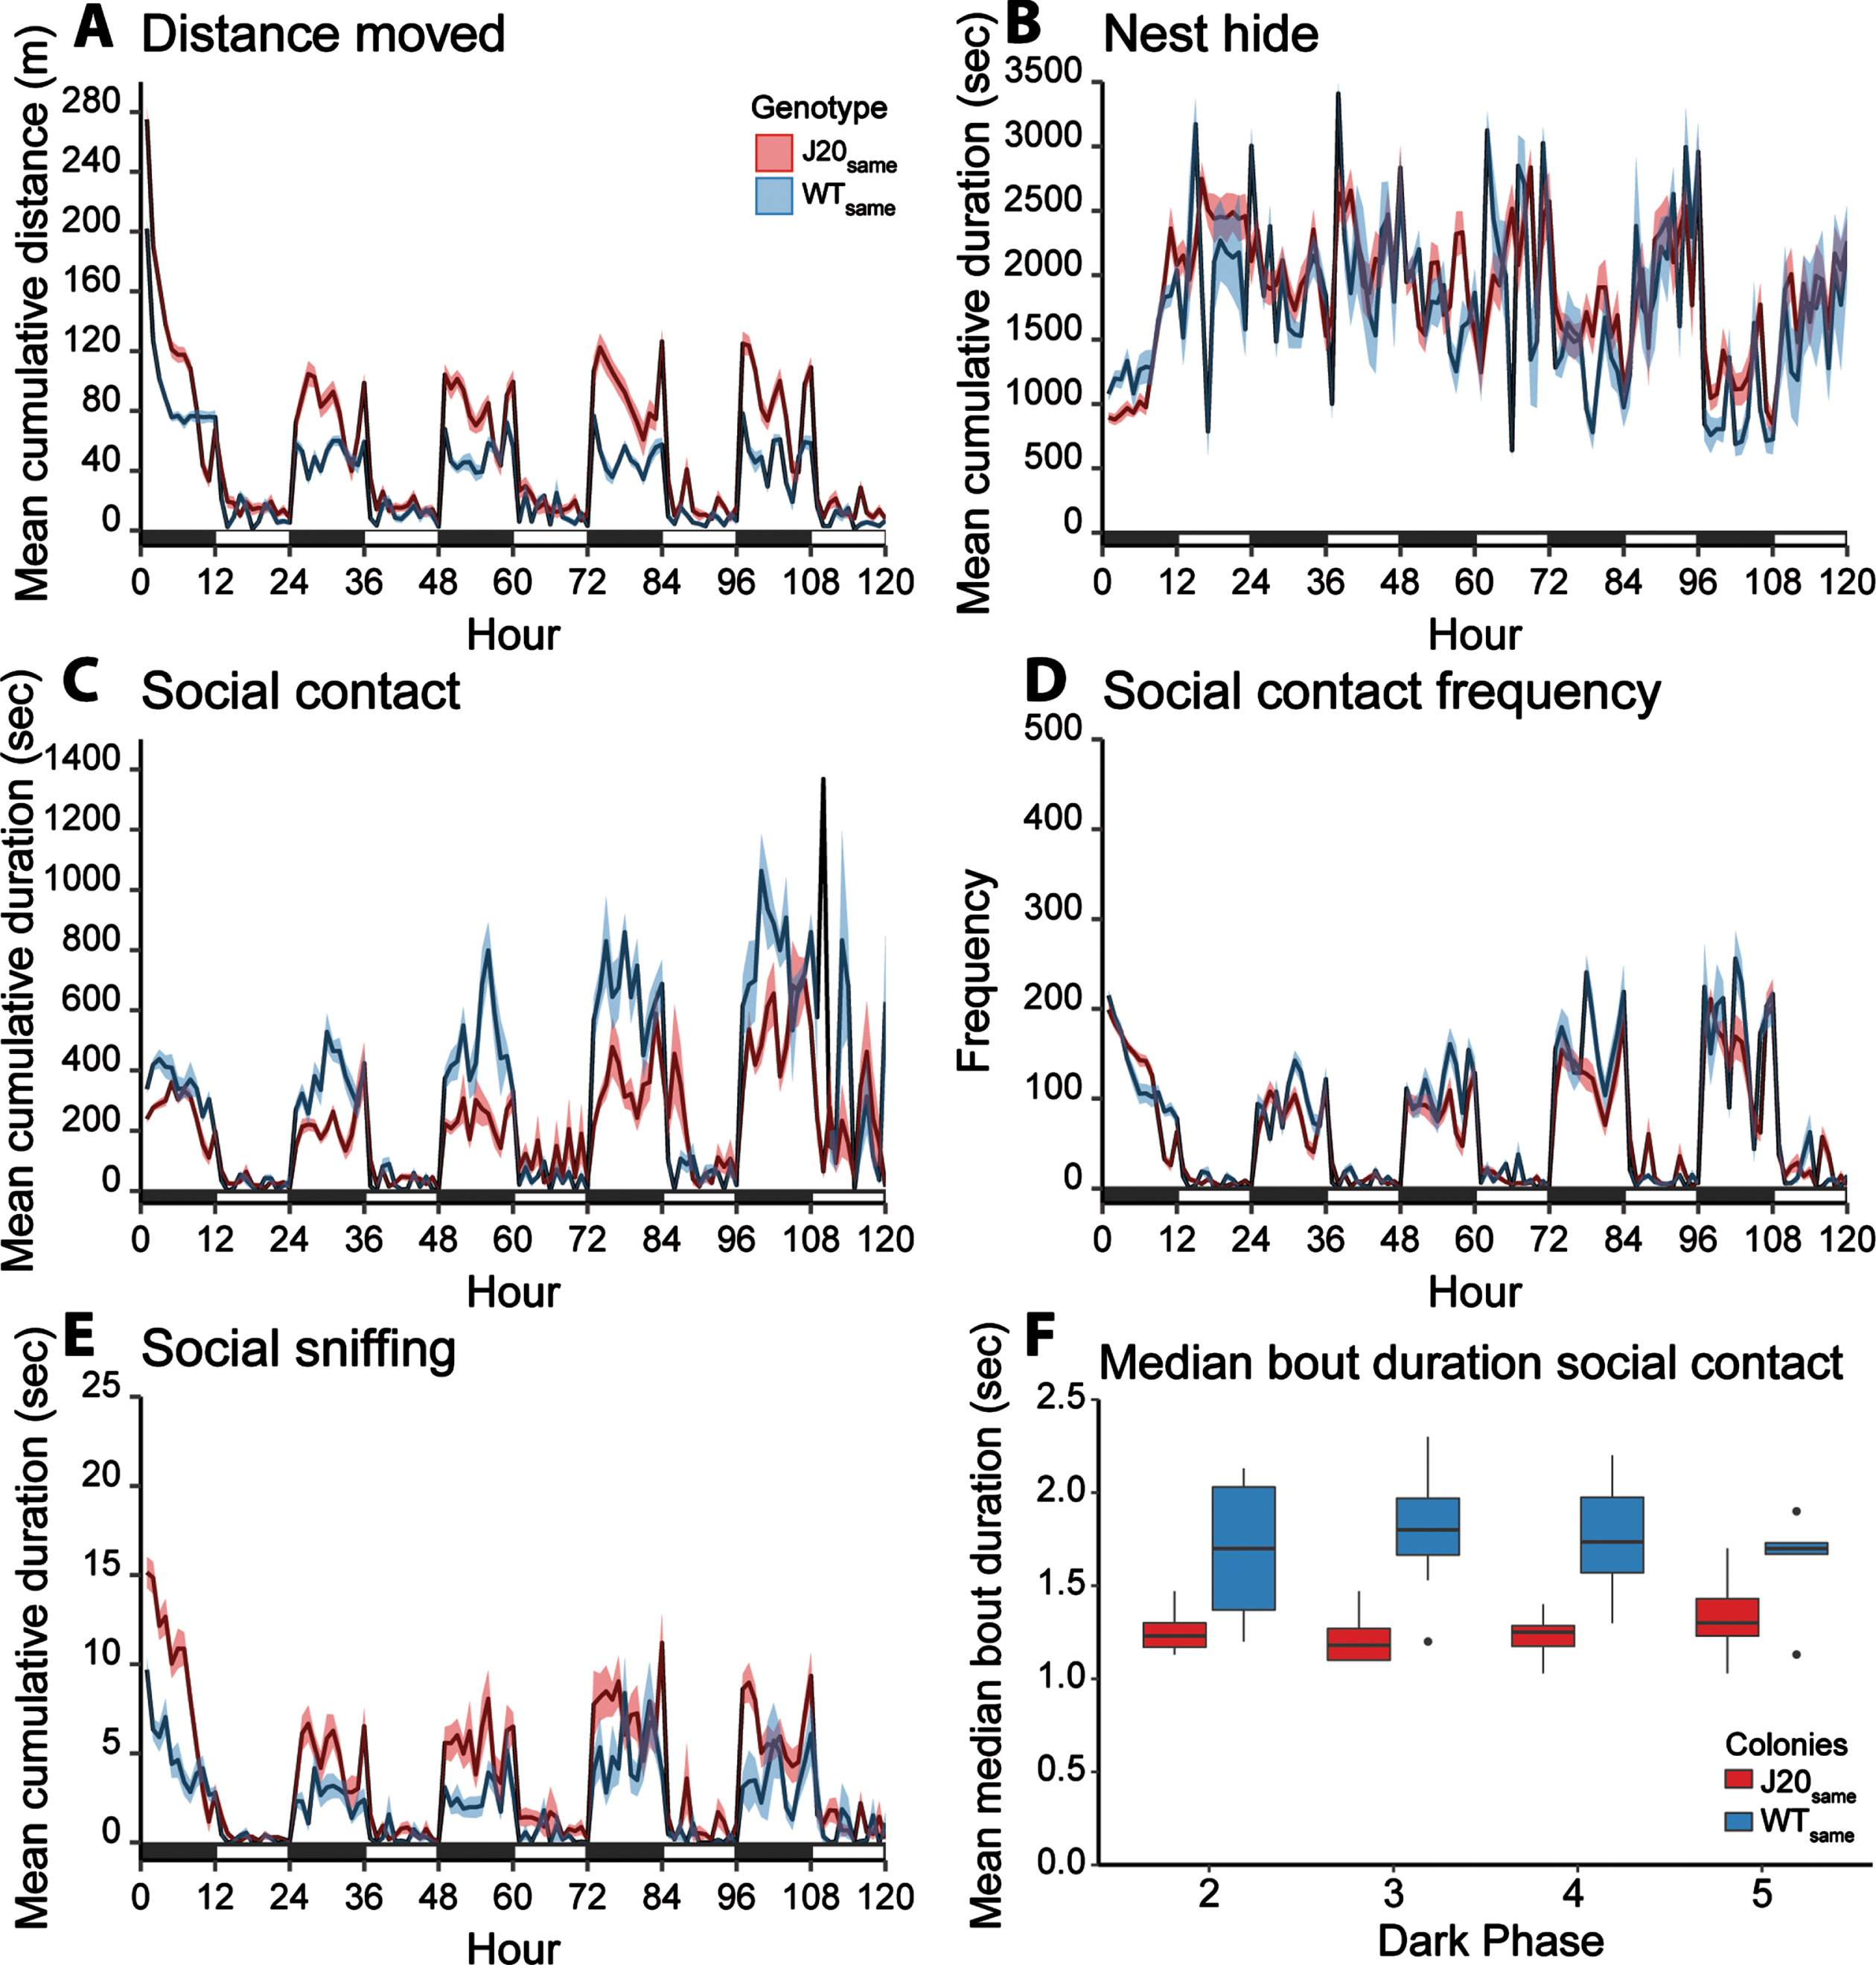
Table 2
Model output of the effect of genotype and the interaction effect of genotype and group composition on behavior
| Distance moved | ||||||
| β Estimate | 95% CI | F | p | |||
| Factors | lower | upper | ||||
| model 1 | Genotype (J20) | 0.49890 | 0.30091 | 0.69670 | 24.1570 | <0.0001*** |
| model 2 | Genotype (J20) | 0.23510 | 0.09683 | 0.37333 | 37.2710 | <0.0001*** |
| Group composition (mixed) | –0.05001 | –0.23942 | 0.13940 | 0.8758 | 0.35954 | |
| Interaction: Genotype * Group composition | –0.2580 | –0.03029 | –0.48578 | 4.6801 | 0.03561* | |
| Social contact duration | ||||||
| β Estimate | 95% CI | F | p | |||
| lower | upper | |||||
| model 1 | Genotype (J20) | –0.52990 | –0.705456 | –0.354390 | 34.6060 | <0.0001*** |
| model 2 | Genotype (J20) | –0.08300 | –0.146863 | –0.005228 | 28.3926 | <0.0001*** |
| Group composition (mixed) | 0.18900 | –0.020558 | 0.393048 | 0.2472 | 0.62398 | |
| Interaction: Genotype * Group composition | –0.47780 | –0.691569 | –0.246690 | 16.1957 | 0.00042*** | |
| Social contact frequency | ||||||
| β Estimate | 95% CI | F | p | |||
| lower | upper | |||||
| model 1 | Genotype (J20) | –0.44930 | –0.635661 | –0.262450 | 22.005 | 0.00028*** |
| model 2 | Genotype (J20) | –0.11710 | –0.182626 | –0.052331 | 32.2837 | <0.0001*** |
| Group composition (mixed) | 0.27240 | 0.105541 | 0.439057 | 2.2407 | 0.14862 | |
| Interaction: Genotype * Group composition | –0.31130 | –0.492493 | –0.129815 | 10.7211 | 0.00279** | |
| Social sniffing | ||||||
| β Estimate | 95% CI | F | p | |||
| lower | upper | |||||
| model 1 | Genotype (J20) | 0.40210 | 0.135306 | 0.663733 | 8.6962 | 0.000419*** |
| model 2 | Genotype (J20) | 0.02783 | –0.123502 | 0.179021 | 8.7999 | 0.004686** |
| Group composition (mixed) | –0.38430 | –0.595878 | –0.172801 | 5.1143 | 0.033877* | |
| Interaction: Genotype * Group composition | –0.34070 | –0.593880 | –0.087600 | 6.6023 | 0.01345* | |
| Nest Hide | ||||||
| β Estimate | 95% CI | F | p | |||
| lower | upper | |||||
| model 1 | Genotype (J20) | 182.19 | –149.499 | 513.876 | 1.1430 | 0.301 |
| model 2 | Genotype (J20) | 37.17 | –72.028 | 146.337 | 1.1521 | 0.2281 |
| Group composition (mixed) | 344.76 | 28.347 | 661.176 | 7.9251 | 0.01008* | |
| Interaction: Genotype * Group composition | 145.85 | –194.854 | 486.538 | 0.6680 | 0.421 | |
The table shows the regression coefficients (β estimate) and 95% Confidence Interval (CI) from the model, and the F-value and p-value of the ANOVA test. Stars indicate the significance levels of the p-values (*p < 0.05, **p < 0.01, ***p < 0.001). All estimates and CIs are on log scale, except the estimates of Nest Hide.
Table 3
Results of the post-hoc comparisons of model 2 with Tukey correction
| Distance moved | |||
| Estimate | SE | p | |
| J20mix - WTmix | 0.235 | 0.0701 | 0.0044** |
| J20mix - J20same | –0.05 | 0.0993 | 0.9582 |
| WTmix - WTsame | 0.208 | 0.1073 | 0.2117 |
| J20same - WTsame | 0.493 | 0.0965 | <0.0001*** |
| Social contact duration | |||
| Estimate | SE | p | |
| J20mix - WTmix | –0.0761 | 0.0359 | 0.147 |
| J20mix - J20same | 0.1863 | 0.1083 | 0.3129 |
| WTmix - WTsame | –0.2828 | 0.118 | 0.0776 |
| J20same - WTsame | –0.5452 | 0.1109 | <0.0001*** |
| Social contact frequency | |||
| Estimate | SE | p | |
| J20mix - WTmix | –0.1171 | 0.033 | 0.0022** |
| J20mix - J20same | 0.2724 | 0.0873 | 0.0098** |
| WTmix - WTsame | –0.0389 | 0.0951 | 0.9769 |
| J20same - WTsame | –0.4283 | 0.0896 | <0.0001*** |
| Social sniffing | |||
| Estimate | SE | p | |
| J20mix - WTmix | 0.0278 | 0.0767 | 0.9837 |
| J20mix - J20same | –0.3843 | 0.1109 | 0.003** |
| WTmix - WTsame | –0.0436 | 0.12 | 0.9836 |
| J20same - WTsame | 0.3686 | 0.1088 | 0.0039** |
| Nest Hide | |||
| Estimate | SE | p | |
| J20mix - WTmix | 37.2 | 55.3 | 0.9078 |
| J20mix - J20same | 344.8 | 165.6 | 0.1592 |
| WTmix - WTsame | 490.6 | 180.3 | 0.033* |
| J20same - WTsame | 183 | 169.7 | 0.7028 |
All estimates and standard errors (SE) are on log scale, except the estimates of Nest Hide. Stars indicate the significance levels of the p-values (*p < 0.05, **p < 0.01, ***p < 0.001).
An early social phenotype in J20same mice
Already at 10 weeks of age, J20same mice showed different social behavior compared to WTsame mice (Fig. 2B–F & Table 2 model 1). Social contact duration (β= –0.5299, 95% CI[–0.7054, –0.3543], p < 0.0001, Fig. 2C) and frequency (β= –0.4493, 95% CI[–0.6357, –0.2624], p = 0.0003, Fig. 2D) were significantly reduced in J20same mice. Further analyses revealed that the median bout duration of social contact was higher in WTsame colonies compared to J20same colonies (β= –0.4415, 95% CI[–0.643082, –0.236461], p < 0.001, Fig. 2F). Furthermore, sniffing duration was elevated in J20same mice compared to WTsame mice (β= 0.4021, 95% CI[0.1353 –0.6637], p = 0.0004, Fig. 2E). WTsame and J20same mice spent similar amounts of time in the open arena, as nest hide did not differ significantly between these groups (F = 1.143, p = 0.301).
Group composition variation altered individual social behavioral phenotypes
To investigate the effect of the social environment (i.e., group composition) on the social phenotype of J20 mice, social behavior of mice in mixed-genotype colonies was assessed and compared with behavior of mice from same-genotype colonies (Fig. 3A–E & Table 2: model 2 & Table 3).
Fig. 3
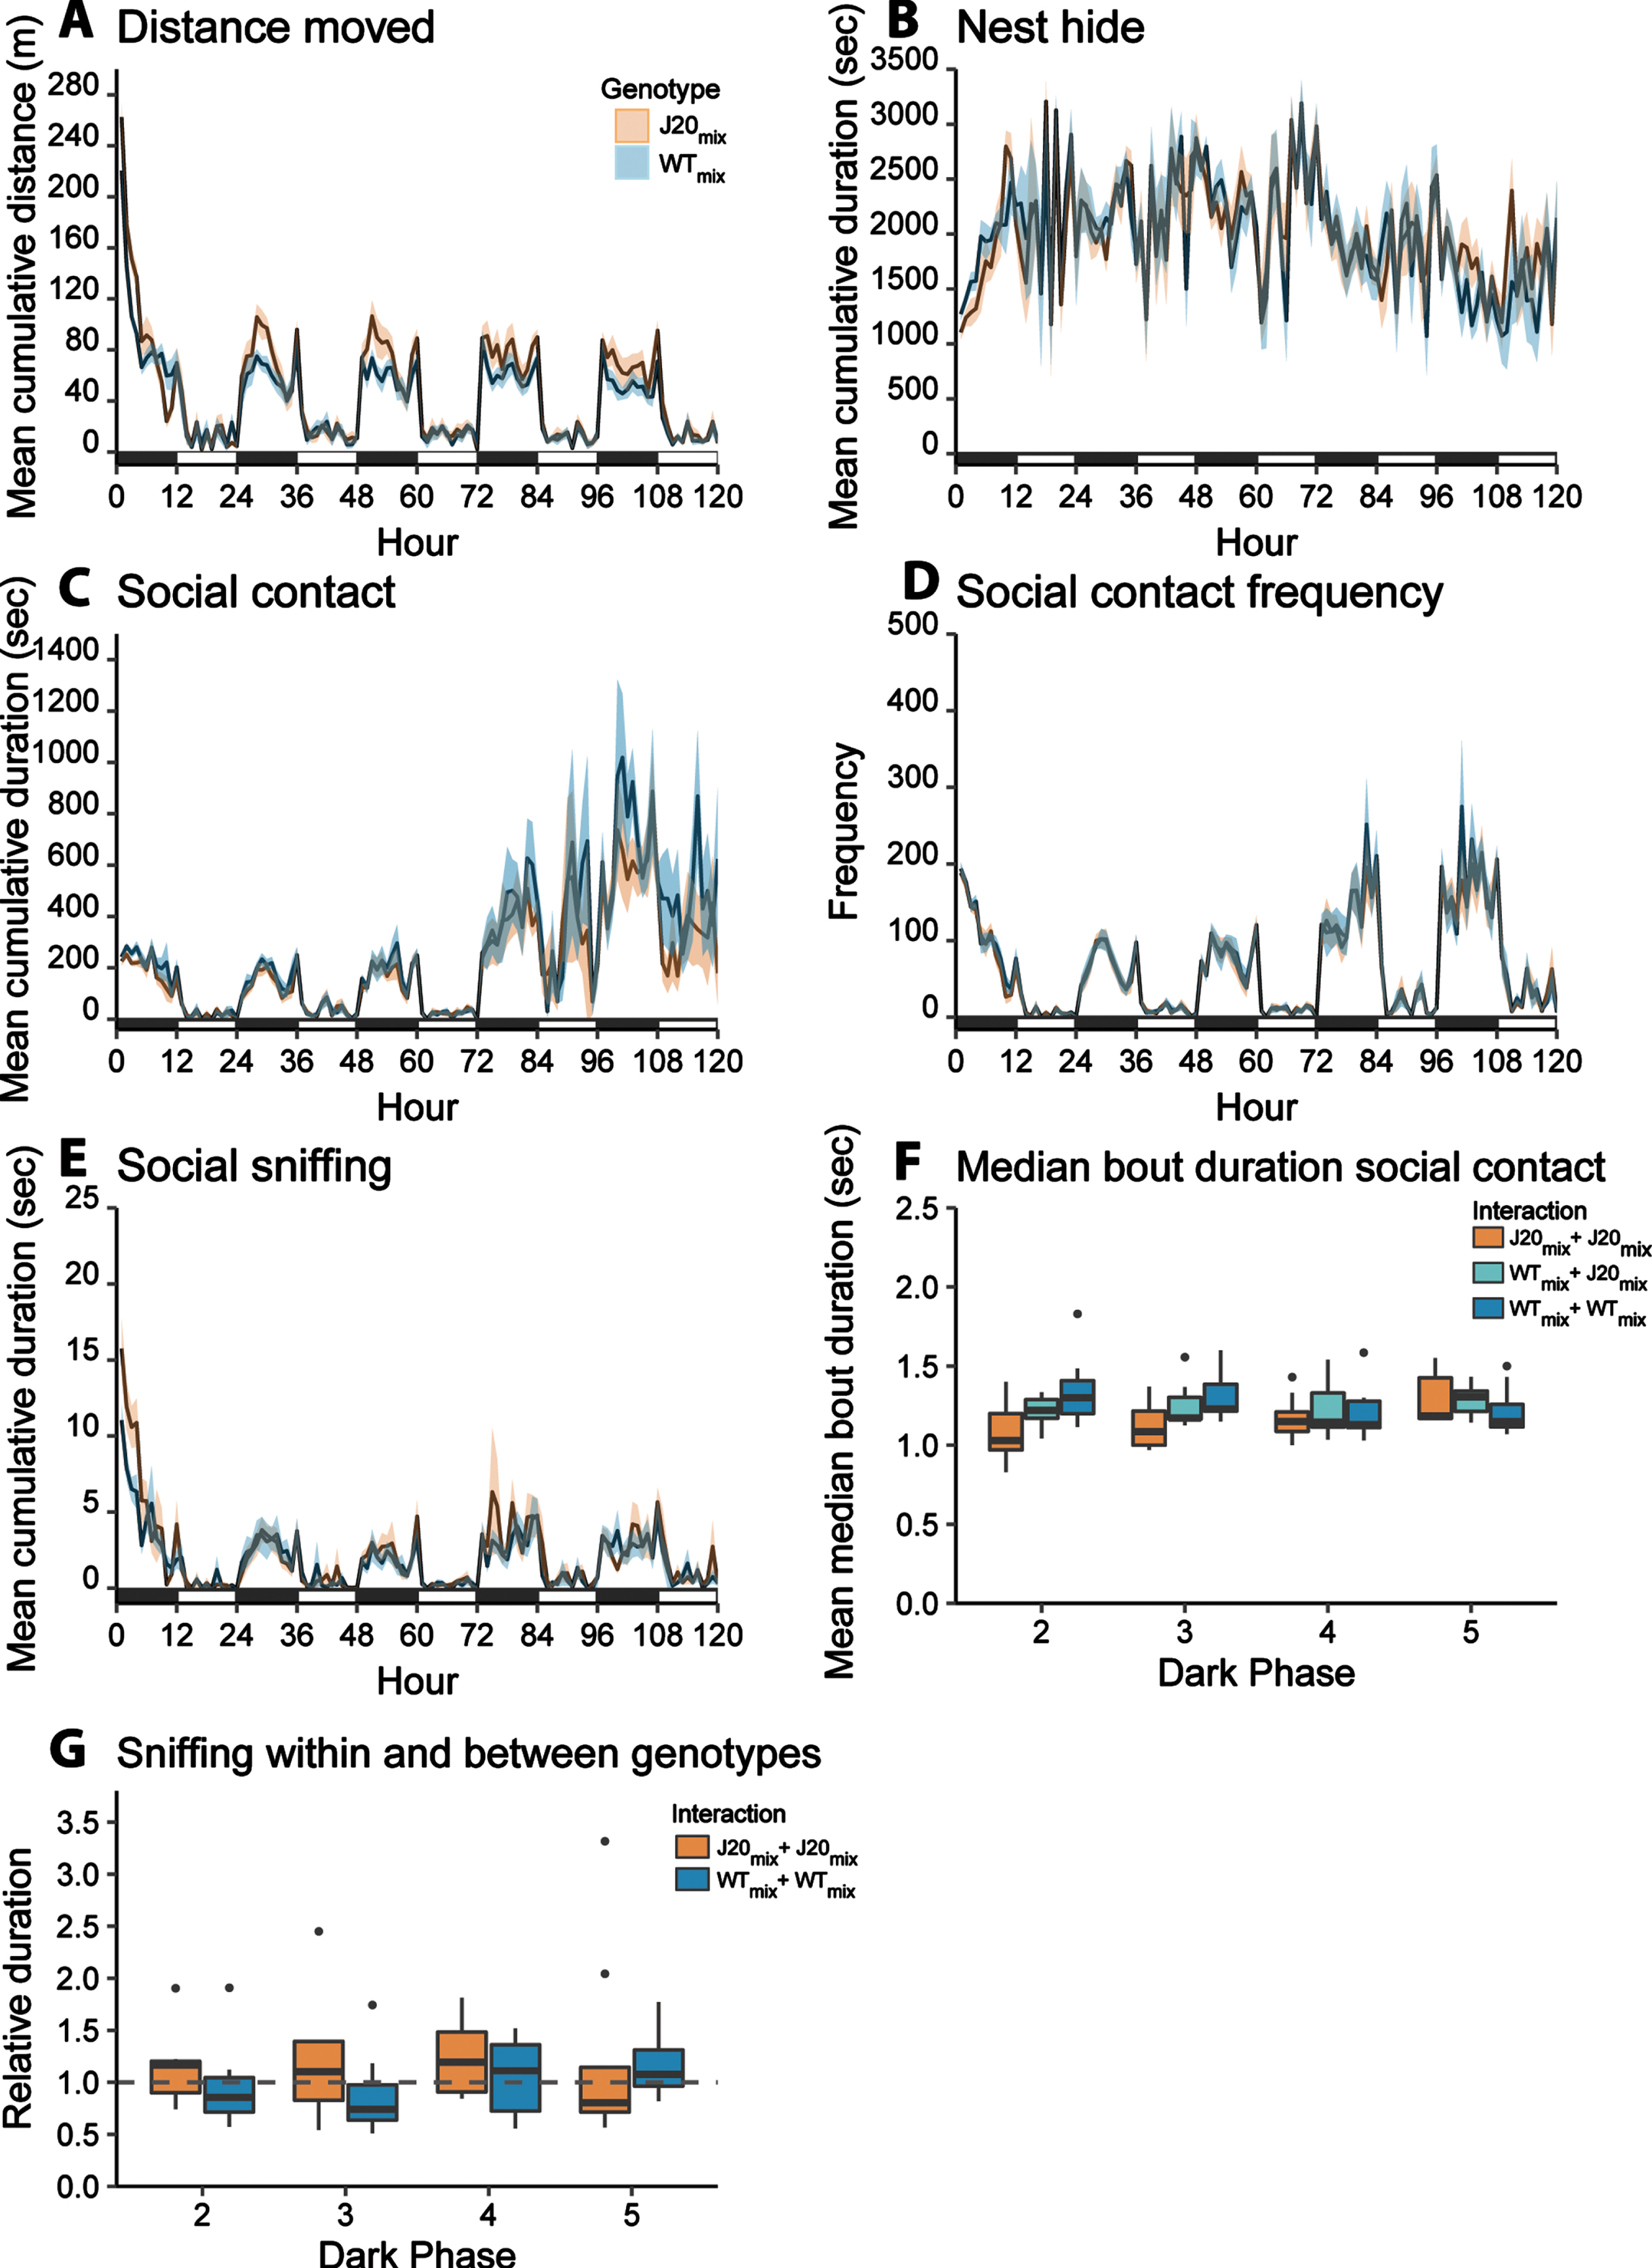
Social behavior of mice from mixed-genotype colonies A–E) Longitudinal recording of social behaviors in mixed-genotype colonies. The mean cumulative duration/frequency of the behavior per mouse is plotted over time. Error bands represent the standard error of the mean. The black and white bars at the x-axis represent dark- and light phase, respectively. J20mix mice display increased distance moved a reduced social contact frequency compared to WTmix mice. For the results of the statistical analyses, see Tables 2 and 3. F) The mean median bout duration of social contact between two J20 mice (orange), a WT and a J20 animal (turquoise), and two WT mice (blue) within each colony. G) The relative duration of sniffing a mouse of the same genotype (J20 in orange, WT in blue) compared to the duration of sniffing a mouse of a different genotype (dashed line). In none of the dark phases, the relative same-genotype sniffing was statistically higher or lower compared to different-genotype sniffing.
Social contact duration was affected by genotype (main effect Genotype[J20]: β= –0.0830, 95% CI[–0.1469, –0.0052], p < 0.0001) and this effect depended on group composition (interaction effect: ββ= –0.4778, 95% CI[–0.6916, –0.2467, p = 0.0004) (Fig. 3C). Post-hoc comparison showed that social contact duration was lower in J20 mice compared to WT mice in same-genotype colonies (post-hoc Tukey: p < 0.0001), but not in mixed-genotype colonies (post-hoc Tukey: p = 0.147). Social contact frequency was affected by genotype (main effect Genotype[J20] ββ= –0.1171, 95% CI[–0.1826, –0.0523], p < 0.0001) and this effect depended on group composition (interaction effect: ββ= –0.3113, 95% CI[–0.4925, –0.1298], p = 0.0028) (Figs. 2D and 3D). The frequency of social contact was lower in J20 mice compared to WT mice in both group compositions (post-hoc Tukey J20same versus WTsame, p < 0.0001; J20mix versus WTmix, p = 0.002). Group composition did not affect social contact duration of J20 mice (post-hoc Tukey: p = 0.313), while social contact frequency levels were elevated in J20mix mice compared to J20same mice (post-hoc Tukey: p = 0.0098).
Social sniffing duration was also affected by genotype (main effect Genotype[J20]: ββ= 0.0278, 95% CI[–0.1235, 0.1790], p = 0.0047) and group composition (main effect Group composition[mixed]: ββ= –0.3843, 95% CI[–0.5959, –0.1728], p = 0.034) (Fig. 3E). Furthermore, an interaction effect between genotype and group composition on sniffing duration was found (ββ= –0.341, 95% CI[–0.5939, –0.0876], p = 0.013). While J20same mice spent more time on social sniffing compared to WTsame mice, this genotype effect was absent in the mixed-genotype colonies (post-hoc Tukey: p = 0.984). J20mix mice spent less time on social sniffing compared to J20same mice (post-hoc Tukey: p = 0.003). The group composition did not affect the social sniffing duration of WT mice (post-hoc Tukey WTsame vs WTmix, p = 0.984).
Distance moved was affected by genotype (main effect Genotype[J20]: ββ= 0.2351, 95% CI[0.0968, 0.3733], p < 0.0001) and this effect was modulated by group composition (interaction effect: ββ= –0.2580, 95% CI[0.0303, 4.6801], p = 0.036). J20 mice displayed higher distance moved compared to WT mice in same-genotype colonies (Fig. 2A, post-hoc Tukey: p < 0.0001) and mixed-genotype colonies (Fig. 3A, post-hoc Tukey: p = 0.004). Group composition did not affect the distance moved of J20 mice (post-hoc Tukey: p = 0.953) or WT mice (post-hoc Tukey: p = 0.212). Time spent in the nest boxes was influenced by group composition (main effect group composition[mixed-genotype]: ββ= 344.76, 95% CI[28.347–661,176], p = 0.010) (Figs. 2B and 3B). Mixed-genotype housing resulted in increased nest hide duration of WTmix mice compared to WTsame mice (post-hoc Tukey: p = 0.033). All statistical outcomes are stated in Tables 2 and 3 and a visual summary of the results is displayed in Fig. 4.
Fig. 4
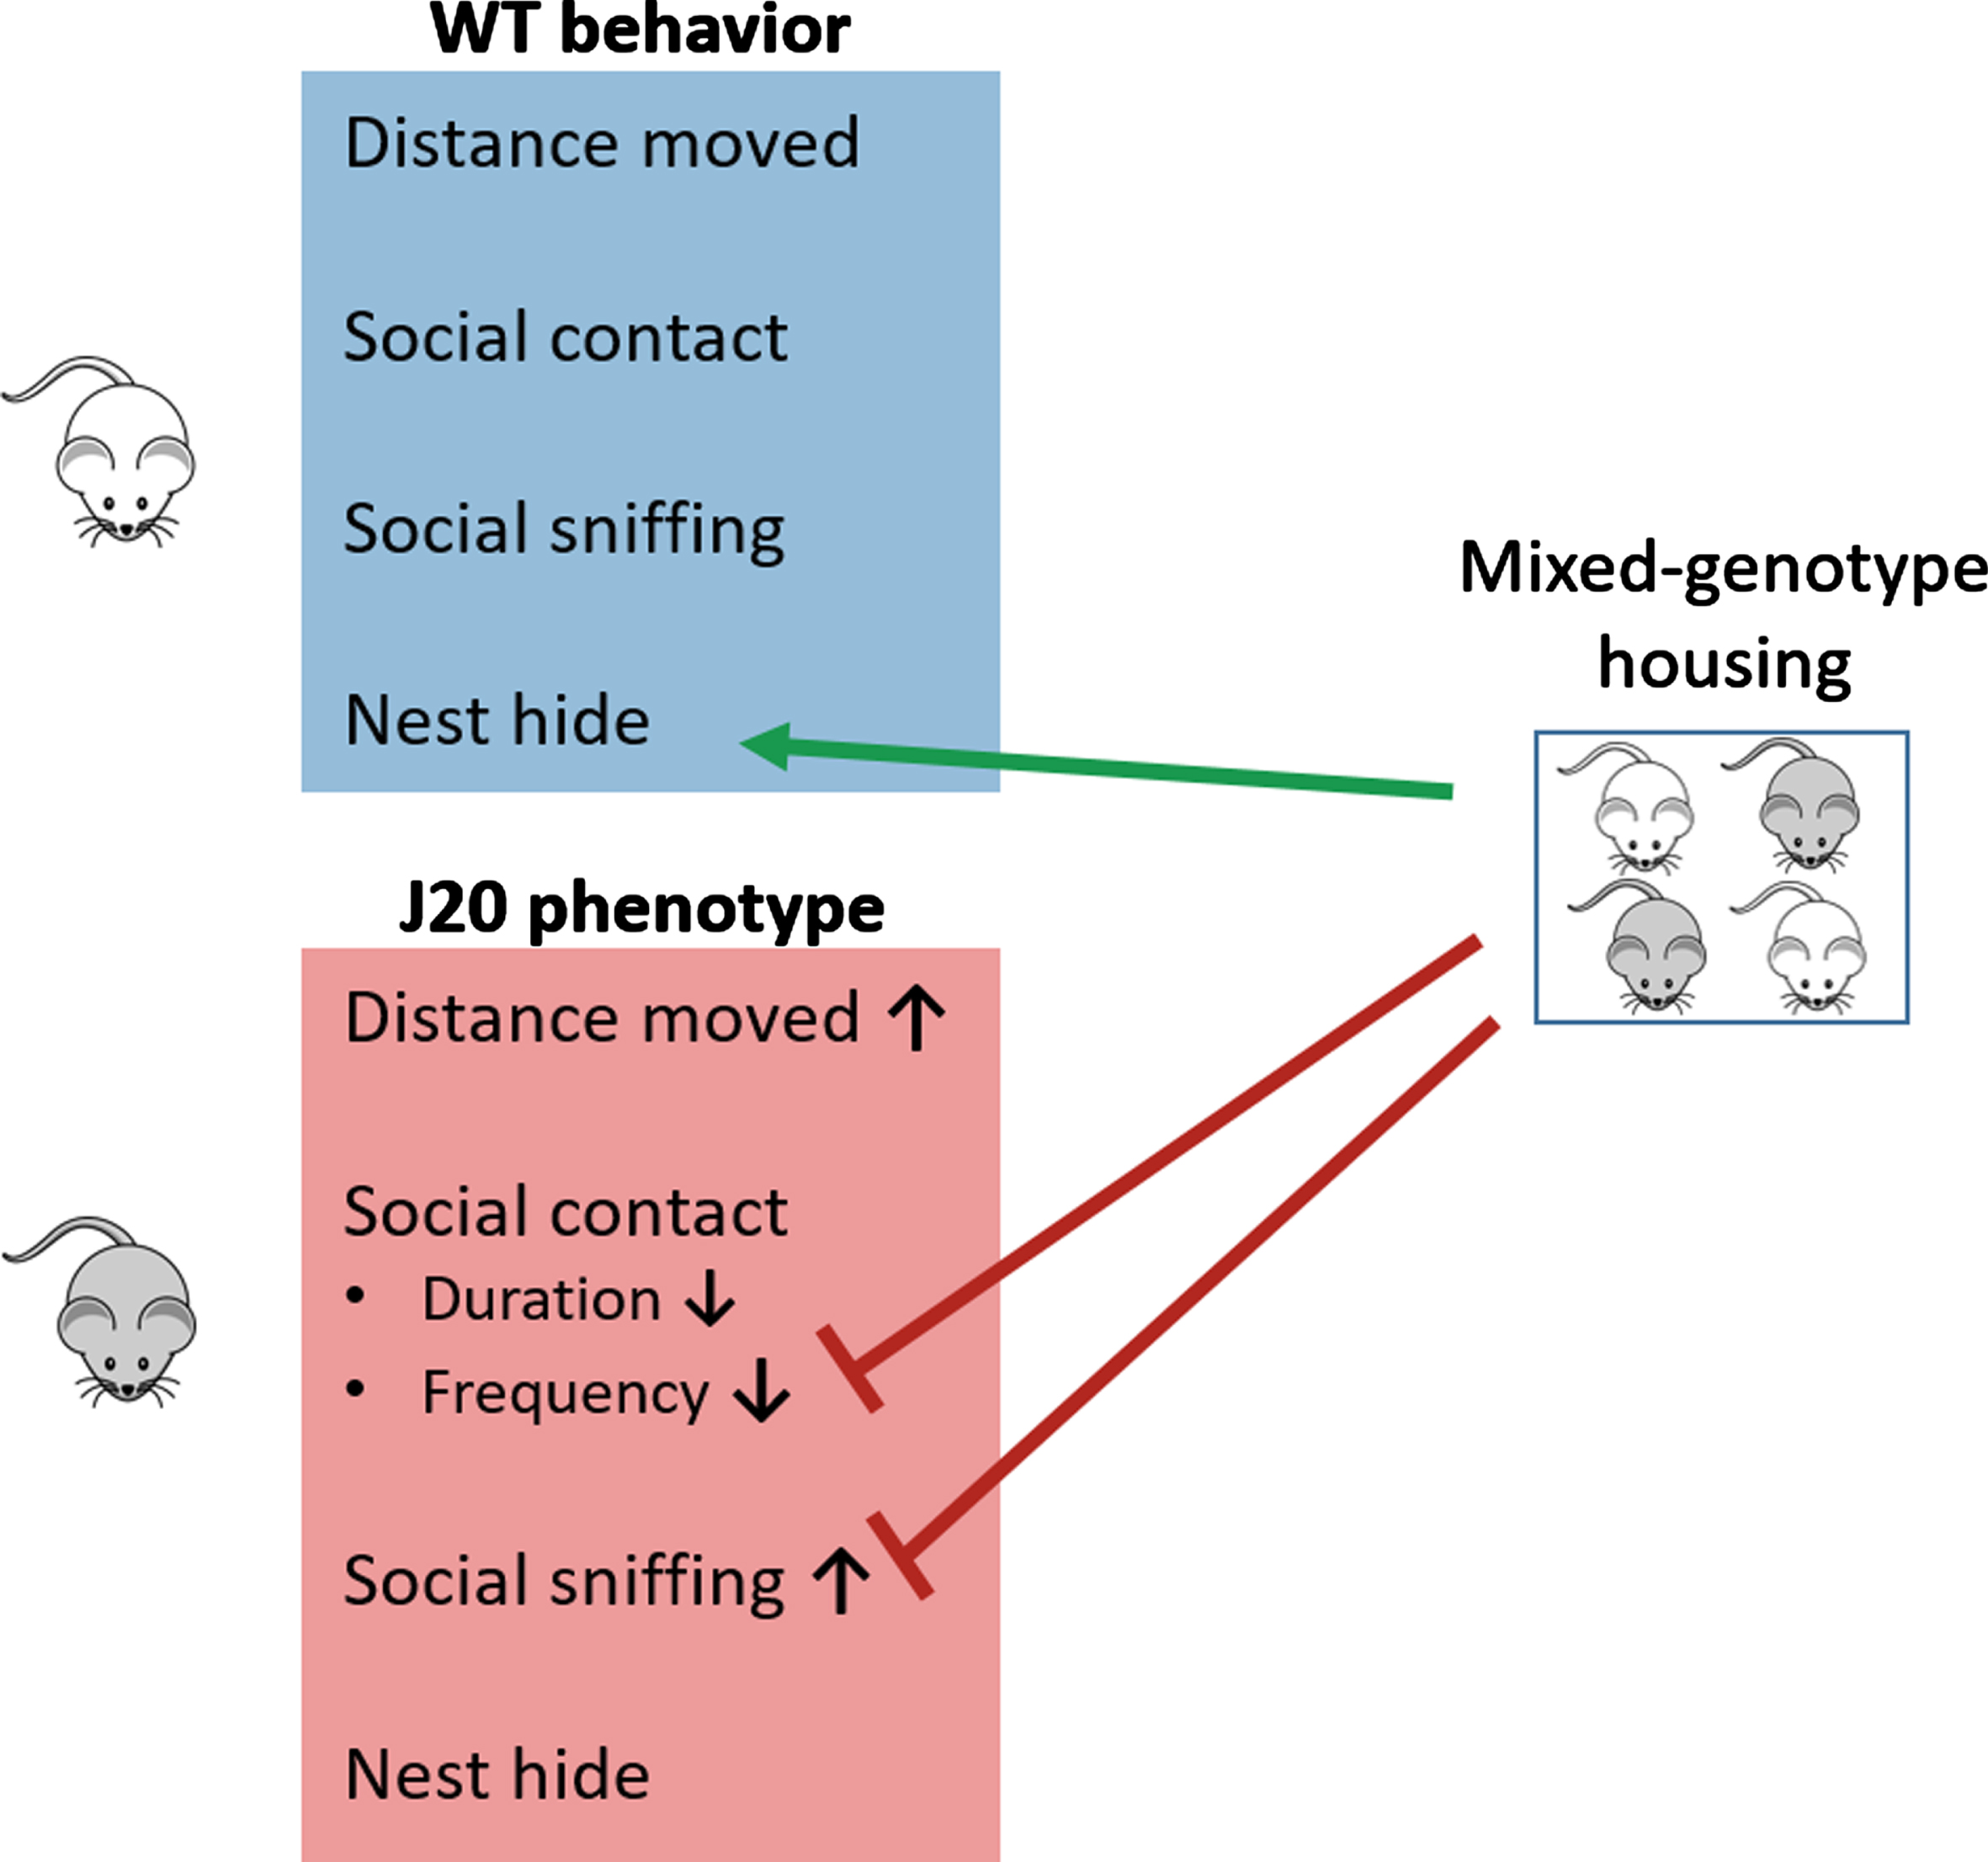
Visual summary of the results. In contrast to WTsame mice, the J20 phenotype encompasses increased distance moved, reduced social contact duration and frequency, and increased social sniffing duration. Mixed-genotype housing increased nest hide of WT mice, increased the social contact frequency of J20 mice and reduced the social sniffing phenotype of J20 mice to a level that their sniffing duration is lower compared to J20same mice and similar to that of WTmix mice.
Social interaction within mixed-genotype colonies
Additionally, we examined within the mixed-genotype colonies whether social interactions (social contact or social sniffing) between mice of the same genotype differed from that of interactions with a mouse of a different genotype (Fig. 3F). Social contact bout duration was significantly higher between two WT mice, compared to the interaction between a WT and J20 mouse (p = 0.035) or two J20 mice (p = 0.008). Furthermore, no difference in the relative occurrence of sniffing a same-genotype mouse or different-genotype mouse was found (Fig. 3G).
DISCUSSION
In this study, we show that 10-week-old female hAββPP-transgenic J20 mice display a distinct social phenotype compared to WT mice and that the composition of the social group affects the social behavior of both J20 and WT mice (see also findings summary; Fig. 4). This was achieved by performing longitudinal behavioral recordings with the BARISTA system, allowing automated and objective scoring of multiple behavioral measures.
Aberrant social behavior is an early behavioral phenotype in female J20 mice. The lower total time spent in social contact, frequency of social contact, and lower median bout duration of social contact of J20same mice compared to WTsame mice indicates reduced sociability of J20same mice. Besides the genotype differences in social contact when looking at the 4-day period, we observed an effect of day. An increase in social contact duration and frequency of both WT and J20 mice in same- and mixed-genotype colonies over the course of the 5 days of recording was observed, which was not present in the other read-outs. Possibly, habituation to the BARISTA environment plays a role in this phenomenon, resulting in increased cuddling in the open arena compared to the nest boxes.
Another proxy for sociability is social sniffing [32], yet, J20same mice spent more time on social sniffing compared to WTsame mice, which seems to contradict the finding of reduced sociability based on reduced social contact. Possibly, sniffing was increased as a consequence of an altered cellular composition and neurogenic activity in the olfactory bulb of J20 mice [33]. Reduced olfactory functioning is an early hallmark of AD and has also been detected in many AD mouse models [34], which is likely associated with hAPP overexpression [33, 35]. The increased sniffing time could thus be an indirect effect of lower smell detection capacity or diminished olfactory memory and may not directly reflect sociability.
The observed differences in social behavior of J20 mice compared to WT mice indicate that altered social behavior is an early indicator of hAPP-pathology, but the contribution of Aββ to this early phenotype is unknown. While Aββ plaques start to form by the age of 5–7 months [18], hAPP is overexpressed from birth in the J20 mouse line [17–19]. Despite the correlation of protein depositions with brain alterations in AD, accumulating evidence points to soluble Aββ (sAββ) oligomeric aggregates rather than the insoluble depositions as the primary cause of dementia-related brain pathology [36, 37]. Interestingly, Mondragón-Rodríguez et al. (2018) did not detect sAββ in 30-day-old J20 mice, but did detect increased levels of intracellular ββ-C-terminal fragment (ββ-CTF), an early product of amyloidogenic cleavage of hAPP by ββ-secretase [38]. Concurrently, these mice displayed network alterations in the CA1/subiculum. In line with those observations, other studies describe a role of this protein in the pathogenesis of AD, irrespective of Aββ levels [39, 40]. ββ-CTF levels were found to be elevated in J20 mice until the age of 120 days [38], and may thus have been elevated in the mice of our experiments as well, possibly underlying the observed early phenotype.
The behavioral phenotype of young (<3 months old) J20 mice has not been studied extensively. Therefore, it remains to be determined how the observed alterations in social behavior relate to the cognitive deficits. While most studies perform cognitive tests in J20 mice of >4 months of age [17–19], one study found impaired memory in the novel object recognition task in 2-3-month-old male J20 mice [28]. Given the substantial structural and functional overlap between the social and cognitive domain [41], it is expected that social and cognitive deficits arise conjointly. Indeed, many neurological and neuropsychiatric disorders, including AD, present with social and cognitive deficits [11, 42, 43]. To what extent the functional consequences in each domain are detectable may depend on the severity of the affected brain region(s) and the assessment tools applied.
At this stage, we can only speculate on the causes of the social phenotype changes as a function of group composition variation. Of note is that the mixed-genotype housing has behavioral consequences for both WT and J20 mice and that these consequences differ per genotype. Mixed-genotype housing alters nest hiding behavior in the WT mice, while it modulates the original J20 genotype effect on social contact frequency and social sniffing. We can think of several causes for a change in social dynamics in mixed-genotype colonies. First, the increased locomotor activity of J20 mice may affect WT mice in such a way that WT mice hide more when being housed with J20 mice due to, for example, increased anxiety behavior. Kulesskayo et al. (2014) found that female C57Bl/6 mice experienced more stress from co-housing with DBA/2 mice compared to the DBA/2 mice [44]. Second, a different social hierarchy may exist in mixed-genotype colonies compared to same-genotype colonies. Likewise, Bodden et al. (2020) showed that female C57Bl/6 mice displayed more social avoidance and agonistic behaviors when co-housed with DBA/2 mice, and more sociability towards peers of their own strain [45]. Third, the exposure to a more diverse social environment (social enrichment) may stimulate (olfactory) neurogenesis, which could underlie the absence of the social sniffing phenotype in J20mix mice. Lastly, the microbiome may play a role in changing behavior in mixed-genotype colonies (for review, see: [46, 47]). Microbiota exchange can occur through coprophagy and grooming behavior. Furthermore, an altered microbiome profile has been observed in AD patients and APP/PS-1 mice [48, 49]. Interestingly, specific alterations of the microbiome of Cntnap2–/– mice, a model for neurodevelopmental disorders, could partially rescue their social deficits [50].
Improved sociability in mixed-housing conditions has also been described for BTBR mice (a mouse strain often studied in the context of autism) when housed with C57Bl/6 mice [51]. Moreover, Hsiao et al. [52] found that co-housing APP/PS-1 mice with WT mice for 3 months could rescue cognitive decline [52]. Follow-up studies are required to elucidate the mechanism underlying changed behavior in mixed-genotype colonies. Taken together, housing J20 mice with WT mice seemed to contribute to the normalization of social engagement to WT levels both for social contact frequency and social sniffing, and modulation of the social environment may constitute an interesting intervention approach to improve behavioral functioning.
Limitations
Of note is that all behaviors were only measured in the open arena of the BARISTA, but not in the nest boxes as their insides are invisible to the camera. Nest hide during the active phase may be an indication of the level of anxiety and/or social withdrawal. Unfortunately, the current BARISTA set-up does not allow discrimination between social and solitary nest hide. Therefore, the nest hide data could not be used to assess social withdrawal. Furthermore, our study was performed in only one gender, which limits the translatability of the current results. Repeating this experiment in male mice will provide additional insights into the general relationship between social functioning and AD-pathology.
Implications and conclusion
Successful treatment of AD requires early diagnosis and intervention. Our data showed that altered social behavior is an early indicator of hAPP-pathology in female J20 mice. Alterations in social behavior have also been described in AD patients, therefore, the presence of a social phenotype in J20 mice adds value to this mouse model. How this social phenotype relates to the AD pathophysiology and cognitive deficits in humans, remains to be investigated. Yet, a greater focus on social behavioral changes of an individual may contribute to early diagnosis and a more accurate prognosis [53]. Moreover, we have shown that the social environment can modulate the behavioral phenotype of both WT and J20 mice during an early stage of the pathology. This strengthens the perspective for research modulating the social environment of AD patients as a possible intervention. Yet, ‘social environment’ is a broad term and further research is required in order to define the meaning of this concept for both humans and mice, separately. After all, the social interaction and organization of humans differ from that of mice. Next, knowledge of the mode of action underlying the interaction between the social environment and the social phenotype is required in order to extrapolate results from social environments of mice to humans.
ACKNOWLEDGMENTS
We thank Diane ten Have for breeding the mice and Kevin Ike for his help with the BARISTA system.
FUNDING
This study is supported by the ZonMW memorable project (grant number: 733050831).
CONFLICT OF INTEREST
The authors have no conflict of interest to report.
DATA AVAILABILITY
Data will be made available upon request to the corresponding author.
SUPPLEMENTARY MATERIAL
[1] The supplementary material is available in the electronic version of this article: https://dx.doi.org/10.3233/JAD-221126.
REFERENCES
[1] | Flicker L ((2010) ) Modifiable lifestyle risk factors for Alzheimer’s disease. J Alzheimers Dis 20: , 803–811. |
[2] | Kivipelto M , Mangialasche F , Ngandu T ((2018) ) Lifestyle interventions to prevent cognitive impairment, dementia and Alzheimer disease. Nat Rev Neurol 14: , 653–666. |
[3] | Ballard C , Gauthier S , Corbett A , Brayne C , Aarsland D , Jones E ((2011) ) Alzheimer’s disease. Lancet 377: , 1019–1031. |
[4] | Balouch S , Rifaat E , Chen HL , Tabet N ((2019) ) Social networks and loneliness in people with Alzheimer’s dementia. Int J Geriatr Psychiatry 34: , 666–673. |
[5] | Penninkilampi R , Casey AN , Singh MF , Brodaty H ((2018) ) The association between social engagement, loneliness, and risk of dementia: A systematic review and meta-analysis. J Alzheimers Dis 66: , 1619–1633. |
[6] | Sundström A , Adolfsson AN , Nordin M , Adolfsson R ((2020) ) Loneliness increases the risk of all-cause dementia and alzheimer’s disease. J Gerontol B Psychol Sci Soc Sci 75: , 919–926. |
[7] | Salinas J , Beiser AS , Samra JK , Odonnell A , Decarli CS , Gonzales MM , Aparicio HJ , Seshadri S ((2022) ) Association of loneliness with 10-year dementia risk and early markers of vulnerability for neurocognitive decline. Neurology 98: , E1337–E1348. |
[8] | Huang H , Wang L , Cao M , Marshall C , Gao J , Xiao N , Hu G , Xiao M , Xiao N , Xiao M ((2015) ) Isolation housing exacerbates Alzheimer’s disease- like pathophysiology in aged APP/PS1 mice. Int J Neuropsychopharmacol 18: , pyu116. |
[9] | Cerejeira J , Lagarto L , Mukaetova-Ladinska EB ((2012) ) Behavioral and psychological symptoms of dementia. Front Neurol 3: , 73. |
[10] | Mazzi C , Massironi G , Sanchez-Lopez J , De Togni L , Savazzi S ((2020) ) Face recognition deficits in a patient with Alzheimer’s disease: Amnesia or agnosia? The importance of electrophysiological markers for differential diagnosis. Front Aging Neurosci 12: , 580609. |
[11] | Kessels RPC , Waanders-Oude Elferink M , van Tilborg I ((2021) ) Social cognition and social functioning in patients with amnestic mild cognitive impairment or Alzheimer’s dementia. J Neuropsychol 15: , 186–203. |
[12] | Ang YS , Lockwood P , Apps MAJ , Muhammed K , Husain M ((2017) ) Distinct subtypes of apathy revealed by the apathy motivation index. PLoS One 12: , e0169938. |
[13] | Mucke L , Masliah E , Yu GQ , Mallory M , Rockenstein EM , Tatsuno G , Hu K , Kholodenko D , Johnson-Wood K , McConlogue L ((2000) ) High-level neuronal expression of abeta 1-42 in wild-type human amyloid protein precursor transgenic mice: Synaptotoxicity without plaque formation. J Neurosci 20: , 4050–4058. |
[14] | Lin KA , Doraiswamy PM ((2015) ) When Mars versus Venus is not a cliché: Gender differences in the neurobiology of Alzheimer’s disease. Front Neurol 5: , 288. |
[15] | Bangasser DA , Valentino RJ ((2014) ) Sex differences in stress-related psychiatric disorders: Neurobiological perspectives. Front Neuroendocr 35: , 303–319. |
[16] | van Doeselaar L , Yang H , Bordes J , Brix L , Engelhardt C , Tang F , Schmidt MV ((2021) ) Chronic social defeat stress in female mice leads to sex-specific behavioral and neuroendocrine effects. Stress 24: , 168–180. |
[17] | Quartey MO , Nyarko JNK , Pennington PR , Heistad RM , Chaharyn BM , Wei Z , Bainbridge D , Baker GB , Mousseau DD ((2019) ) Age- and sex-dependent profiles of APP fragments and key secretases align with changes in despair-like behavior and cognition in young APPSwe/Ind mice. Biochem Biophys Res Commun 511: , 454–459. |
[18] | Wright AL , Zinn R , Hohensinn B , Konen LM , Beynon SB , Tan RP , Clark IA , Abdipranoto A , Vissel B ((2013) ) Neuroinflammation and neuronal loss precede Aββ plaque deposition in the hAPP-J20 mouse model of Alzheimer’s disease. PLoS One 8: , e59586. |
[19] | Cheng IH , Scearce-Levie K , Legleiter J , Palop JJ , Gerstein H , Bien-Ly N , Puoliväli J , Lesné S , Ashe KH , Muchowski PJ , Mucke L ((2007) ) Accelerating amyloid-ββ fibrillization reduces oligomer levels and functional deficits in Alzheimer disease mouse models. J Biol Chem 282: , 23818–23828. |
[20] | Filali M , Lalonde R , Rivest S ((2011) ) Anomalies in social behaviors and exploratory activities in an APPswe/PS1 mouse model of Alzheimer’s disease. Physiol Behav 104: , 880–885. |
[21] | Watt G , Przybyla M , Zak V , van Eersel J , Ittner A , Ittner LM , Karl T ((2020) ) Novel behavioural characteristics of male human P301S mutant tau transgenic mice –a model for tauopathy. Neuroscience 431: , 166–175. |
[22] | Pietropaolo S , Delage P , Lebreton F , Crusio WE , Cho YH ((2012) ) Early development of social deficits in APP and APP-PS1 mice. Neurobiol Aging 33: , 1002.e17–1002.e27. |
[23] | Bove M , Ike K , Eldering A , Buwalda B , De Boer SF , Morgese MG , Schiavone S , Cuomo V , Trabace L , Kas MJH ((2018) ) The Visible Burrow System: A behavioral paradigm to assess sociability and social withdrawal in BTBR and C57BL/6J mice strains. Behav Brain Res 344: , 9–19. |
[24] | Peleh T , Bai X , Kas MJH , Hengerer B , Ingelheim B , Gmbh P , Kg C , Riss Der B ((2019) ) RFID-supported video tracking for automated analysis of social behaviour in groups of mice. J Neurosci Methods 325: , 108323. |
[25] | Gulbranson DR , Ho K , Yu GQ , Yu X , Das M , Shao E , Kim D , Zhang WJ , Choudhary K , Thomas R , Mucke L ((2021) ) Phenotypic differences between the Alzheimer’s disease-related hAPP-J20 model and heterozygous Zbtb20 knock-out mice. , . eNeuro 8: , ENEURO.0089-21.2021. |
[26] | Vogt DL , Thomas D , Bredesen DE , Lamb BT , Pimplikar SW ((2011) ) Abnormal neuronal networks and seizures susceptibility in mice overexpressing the APP intracellular domain. Neurobiol Aging 32: , 1725–1729. |
[27] | Peleh T , Ike KGO , Frentz I , Buwalda B , de Boer SF , Hengerer B , Kas MJH ((2020) ) Cross-site reproducibility of social deficits in group-housed BTBR mice using automated longitudinal behavioural monitoring. Neuroscience 445: , 95–108. |
[28] | Harris JA , Devidze N , Halabisky B , Lo I , Thwin MT , Yu GQ , Bredesen DE , Masliah E , Mucke L ((2010) ) Many neuronal and behavioral impairments in transgenic mouse models of Alzheimer’s disease are independent of caspase cleavage of the amyloid precursor protein. J Neurosci 30: , 372–381. |
[29] | RStudio Team (2020) RStudio: RStudio: Integrated Development for R. |
[30] | Wickham H , (2016) ggplot2: Elegant graphics for data analysis. |
[31] | Kuznetsova A , Brockhoff PB , Christensen RHB ((2017) ) lmerTest package: Tests in linear mixed effects models. J Stat Softw 82: , 1–26. |
[32] | Kas MJ , Glennon JC , Buitelaar J , Ey E , Biemans B , Crawley J , Ring RH , Lajonchere C , Esclassan F , Talpos J , Noldus LPJJ , Burbach JPH , Steckler T ((2014) ) Assessing behavioural and cognitive domains of autism spectrum disorders in rodents: Current status and future perspectives. Psychopharmacology (Berl) 231: , 1125–1146. |
[33] | Rusznák Z , Kim WS , Hsiao JHT , Halliday GM , Paxinos G , Fu YH ((2015) ) Early in vivo effects of the human mutant amyloid-ββ protein precursor (hAββPPSwInd) on the mouse olfactory bulb. J Alzheimers Dis 49: , 443–457. |
[34] | Tzeng W , Figarella K , Garaschuk O ((2021) ) Olfactory impairment in men and mice related to aging and amyloid-induced pathology. Pflugers Arch 473: , 805–821. |
[35] | Whitesell JD , Buckley AR , Knox JE , Kuan L , Graddis N , Pelos A , Mukora A , Wakeman W , Bohn P , Ho A , Karla E , Harris JA ((2019) ) Whole brain imaging reveals distinct spatial patterns of amyloid beta deposition in three mouse models of Alzheimer’s disease. J Comp Neurol 527: , 2122–2145. |
[36] | Mucke L , Selkoe DJ ((2012) ) Neurotoxicity of amyloid protein: β Synaptic and network dysfunction Cold Spring Harb Perspect Med 2: , a006338. |
[37] | Haass C , Selkoe DJ ((2007) ) Soluble protein oligomers in neurodegeneration: Lessons from the Alzheimer’s amyloid ββ-peptide. Nat Rev Mol Cell Biol 8: , 101–112. |
[38] | Mondragón-Rodríguez S , Gu N , Manseau F , Williams S ((2018) ) Alzheimer’s transgenic model is characterized by very early brain network alterations and ββ-CTF fragment accumulation: Reversal by ββ-secretase inhibition. Front Cell Neurosci 12: , 121. |
[39] | Kwart D , Gregg A , Scheckel C , Murphy E , Paquet D , Duffield M , Fak J , Olsen O , Darnell R , Tessier-Lavigne M ((2019) ) A large panel of isogenic APP and PSEN1 mutant human iPSC neurons reveals shared endosomal abnormalities mediated by APP ββ-CTFs, not Aββ. Neuron 104: , 256–270.e5. |
[40] | Vaillant-Beuchot L , Mary A , Pardossi-Piquard R , Bourgeois A , Lauritzen I , Eysert F , Kinoshita PF , Cazareth J , Badot C , Fragaki K , Bussiere R , Martin C , Mary R , Bauer C , Pagnotta S , Paquis-Flucklinger V , Buée-Scherrer V , Buée L , Lacas-Gervais S , Checler F , Chami M ((2021) ) Accumulation of amyloid precursor protein C-terminal fragments triggers mitochondrial structure, function, and mitophagy defects in Alzheimer’s disease models and human brains. Acta Neuropathol 141: , 39–65. |
[41] | Lanooij SD , Eisel ULM , Drinkenburg WHIM , van der Zee EA , Kas MJH ((2023) ) Influencing cognitive performance via social interactions: A novel therapeutic approach for brain disorders based on neuroanatomical mapping? Mol Psychiatry 28: , 28–33. |
[42] | Cotter J , Granger K , Backx R , Hobbs M , Looi CY , Barnett JH ((2018) ) Social cognitive dysfunction as a clinical marker: A systematic review of meta-analyses across 30 clinical conditions. Neurosci Biobehav Rev 84: , 92–99. |
[43] | Porcelli S , Van Der Wee N , van der Werff S , Aghajani M , Glennon JC , van Heukelum S , Mogavero F , Lobo A , Olivera FJ , Lobo E , Posadas M , Dukart J , Kozak R , Arce E , Ikram A , Vorstman J , Bilderbeck A , Saris I , Kas MJ , Serretti A ((2019) ) Social brain, social dysfunction and social withdrawal. Neurosci Biobehav Rev 97: , 10–33. |
[44] | Kulesskaya N , Karpova NN , Ma L , Tian L , Voikar V ((2014) ) Mixed housing with DBA/2 mice induces stress in C57BL/6 mice: Implications for interventions based on social enrichment. Front Behav Neurosci 8: , 257. |
[45] | Bodden C , Wewer M , Kästner N , Palme R , Kaiser S , Sachser N , Richter SH ((2021) ) Not all mice are alike: Mixed-strain housing alters social behaviour. Physiol Behav 228: , 113220. |
[46] | Sherwin E , Bordenstein SR , Quinn JL , Dinan TG , Cryan JF ((2019) ) Microbiota and the social brain. Science 366: , eaar2016. |
[47] | Vuong HE , Yano JM , Fung TC , Hsiao EY ((2017) ) The microbiome and host behavior. Annu Rev Neurosci 40: , 21–49. |
[48] | Varesi A , Pierella E , Romeo M , Piccini GB , Alfano C , Bjørklund G , Oppong A , Ricevuti G , Esposito C , Chirumbolo S , Pascale A ((2022) ) The potential role of gut microbiota in Alzheimer’s disease: From diagnosis to treatment. Nutrients 14: , 668. |
[49] | Bäuerl C , Collado MC , Diaz Cuevas A , Viña J , Pérez Martínez G ((2018) ) Shifts in gut microbiota composition in an APP/PSS1 transgenic mouse model of Alzheimer’s disease during lifespan. Lett Appl Microbiol 66: , 464–471. |
[50] | Buffington SA , Dooling SW , Sgritta M , Noecker C , Murillo OD , Felice DF , Turnbaugh PJ , Costa-Mattioli M ((2021) ) Dissecting the contribution of host genetics and the microbiome in complex behaviors. Cell 184: , 1740–1756.e16. |
[51] | Yang M , Perry K , Weber MD , Katz AM , Crawley JN ((2011) ) Social peers rescue autism-relevant sociability deficits in adolescent mice. Autism Res 4: , 17–27. |
[52] | Hsiao YH , Hung HC , Chen SH , Gean PW ((2014) ) Social interaction rescues memory deficit in an animal model of Alzheimer’s disease by increasing BDNF-dependent hippocampal neurogenesis. J Neurosci 34: , 16207–16219. |
[53] | Roberto N , Portella MJ , Marquié M , Alegret M , Hernández I , Mauleón A , Rosende-Roca M , Abdelnour C , Esteban de Antonio E , Tartari JP , Vargas L , López-Cuevas R , Bojaryn U , Espinosa A , Ortega G , Pérez-Cordón A , Sanabria Á , Orellana A , de Rojas I , Moreno-Grau S , Montrreal L , Alarcón-Martín E , Ruíz A , Tárraga L , Boada M , Valero S ((2021) ) Neuropsychiatric profile as a predictor of cognitive decline in mild cognitive impairment. Front Aging Neurosci 13: , 718949. |


