
Altered Anterior Insular Metabolic Connectivity in Asymptomatic MAPT P301L Carriers
Abstract
Background:
The insula is the predominant brain region impaired in behavioral variant frontotemporal dementia (bvFTD). However, structural and functional changes in the sub-insula in the asymptomatic stage of bvFTD are unknown.
Objective:
To describe structural and functional changes in insula subregions in asymptomatic carriers of the P301L mutation of the microtubule-associated protein tau (MAPT) gene and patients with bvFTD.
Methods:
Six asymptomatic MAPT P301L mutation carriers and 12 MAPT negative control subjects of the same pedigree were enrolled, along with 30 patients with a clinical diagnosis of bvFTD and 30 matched controls. All subjects underwent hybrid positron emission tomography/magnetic resonance imaging. Atlas-based parcellation using a fine-grained Brainnetome Atlas was conducted to assess gray matter (GM) volume, metabolism, and metabolic connectivity in the sub-insula (region of interest).
Results:
There was no significant GM atrophy or hypometabolism in insula subregions in asymptomatic MAPT P301L carriers, although decreased metabolic connectivity between vIa-middle temporal gyrus, vIa-temporal poles, dIa-middle temporal gyrus and dIa-temporal poles; and increased connectivity between vIa-orbitofrontal, vIa-dorsal lateral superior frontal gyrus, and dIa-orbitofrontal and dIa-dorsal lateral superior frontal gyrus were observed. Patients with bvFTD had significant atrophy and hypometabolism in all insula subregions and decreased metabolic connectivity in the whole brain, including vIa/dIa-middle temporal and vIa/dIa-temporal poles. The standardized uptake value ratios of vIa and dIa were negatively associated with Frontal behavior inventory disinhibition scale scores.
Conclusion:
Metabolic connectivity is altered in vIa and dIa subregions of the sub-insula in MAPT P301L mutation carriers before the occurrence of atrophy, hypometabolism, and clinical symptoms.
INTRODUCTION
Frontotemporal dementia (FTD) is a heterogeneous group of clinical, genetic, and pathologic disorders that include behavioral variants and languagesubtypes [1, 2]. The microtubule-associated protein tau (MAPT) gene is a pathogenic gene in FTD [3]. Given the autosomal dominant and highly penetrant inheritance pattern of MAPT mutations, asymptomatic carriers provided an opportunity to monitor disease progression and implement early interventions [4, 5]. Heterogeneity might exist in different mutation sites on MAPT genes, thus the research targeting specific and pure mutation sites is worth conducting. P301L is the most common MAPT mutation [6]. However, few studies have specifically examined the associated changes in brain function with P301L mutations. One study reported hypometabolism of anterior cingulate gyrus in the preclinical stage in 6 MAPT P301L mutation carriers from 5 families [7], and we previously found that the metabolic network was altered with the insula as a reconfigured hub in patients with MAPT P301L mutations, suggesting complex functional alterations of insula before the onset of symptoms [8].
The insula is associated with core clinical symptoms of behavior variant FTD (bvFTD) [9–11]. Neuroimaging studies of asymptomatic MAPT mutation carriers have revealed insula involvement at early stages of bvFTD [12–16]. However, the insula has a complex structure and function, with different subregions separately or jointly contributing to action, inhibition, emotion, etc. [17]. The specific functional changes in the insula in the asymptomatic stage of FTD are unknown. To well targeting the specific function of insula, we use a sub-insula parcellation atlas to divide the insula into 6 subregions for image analysis— namely, hypergranular insula (G), ventral agranular insula (vIa), dorsal agranular insula (dIa), ventral dysgranular and granular insula (vId/vIg), dorsal granular insula (dIg), and dorsal dysgranular insula (dId) [18]. Given that the anterior insula is a hub region of the salience network that plays an important role in bvFTD [19], we speculate that structure, metabolism, or metabolic connectivity is altered in anterior insula subregions including dIa and vIa in the asymptomatic stage of bvFTD, and that these changes progressively worsen in the symptomatic stage.
To test the above hypothesis, we used hybrid positron emission tomography/magnetic resonance imaging (PET/MRI) to examine MAPT P301L carriers and bvFTD patients in this study. Insula subregions are regarded as regions of interest (ROIs), a fine-grained insula Brainnetome Atlas was used to illustrate the features of gray matter (GM) volume, metabolism, and the metabolic network in preclinical and clinical stages of bvFTD.
METHODS
Subjects
Six asymptomatic MAPT P30lL mutation carriers (aMAPT+) and 12 healthy controls without MAPT mutations (aMAPT–) from a single family were enrolled in the study from September 2017 to October 2021 at the Department of Neurology of Xuanwu Hospital, China. All participants underwent a clinical interview, physical examination, neuropsychologic assessment, and 18F-fluorodeoxyglucose (FDG) PET/MRI and were followed up through annual clinical examinations at Xuanwu Hospital from 2017 to 2021. No behavioral, cognitive, or motor deficits were found, and no participant was diagnosed with any other neurodegenerativedisease.
We also recruited 30 patients with bvFTD and 30 age- and sex-matched healthy controls. All participants met the 2011 diagnostic criteria for probable bvFTD [1] and underwent a clinical interview, physical examination, neuropsychologic assessment, genetic testing, and 18F-FDG PET/MRI. Of these 30 patients with bvFTD, five carried mutations on MAPT gene including p.P301L [c.1907C>T], p.V337M [c.2014G>A], p.N296N [c.1839T>C], p.R5C [c.13C>T], and p.D54N [c.160G>A]). The matched control group did not carry any pathogenetic genes.
Protocol approval, registration, and patient consent
The study was conducted in accordance with the Declaration of Helsinki and relevant guidelines and regulations for use of human subjects in research. The clinical protocols were approved by the Ethics Committees and institutional review board of Xuanwu Hospital, Capital Medical University, China. Written, informed consent was obtained from all participants or their guardians before the start of thestudy.
PET/MRI acquisition parameters
All images were acquired on a hybrid 3.0 T time-of-flight PET/MRI scanner (Signa PET/MR, GE Healthcare, Waukesha, WI, USA). PET and MRI data were simultaneously acquired using a vendor-supplied 19-channel head and neck union coil. Three-dimensional (3D) T1-weighted sagittal images and 18F-FDG PET volumes were acquired during the same session after intravenous injection of 3.7 MBq/kg 18F-FDG, and the observation of the uptake period was 40 min for each subject.
A 3D T1-weighted fast field echo sequence (repetition time = 6.9 ms, echo time = 2.98 ms, flip angle = 12°, inversion time = 450 ms, matrix size = 256×256, field of view = 256×256 mm2, slice thickness = 1 mm, 192 sagittal slices with no gap, voxel size = 1×1×1 mm3, and acquisition time = 4 min 48 s) was used for data acquisition. Static 18F-FDG-PET data were acquired using the following scanning parameters: matrix size = 192×192, field of view = 350×350 mm2, and pixel size = 1.82×1.82×2.78 mm3, and included corrections for random coincidences, dead time, scatter, and photon attenuation.
PET/MRI image preprocessing
Structural images were preprocessed using Computational Anatomy Toolbox (CAT)12, which is based on Statistical Parametric Mapping (SPM)12 and is used in MATLAB (MathWorks, Natick, MA, USA). DICOM files were converted to nifti format. Voxel-based morphometry preprocessing was performed using the default settings of the CAT12 toolbox and the “East Asian Brains” International Consortium for Brain Mapping template. T1-weighted 3D images were segmented into GM, white matter (WM), and cerebrospinal fluid partitions. The GM and WM partitions of each subject in native space were high-dimensionally registered and normalized to standard Montreal Neurological Institute (MNI) space by diffeomorphic anatomic registration through exponentiated lie algebra normalization. The images were then smoothed using an 8-mm full-width at half-maximum Gaussiankernel.
PET images were preprocessed using SPM12. After spatial normalization of the structural MR images to standard MNI space, transformation parameters determined by T1-weighted image spatial normalization were applied to the co-registered PET images for PET spatial normalization. The images were smoothed using an 8-mm full-width at half-maximum isotropic Gaussian kernel. PET scan intensity was normalized using the whole cerebellum as a reference region to create standardized uptake value ratio (SUVR) images.
Whole-brain metabolic connectome
Sparse inverse covariance estimation (SICE) was used to construct a metabolic connectivity map. First, we segmented the whole cerebrum into 90 brain regions using the Automated Anatomical Labeling (AAL) atlas [20]. Second, we segmented the insula into 12 subregions by Brainnetome Atlas [18]. To avoid repetition, the left and right insula in the whole brain was replaced by 12 subregions of insula. Taken together, there are 12 insula subregions plus 88 other brain regions in the whole brain used for analysis, the list of the 100 nodes was in the supplementary eTable1. The 18F-FDG-PET signal was extracted from each ROI in each subject to obtain subject×ROI matrices. The SICE algorithm was then applied to the matrices to generate metabolic connectivity matrices.
Analysis at the insula subregion level
ROI analysis of PET/MRI images was performed using SPM12. Mean GM volumes and SUVR in insula subregions (bilateral G, vIa, dIa, vId/vIg, dIg, and dId) in each participant were extracted through masks (Fig. 1) from the Human Brainnetome Atlas (http://atlas.brainnetome.org) [18]. Metabolic connectivity between insular subregions (bilateral G, vIa, dIa, vId/vIg, dIg, and dId) and other nodes in the whole brain were extracted for analysis.
Fig. 1
Atlas of insula subregions (left side). ROIs were selected based on the Human Brainnetome Atlas [18], which divided the insula into 6 subregions. Different colors represent different insula subregions. Red, dorsal agranular insula (dIa); dark red, ventral agranular insula (vIa); green, dorsal dysgranular insula; yellow, ventral dysgranular and granular insula (vId/vIg); dark blue, dorsal granular insula (dIg); light blue, hypergranular insula (G).
![Atlas of insula subregions (left side). ROIs were selected based on the Human Brainnetome Atlas [18], which divided the insula into 6 subregions. Different colors represent different insula subregions. Red, dorsal agranular insula (dIa); dark red, ventral agranular insula (vIa); green, dorsal dysgranular insula; yellow, ventral dysgranular and granular insula (vId/vIg); dark blue, dorsal granular insula (dIg); light blue, hypergranular insula (G).](https://content.iospress.com:443/media/jad/2023/93-4/jad-93-4-jad221035/jad-93-jad221035-g001.jpg)
Statistical analysis
Statistical analyses were performed using SPSS v22.0 (IBM Corporation, Armonk, NY, USA). Continuous data are presented as mean±standard deviation. Dichotomous data are presented as absolute values. Continuous data were compared using the nonparametric Mann– Whitney test between asymptomatic mutation carriers and noncarriers and with the student’s t-test between bvFTD and controls. Categorical variables were analyzed with the chi-squared test or Fisher’s exact test. Pearson correlation analysis was performed to evaluate the relationship between GM volume, metabolism, and neuropsychologic scales. p-value <0.05 indicated statistical significance.
Table 1
Demographic characteristics and neuropsychologic scores of the participants
| aMAPT+ | aMAPT– | p | bvFTD | Controls | p | |
| (n = 6) | (n = 12) | (n = 30) | (n = 30) | |||
| Age at PET/MRI, y | 49.00±3.90 | 42.25±9.21 | 0.11 | 59.80±8.09 | 56.57±9.64 | 0.17 |
| Sex (M/F) | 3/3 | 7/5 | 0.99 | 16/14 | 14/16 | 0.61 |
| Years of education, years | 8.67±0.52 | 10.55±3.80 | 0.25 | 10.73±4.76 | 11.11±3.37 | 0.74 |
| Estimated years from symptom onset | 8.33±1.88 | |||||
| Cognitive status | ||||||
| MMSE | 28.67±0.82 | 28.36±2.06 | 0.74 | 16.04±7.19 | 28.59±2.13 | <0.0001 |
| MoCA | 26.50±1.23 | 26.18±3.06 | 0.81 | 9.65±6.44 | 25.90±3.49 | <0.0001 |
| FTD-CDR sum of box | 0±0 | 0±0 | – | 10.5±4.71 | 0±0 | <0.0001 |
| Linguistics | ||||||
| BNT | 25.00±1.00 | 24.90±2.08 | 0.92 | 11.27±6.52 | 24.81±3.94 | <0.0001 |
| Behavioral features | ||||||
| NPI Patient | 2.40±5.37 | 1.82±5.08 | 0.84 | 25.45±20.22 | 0.88±3.42 | <0.0001 |
| FBI | 3.67±8.50 | 1.36±3.04 | 0.42 | 27.05±13.24 | 1.83±4.02 | <0.0001 |
All values in the table except the p-values are expressed as mean±standard deviation (SD). BNT, Boston Naming Test; bvFTD, behavior variant frontotemporal dementia; F, female; FBI, Frontal Behavior Inventory; FTD-CDR, Frontotemporal Lobar Degeneration Clinical Dementia Rating Scale; MAPT, microtubule-associated protein tau; M, male; MMSE, Mini-Mental State Examination; MoCA, Montreal Cognitive Assessment; NPI, Neuropsychiatric Inventory; PET/MRI, positron emission computed tomography/magnetic resonance imaging.
To compare network connectivity between groups, we assessed the statistical significance of differences with nonparametric permutation tests with 5000 permutations, corrected for age, sex, and years of education. p values were calculated as the fraction of the difference in distribution values that exceeded the difference value between groups. We performed multiple corrections using a false discovery rate (FDR) to analyze local metabolic connectivity changes, the threshold was set at FDR p<0.05.
RESULTS
Demographic characteristics of the study population
Demographic characteristics, cognitive status, and linguistic and behavioral features of asymptomatic MAPT P301L carriers (aMAPT+), asymptomatic MAPT noncarriers (aMAPT–), bvFTD patients, and controls are shown in Table 1. The demographic data of MAPT carriers and noncarriers have been previously reported [8]. There were no significant differences in age and sex between aMAPT+ and aMAPT– groups or between bvFTD and control groups. The estimated mean (standard deviation) years from symptom onset was 8.33 (1.88) in the aMAPT+ group (range: 4–13 years). There were no significant differences in Mini-Mental State Examination, Montreal Cognitive Assessment, Frontotemporal Lobar Degeneration Clinical Dementia Rating Scale, Neuropsychiatric Inventory, and Frontal Behavior Inventory (FBI) scores between aMAPT+ and aMAPT– subjects whereas all neuropsychologic scale scores of the bvFTD group differed relative to those of controls.
Asymptomatic stage in MAPT P301L mutation carriers
Atrophy and hypometabolism of insula subregions
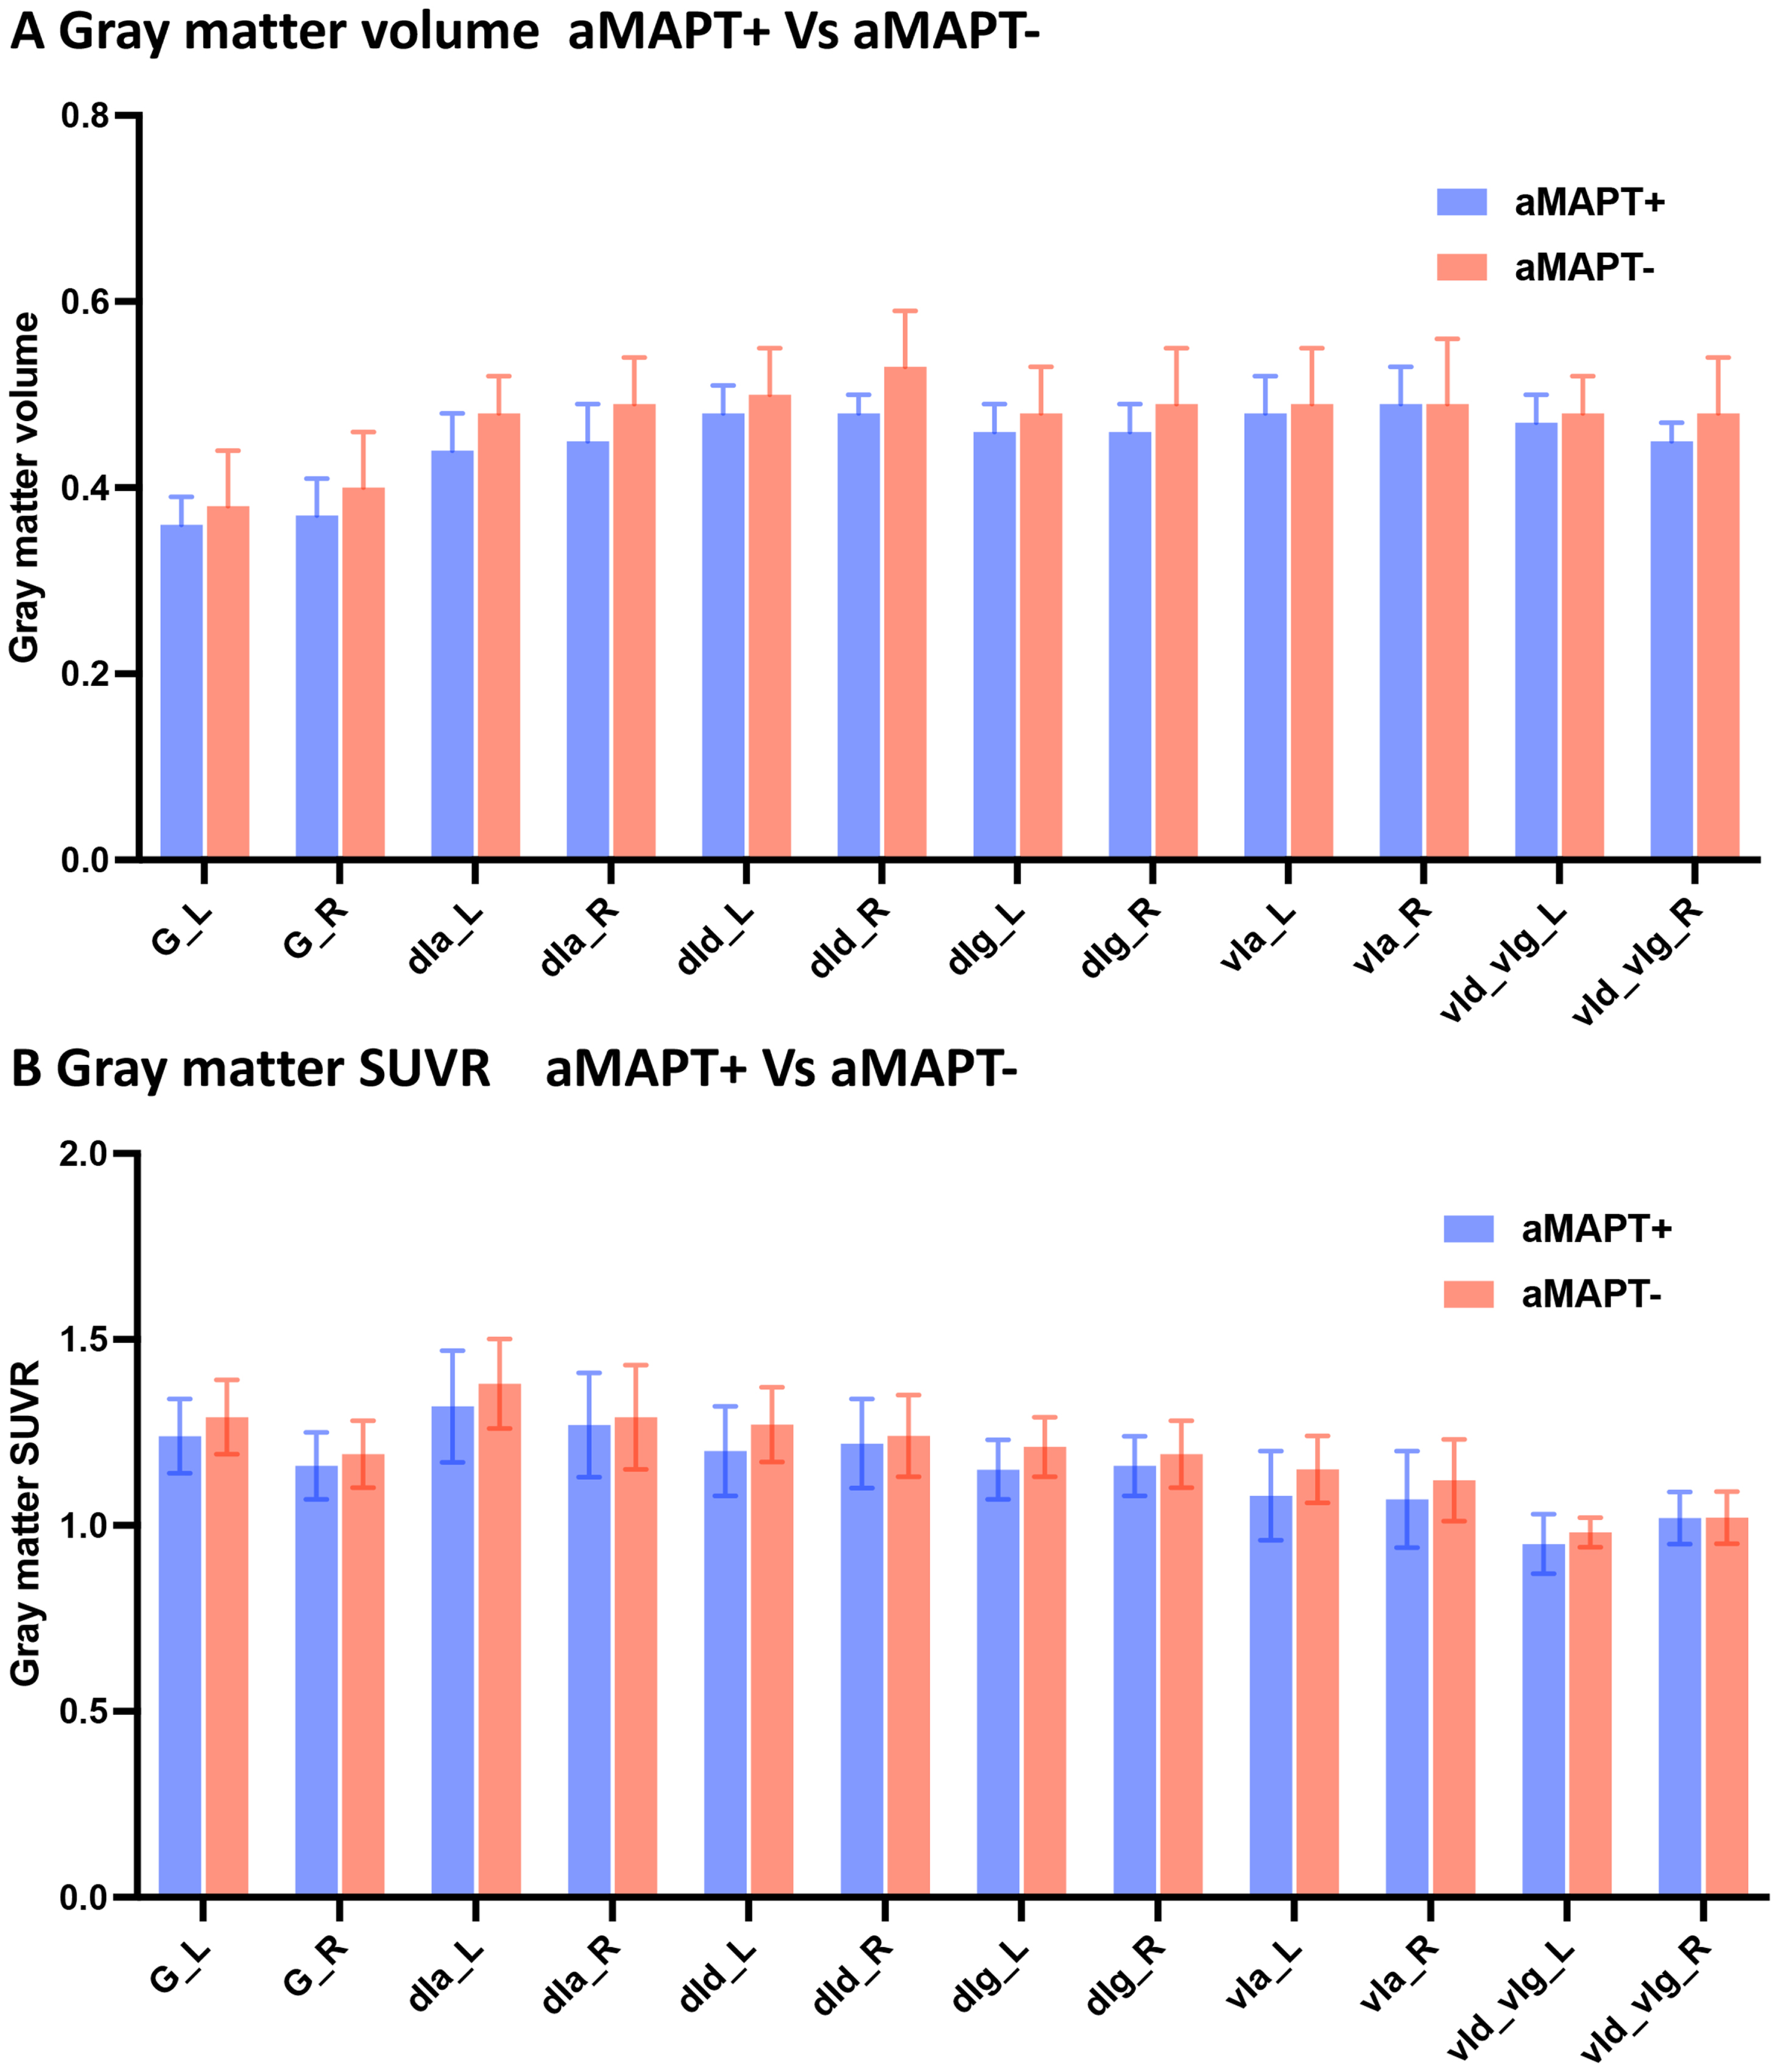
No significant differences in GM atrophy (Fig. 2A) and hypometabolism (Fig. 2B) were observed in subregions of the insula in asymptomatic MAPT subjects compared with controls.
Fig. 2
SUVR of insula subregions in aMAPT+ and aMAPT– groups. There were no significant differences in GM volume (A) and metabolism (B) in subregions of the insula between aMAPT+ and aMAPT– subjects.
Metabolic network of insula subregions
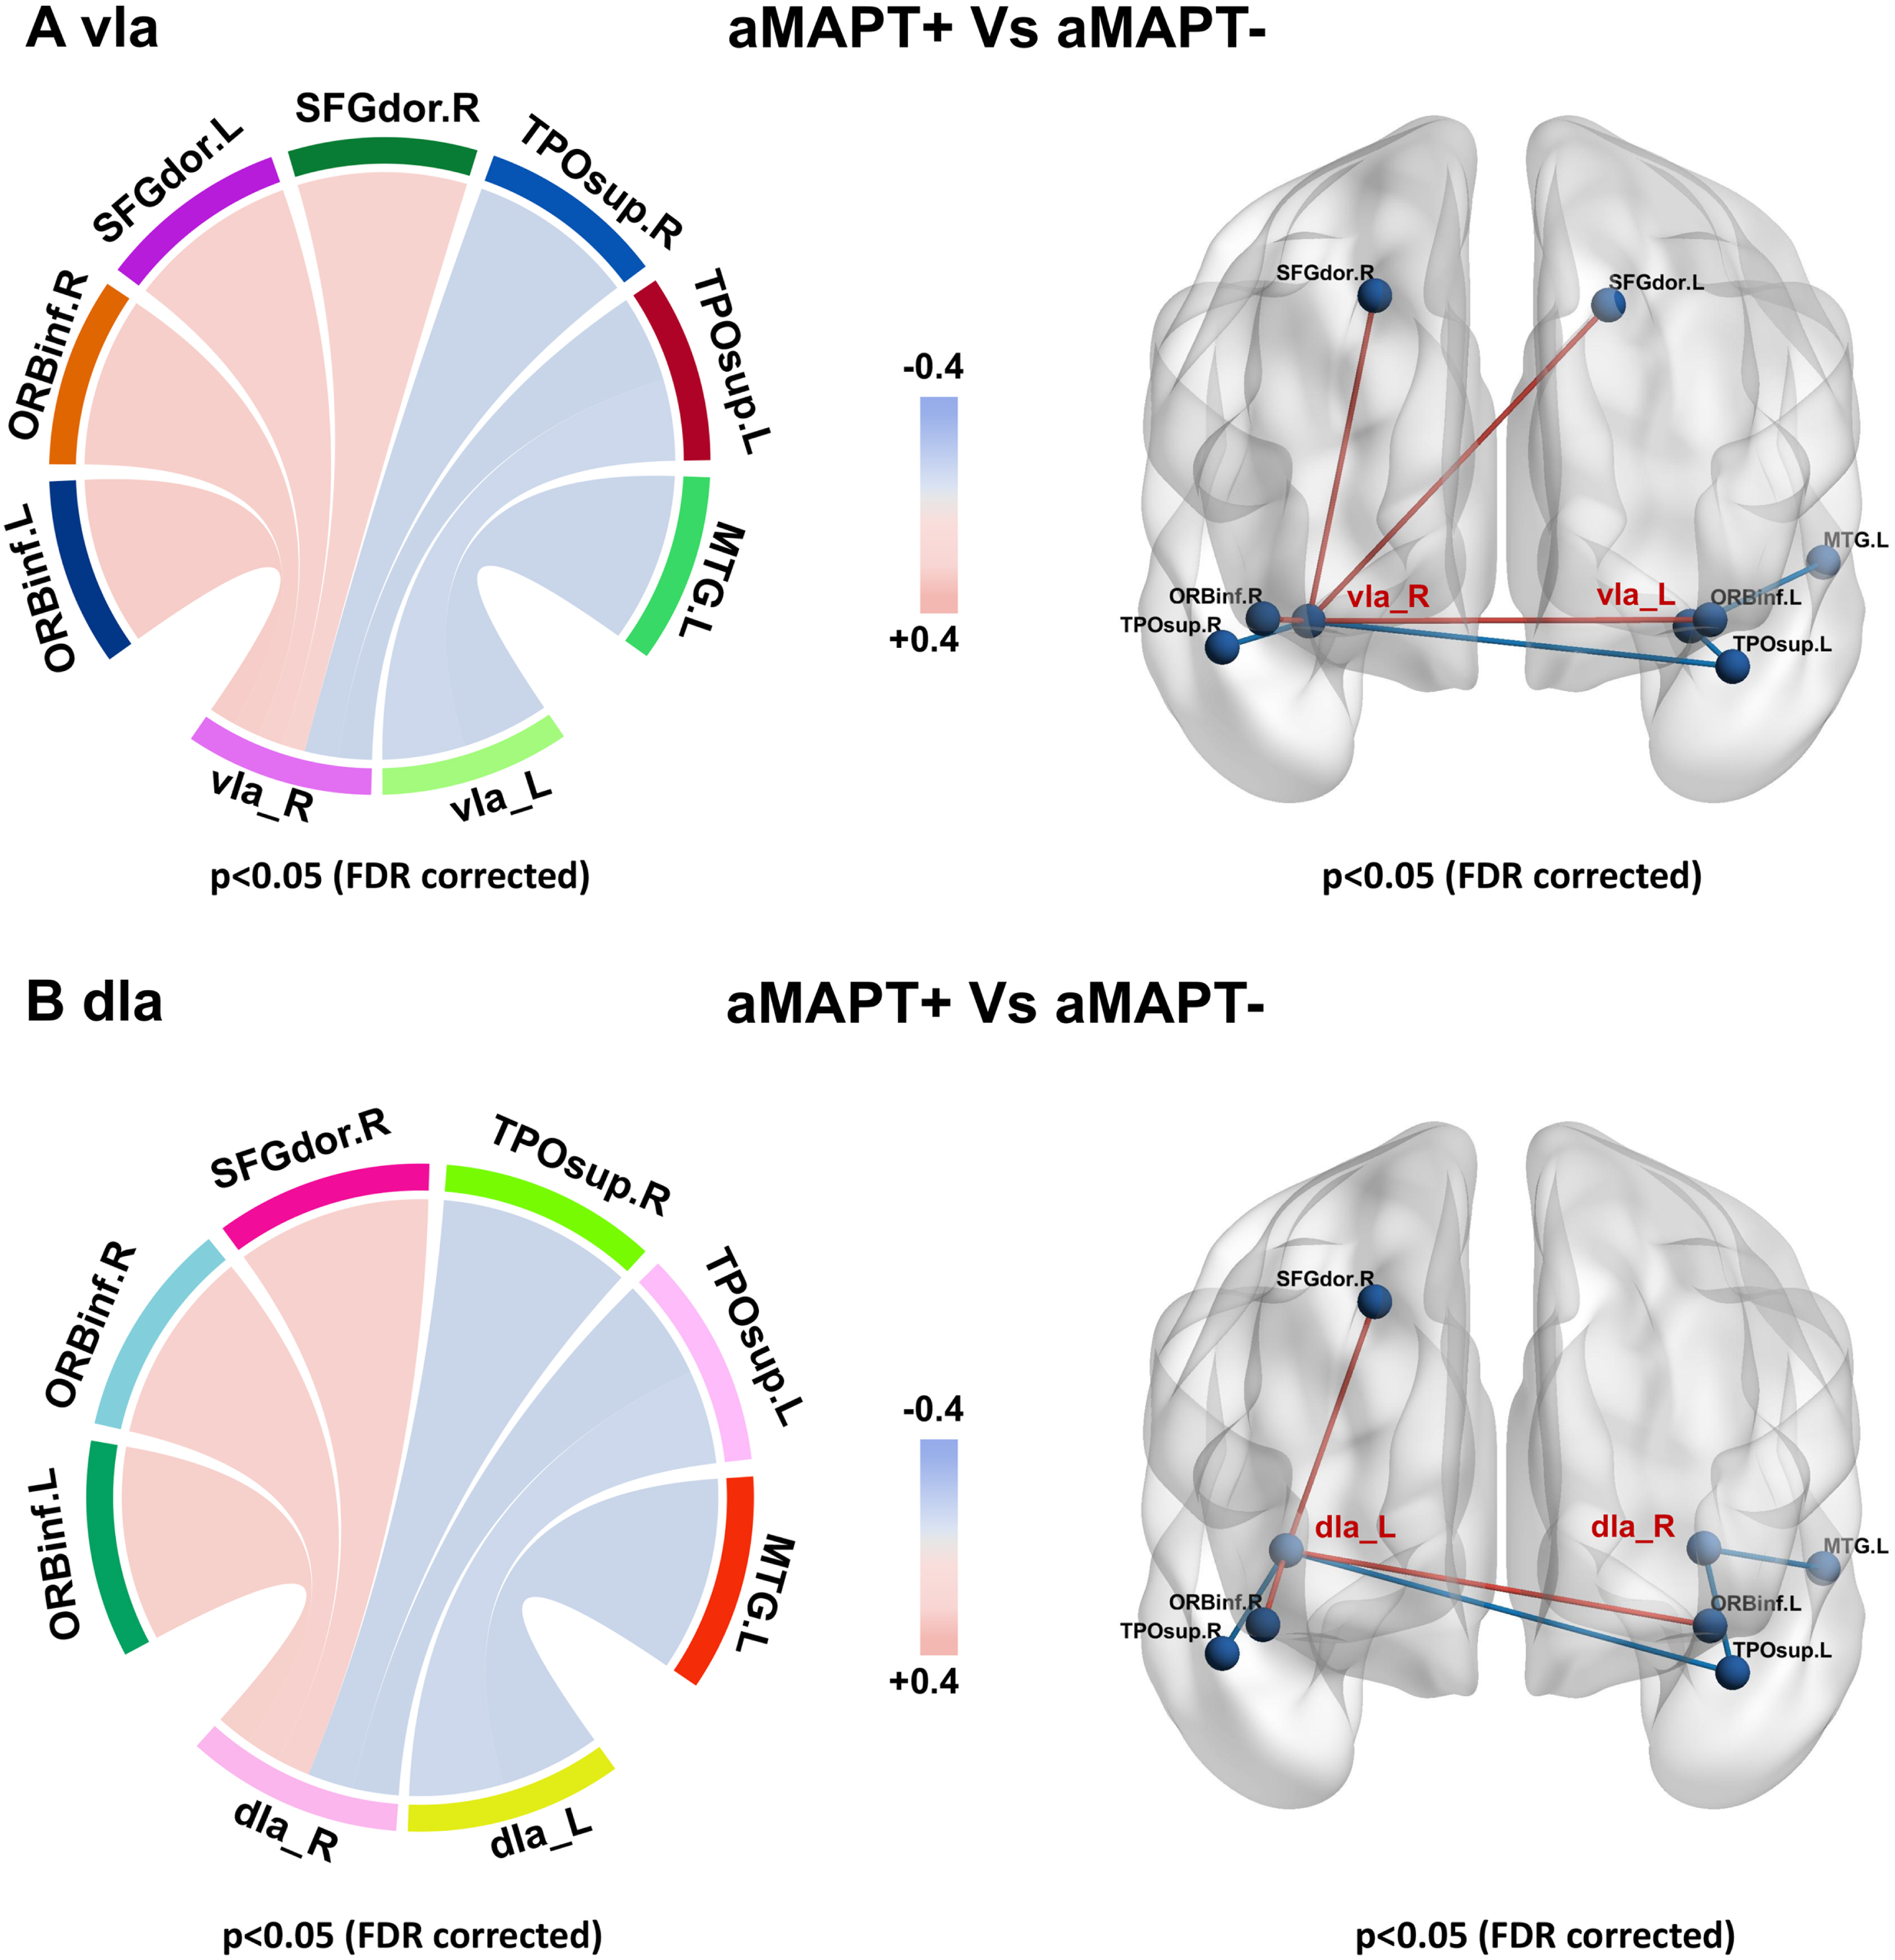
In subregions of the insula, only the vIa and dIa showed metabolic network changes in the aMAPT+ group compared with the aMAPT– group: the left vIa showed weakened connections with the left medial temporal gyrus and left superior temporal pole, whereas the right vIa showed weakened connections with bilateral superior temporal pole and enhanced connectivity with bilateral dorsolateral superior frontal gyrus and bilateral inferior orbital frontal gyrus (Fig. 3A). Additionally, the left dIa showed weakened connections with the left middle temporal gyrus and left superior temporal pole, and the right dIa showed weakened connections with bilateral superior temporal pole and enhanced connectivity with the right dorsolateral superior frontal gyrus and bilateral inferior orbital frontal gyrus in the aMAPT+ group compared with aMAPT– subjects (Fig. 3B).
Fig. 3
Sub-insula metabolic network in aMAPT+ and aMAPT– groups. In the comparison of the sub-insula metabolic network between aMAPT+ and aMAPT– subjects, the left vIa showed weakened connections with left medial temporal gyrus and left superior temporal pole, whereas the right vIa showed weakened connections with bilateral superior temporal pole and enhanced connectivity with bilateral dorsolateral superior frontal gyrus and bilateral inferior orbital frontal gyrus (A). Additionally, the left dIa showed weakened connections with the left middle temporal gyrus and left superior temporal pole, whereas the right dIa showed weaken connections with bilateral superior temporal pole and enhanced connectivity with the right dorsolateral superior frontal gyrus and bilateral inferior orbital frontal gyrus (B).
Symptomatic stage in bvFTD patients
Atrophy and hypometabolism of insula subregions
GM atrophy (Fig. 4A) and hypometabolism (Fig. 4B) were observed in all bilateral sub-insula regions in patients with bvFTD compared with controls.
Fig. 4
SUVR of insula subregions in bvFTD and control groups. Atrophy (A) and hypometabolism (B) were observed in all subregions of the insula in bvFTD patients compared with controls.
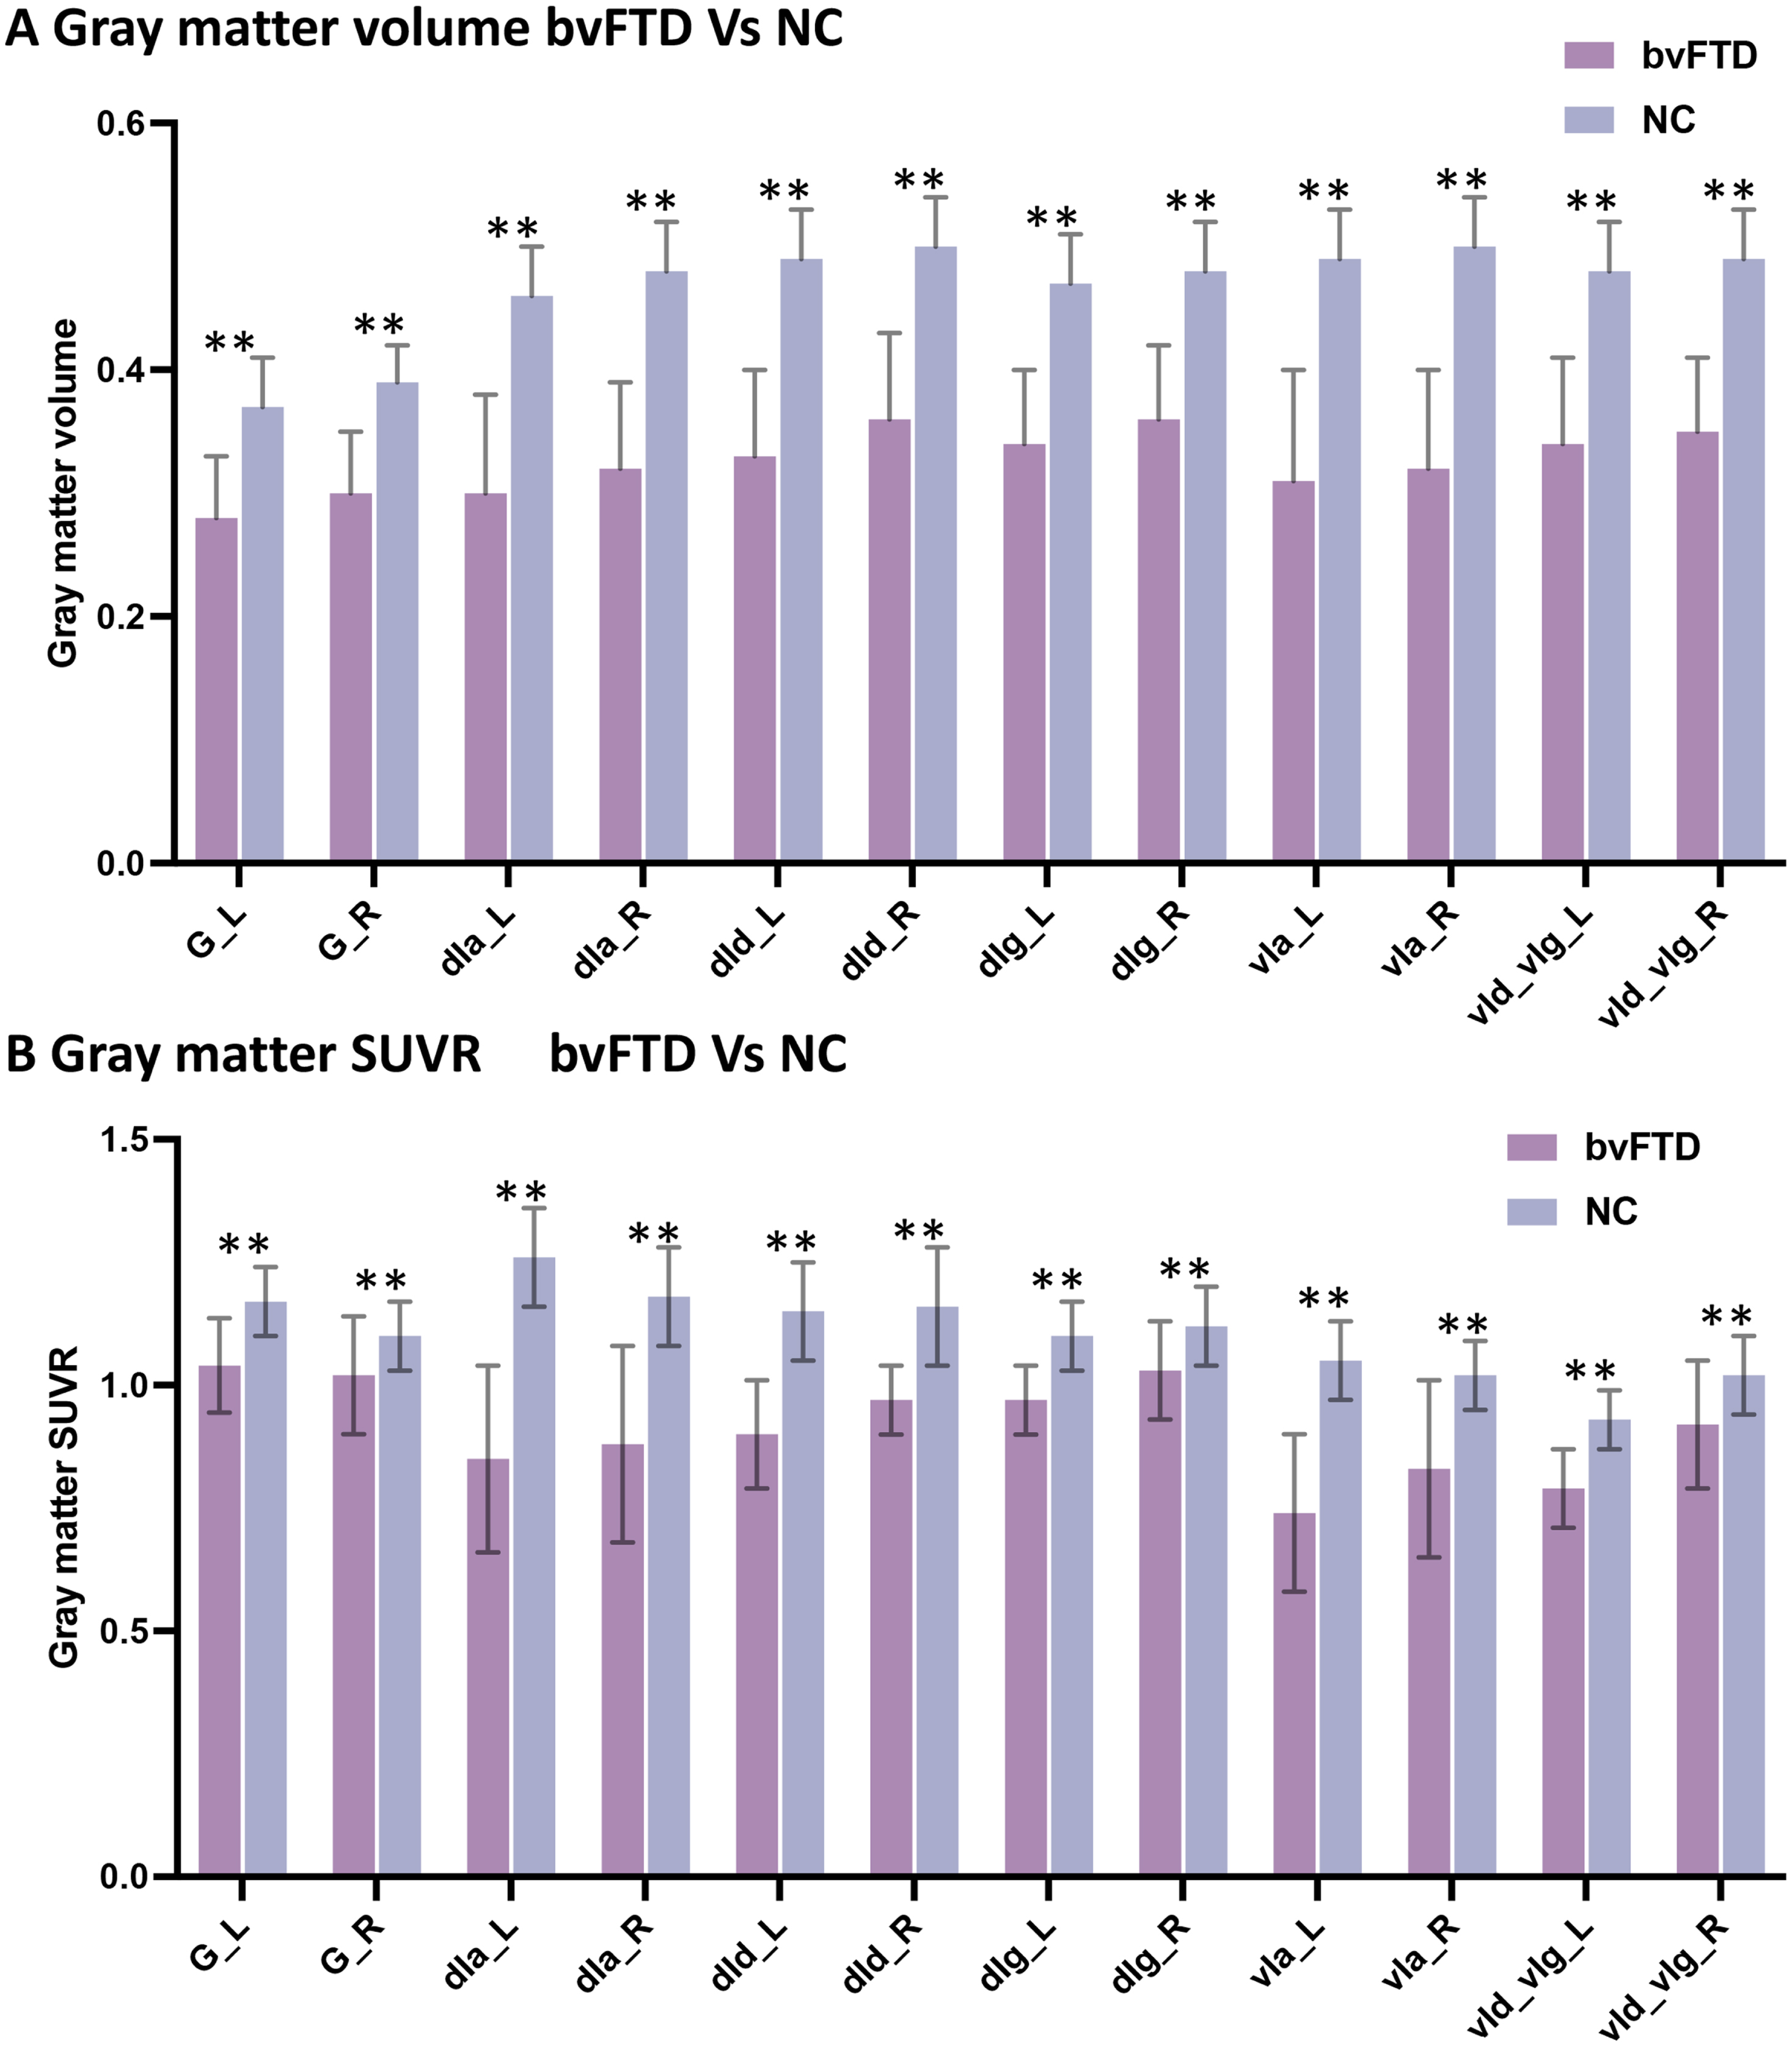
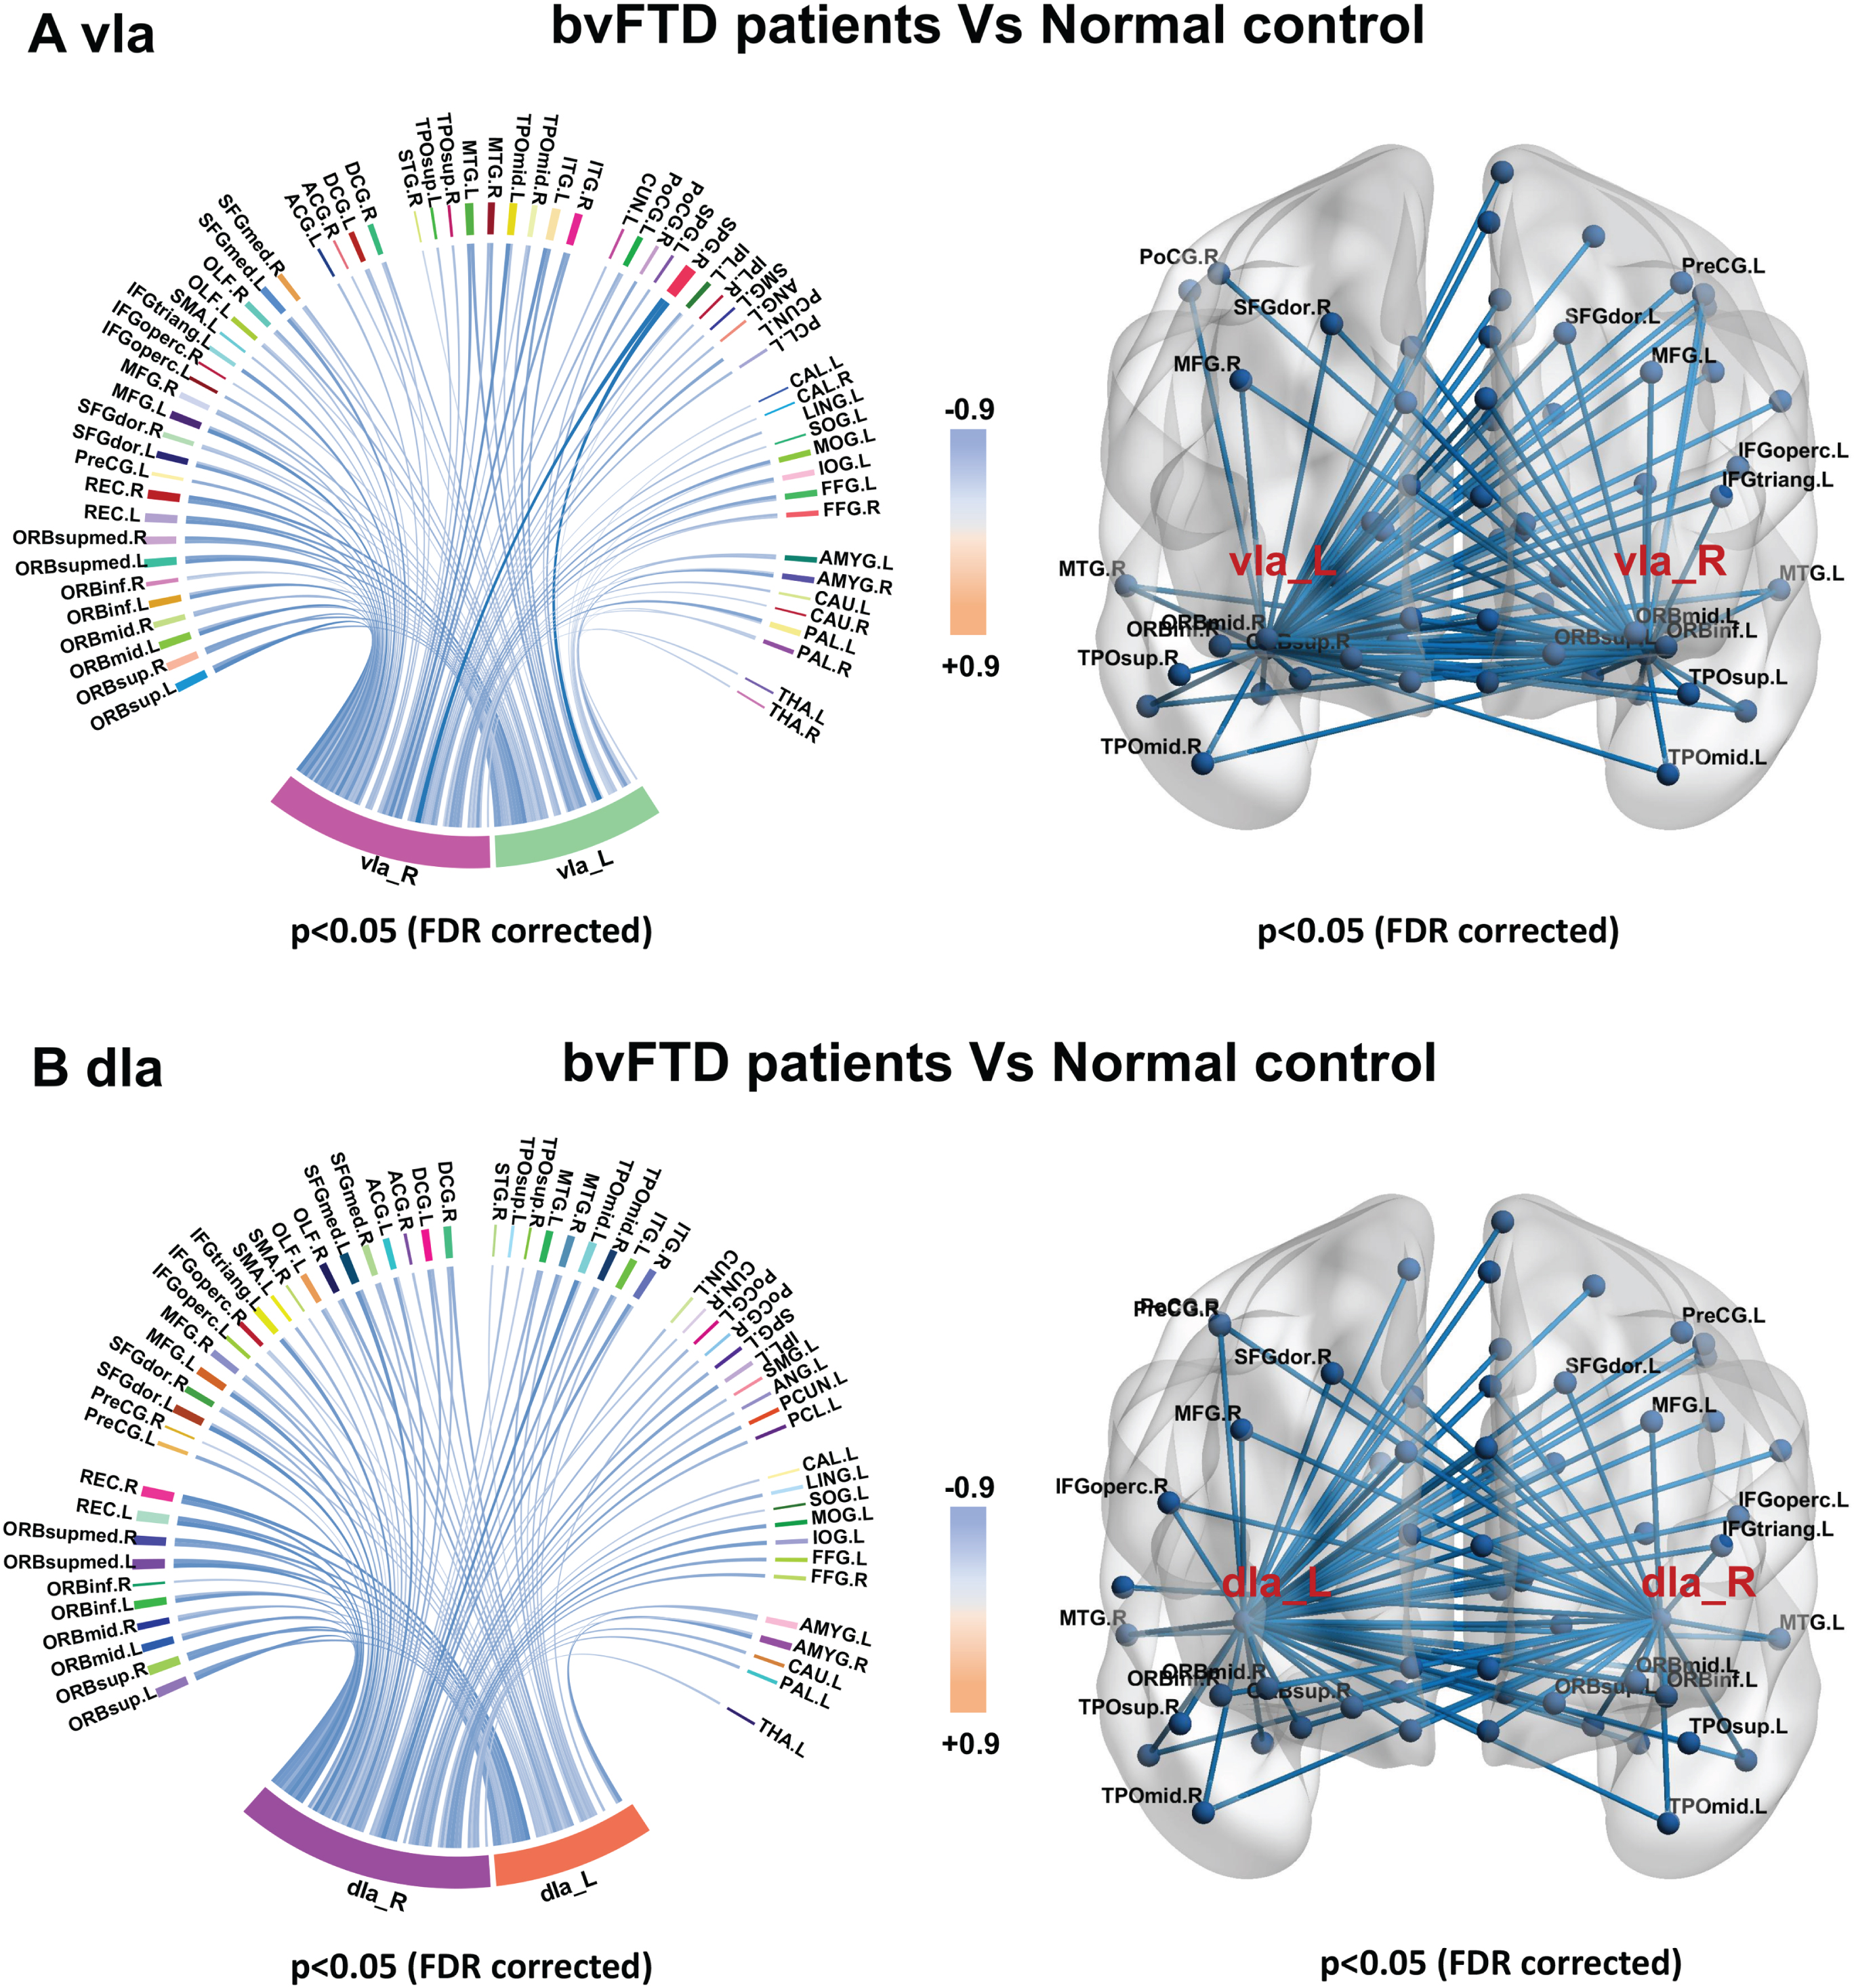
Fig. 5
Sub-insula metabolic network in bvFTD and control groups. Compared with controls, bvFTD patients showed decreased metabolic connectivity between bilateral vIa (A) and dIa subregions (B) and frontal, temporal, parietal, and occipital poles; basal ganglia; and thalamus.
Metabolic connectivity of insula subregions
Metabolic connectivity was decreased in all insula subregions in patients with bvFTD compared with control subjects (Supplementary Table 1). As anterior insula including vIa and dIa metabolic connectivity is known to be altered in the preclinical stage of our MAPT P301L mutation carriers, we specifically evaluated changes in metabolic connectivity in the vIa (Fig. 4A) and dIa (Fig. 4B) regions in bvFTD patients to determine the disease status of the anterior insula network. Patients with bvFTD showed decreased metabolic connectivity between bilateral vIa and dIa subregions as ROIs and the frontal, temporal, parietal, and occipital poles; basal ganglia; and thalamus.
Correlation analysis
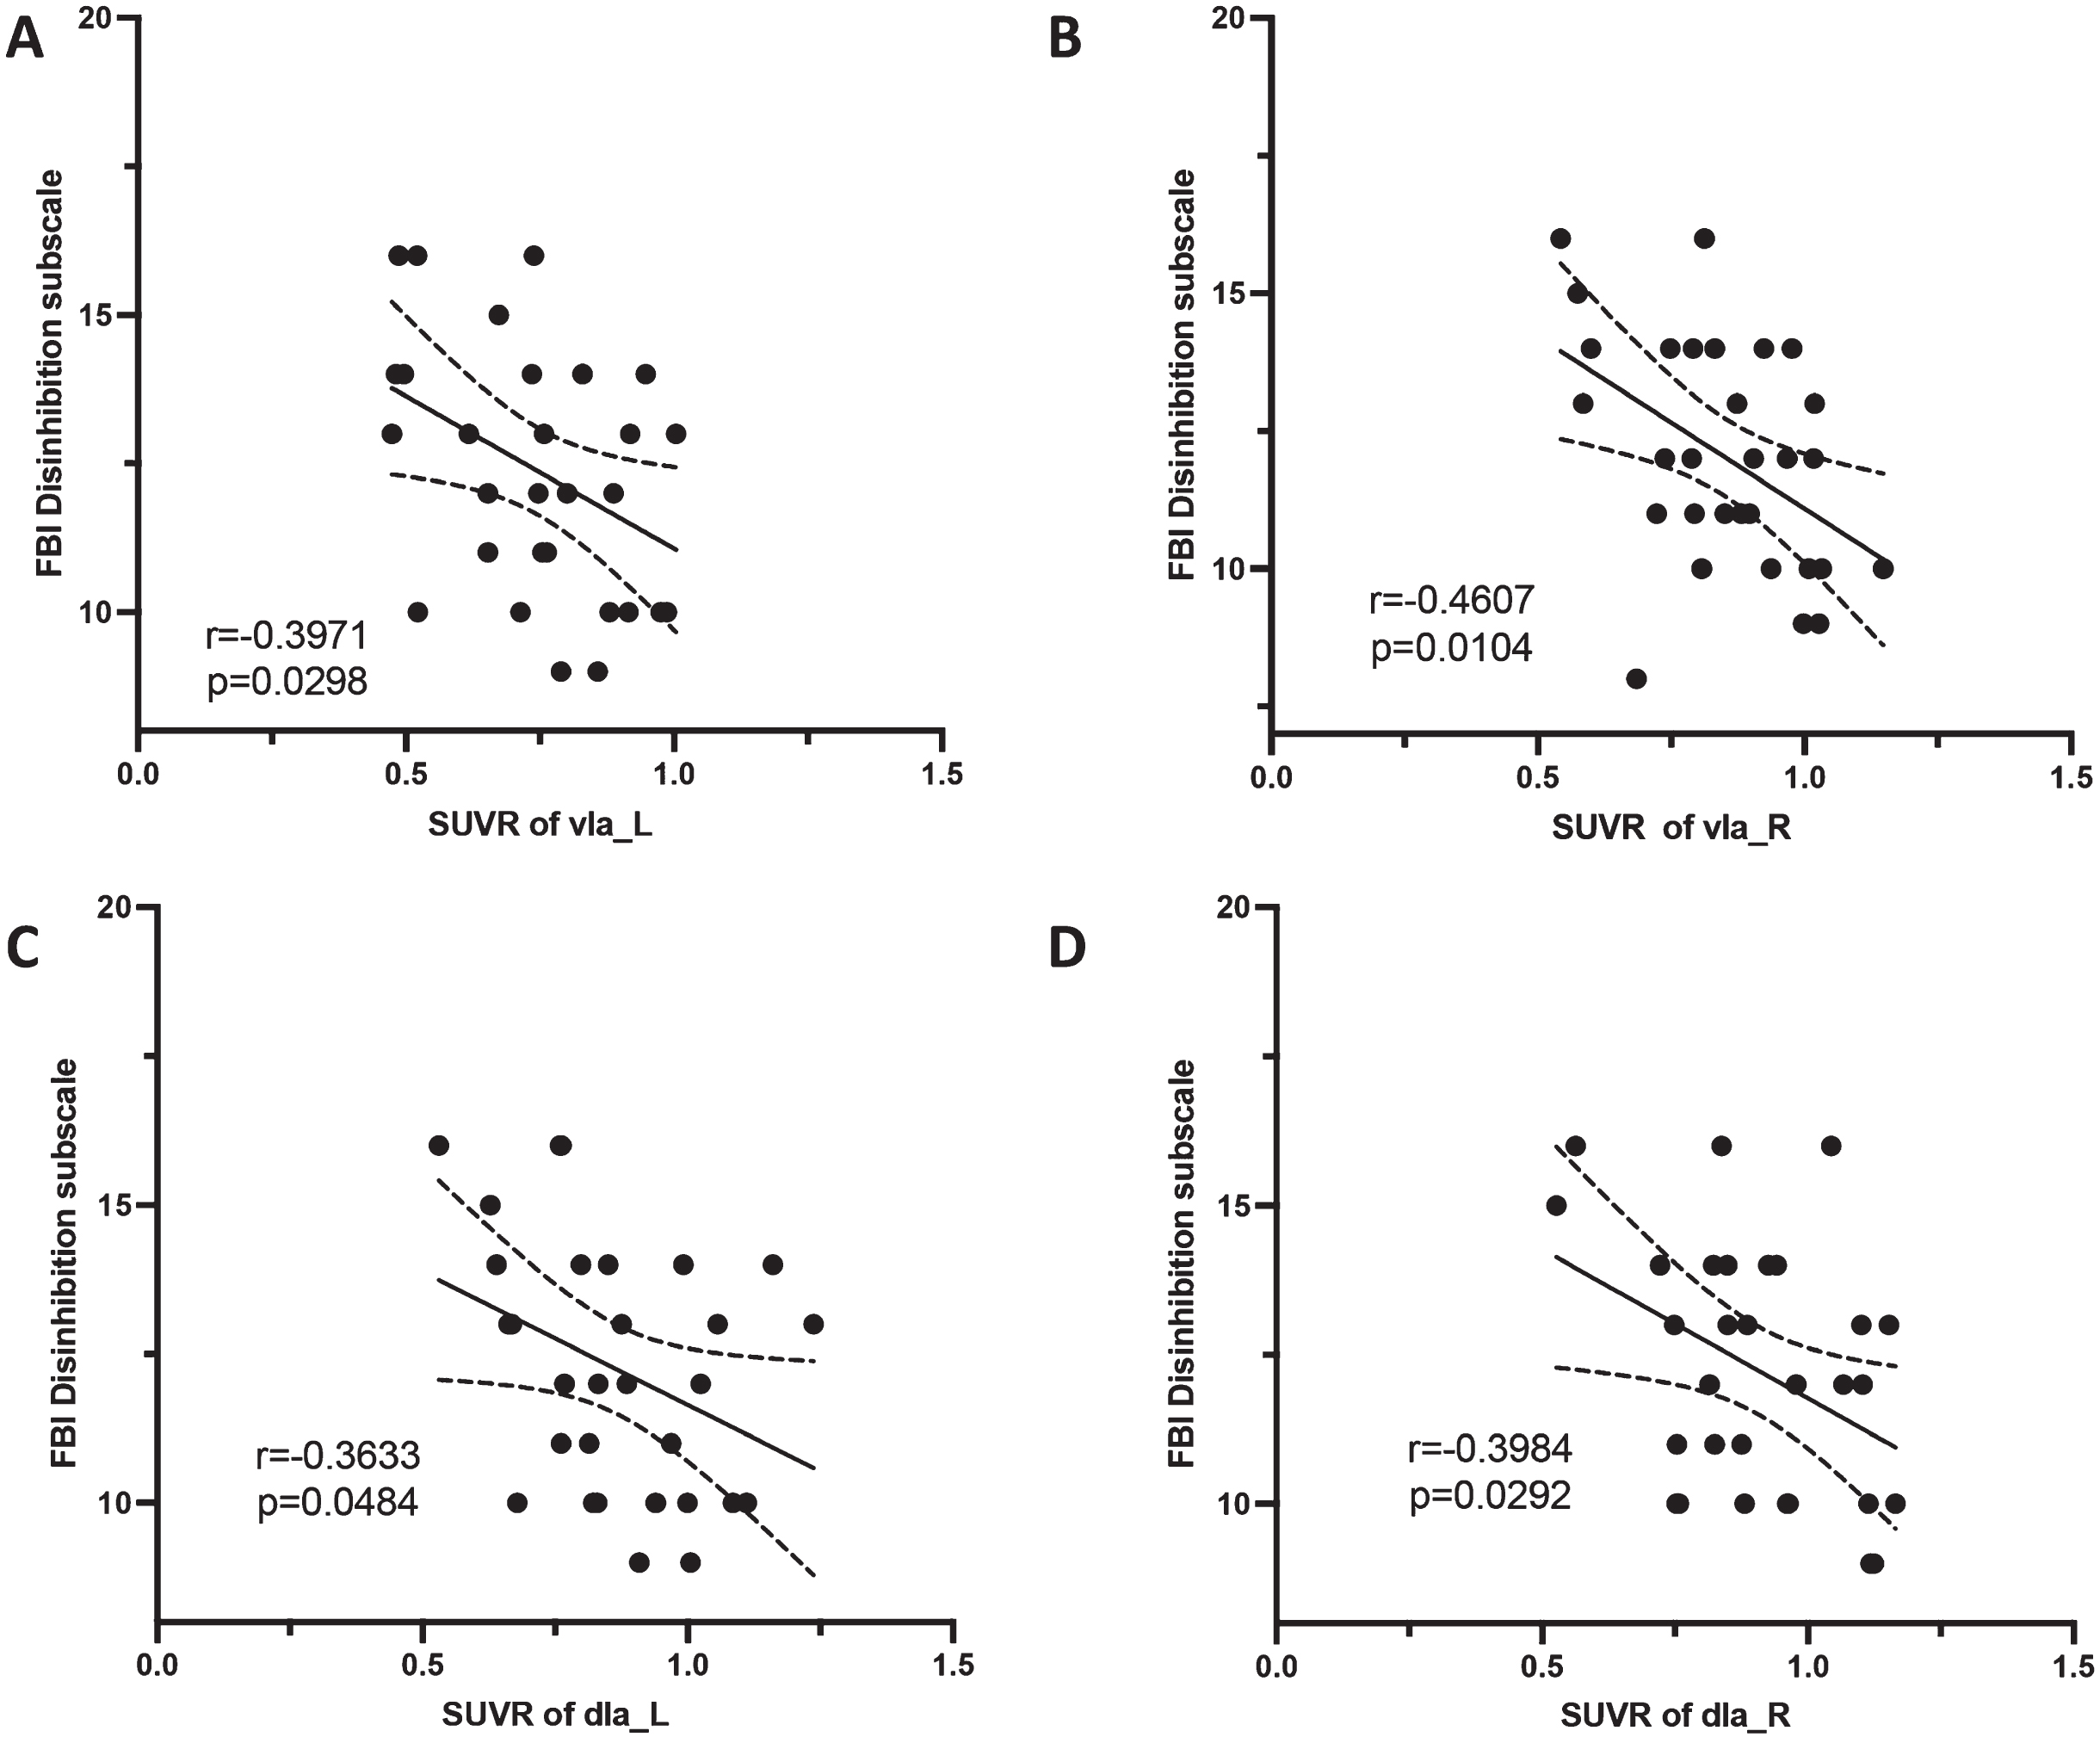
The SUVRs of left vIa (r = –0.3971, p = 0.0298), right vIa (r = –0.4607, p = 0.0104), left dIa (r = –0.3633, p = 0.0484), and right dIa (r = –0.3984, p = 0.0292) were negatively correlated with FBI disinhibition scores in bvFTD patients (Fig. 6). No other significant association was found. The detailed r and p values are shown in the supplementary Tables 2–5.
Fig. 6
Correlation between insula subregions and neuropsychiatric scale scores. In the bvFTD group, the SUVRs of bilateral vIa and dIa were negatively correlated with FBI disinhibition scores.
DISCUSSION
This study aimed to show metabolic connectivity changes in anterior insula subregions in MAPT P301L mutation carriers in the asymptomatic stage of bvFTD. Considering insula subregions as ROIs, connectivity was increased in orbitofrontal and dorsal lateral superior frontal gyrus and decreased in the middle temporal and temporal poles, suggesting that impairment and compensation exist simultaneously to maintain a normal clinical status. Our findings also provide evidence for early changes in brain function preceding symptom onset in bvFTD.
The functions of insula subregions were reported in previous studies: 1) G: perception, somesthesis, and pain; 2) dIa: perception, somesthesis, and pain; action and inhibition; 3) vId/vIg: perception, somesthesis, and pain; olfaction; emotion and disgust, fear; 4) dIg: perception, somesthesis, and pain; emotion and disgust; interoception and sexuality; 5) dId: perception, somesthesis, and pain; perception and gustation; 6) vIa: perception and gustation; action and inhibition [17, 18, 21]. The anterior insula was the key region of the salient network which was vulnerable in FTD [19]. In our study, subregions of vIa and dIa constitute the anterior insula. It was known that the vIa and dIa regions were associated with functions of action and inhibition [17, 18, 21]. Behavior disinhibition was a characteristic manifestation of bvFTD, presented as socially inappropriate behavior, loss of manners, and impulsive, rash, or careless actions [1], which was corresponding with impairment of the function in the subregions of vIa and dIa. In addition, we did a further correlation analysis and identified the dysfunction of vIa and dIa was associated with the FBI disinhibition score.
The decreased metabolic connectivity in the vIa and dIa subregions of MAPT mutation carriers were within the impairment range of in our FTD patients, indicating that our results in preclinical stage were reliable. Some studies of MAPT mutation carriers have also reported atrophy [13, 15, 22, 23] or tau deposition [24] in the insula in the asymptomatic stage as well as impairment of frontotemporal WM tracts connecting the insula and temporal pole (e.g., uncinate fasciculus) [22, 23, 25, 26]. These structural changes provided supporting evidence for the alterations in the insula metabolic network observed in our study. Compensatory enhancement of connectivity was found in the sub-insula and prefrontal pole. The prefrontal brain area— especially the orbital frontal gyrus— was shown to be associated with inhibition of impulsive behaviors, which may arise from the limbic connectome including the insula [27]. The enhanced connectivity might inhibit some behavioral impulses in MAPT P301L mutation carriers, who thus maintain asymptomatic status with normal behavior and cognitive function. We speculate there is a time point that metabolic connectivity changes from positive to negative when the brain with a severe structural and functional impairment that led to the loss of compensation procession exceeds compensation. This issue can be confirmed in the further longitudinal follow-up study.
The manifestation of bvFTD is a continuum from pathologic changes to symptom onset. Asymptomatic MAPT P301L mutation carriers allow monitoring of structural and functional changes in the brain at the preclinical stage. Atrophy and hypometabolism of insula subregions and impaired metabolic connectivity between insula subregions and frontal, temporal, parietal, occipital, and subcortical structures were observed in patients with bvFTD. However, at the preclinical stage, there was no obvious loss of GM volume or hypometabolism in sub-insula regions; only metabolic connectivity changes in the dIa and vIa were observed in the asymptomatic stage. These findings suggest that metabolic connectivity measures are more sensitive than traditional GM volume and metabolism when all image data are acquired simultaneously. The internal mechanism of this phenomenon might be because of the sensitivity difference between divergent analysis methods. Graph theory analysis represents the topological organization of a large-scale brain network and can reflect the integral interactions between brain regions. Evidence is accumulating that graph theory network analysis might provide a more sensitive measure to detect the functional changes of the brain than those that only analyze atrophy or hypometabolism properties of separate brain regions alone [28].
Strength and limitations
This study had the following strengths. First, we used hybrid PET/MRI, which allowed us to acquire structural and functional data simultaneously and provided greater precision for the co-registration step, allowing direct comparison between different modalities. Second, we used a sub-insula connectome atlas to divide the insula into 6 anatomical subregions with specific functions to better link structural, metabolic, and metabolic connectivity alterations to specific function of the insula. Lastly, we enrolled asymptomatic MAPT P301L mutation carriers and MAPT mutation-negative family members from a single pedigree to minimize the influence of interfamilial heterogeneity.
Our study also had some limitations. First, the sample size was relatively small because of the rarity of asymptomatic MAPT mutation carriers. Second, the study had a cross-sectional design, and the findings require confirmation in longitudinal studies and postmortem examinations. Third, FTD patients with MAPT P301L from the same pedigree have passed away and no FDG-PET imaging data are available, so a direct comparison cannot be conducted. In the FTD group, only one patient was a MAPT P301L carrier, the sample size was too small, and the statistical power was weak to perform a comparative analysis between groups. Thus, we cannot conclude the direct difference between asymptomatic and symptomatic MAPT P301L carriers. Fourth, as the age difference between aMAPT+, aMAPT–, and bvFTD patients was large, we matched an independent control group to bvFTD patients to delineate disease status, which precluded a direct comparison between the three groups. Last, due to the small sample size, it is temporarily impossible to calculate in subgroups according to the ‘expected years from symptom onset’ to reduce the effect of discrepancy of the estimated years from disease onset, so our results in preclinical stages of MAPT P301L carriers are only exploratory and need to be interpreted with caution.
Conclusions
The results of this study demonstrate that vIa and dIa metabolic connectivity is altered in MAPT P301L mutation carriers before the onset of bvFTD symptoms. Metabolic connectivity is a potential biomarker in asymptomatic individuals that can be used to monitor disease progression, although longitudinal imaging studies in a larger group of subjects are needed to confirm this possibility.
FUNDING
This work was supported by grants from the National Natural Science Foundation of China [no.81971011].
CONFLICT OF INTEREST
Liyong Wu is an Editorial Board Member of this journal but was not involved in the peer-review process nor had access to any information regarding its peer- review.
DATA AVAILABILITY
The datasets used and analyzed during the current study are available from the corresponding author upon reasonable request. The data are not publicly available due to privacy or ethical restrictions.
ACKNOWLEDGMENTS
The authors are grateful to all subjects for their participation in the study.
SUPPLEMENTARY MATERIAL
[1] The supplementary material is available in the electronic version of this article: https://dx.doi.org/10.3233/JAD-221035.
REFERENCES
[1] | Rascovsky K , Hodges J , Knopman D , Mendez M , Kramer J , Neuhaus J , van Swieten J , Seelaar H , Dopper E , Onyike C , Hillis A , Josephs K , Boeve B , Kertesz A , Seeley W , Rankin K , Johnson J , Gorno-Tempini M , Rosen H , Prioleau-Latham C , Lee A , Kipps C , Lillo P , Piguet O , Rohrer J , Rossor M , Warren J , Fox N , Galasko D , Salmon D , Black S , Mesulam M , Weintraub S , Dickerson B , Diehl-Schmid J , Pasquier F , Deramecourt V , Lebert F , Pijnenburg Y , Chow T , Manes F , Grafman J , Cappa S , Freedman M , Grossman M , Miller B ((2011) ) Sensitivity of revised diagnostic criteria for the behavioural variant of frontotemporal dementia. Brain 134: , 2456–2477. |
[2] | Gorno-Tempini ML , Hillis AE , Weintraub S , Kertesz A , Mendez M , Cappa SF , Ogar JM , Rohrer JD , Black S , Boeve BF , Manes F , Dronkers NF , Vandenberghe R , Rascovsky K , Patterson K , Miller BL , Knopman DS , Hodges JR , Mesulam MM , Grossman M ((2011) ) Classification of primary progressive aphasia and its variants. Neurology 76: , 1006–1014. |
[3] | Poorkaj P , Bird TD , Wijsman E , Nemens E , Garruto RM , Anderson L , Andreadis A , Wiederholt WC , Raskind M , Schellenberg GD ((1998) ) Tau is a candidate gene for chromosome 17 frontotemporal dementia. Ann Neurol 43: , 815–825. |
[4] | Ingram EM , Spillantini MG ((2002) ) Tau gene mutations: Dissecting the pathogenesis of FTDP-17. Trends Mol Med 8: , 555–562. |
[5] | Mohandas E , Rajmohan V ((2009) ) Frontotemporal dementia: An updated overview. Indian J Psychiatry 51: (Suppl 1), S65–S69. |
[6] | Moore KM , Nicholas J , Grossman M , McMillan CT , Irwin DJ , Massimo L , Van Deerlin VM , Warren JD , Fox NC , Rossor MN , Mead S , Bocchetta M , Boeve BF , Knopman DS , Graff-Radford NR , Forsberg LK , Rademakers R , Wszolek ZK , van Swieten JC , Jiskoot LC , Meeter LH , Dopper EG , Papma JM , Snowden JS , Saxon J , Jones M , Pickering-Brown S , Le Ber I , Camuzat A , Brice A , Caroppo P , Ghidoni R , Pievani M , Benussi L , Binetti G , Dickerson BC , Lucente D , Krivensky S , Graff C , Öijerstedt L , Fallström M , Thonberg H , Ghoshal N , Morris JC , Borroni B , Benussi A , Padovani A , Galimberti D , Scarpini E , Fumagalli GG , Mackenzie IR , Hsiung GR , Sengdy P , Boxer AL , Rosen H , Taylor JB , Synofzik M , Wilke C , Sulzer P , Hodges JR , Halliday G , Kwok J , Sanchez-Valle R , Lladó A , Borrego-Ecija S , Santana I , Almeida MR , Tábuas-Pereira M , Moreno F , Barandiaran M , Indakoetxea B , Levin J , Danek A , Rowe JB , Cope TE , Otto M , Anderl-Straub S , de Mendonça A , Maruta C , Masellis M , Black SE , Couratier P , Lautrette G , Huey ED , Sorbi S , Nacmias B , Laforce R Jr. , Tremblay ML , Vandenberghe R , Damme PV , Rogalski EJ , Weintraub S , Gerhard A , Onyike CU , Ducharme S , Papageorgiou SG , Ng ASL , Brodtmann A , Finger E , Guerreiro R , Bras J , Rohrer JD ((2020) ) Ageat symptom onset and death and disease duration in genetic frontotemporal dementia: An internationalretrospective cohort study. Lancet Neurol 19: , 145–156. |
[7] | Clarke MTM , St-Onge F , Beauregard JM , Bocchetta M , Todd E , Cash DM , Rohrer JD , Laforce R Jr ((2021) ) Early anterior cingulate involvement is seen in presymptomatic MAPT P301L mutation carriers. Alzheimers Res Ther 13: , 42. |
[8] | Liu L , Chu M , Nie B , Liu L , Xie K , Cui Y , Kong Y , Chen Z , Nan H , Chen K , Rosa-Neto P , Wu L ((2022) ) Reconfigured metabolism brain network in asymptomatic microtubule-associated protein tau mutation carriers: A graph theoretical analysis. Alzheimers Res Ther 14: , 52. |
[9] | Shafiei G , Bazinet V , Dadar M , Manera A , Collins D , Dagher A , Borroni B , Sanchez-Valle R , Moreno F , Laforce R , Graff C , Synofzik M , Galimberti D , Rowe J , Masellis M , Tartaglia M , Finger E , Vandenberghe R , de Mendonça A , Tagliavini F , Santana I , Butler C , Gerhard A , Danek A , Levin J , Otto M , Sorbi S , Jiskoot L , Seelaar H , van Swieten J , Rohrer J , Misic B , Ducharme S ; Frontotemporal Lobar Degeneration Neuroimaging Initiative (FTLDNI) , GENetic Frontotemporal dementia Initiative (GENFI) ((2022) ) Network structure and transcriptomic vulnerability shape atrophy in frontotemporal dementia. Brain 146: , 321–336. |
[10] | Cerami C , Dodich A , Canessa N , Crespi C , Marcone A , Cortese F , Chierchia G , Scola E , Falini A , Cappa S ((2014) ) Neural correlates of empathic impairment in the behavioral variant of frontotemporal dementia. Alzheimers Dement 10: , 827–834. |
[11] | Fathy YY , Hoogers SE , Berendse HW , van der Werf YD , Visser PJ , de Jong FJ , van de Berg WDJ ((2020) ) Differential insular cortex sub-regional atrophy in neurodegenerative diseases: A systematic review and meta-analysis. Brain Imaging Behav 14: , 2799–2816. |
[12] | Rohrer JD , Nicholas JM , Cash DM , van Swieten J , Dopper E , Jiskoot L , van Minkelen R , Rombouts SA , Cardoso MJ , Clegg S , Espak M , Mead S , Thomas DL , De Vita E , Masellis M , Black SE , Freedman M , Keren R , MacIntosh BJ , Rogaeva E , Tang-Wai D , Tartaglia MC , Laforce R Jr , Tagliavini F , Tiraboschi P , Redaelli V , Prioni S , Grisoli M , Borroni B , Padovani A , Galimberti D , Scarpini E , Arighi A , Fumagalli G , Rowe JB , Coyle-Gilchrist I , Graff C , Fallström M , Jelic V , Ståhlbom AK , Andersson C , Thonberg H , Lilius L , Frisoni GB , Pievani M , Bocchetta M , Benussi L , Ghidoni R , Finger E , Sorbi S , Nacmias B , Lombardi G , Polito C , Warren JD , Ourselin S , Fox NC , Rossor MN , Binetti G ((2015) ) Presymptomatic cognitive and neuroanatomical changes in genetic frontotemporal dementia in the Genetic Frontotemporal dementia Initiative (GENFI) study: A cross-sectional analysis. Lancet Neurol 14: , 253–262. |
[13] | Cash DM , Bocchetta M , Thomas DL , Dick KM , van Swieten JC , Borroni B , Galimberti D , Masellis M , Tartaglia MC , Rowe JB , Graff C , Tagliavini F , Frisoni GB , Laforce R Jr. , Finger E , de Mendonça A , Sorbi S , Rossor MN , Ourselin S , Rohrer JD ((2018) ) Patterns of gray matter atrophy in genetic frontotemporal dementia: Results from the GENFI study. Neurobiol Aging 62: , 191–196. |
[14] | Dopper EG , Rombouts SA , Jiskoot LC , Heijer T , de Graaf JR , Koning I , Hammerschlag AR , Seelaar H , Seeley WW , Veer IM , van Buchem MA , Rizzu P , van Swieten JC ((2013) ) Structural and functional brain connectivity in presymptomatic familial frontotemporal dementia. Neurology 80: , 814–823. |
[15] | Malpetti M , Jones PS , Tsvetanov KA , Rittman T , van Swieten JC , Borroni B , Sanchez-Valle R , Moreno F , Laforce R , Graff C , Synofzik M , Galimberti D , Masellis M , Tartaglia MC , Finger E , Vandenberghe R , de Mendonça A , Tagliavini F , Santana I , Ducharme S , Butler CR , Gerhard A , Levin J , Danek A , Otto M , Frisoni GB , Ghidoni R , Sorbi S , Heller C , Todd EG , Bocchetta M , Cash DM , Convery RS , Peakman G , Moore KM , Rohrer JD , Kievit RA , Rowe JB ((2021) ) Apathy in presymptomatic genetic frontotemporal dementia predicts cognitive decline and is driven by structural brain changes. Alzheimers Dement 17: , 969–983. |
[16] | Whitwell JL , Josephs KA , Avula R , Tosakulwong N , Weigand SD , Senjem ML , Vemuri P , Jones DT , Gunter JL , Baker M , Wszolek ZK , Knopman DS , Rademakers R , Petersen RC , Boeve BF , Jack CR Jr. ((2011) ) Altered functional connectivity in asymptomatic MAPT subjects: A comparison to bvFTD. Neurology 77: , 866–874. |
[17] | Uddin LQ , Nomi JS , Hébert-Seropian B , Ghaziri J , Boucher O ((2017) ) Structure and function of the human insula. J Clin Neurophysiol 34: , 300–306. |
[18] | Fan L , Li H , Zhuo J , Zhang Y , Wang J , Chen L , Yang Z , Chu C , Xie S , Laird A , Fox P , Eickhoff S , Yu C , Jiang T ((2016) ) The Human Brainnetome Atlas: A new brain atlas based on connectional architecture. Cereb Cortex 26: , 3508–3526. |
[19] | Zhou J , Greicius MD , Gennatas ED , Growdon ME , Jang JY , Rabinovici GD , Kramer JH , Weiner M , Miller BL , Seeley WW ((2010) ) Divergent network connectivity changes in behavioural variant frontotemporal dementia and Alzheimer’s disease. Brain 133: , 1352–1367. |
[20] | Tzourio-Mazoyer N , Landeau B , Papathanassiou D , Crivello F , Etard O , Delcroix N , Mazoyer B , Joliot M ((2002) ) Automated anatomical labeling of activations in SPM using a macroscopic anatomical parcellation of the MNI MRI single-subject brain. Neuroimage 15: , 273–289. |
[21] | Li H , Ou Y , Liu F , Su Q , Zhang Z , Chen J , Zhu F , Zhao J , Guo W ((2020) ) Region-specific insular volumetric decreases in drug-naive, first-episode schizophrenia and their unaffected siblings. Am J Med Genet B Neuropsychiatr Genet 183: , 106–112. |
[22] | Panman JL , Jiskoot LC , Bouts M , Meeter LHH , van der Ende EL , Poos JM , Feis RA , Kievit AJA , van Minkelen R , Dopper EGP , Rombouts S , van Swieten JC , Papma JM ((2019) ) Gray and white matter changes in presymptomatic genetic frontotemporal dementia: A longitudinal MRI study. Neurobiol Aging 76: , 115–124. |
[23] | Jiskoot LC , Panman JL , Meeter LH , Dopper EGP , Donker Kaat L , Franzen S , van der Ende EL , van Minkelen R , Rombouts S , Papma JM , van Swieten JC ((2019) ) Longitudinal multimodal MRI as prognostic and diagnostic biomarker in presymptomatic familial frontotemporal dementia. Brain 142: , 193–208. |
[24] | Wolters EE , Papma JM , Verfaillie SCJ , Visser D , Weltings E , Groot C , van der Ende EL , Giannini LAA , Tuncel H , Timmers T , Boellaard R , Yaqub M , van Assema DME , Kuijper DA , Segbers M , Rozemuller AJM , Barkhof F , Windhorst AD , van der Flier WM , Pijnenburg YAL , Scheltens P , van Berckel BNM , van Swieten JC , Ossenkoppele R , Seelaar H ((2021) ) [(18)F]Flortaucipir PET across various MAPT mutations in presymptomatic and symptomatic carriers. Neurology 97: , e1017–e1030. |
[25] | Dopper EG , Rombouts SA , Jiskoot LC , den Heijer T , de Graaf JR , de Koning I , Hammerschlag AR , Seelaar H , Seeley WW , Veer IM , van Buchem MA , Rizzu P , van Swieten JC ((2014) ) Structural and functional brain connectivity in presymptomatic familial frontotemporal dementia. Neurology 83: , e19–26. |
[26] | Jiskoot LC , Bocchetta M , Nicholas JM , Cash DM , Thomas D , Modat M , Ourselin S , Rombouts S , Dopper EGP , Meeter LH , Panman JL , van Minkelen R , van der Ende EL , Donker Kaat L , Pijnenburg YAL , Borroni B , Galimberti D , Masellis M , Tartaglia MC , Rowe J , Graff C , Tagliavini F , Frisoni GB , Laforce R Jr. , Finger E , de Mendonça A , Sorbi S , Papma JM , van Swieten JC , Rohrer JD ((2018) ) Presymptomatic white matter integrity loss in familial frontotemporal dementia in the GENFI cohort: A cross-sectional diffusion tensor imaging study. Ann Clin Transl Neurol 5: , 1025–1036. |
[27] | Pattij T , Vanderschuren L ((2020) ) The neuropharmacology of impulsive behaviour, an update. Curr Top Behav Neurosci 47: , 3–22. |
[28] | Filippi M , van den Heuvel M , Fornito A , He Y , Hulshoff Pol H , Agosta F , Comi G , Rocca M ((2013) ) Assessment of system dysfunction in the brain through MRI-based connectomics. Lancet Neurol 12: , 1189–1199. |


