
Population-Based Mini-Mental State Examination Norms in Adults of Mexican Heritage in the Cameron County Hispanic Cohort
Abstract
Background:
Accurately identifying cognitive changes in Mexican American (MA) adults using the Mini-Mental State Examination (MMSE) requires knowledge of population-based norms for the MMSE, a scale which has widespread use in research settings.
Objective:
To describe the distribution of MMSE scores in a large cohort of MA adults, assess the impact of MMSE requirements on their clinical trial eligibility, and explore which factors are most strongly associated with their MMSE scores.
Methods:
Visits between 2004–2021 in the Cameron County Hispanic Cohort were analyzed. Eligible participants were ≥18 years old and of Mexican descent. MMSE distributions before and after stratification by age and years of education (YOE) were assessed, as was the proportion of trial-aged (50–85– year-old) participants with MMSE <24, a minimum MMSE cutoff most frequently used in Alzheimer’s disease (AD) clinical trials. As a secondary analysis, random forest models were constructed to estimate the relative association of the MMSE with potentially relevant variables.
Results:
The mean age of the sample set (n = 3,404) was 44.4 (SD, 16.0) years old and 64.5% female. Median MMSE was 28 (IQR, 28-29). The percentage of trial-aged participants (n = 1,267) with MMSE <24 was 18.6% overall and 54.3% among the subset with 0–4 YOE (n = 230). The five variables most associated with the MMSE in the study sample were education, age, exercise, C-reactive protein, and anxiety.
Conclusion:
The minimum MMSE cutoffs in most phase III prodromal-to-mild AD trials would exclude a significant proportion of trial-aged participants in this MA cohort, including over half of those with 0–4 YOE.
INTRODUCTION
The Mini-Mental State Examination (MMSE) is a brief test of global cognitive function that has been in use since its creation in 1975. The major strength of the MMSE is its extensive, decades-long use in clinical trials for Alzheimer’s disease (AD), particularly as a part of these trials’ eligibility criteria. If the MMSE can be used to accurately measure global cognition in a patient population with known MMSE norms, then it represents a time-efficient tool in the screening repertoire of clinicians and study sponsors.
Hispanics of Mexican descent are one of the largest and fastest growing ethnic groups in the United States (US), with an estimated population in 2017 of 36.6 million, 26% of which reside in Texas [1]. Despite the Mexican American (MA) population’s size and growth, studies of the distribution of MMSE scores in MAs across adulthood (i.e., ≥18 years of age) are scarce. Moreover, it is unclear whether the variables associated with global cognition (or tests thereof) at various stages of adulthood in the general US population bear similar associations in the MA population. Since the MMSE is used so frequently in the clinical setting for screening patients and for determining eligibility in treatment trials, it is important to know the normative values in our MA patients and the factors associated with their performance on these tests.
Current evidence suggests that the epidemiology of cognitive changes in the MA population may be different from that of other ethnoracial groups or of the general US population. For example, among MA adults who develop dementia, the onset of cognitive decline tends to occur at a younger age compared to other ethnic groups; however, the typical stage of dementia at which Hispanics (an ethnoracial category that includes MAs) in the US are diagnosed is later than that of non-Hispanic Whites, suggesting that systemic factors such as poor access to medical care or cultural health beliefs may underlie the earlier onset of decline and the later presentation to medical attention [2–5]. Additionally, several risk factors for cognitive decline, such as obesity and diabetes, are more prevalent in the MA population than among non-Hispanic Whites in the US [6, 7].
There were two primary objectives of our cross-sectional study of MA adults living in Texas near the US-Mexico border. First, we sought to characterize the distribution of MMSE scores in this population, particularly after stratification by age and education. Second, using the minimum MMSE scores that have often been required for eligibility in clinical trials for prodromal and/or mild AD, we sought to estimate the proportion of MA individuals who failed to meet typical MMSE eligibility criteria. Finally, as a secondary analysis, we assessed which variables are most associated with MMSE scores in the MA population.
METHODS
Study population
The Cameron County Hispanic Cohort (CCHC) is a longitudinal representative cohort of Cameron County residents that has been active since 2004 [8]. The population of Cameron County, which is located in the Lower Rio Grande Valley region of Texas, is approximately 86% MA [9]. Details regarding the CCHC’s randomization, recruitment, and data collection procedures have been described previously [7]. Selection for CCHC recruitment began by stratifying the census tracts within Cameron County into quartiles according to median income from the 2000 US Census [10, 11]. Of the tracts in the first and third income quartiles, 101 census tracts were randomly selected. Census blocks were then randomly selected from each of the chosen tracts. For all households in a selected census block, a team of bilingual staff that was recruited from the local population and trained in the CCHC’s Clinical Research Unit (CRU) went door-to-door to enumerate and invite household members to enroll in the CCHC. Prior to 2013, household members 18 years or older were invited to enroll in the CCHC; since 2013, children 8 years or older have also been invited to participate.
After providing informed consent, adults who chose to join the cohort underwent a detailed baseline visit at the CCHC CRU or at the participant’s home, whichever the participant preferred. Medical, demographic, lifestyle, and family history data were collected via questionnaires, structured interviews, and neuropsychological scales including the MMSE, the Center for Epidemiologic Studies Depression Scale (CES-D), and the Zung Self-rating Anxiety Scale (SAS). All assessments were performed in the participants’ preferred language of Spanish or English. Laboratory data (e.g., clinical chemistries, electrocardiography) and anthropometric measurements (e.g., waist circumference, height, and weight) were also collected.
The Institutional Review Board of the University of Texas Health Science Center at Houston and the University of Texas at Brownsville approved this study.
Sample selection
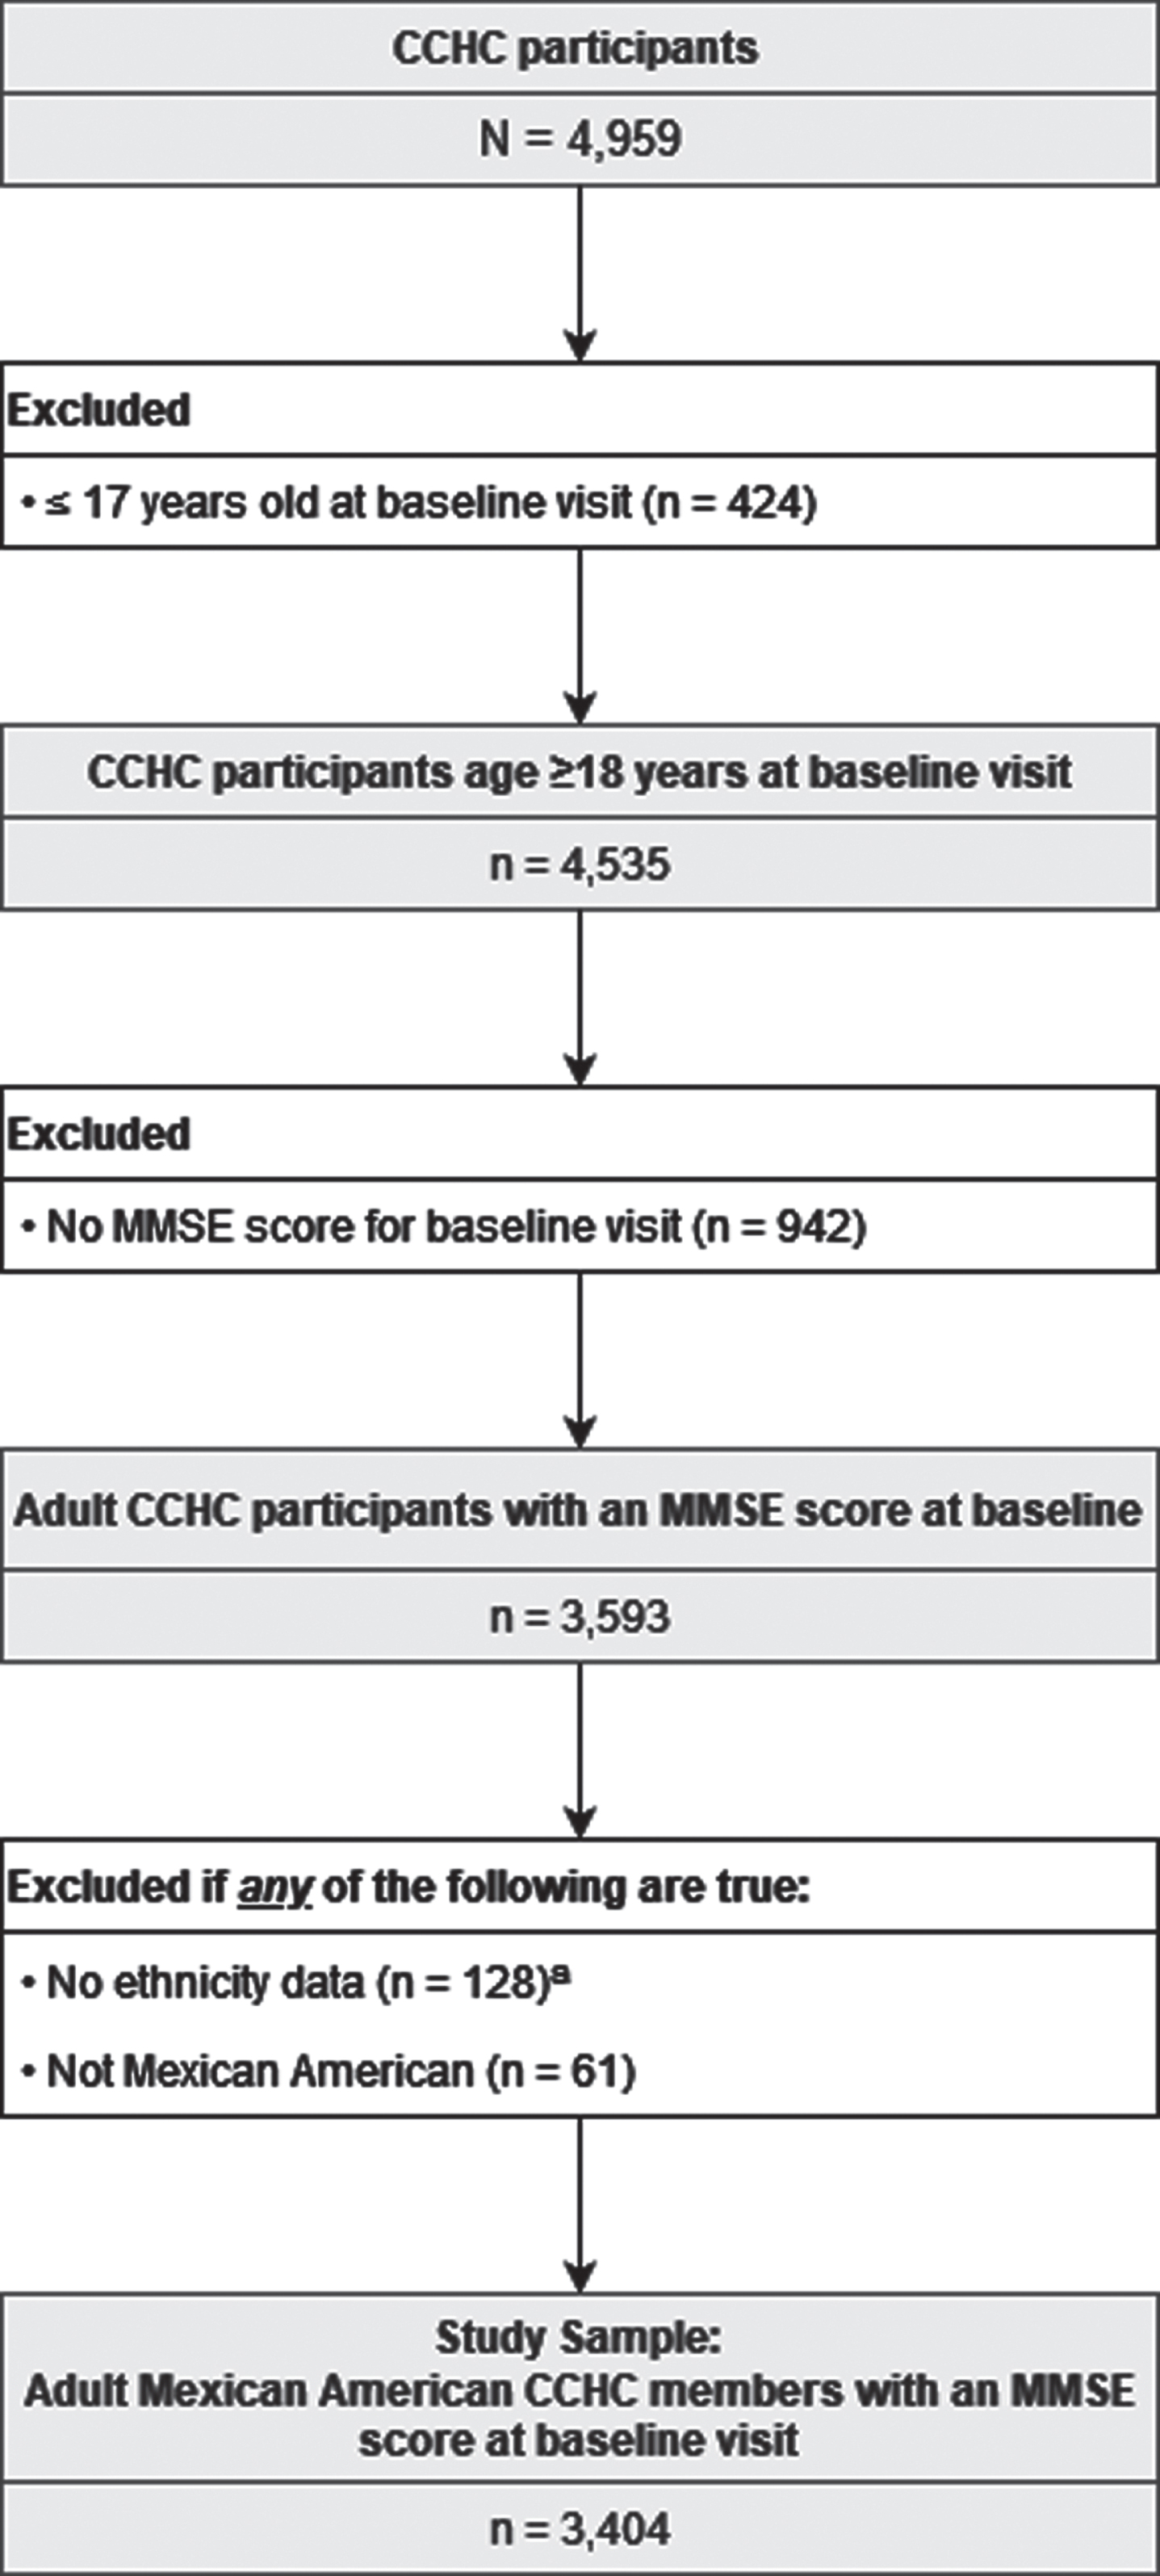
Data for CCHC baseline visits between April 2004 and December 2021 were used. Cohort members were excluded from the study sample if they did not have an MMSE score, were ≤17 years old, or were not MA. Participants were considered MA if they self-identified as MA, were born in Mexico, or reported having at least one parent or grandparent who was born in Mexico. The sampling selection methodology is shown in Fig. 1.
Fig. 1
Sample Selection Methodology. Visits were conducted between April 2004 and December 2021. Individuals were excluded if they were ≤17 years old, did not have an MMSE score, did not have ethnicity data, or were not Mexican American. aDefined by lack of data for all of the following: self-reported ethnicity, birth country, parents’ birth countries, and grandparents’ birth countries.
Outcome measurement
The MMSE was administered to all CCHC participants 18 years or older in their choice of either English or Spanish. For the attention component of the MMSE, participants performed both the “serial 7s” subtraction task and the backwards spelling task; the higher of these two scores was used to calculate the total MMSE score. A blank copy of the MMSE and the scoring instructions that were used are provided in Supplementary Form 1.
Independent variables
Variables associated with the MMSE and/or global cognition in prior studies of the general US and/or US Hispanic populations were extracted from the CCHC dataset for analysis. These variables included demographic data, such as age [12–15], years of education (YOE) [12–23], gender [12, 16, 23], primary lifetime occupation [17, 21–24], household income [18, 25], primary language(s) spoken at home [17, 18, 25, 26], and marital status [17, 20, 23, 27–30]; medical history data, such as diabetes [17, 20–23, 30, 31], hypertension [17, 20–22, 30, 32], dyslipidemia [17, 21–23, 30, 33], kidney disease [34, 35], coronary artery disease [22, 25], cerebrovascular disease [21, 22, 25, 36], and obesity [20, 22, 25, 30]; measurements of anxious and depressive symptoms [17, 20, 21, 23, 25, 29, 37]; lifestyle data, such as cigarette use [17, 20–23, 30], alcohol consumption [17, 20, 22, 30], exercise habits [17, 20, 21, 23, 25, 30], and influenza vaccination history [38]; family history in biological siblings or parents of diabetes [39, 40], hypertension [41–43], cardiovascular disease [44], or cerebrovascular disease [45, 46]; laboratory data, including lipid levels and biomarkers related to inflammation, stress, and/or metabolic health (e.g., IL-1β, IL-6, TNF-α, leptin, resistin) [22, 23, 37, 47, 48]; and anthropometric measurements such as waist circumference, height, and weight [20, 30, 49]. With the exceptions of laboratory and anthropometric data, all variables were collected via patient self-report. The full definition of each variable used in this study is provided in Supplementary Table 1.
Statistical analyses
The distribution of MMSE scores and the factors that influence cognition and/or performance on the MMSE in early and middle adulthood likely differ from those later in adulthood. Therefore, the analyses conducted here were 1) for the entire study sample and 2) for two subgroups: early and middle-aged adults (between the ages of 18–64 years, inclusive) and older adults (≥65 years of age). The age of 65 was chosen as the boundary of these two subgroups because the incidence of the most common cause of dementia (i.e., AD) becomes appreciable in the general population around 65 years of age [49]. Random forest analyses were performed using MATLAB version R2021a; all other analysis was completed using R version 4.1.2.
Distribution of MMSE scores and selected covariates
Summary statistics for the MMSE and the independent variables were computed for the entire sample and for the two aforementioned subgroups. The distribution of MMSE scores was further examined after stratification by age and YOE, the latter of which was divided into four levels (0–4 years, 5–8 years, 9–12 years, and ≥13 years) to reflect the classification scheme used in the seminal paper by Crum et al. that described the distribution of MMSE scores among the general US population [50].
Application of MMSE eligibility cutoffs used in many clinical trials for prodromal or mild AD
To assess the percentage of participants in this sample that would be excluded by the MMSE-related eligibility criteria used in clinical trials for prodromal-to-mild AD, we extracted a subset of the trials identified in a recent systematic review of phase II and III drug trials for prodromal, mild, or moderate AD [51]. Of the 101 clinical trials included in that systematic review, we excluded phase II trials, trials enrolling patients with moderate AD, and trials only enrolling patients with autosomal dominantly-inherited AD. This yielded a list of 19 phase III clinical trials for patients with prodromal-to-mild AD. The age- and MMSE-related eligibility criteria for each of these 19 trials were collected from clinicaltrials.gov and are provided in Supplementary Table 2. The median and mode of the minimum eligible age in these trials was 50 years, and the median and mode for the maximum eligible age was 85 years. Therefore, in addition to the age subgroups of early-to-middle and older adulthood, we also examined the distribution of MMSE scores in adults ages 50 to 85 years (inclusive). Using the MMSE eligibility cutoffs from the clinical trials shown in Supplementary Table 2, we then assessed the proportion of participants 50–85 years old that would be excluded from trial participation due to minimum MMSE requirements.
Secondary analysis: Estimation of relative feature importance via random forests
As a secondary analysis, random forest (RF) classifier models were used to investigate which independent variables are most strongly associated with MMSE score. Random forest classifiers were chosen for this exploratory analysis as they do not require prespecified models, can detect nonlinearity and higher order interactions, have low risk of overfitting, and can output variable importance measures [52–54]. Three models were constructed: one for the study sample (i.e., all adults 18 and older), one for early and middle-aged adults (18–64 years old), and one for older adults (≥65 years old).
Prior to construction of each model, two preprocessing steps were performed. First, because the MMSE distribution in the study sample and in the two subgroups demonstrated significant class imbalance skewed towards higher scores (e.g., in the ≥65 subgroup there were 60 participants with an MMSE of 29 but only 2 participants with an MMSE of 8), the lowest decile of MMSE scores was combined into one class, but higher scores were left ungrouped. For example, in the ≥65 subgroup, an MMSE of ≤17 represented the 7th percentile and a score of ≤18 represented the 11th percentile; therefore, in the RF model for the ≥65 subgroup, MMSE scores ≤18 were combined into one class but scores above 18 were not combined (e.g., an MMSE score of 19 was one level, an MMSE of 20 was another, etc.), resulting in a total of 13 MMSE levels for the 65-and-older subgroup. The frequency distribution of MMSE scores in each subgroup after aggregation of the lowest decile of scores are shown in Supplementary Figure 1.
Second, the RF model for the study sample only included the independent variables with data available for at least 50% of participants; similarly, the independent variables included in the RF model for each of the subgroups were limited to variables with data available for ≥50% of the participants in that subgroup. With the exception of the laboratory variables, the number of participants missing data for each of the independent variables is shown in Table 1. Laboratory measurements with data for ≥50% of participants in the study sample and in the two subgroups were hemoglobin A1C (HbA1c), fasting lipids, fasting blood glucose, estimated glomerular filtration rate, and albumin-to-creatinine ratio. Because these measurements were used in the case-identification algorithms specified in Supplementary Table 1 (e.g., HbA1c and fasting blood glucose were used in the case-identification algorithm for diabetes), these measurements were not included as separate covariates in the RF models. Measurements of C-reactive protein (CRP), which was not used in any of the case-identification algorithms, were available for ≥50% of the study sample and of the 18–64 subgroup, but not the ≥65 subgroup. Therefore, CRP was included as a covariate in the RF models for the study sample and the 18–64 subgroup, but not for the ≥65 subgroup.
Table 1
Sample characteristics
| Age (years) | |||||||
| 18–64 (n = 3,024; 88.8% of sample) | ≥65 (n = 380; 11.2% of sample) | All Adults (n = 3,404) | |||||
| Age (years) | |||||||
| Mean (SD) Median (IQR) | 40.9 (13.3) 41 (30–52) | 72.0 (6.3) 70.5 (67–76) | 44.4 (16.0) 44 (31–57) | ||||
| Gender | |||||||
| Female | 1,956 | 64.7% | 241 | 63.4% | 2,197 | 64.5% | |
| Male | 1,068 | 35.3% | 139 | 36.6% | 1,207 | 35.5% | |
| MMSE score | |||||||
| Mean (SD) | 27.6 (2.8) | 25.0 (4.9) | 27.3 (3.2) | ||||
| Median (IQR) | 29 (27–30) | 27 (22–29) | 28 (26–29) | ||||
| Years of education | |||||||
| 0 to 4 | 168 | 5.6% | 123 | 32.8% | 291 | 8.6% | |
| 5 to 8 | 653 | 21.7% | 1139 | 30.1% | 766 | 22.6% | |
| 9 to 12 | 1,277 | 42.4% | 66 | 17.6% | 1,343 | 39.7% | |
| >13 | 913 | 30.3% | 73 | 19.5% | 986 | 29.1% | |
| Unknown | 13 | 5 | 18 | ||||
| Annual household income ($) | |||||||
| Unadjusted | Mean (SD) | 27,569 | 17,075 | 26,320 | |||
| (39,235) | (17,196) | (37,453) | |||||
| Median (IQR) | 16,900 | 12,000 | 15,600 | ||||
| (10,000–32,000) | (8,400–17,900) | (9,600–30,000) | |||||
| Per capita | Mean (SD) | 7,416 | 7,213 | 7,392 | |||
| (9,527) | (7,232) | (9,285) | |||||
| Median (IQR) | 4,286 | 5,121 | 4,400 | ||||
| (2,400–8,350) | (3,120–8,739) | (2,400–8,400) | |||||
| ≤Federal poverty levela | 63.8% | 72.8% | 64.8% | ||||
| Unknown | 1,224 | 140 | 1,364 | ||||
| Occupational skill level (ISCO classification) | |||||||
| Level 3 or 4 | 753 | 25.3% | 101 | 27.1% | 854 | 25.5% | |
| Level 2 | 829 | 27.8% | 113 | 30.3% | 942 | 28.1% | |
| Level 1 | 421 | 14.1% | 68 | 18.2% | 489 | 14.6% | |
| Student or no occupation | 978 | 32.8% | 91 | 24.4% | 1,069 | 31.9% | |
| Unknown | 43 | 7 | 50 | ||||
| Language used at home | |||||||
| Only Spanish or mostly Spanish | 1,589 | 73.2% | 236 | 81.1% | 1,825 | 74.1% | |
| English and Spanish equally | 310 | 14.3% | 26 | 8.9% | 336 | 13.6% | |
| Only English or mostly English | 272 | 12.5% | 29 | 10.0% | 301 | 12.2% | |
| Unknown | 853 | 89 | 942 | ||||
| Marital status | |||||||
| Single or never married | 682 | 55.5% | 33 | 31.4% | 715 | 53.6% | |
| Married | 227 | 18.5% | 27 | 25.7% | 254 | 19.0% | |
| Divorced, separated, or widowed | 320 | 26.0% | 45 | 42.9% | 365 | 27.4% | |
| Unknown | 1,795 | 275 | 2,070 | ||||
| COMORBIDITIES | |||||||
| Diabetes | |||||||
| Non-diabetic &no history of diabetes | 2,268 | 77.0% | 188 | 51.2% | 2,456 | 74.1% | |
| Diagnosed &controlled | 80 | 2.7% | 30 | 8.2% | 110 | 3.3% | |
| Diagnosed &uncontrolled | 329 | 11.2% | 118 | 32.2% | 447 | 13.5% | |
| Diabetic but undiagnosed | 270 | 9.2% | 31 | 8.4% | 301 | 9.1% | |
| Unknown | 77 | 13 | 90 | ||||
| Hypertension | |||||||
| Normotensive &no history of hypertension | 1,845 | 61.4% | 71 | 18.8% | 1,916 | 56.6% | |
| Diagnosed &controlled | 277 | 9.2% | 101 | 26.8% | 378 | 11.2% | |
| Diagnosed &uncontrolled | 363 | 12.1% | 149 | 39.5% | 512 | 15.1% | |
| Hypertensive but undiagnosed | 522 | 17.4% | 56 | 14.9% | 578 | 17.1% | |
| Unknown | 17 | 3 | 20 | ||||
| Dyslipidemia | |||||||
| 1,722 | 57.0% | 280 | 73.7% | 2,002 | 58.8% | ||
| Unknown | 1 | 0 | 1 | ||||
| Stroke, TIA, or carotid endarterectomy | |||||||
| 54 | 1.8% | 26 | 6.9% | 80 | 2.4% | ||
| Unknown | 9 | 3 | 12 | ||||
| Coronary artery disease | |||||||
| 76 | 2.5% | 52 | 13.8% | 128 | 3.8% | ||
| Unknown | 7 | 3 | 10 | ||||
| Waist-to-height ratio | |||||||
| WHtR >0.5 | 2,799 | 92.8% | 371 | 98.9% | 3,170 | 93.5% | |
| Unknown | 8 | 5 | 13 | ||||
| Body mass index | |||||||
| BMI ≥30 | 1,548 | 51.2% | 190 | 50.0% | 1,738 | 51.1% | |
| Unknown | 4 | 5 | 9 | ||||
| Kidney disease | |||||||
| 68 | 3.8% | 46 | 16.5% | 114 | 5.6% | ||
| Unknown | 1,257 | 101 | 1,358 | ||||
| Positive depression screen (CES-D ≥20) | |||||||
| 592 | 19.7% | 77 | 20.5% | 669 | 19.8% | ||
| Unknown | 13 | 4 | 17 | ||||
| Positive GAD screen (SAS ≥36) | |||||||
| 1,762 | 58.6% | 235 | 62.7% | 1,997 | 59.0% | ||
| Unknown | 17 | 5 | 22 | ||||
| HEALTH BEHAVIORS AND BELIEFS | |||||||
| Cigarette pack years | |||||||
| Mean (SD) | 4.0 (8.1) | 11.6 (21.9) | 4.9 (11.0) | ||||
| Unknown | 1,622 | 192 | 1,814 | ||||
| Standard alcoholic drinks per day | |||||||
| Mean (SD) | 2.0 (3.6) | 3.3 (4.3) | 2.2 (3.8) | ||||
| Unknown | 1,168 | 96 | 1,264 | ||||
| Self-perceived general health | |||||||
| Excellent | 128 | 5.0% | 24 | 7.8% | 152 | 5.9% | |
| Very good | 892 | 11.2% | 149 | 48.7% | 1,041 | 40.5% | |
| Good | 880 | 38.8% | 91 | 29.7% | 971 | 37.7% | |
| Fair | 253 | 39.3% | 28 | 9.2% | 281 | 10.9% | |
| Poor | 114 | 5.6% | 14 | 4.6% | 128 | 5.0% | |
| Unknown | 757 | 74 | 831 | ||||
| History of influenza vaccination | |||||||
| 271 | 48.0% | 65 | 70.7% | 336 | 51.1% | ||
| Unknown | 2,459 | 288 | 2,747 | ||||
| MET-minutes of moderate or strenuous activity in a typical week | |||||||
| Mean (SD) | 940.5 (2,306.3) | 394.5 (1,136.0) | 875.8 (2,207.2) | ||||
| Median (IQR) | 0 (0–1,080) | 0 (0–0) | 0 (0–945) | ||||
| Satisfies AHA 2007 exercise recommendation of ≥450 MET-minutes per week | 36.5% | 17.9% | 34.3% | ||||
| Unknown | 1,447 | 168 | 1,615 | ||||
| FAMILY MEDICAL HISTORY | |||||||
| Stroke, TIA, or carotid endarterectomy | |||||||
| 594 | 19.9% | 103 | 28.1% | 697 | 20.8% | ||
| Unknown | 32 | 14 | 46 | ||||
| Cardiovascular disease or surgery | |||||||
| 921 | 30.5% | 172 | 45.9% | 1,093 | 32.2% | ||
| Unknown | 8 | 5 | 13 | ||||
| Diabetes | |||||||
| 1,596 | 52.8% | 218 | 58.1% | 1,814 | 53.4% | ||
| Unknown | 3 | 5 | 8 | ||||
| Hypertension | |||||||
| 1,929 | 64.9% | 223 | 62.3% | 2,152 | 64.6% | ||
| Unknown | 50 | 22 | 72 | ||||
AHA, American Heart Association; CES-D, Center for Epidemiologic Studies Depression; GAD, generalized anxiety disorder; IQR, interquartile range; ISCO, International Standard Classification of Occupations; MET, metabolic equivalents of task; SAS, Zung Self-rating Anxiety Scale; SD, standard deviation; TIA, transient ischemic attack. aFor each participant, the federal poverty level was based on the participant’s household size and the year in which the visit occurred.
The RF models were constructed in MATLAB using the “TreeBagger” function with the “fitctree” argument. Each random forest consisted of 500 classification trees; by convention and per the “TreeBagger” default, the number of predictors (i.e., independent variables) randomly sampled at each node was set as the square root of the number of available predictors [55]. The Gini index was used as the split criterion. All other parameters followed the default settings of the “TreeBagger” function and the “fitctree” argument [56].
Feature importance scores were then extracted from each of the three RF models. Every variable within the model is given a score between –1 and 1. If a variable has a score that is positive (between 0.01 and 1), the variable contributes to the model’s ability to discriminate between levels of the outcome (i.e., MMSE score). Conversely, a variable with a feature importance score of zero does not contribute to the model’s ability to discriminate between outcome levels, and a variable with a negative score (between –0.01 and –1) reduces the discriminatory ability of the model. The variables were then ranked with the highest score first.
RESULTS
Descriptive statistics
Application of the eligibility criteria in Fig. 1 yielded a study sample of 3,404 participants. Summary statistics for the distributions of MMSE scores and independent variables are provided in Table 1. The sample’s median MMSE score was 28 (IQR 26–29) and its mean score was 27.3 (SD 3.2).
Of the total sample, 88.8% (n = 3,024) were in the 18–64 age subgroup and 11.2% (n = 380) were in the ≥65 age subgroup. For the entire sample, the average unadjusted annual income was $26,320. After adjusting for household size, the household income was at or below the US federal poverty level for 73.0% of participants. A majority of participants (53.6%) identified as single or never married. Most participants (74.1%) reported speaking exclusively or predominantly Spanish at home.
The distribution of MMSE scores for our sample, stratified by age and YOE, is shown in Table 2. Mean and median MMSEs were lower in the older subgroup, as were years of education (YOE) and income. A comparison of the MMSE distribution of our sample and the general US population norms is provided in Fig. 2.
Fig. 2
Comparison of the CCHC and crum MMSE score distributions, stratified by age and education. *There were no participants age ≥85 years with 9–12 years of education in the CCHC sample; therefore, only the Crum paper’s MMSE distribution is plotted at this age-education intersection. YOE, years of education.
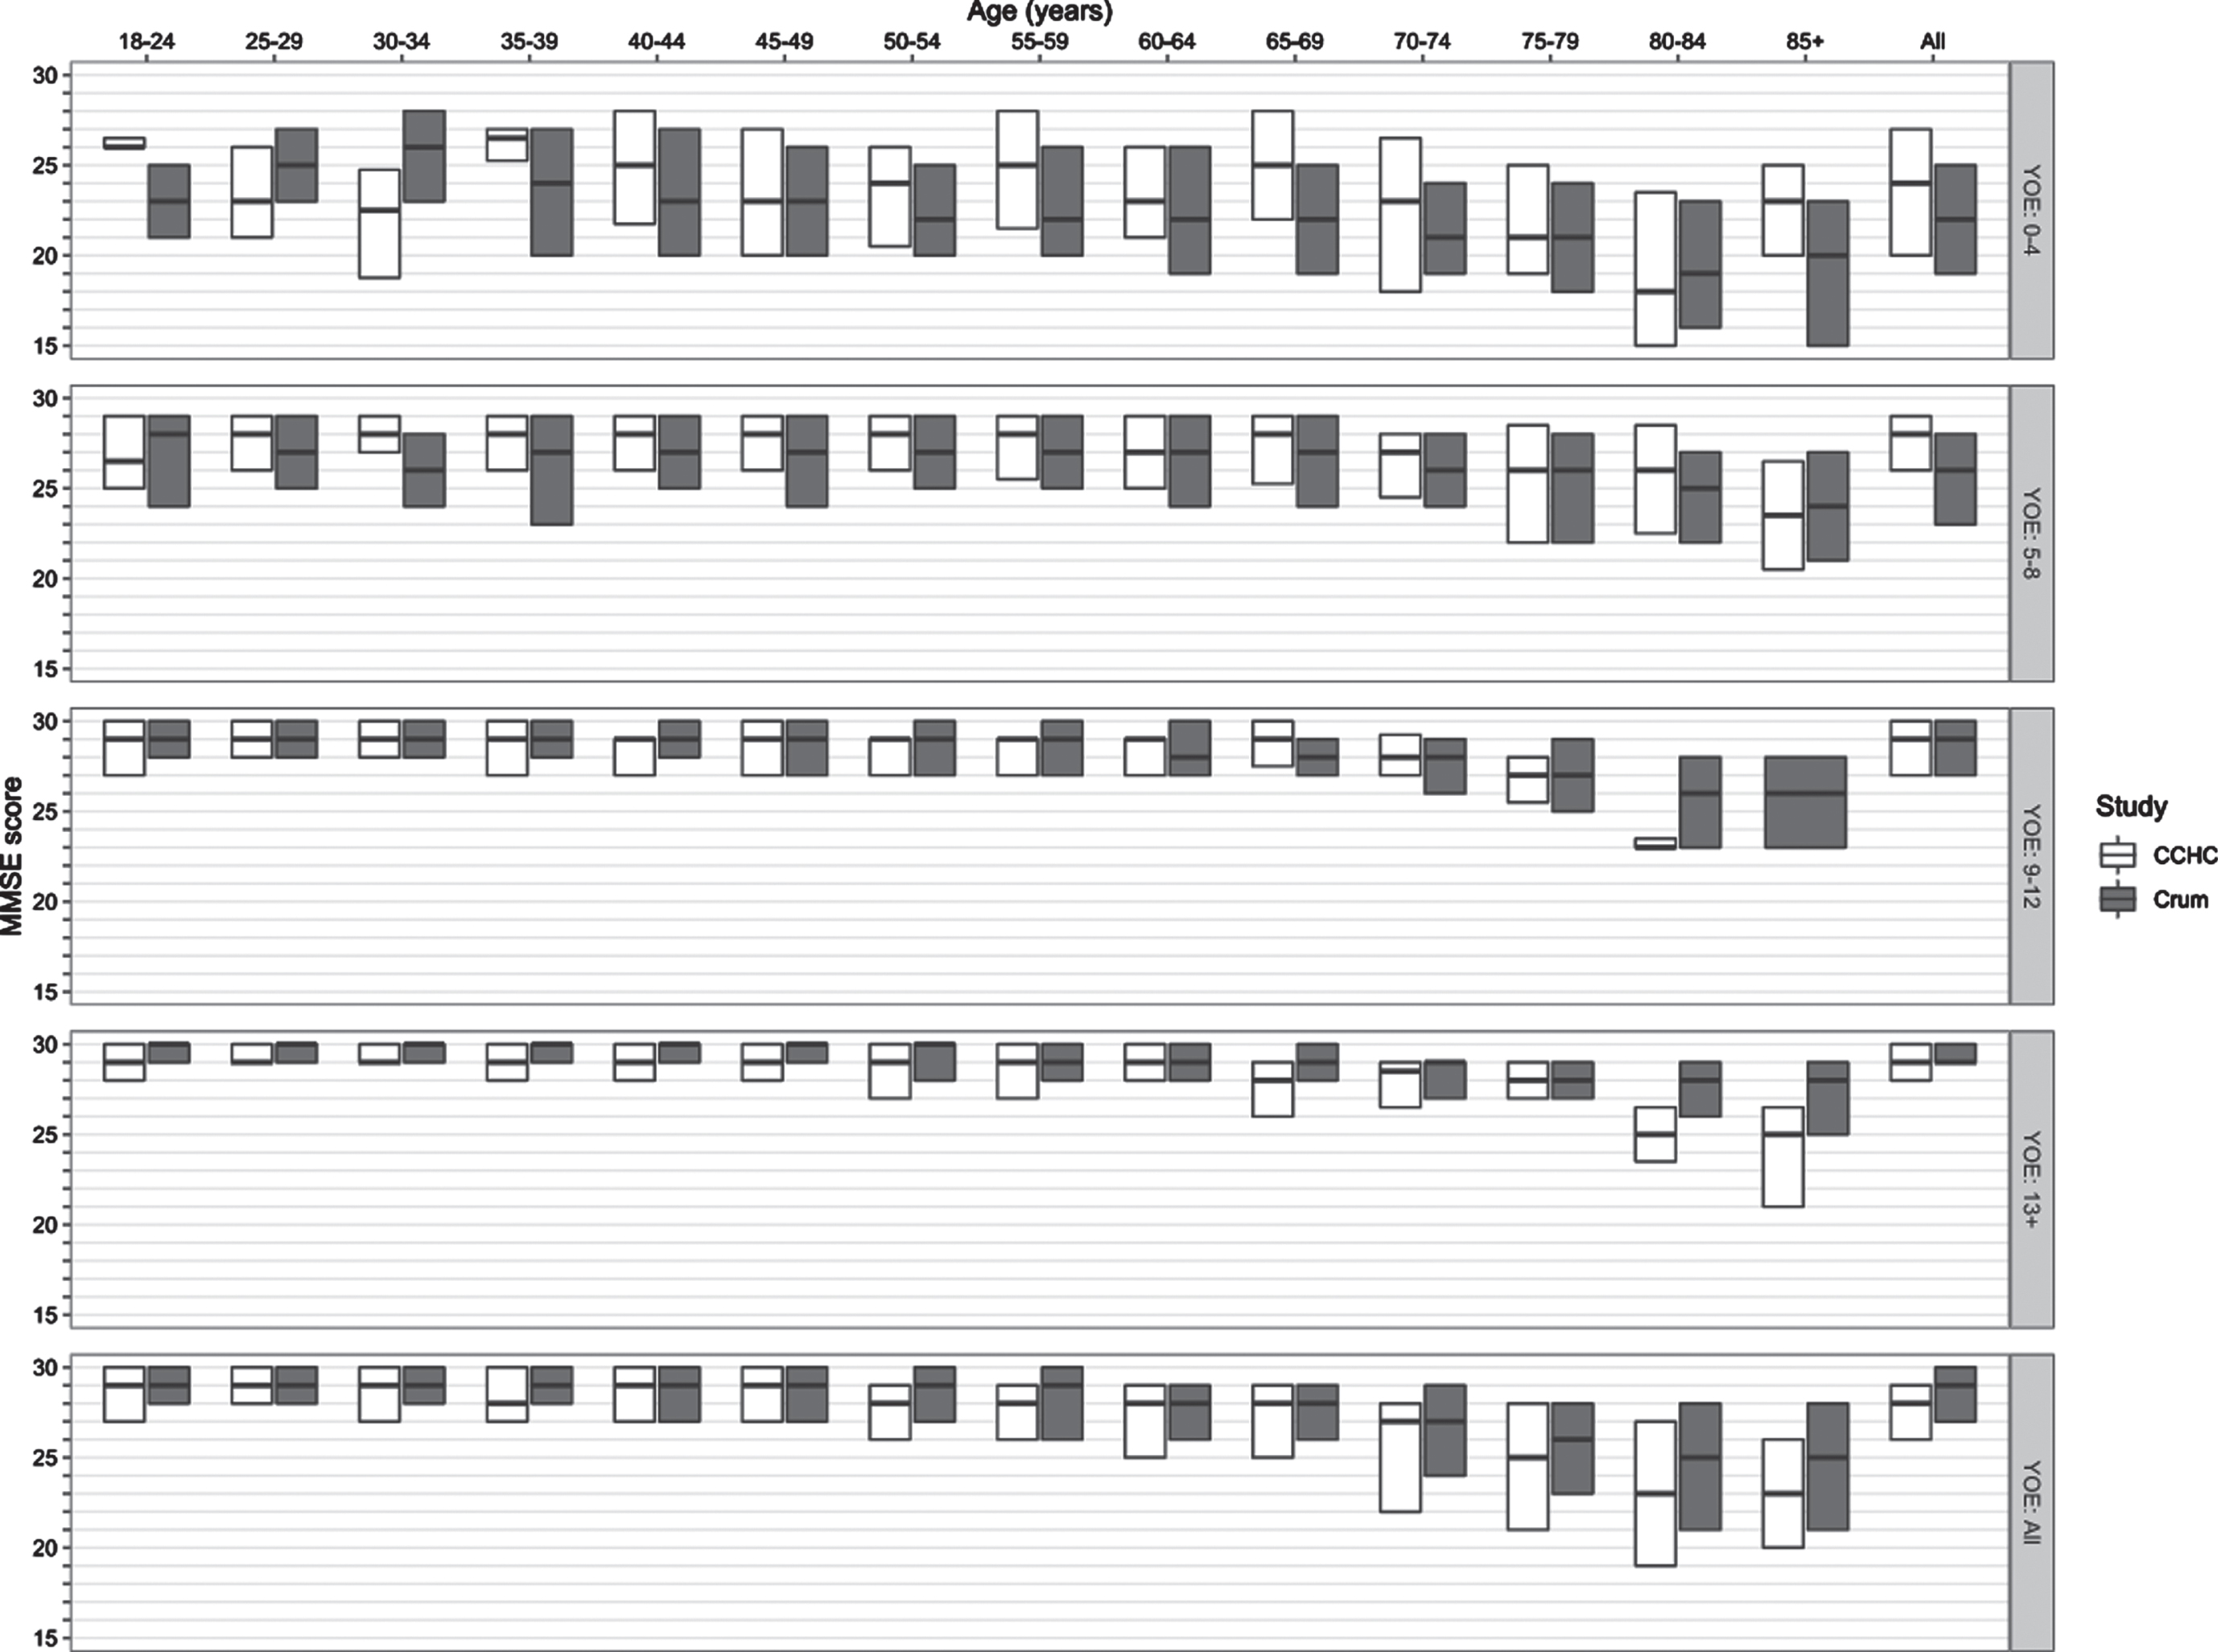
Table 2
Distribution of MMSE scores in the CCHC, stratified by age and education
| Years of Education | ||||||
| 0–4 | 5–8 | 9–12 | ≥13 | Total | ||
| ENTIRE SAMPLE (AGE≥18) | n (% of total) | 291 (8.6%) | 766 (22.6%) | 1,343 (39.7%) | 986 (29.1%) | 3,386 |
| MMSE Mean (SD) | 22.8 (4.7) | 26.7 (3.0) | 27.8 (2.5) | 28.5 (2.0) | 27.3 (3.2) | |
| MMSE Median (IQR) | 23 (20–27) | 28 (25–29) | 29 (27–29) | 29 (28–30) | 28 (26–29) | |
| YOUNGER ADULTS (18≤AGE≤64) | n (% of total) | 168 (5.6%) | 653 (21.7%) | 1,277 (42.4%) | 913 (30.3%) | 3,011 |
| MMSE Mean (SD) | 23.3 (4.1) | 26.9 (2.8) | 27.8 (2.4) | 28.6 (1.9) | 27.6 (2.8) | |
| MMSE Median (IQR) | 23 (21–27) | 28 (25–29) | 29 (27–30) | 29 (28–30) | 29 (27–30) | |
| OLDER ADULTS (AGE≥65) | n (% of total) | 123 (32.8%) | 113 (30.1%) | 66 (17.6%) | 73 (19.5%) | 375 |
| MMSE Mean (SD) | 22.1 (5.4) | 25.6 (3.7) | 27.1 (3.6) | 27.1 (3.2) | 25.0 (4.9) | |
| MMSE Median (IQR) | 23 (19–26) | 27 (23–29) | 28 (27–29) | 28 (26–29) | 27 (22–29) | |
| TRIAL-AGED ADULTS (50≤AGE≤85) | n (% of total) | 230 (18.2%) | 404 (31.9%) | 354 (27.9%) | 279 (22.0%) | 1,267 |
| MMSE Mean (SD) | 22.8 (4.8) | 26.4 (3.2) | 27.5 (2.6) | 28.0 (2.6) | 26.4 (3.8) | |
| MMSE Median (IQR) | 23 (20–26.8) | 27 (25–29) | 28 (26.2–29) | 29 (27–30) | 28 (25–29) | |
Individuals for whom education data is missing are not included in percentage calculations. The number of individuals in the overall study sample and in the 18–64 and ≥65 subgroups is provided in Table 1; for the trial-aged subgroup, education data was missing for 10 individuals. IQR, interquartile range; SD, standard deviation.
Application of MMSE eligibility cutoffs used in phase III clinical trials for prodromal or mild AD
All but two of the 19 clinical trials listed in Supplementary Table 2 used MMSE requirements in their eligibility criteria, and none of the studies adjusted MMSE cutoffs for level of education. The minimum eligible MMSE scores among those 17 trials had a median of 22, modes of 20 and 24, and range of 20–24. For the maximum eligible MMSE scores, the median was 30, mode 30, and range 26–30.
Table 3 shows the percentage of individuals 50–85 years old (n = 1,267), stratified by YOE, with MMSE scores below various cutoffs, including those used in the trials listed in Supplementary Table 2. Thus, the percentages in Table 3 provide an estimate of the proportion of trial-aged adults in this MA population that would be excluded from participation in prodromal-to-mild AD trials due to minimum MMSE eligibility requirements. Implications of these results are discussed in the “Impact of Minimum MMSE Cutoffs on Access to Phase 3 Prodromal-to-Mild AD Trials” subsection below.
Table 3
Percentage of individuals 50–85 years old with MMSE scores below various MMSE cutoffs
| Years of Education | |||||
| 0–4 (n = 230) | 5–8 (n = 404) | 9–12 (n = 354) | ≥13 (n = 279) | Total (n = 1,267) | |
| MMSE <24 | 54.3% | 18.3% | 6.8% | 4.7% | 18.6% |
| MMSE <22 | 37.4% | 10.1% | 2.8% | 2.9% | 11.4% |
| MMSE <20 | 22.6% | 3.7% | 1.4% | 2.2% | 6.2% |
| MMSE <18 | 13.0% | 1.5% | 0.8% | 1.1% | 3.3% |
| MMSE <16 | 6.5% | 0.7% | 0.6% | 0.7% | 1.7% |
Secondary analysis: Results of random forest models
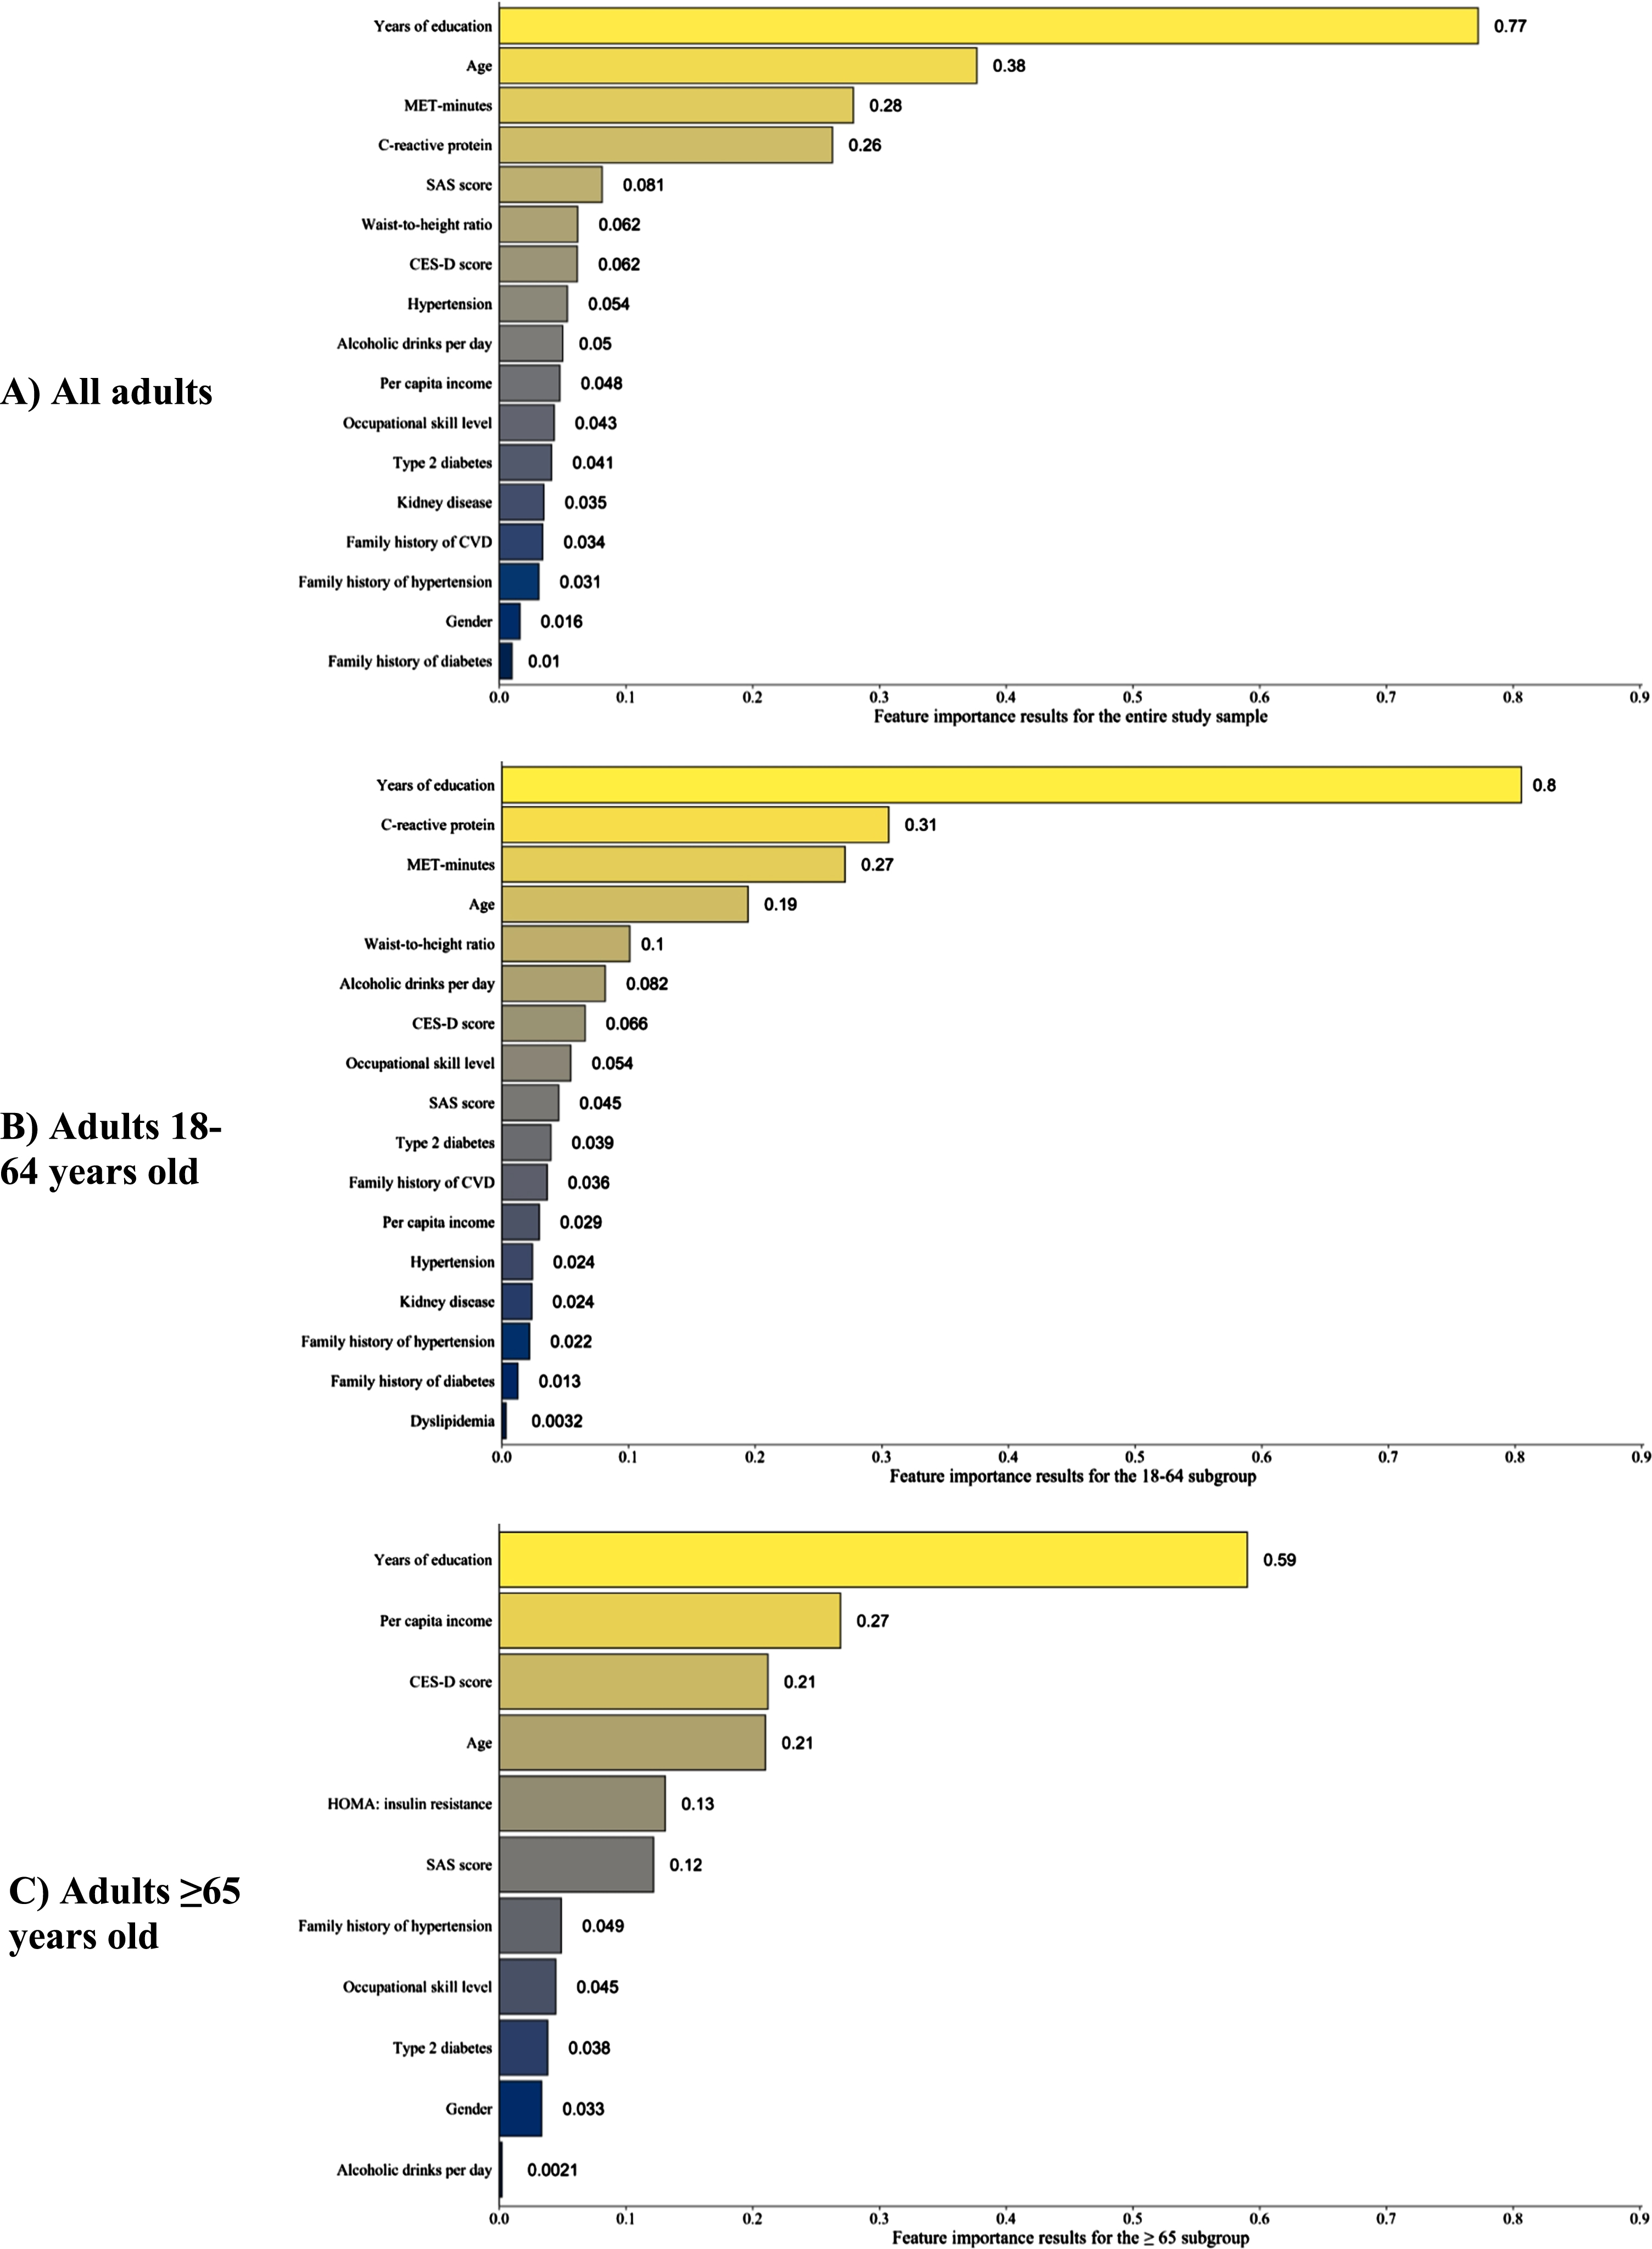
The independent variables with relative importance values >0 are shown in Fig. 3. The feature importance results for all independent variables, including those with relative importance value ≤0, are provided in Supplementary Table 3. For the study sample and the two subgroups, education had the highest relative feature importance, indicating it was most strongly associated with MMSE scores. Other variables with high feature importance in the study sample and the two subgroups were age, depression and anxiety screening scores, annual household income per capita, occupational skill level, and MET-minutes of moderate-to-strenuous exercise per week.
Fig. 3A-C
Variables with positive feature importance scores in the random forest analyses. The random forest models for the three subgroups used the same covariates except for C-reactive protein, which was not included in the 65+ model. Variables with negative feature importance scores for a given subgroup were excluded from the above figures. A table of variables with feature importance scores that includes those with negative importance scores is provided as Supplementary Table 3. CES-D, Center for Epidemiologic Studies Depression; CVD, cerebrovascular disease; HOMA, homeostatic model assessment; MET, metabolic equivalents of task; SAS, Zung Self-rating Anxiety Scale.
DISCUSSION
This study investigated the distribution of MMSE scores among MA adults in the CCHC, particularly in comparison to the MMSE eligibility criteria that have been used in clinical trials for prodromal-to-mild AD. The CCHC’s two-stage, census tract- and block-based cluster sampling methodology, in conjunction with its door-to-door survey of all households in selected blocks and invitation of all adult household members to participate, provides a representative sample from which to estimate MMSE norms and distribution parameters for this MA population.
MMSE distributions in the CCHC compared to the general US population and other US Hispanic cohorts
To the best of our knowledge, this is the first study assessing the distribution of MMSE scores among adults of all ages in an MA population. Prior studies have estimated normative scores for various neurocognitive tests among MA adults using data from other US Hispanic cohorts, but the reported norms have pertained primarily to older MA adults (e.g., 65 years and older) [3, 14, 57, 58]. Relatedly, MMSE norms for younger and middle-aged MA adults, particularly those ≤40 years old, are scarce. Our findings show that, among MA adults in Cameron County, the mean MMSE score is 27.6 (SD 2.8) for adults 18–64 years old and 25 (SD 4.9) for adults ≥65 years old, with an aggregate mean of 27.3 (SD 3.2) for all adults.
In their seminal 1993 study of MMSE scores among 18,571 community-dwelling US adults ≥18 years old, Crum and colleagues reported a median MMSE score of 29 (IQR, 27–30), one point higher than that of our study sample [50]. Similar to the Crum study, the variability of MMSE scores in our cohort increased with age but decreased with years of education (see Fig. 2).
Factors affecting MMSE performance
Similar to prior studies, education was strongly associated with MMSE scores in our sample [3, 14, 50]. MA adults in our sample completed less education than the general US population, with 68.8% of our study sample completing 9 or more YOE, compared to 78% of the general US population [50]. The percentage of participants who completed ≥9 YOE was 72.7% in the 18-to-64-year-old subgroup but only 37.1% in the 65-or-older subgroup, indicating a generational difference in educational attainment. Furthermore, a plurality (32.8%) of subjects in the ≥65 subgroup had only 0–4 YOE. For the overall study sample, the increases in average MMSE score associated with successive YOE levels (0–4, 5–8, 9–12, ≥13) were 3.9, 1.1, and 1.8 points, respectively (Table 2). Findings in the general US population are similar, with average increases of 4, 2, and 1 MMSE points across successive YOE levels [50]. The importance of education in MMSE performance is underscored by the results of the RF models, in which education had the greatest feature importance in the models for the study sample and the two subgroups. Given the significant impact of education on MMSE performance, several studies have suggested education-based adjustments of MMSE scores.
Income was also an important factor associated with MMSE scores, particularly among older adults. Our study sample’s median annual household income per capita was 4,400 (IQR 2,400–8,400) US dollars; the median annual household income without per-capita adjustment was 15,600 (IQR 9,600–30,000) US dollars. The annual household income of nearly 75% of our sample fell below the US federal poverty level [59]. Income had high feature importance across all three RF models; however, the extent to which income affects MMSE performance through collinear variables such as occupational skill level or years of education requires further investigation, as both of these variables had high relative feature importance in the three RF models and are likely associated with access to healthcare.
Many chronic modifiable illnesses (e.g., diabetes, hypertension) are associated with long-term cognitive health and are therefore likely related to performance on the MMSE, as seen in our random forest results [60]. These associations are particularly concerning for our study population given the high rates of undiagnosed or uncontrolled cardiometabolic diseases. For example, the rates of undiagnosed or uncontrolled diabetes in our study sample were 9.1% and 13.5%, respectively, significantly higher than the rate of undiagnosed diabetes of 3.4% among all US adults [61]. Furthermore, 51.1% of the sample had a BMI ≥30 and 93.5% had a waist-to-height ratio above 0.5, indicating obesity; in contrast, an estimated 42.4% of the general US population have a BMI ≥30 [62]. Studies have shown that patients with higher levels of cardiorespiratory fitness have lower incidence of dementia and dementia-related mortality [63, 64]. Therefore, this sample’s high rate of undiagnosed or inadequately treated chronic illnesses highlights areas of unmet need— and thus opportunity— for improving long-term cognitive health in this population.
Similarly, symptoms of anxiety and depression were also associated with MMSE scores in this sample. The SAS and CES-D, screening tests for anxiety and depressive symptoms respectively, both had high feature importance across all three RF models, with CES-D scores showing particular importance for the 65-and-older subgroup. The proportion of participants with positive screens for generalized anxiety (SAS ≥36) and/or depression (CES-D ≥20) was similar for the young-to-middle-aged subgroup and the older subgroup, with approximately 60% screening positive for generalized anxiety and 20% for depression. Anxiety and depression disorders are associated with impairment in numerous cognitive domains, including several of those tested by the MMSE (e.g., attention and short-term memory) [65, 66]. The relevance of psychiatric symptoms on MMSE performance among older adults was highlighted by a European study of adults >65 years old in which participants who were mildly depressed (CES-D<9) had a mean MMSE score of 24.8; in contrast, those with moderate depression (CES-D between 19–25, inclusive) had a mean MMSE score of 22.3, and those with severe depression (CES-D>26) had a mean MMSE score of 19.6 [67].
Impact of minimum MMSE requirements on access to phase III prodromal-to-mild AD trials
Clinical trials for AD are critical for reliably assessing the safety and efficacy of new investigational products; these trials also provide participants with the possibility of accessing investigational products that may provide greater benefit than the current FDA-approved therapies. Moreover, when an intervention receives FDA approval, the study populations of the clinical trials justifying the approval are crucial in determining the specific indication(s) of the therapy and the subsequent prescribing patterns of physicians. For example, if the clinical trials for a recently approved therapy for prodromal-to-mild AD only enrolled participants with MMSE scores above a certain threshold, physicians may be less likely to recommend this new therapy to a patient who is diagnosed with prodromal or mild AD but whose MMSE falls below that threshold. This would be prudent behavior, as considering the study population(s) used in the clinical trials underlying an FDA approval helps to ensure that the use of a new therapy is consistent with the evidence for its safety and efficacy. Therefore, ensuring equitable production of evidence and access to new therapies requires that clinical trial eligibility criteria do not unjustifiably preclude any populations from participation [68].
Most AD clinical trials exclude individuals with a baseline MMSE score outside of a particular range [51, 69]. Of the 19 phase III trials for prodromal-to-mild AD evaluated here, 17 used MMSE score as an eligibility criterion and none made score adjustments for patient attributes (e.g., years of education). Among 50-to-85-year-old (i.e., trial-aged) individuals in our sample (n = 1,267) with 0–4 YOE (n = 230), 54.3% had an MMSE below 24 and 22.6% had an MMSE below 20 (Table 3). Importantly, the CCHC’s scoring methodology for the attention component of the MMSE involved administering both the “serial 7’s” task and the “backwards spelling” (“WORLD” or “MUNDO”) task and using the higher of the two scores when calculating each testee’s total MMSE score (Supplementary Form 1). A study of older Hispanic adults in the US with and without cognitive impairment found that “MMSE scores were higher by an average of 1.5 points when using the ‘backwards spelling’ task,” regardless of cognitive impairment [16]. Therefore, the MMSE scoring methodology used in the CCHC likely resulted in a score distribution that is higher (i.e., closer to 30) than if only the serial 7’s task were used, which is the scoring methodology used in some AD clinical trials. Despite this bias towards higher scores in the CCHC, over 20% of individuals in the CCHC with the fewest years of education would be excluded from trial participation upon application of the lowest MMSE cutoff score used by the prodromal-to-mild AD trials (MMSE ≥20).
The rationale for incorporating a minimum MMSE score in the eligibility criteria of trials for prodromal-to-mild AD is, ostensibly, as a tool for exclusion of individuals with moderate-to-severe dementia. The estimated prevalence of all-cause dementia in the population of US Hispanic adults ≥65 years old in 2012 was 16.7% [70]. Since this estimate includes all dementia types and severities, and because dementia prevalence is negligible prior to the age of 65 but continually increases thereafter [49, 71, 72], the prevalence of moderate-to-severe AD in the trial-aged US Hispanic population is likely lower than 16.7%. Therefore, although not impossible, it is unlikely that the percentage of our sample’s trial-aged participants with 0–4 YOE with moderate-to-severe dementia is 22.6% or 54.3%, which are the proportion with MMSE scores below 20 or 24, respectively (Table 3). Applying the minimum MMSE cutoffs from past prodromal-to-mild AD trials to our cohort would likely have the undesirable effect of excluding individuals with even mild or prodromal dementia, particularly among those with fewer YOE [51, 73].
Two avenues for improving the MMSE’s ability to accurately assess cognitive health among patients with fewer YOE may be to adjust MMSE scores by level of education or to replace the MMSE with other psychometric tests that are less influenced by education and culture [12–15, 18, 51, 73–75]. Regardless of the chosen approach, continued efforts must be taken to ensure that the chosen method and the other eligibility criteria used in future AD trials do not result in biased exclusion of individuals from historically underrepresented and under-prioritized backgrounds [51, 68, 76, 77]. Attempts to address issues with the MMSE may be moot if other common but problematic criteria remain, including the use of education requirements [51]. The inclusion of historically underrepresented patient populations in dementia research is rightfully becoming a greater federal priority, as evidenced by the CMS requirement that post-marketing studies of anti-amyloid monoclonal antibodies have “a study population whose diversity of patients are representative of the national population with MCI due to AD or mild AD dementia” as part of the “evidence development” criteria for Medicare coverage [78]. As part of this initiative to achieve truly representative study populations, trial sponsors should consider implementing education-based MMSE cutoff adjustments or replacing the MMSE with other psychometric tests that are less influenced by education.
Strengths and limitations
A primary strength of the CCHC, especially in the context of a cross-sectional study seeking to describe MMSE population norms, is its sampling and recruitment methodology. Census-based, two-stage cluster sampling with door-to-door canvassing of every household, invitation of all adult household members, and the option to conduct visits at a research center or at participants’ own homes increases the likelihood that the CCHC accurately represents the non-institutionalized adult population in Cameron County. This type of population-based cohort data is critical for an unbiased estimation of population parameters [79]. However, a related limitation is the decision to sample only from the first- and third-highest median income quartiles. Although this approach improved the feasibility of subsequent random sampling among the clusters (i.e., census blocks), the generalizability of our results to the unsampled income strata remains unknown.
One challenge of using the CCHC to study the neurocognitive health of this population is the cohort’s primary, albeit not exclusive, focus on cardiometabolic health factors. Data for the MMSE and several factors related to neurocognitive health have been collected in the CCHC, but the cohort was not specifically designed to address issues of neurocognitive health and thus lacks some important measures such as history of traumatic brain injury, APOE genotype, ability to perform activities of daily living, medical history of dementia or MCI, or clinical evaluation by a physician with expertise in neurocognition (e.g., a behavioral neurologist). Collection of these additional measures would enable future studies to better elucidate the complex effects of dementia and other important factors (e.g., years of education) on MMSE performance in this MA population [12].
Furthermore, as with all datasets that include survey responses, many of the variables used in this study (e.g., exercise habits, annual income, medical history) rely on patients’ self-report and are thus susceptible to response bias.
Finally, RF methods have many desirable characteristics, including the ability to handle data with many non-influential predictors and complex high-order interactions. Feature importance estimates, however, can be biased in the setting of highly correlated predictors. An additional consideration is the possibility of bias in RF estimates due to unmeasured cluster-level confounding. In light of these concerns, caution is warranted when interpreting the feature importance estimates found in this study, which were computed as part of an initial information-gathering scheme to identify potentially relevant variables that can be further explored in future studies. Prudence is particularly important when interpreting the results of the 65-and-older subgroup given this subgroup’s relatively small sample size.
Conclusions and future directions
This cohort of MA adults living in Texas near the US-Mexico border provides an invaluable resource for estimating this population’s distribution of MMSE scores across all stages of adulthood. Education and age were the most important predictors of an individual’s MMSE score. Concerningly, application of the two most common minimum MMSE scores required by prodromal-to-mild AD trials would exclude 22.6% to 54.3% of this cohort’s trial-aged adults with 0–4 years of education. Investigators and pharmaceutical companies that conduct AD clinical trials should therefore consider the substantial influence of education and other demographic factors on MMSE performance when deciding whether to include this instrument in eligibility determinations. Future studies of the CCHC should include trajectory analyses of this cohort’s longitudinal neurocognitive measurements, which would advance our understanding of the timing and risk factors associated with neurocognitive decline in this important population.
ACKNOWLEDGMENTS
The authors would like to thank the following CCHC teams and key personnel: the clinical research team, led by Rocío Uribe, who recruited and interviewed the participants; the laboratory team, led by Marcela Morris; the data support team, led by Hugo Soriano; and Norma Pérez-Olazarán and Christina Villarreal for administrative support. We also thank the Valley Baptist Medical Center in Brownsville, Texas for providing clinical space for conducting the CCHC. We finally thank the community of Brownsville and the many individuals who so willingly participated in this study.
FUNDING
This study was funded in part by Center for Clinical and Translational Sciences, National Institutes of Health Clinical and Translational Award grant no. UL1 TR000371 from the National Center for Advancing Translational Sciences.
CONFLICT OF INTEREST
Paul E. Schulz is funded by the McCord Family Professorship in Neurology, the Umphrey Family Professorship in Neurodegenerative Disorders, multiple NIH grants, several foundation grants, and contracts with multiple pharmaceutical companies related to the performance of clinical trials. He serves as a consultant and speaker for Eli Lilly, Biogen, and Acadia Pharmaceuticals. Avram S. Bukhbinder is an Editorial Board Member of this journal but was not involved in the peer-review process nor had access to any information regarding its peer-review. All other authors have no conflict of interest to report.
DATA AVAILABILITY
Due to ethical restrictions, the data are available upon request from the CCHC principal investigators (SFH and JBM) for researchers who meet the criteria for access to confidential data. Access can be arranged by contacting E-mail: or E-mail: .
SUPPLEMENTARY MATERIAL
[1] The supplementary material is available in the electronic version of this article: https://dx.doi.org/10.3233/JAD-220934.
REFERENCES
[1] | Noe-Bustamante L , Flores A , Shah S ((2019) ) Facts on Hispanics of Mexican Origin in the United States, 2017, Pew Research Center, https://www.pewresearch.org/hispanic/fact-sheet/u-s-hispanics-facts-on-mexican-origin-latinos/. |
[2] | Clark CM , DeCarli C , Mungas D , Chui HI , Higdon R , Nunez J , Fernandez H , Negron M , Manly J , Ferris S , Perez A , Torres M , Ewbank D , Glosser G , van Belle G ((2005) ) Earlier onset of Alzheimer disease symptoms in latino individuals compared with anglo individuals. Arch Neurol 62: , 774–778. |
[3] | O’Bryant SE , Edwards M , Johnson L , Hall J , Gamboa A , O’Jile J ((2018) ) Texas Mexican American adult normative studies: Normative data for commonly used clinical neuropsychological measures for English- and Spanish-speakers. Dev Neuropsychol 43: , 1–26. |
[4] | O’Bryant SE , Johnson L , Balldin V , Edwards M , Barber R , Williams B , Devous M , Cushings B , Knebl J , Hall J ((2013) ) Characterization of Mexican Americans with mild cognitive impairment and Alzheimer’s disease. J Alzheimers Dis 33: , 373–379. |
[5] | Fitten LJ , Ortiz F , Fairbanks L , Bartzokis G , Lu P , Klein E , Coppola G , Ringman J ((2014) ) Younger age of dementia diagnosis in a Hispanic population in southern California. Int J Geriatr Psychiatry 29: , 586–593. |
[6] | Umpierrez GE , Gonzalez A , Umpierrez D , Pimentel D ((2007) ) Diabetes mellitus in the Hispanic/Latino population: An increasing health care challenge in the United States. Am J Med Sci 334: , 274–282. |
[7] | Fisher-Hoch SP , Rentfro AR , Salinas JJ , Pérez A , Brown HS , Reininger BM , Restrepo BI , Wilson JG , Hossain MM , Rahbar MH , Hanis CM , McCormick JB ((2010) ) Socioeconomic status and prevalence of obesity and diabetes in a Mexican American community, Cameron County, Texas, 2004-2007. Prev Chronic Dis 7: , A53. |
[8] | Cameron County Hispanic Cohort, UTHealth School of Public Health, https://sph.uth.edu/research/centers/hispanic-health/#TID-8d39067e-3bc7-4ebe-8734-4ed463f94bf 1-2, Accessed August 12, 2022. |
[9] | American Community Survey 5-Year Estimates: DP05 | Demographic and Housing, U.S. Census Bureau, https://data.census.gov/cedsci/table?g=0500000US48061&tid=ACSDP5Y2020.DP05&moe=true, Accessed August 12, 2022. |
[10] | Glossary, U.S. Census Bureau, https://www.census.gov/programs-surveys/geography/about/glossary.html, April 11, 2022, Accessed August 20, 2022. |
[11] | Decennial Census: DP3 | Profile of Selected Economic Characteristics, U.S. Census Bureau, https://data.census.gov/cedsci/table?t=Income%20%28Households,%20Families,% 20Individuals%29&g=0500000US48061,48061%241400000&y=2000&tid=DECENNIALDPSF32000.DP3, Accessed August 12, 2022. |
[12] | Burke SL , Grudzien A , Burgess A , Rodriguez MJ , Rivera Y , Loewenstein D ((2021) ) The utility of cognitive screeners in the detection of dementia spectrum disorders in Spanish-speaking populations. J Geriatr Psychiatry Neurol 34: , 102–118. |
[13] | Mulgrew C , Morgenstern N , Shetterly S , Baxter J , Baron A , Hamman R ((1999) ) Cognitive functioning and impairment among rural elderly Hispanics and non-Hispanic whites as assessed by the Mini-Mental State Examination. J Gerontol B Psychol Sci Soc Sci 54: , 223–230. |
[14] | Matallana D , de Santacruz C , Cano C , Reyes P , Samper-Ternent R , Markides KS , Ottenbacher KJ , Reyes-Ortiz CA ((2011) ) The relationship between education level and mini-mental state examination domains among older Mexican Americans. J Geriatr Psychiatry Neurol 24: , 9–18. |
[15] | Mungas D , Marshall SC , Weldon M , Haan M , Reed BR ((1996) ) Age and education correction of Mini-Mental State Examination for English and Spanish-speaking elderly. Neurology 46: , 700–706. |
[16] | Rosselli M , Tappen R , Williams C , Salvatierra J ((2006) ) The relation of education and gender on the attention items of the Mini-Mental State Examination in Spanish speaking Hispanic elders. Arch Clin Neuropsychol 21: , 677–686. |
[17] | Zhang XX , Tian Y , Wang ZT , Ma YH , Tan L , Yu JT ((2021) ) The epidemiology of Alzheimer’s disease modifiable risk factors and prevention. J Prev Alzheimers Dis 8: , 313–321. |
[18] | Ramirez Gomez L , Jain FA , D’Orazio LM ((2017) ) Assessment of the Hispanic cognitively impaired elderly patient. Neurol Clin 35: , 207–229. |
[19] | Sharp ES , Gatz M ((2011) ) Relationship between education and dementia: An updated systematic review. Alzheimer Dis Assoc Disord 25: , 289–304. |
[20] | Livingston G , Huntley J , Sommerlad A , Ames D , Ballard C , Banerjee S , Brayne C , Burns A , Cohen-Mansfield J , Cooper C , Costafreda SG , Dias A , Fox N , Gitlin LN , Howard R , Kales HC , Kivimaki M , Larson EB , Ogunniyi A , Orgeta V , Ritchie K , Rockwood K , Sampson EL , Samus Q , Schneider LS , Selbaek G , Teri L , Mukadam N ((2020) ) Dementia prevention, intervention, and care: 2020 report of the Lancet Commission. Lancet 396: , 413–446. |
[21] | Patterson C , Feightner J , Garcia A , MacKnight C ((2007) ) General risk factors for dementia: A systematic evidence review. Alzheimers Dement 3: , 341–347. |
[22] | Qiu C , Kivipelto M , von Strauss E ((2009) ) Epidemiology of Alzheimer’s disease: Occurrence, determinants, and strategies toward intervention. Dialogues Clin Neurosci 11: , 111–128. |
[23] | Hersi M , Irvine B , Gupta P , Gomes J , Birkett N , Krewski D ((2017) ) Risk factors associated with the onset and progression of Alzheimer’s disease: A systematic review of the evidence. Neurotoxicology 61: , 143–187. |
[24] | Killin LO , Starr JM , Shiue IJ , Russ TC ((2016) ) Environmental risk factors for dementia: A systematic review. BMC Geriatr 16: , 175. |
[25] | Vila-Castelar C , Fox-Fuller JT , Guzman-Velez E , Schoemaker D , Quiroz YT ((2022) ) A cultural approach to dementia - insights from US Latino and other minoritized groups. Nat Rev Neurol 18: , 307–314. |
[26] | Milman LH , Faroqi-Shah Y , Corcoran CD , Damele DM ((2018) ) Interpreting Mini-Mental State Examination performance in highly proficient bilingual Spanish-English and Asian Indian-English speakers: Demographic adjustments, item analyses, and supplemental measures. J Speech Lang Hear Res 61: , 847–856. |
[27] | Kuiper JS , Zuidersma M , Oude Voshaar RC , Zuidema SU , van den Heuvel ER , Stolk RP , Smidt N ((2015) ) Social relationships and risk of dementia: A systematic review and meta-analysis of longitudinal cohort studies. Ageing Res Rev 22: , 39–57. |
[28] | Salinas J , Beiser A , Himali JJ , Satizabal CL , Aparicio HJ , Weinstein G , Mateen FJ , Berkman LF , Rosand J , Seshadri S ((2017) ) Associations between social relationship measures, serum brain-derived neurotrophic factor, and risk of stroke and dementia. Alzheimers Dement (N Y) 3: , 229–237. |
[29] | Donovan NJ , Wu Q , Rentz DM , Sperling RA , Marshall GA , Glymour MM ((2017) ) Loneliness, depression and cognitive function in older U.S. adults. Int J Geriatr Psychiatry 32: , 564–573. |
[30] | Serrano-Pozo A , Growdon JH ((2019) ) Is Alzheimer’s disease risk modifiable? J Alzheimers Dis 67: , 795–819. |
[31] | Tran D , Baxter J , Hamman RF , Grigsby J ((2014) ) Impairment of executive cognitive control in type 2 diabetes, and its effects on health-related behavior and use of health services. J Behav Med 37: , 414–422. |
[32] | McGrath ER , Beiser AS , DeCarli C , Plourde KL , Vasan RS , Greenberg SM , Seshadri S ((2017) ) Blood pressure from mid- to late life and risk of incident dementia. Neurology 89: , 2447–2454. |
[33] | Lamar M , Durazo-Arvizu RA , Rodriguez CJ , Kaplan RC , Perera MJ , Cai J , Espinoza Giacinto RA , Gonzalez HM , Daviglus ML ((2020) ) Associations of lipid levels and cognition: Findings from the Hispanic Community Health Study/Study of Latinos. J Int Neuropsychol Soc 26: , 251–262. |
[34] | Xu H , Garcia-Ptacek S , Trevisan M , Evans M , Lindholm B , Eriksdotter M , Carrero JJ ((2021) ) Kidney function, kidney function decline, and the risk of dementia in older adults: A registry-based study. Neurology 96: , e2956–e2965. |
[35] | Bugnicourt JM , Godefroy O , Chillon JM , Choukroun G , Massy ZA ((2013) ) Cognitive disorders and dementia in CKD: The neglected kidney-brain axis. J Am Soc Nephrol 24: , 353–363. |
[36] | Kuzma E , Lourida I , Moore SF , Levine DA , Ukoumunne OC , Llewellyn DJ ((2018) ) Stroke and dementia risk: A systematic review and meta-analysis. Alzheimers Dement 14: , 1416–1426. |
[37] | Johnson LA , Edwards M , Gamboa A , Hall J , Robinson M , O’Bryant SE ((2017) ) Depression, inflammation, and memory loss among Mexican Americans: Analysis of the HABLE cohort. Int Psychogeriatr 29: , 1693–1699. |
[38] | Bukhbinder AS , Ling Y , Hasan O , Jiang X , Kim Y , Phelps KN , Schmandt RE , Amran A , Coburn R , Ramesh S , Xiao Q , Schulz PE ((2022) ) Risk of Alzheimer’s disease following influenza vaccination: A claims-based cohort study using propensity score matching. J Alzheimers Dis 88: , 1061–1074. |
[39] | Chatterjee S , Mudher A ((2018) ) Alzheimer’s disease and type 2 diabetes: A critical assessment of the shared pathological traits. Front Neurosci 12: , 383. |
[40] | Akter K , Lanza EA , Martin SA , Myronyuk N , Rua M , Raffa RB ((2011) ) Diabetes mellitus and Alzheimer’s disease: Shared pathology and treatment? Br J Clin Pharmacol 71: , 365–376. |
[41] | Kehoe PG ((2009) ) Angiotensins and Alzheimer’s disease: A bench to bedside overview. Alzheimers Res Ther 1: , 3. |
[42] | McCubbin JA , Peach H , Moore DD , Pilcher JJ ((2012) ) Decreased cognitive/CNS function in young adults at risk for hypertension: Effects of sleep deprivation. Int J Hypertens 2012: , 989345. |
[43] | Nilsson P , Gullberg G , Ekesbo R , Von Schenck H , Gustafson L ((1998) ) No impaired cognitive function in treated patients with mild-moderate hypertension compared to normotensive controls. Blood Press 7: , 209–213. |
[44] | Goetz ME , Marcus M , Vaccarino V , Goldstein F , Levey A , Lah J ((2017) ) Abstract P019: Family history of cardiovascular disease is associated with cognitive function: The Emory Healthy Aging Study. Circulation 135: , AP019. |
[45] | Guyomard V , Metcalf AK , Naguib MF , Fulcher RA , Potter JF , Myint PK ((2011) ) Transient ischaemic attack, vascular risk factors and cognitive impairment: A case-controlled study. Age Ageing 40: , 641–644. |
[46] | Meyer JS , Terayama Y , Konno S , Akiyama H , Margishvili GM , Mortel KF ((1998) ) Risk factors for cerebral degenerative changes and dementia. Eur Neurol 39: (Suppl 1), 7–16. |
[47] | McGuire MJ , Ishii M ((2016) ) Leptin dysfunction and Alzheimer’s disease: Evidence from cellular, animal, and human studies. Cell Mol Neurobiol 36: , 203–217. |
[48] | Mooldijk SS , Ikram MK , Ikram MA ((2022) ) Adiponectin, leptin, and resistin and the risk of dementia. J Gerontol A Biol Sci Med Sci 77: , 1245–1249. |
[49] | ((2021) ) 2021 Alzheimer’s disease facts and figures. Alzheimers Dement 17: , 327–406. |
[50] | Crum RM , Anthony JC , Bassett SS , Folstein MF ((1993) ) Population-based norms for the Mini-Mental State Examination by age and educational level. JAMA 269: , 2386–2391. |
[51] | Franzen S , Smith JE , van den Berg E , Rivera Mindt M , van Bruchem-Visser RL , Abner EL , Schneider LS , Prins ND , Babulal GM , Papma JM ((2022) ) Diversity in Alzheimer’s disease drug trials: The importance of eligibility criteria. Alzheimers Dement 18: , 810–823. |
[52] | Biau G , Scornet E ((2015) ) A random forest guided tour. TEST 25: , 197–227. |
[53] | Breiman L ((2001) ) Random forests. Machine Learn 45: , 5–32. |
[54] | Chen X , Wang M , Zhang H ((2011) ) The use of classification trees for bioinformatics. Wiley Interdiscip Rev Data Min Knowl Discov 1: , 55–63. |
[55] | Probst P , Wright MN , Boulesteix A-L ((2019) ) Hyperparameters and tuning strategies for random forest. WIREs Data Min Knowl Discov 9: , e1301. |
[56] | TreeBagger: Create bag of decision trees, The MathWorks Inc., https://www.mathworks.com/help/releases/R2021a/stats/treebagger.html, Accessed December 21, 2022. |
[57] | O’Bryant SE , Johnson LA , Barber RC , Braskie MN , Christian B , Hall JR , Hazra N , King K , Kothapalli D , Large S , Mason D , Matsiyevskiy E , McColl R , Nandy R , Palmer R , Petersen M , Philips N , Rissman RA , Shi Y , Toga AW , Vintimilla R , Vig R , Zhang F , Yaffe K , Team HS ((2021) ) The Health & Aging Brain among Latino Elders (HABLE) study methods and participant characteristics. Alzheimers Dement (Amst) 13: , e12202. |
[58] | Xu H , Zhang Y , Wu B ((2017) ) Association between migration and cognitive status among middle-aged and older adults: A systematic review. BMC Geriatr 17: , 184. |
[59] | Prior HHS Poverty Guidelines and Federal Register References, U.S. Department of Health and Human Services, https://aspe.hhs.gov/topics/poverty-economic-mobility/poverty-guidelines/prior-hhs-poverty-guidelines-federal-register-references. Accessed August 12, 2022. |
[60] | Dybjer E , Nilsson PM , Engstrom G , Helmer C , Nagga K ((2018) ) Pre-diabetes and diabetes are independently associated with adverse cognitive test results: A cross-sectional, population-based study. BMC Endocr Disord 18: , 91. |
[61] | Prevalence of Both Diagnosed and Undiagnosed Diabetes, Centers for Disease Control and Prevention, https://www.cdc.gov/diabetes/data/statistics-report/diagnosed-undiagnosed-diabetes.html, Accessed August 12, 2022. |
[62] | Fryar CD , Carroll MD , Affu J ((2020) ) Prevalence of overweight, obesity, and severe obesity among adults aged 20 and over: United States, 1960–1962 Through 2017–2018, National Center for Health Statistics, https://www.cdc.gov/nchs/data/hestat/obesity-adult-17-18/overweight-obesity-adults-H.pdf. |
[63] | Lee J ((2021) ) Influence of cardiorespiratory fitness on risk of dementia and dementia mortality: A systematic review and meta-analysis of prospective cohort studies. J Aging Phys Act 29: , 878–885. |
[64] | Liu R , Sui X , Laditka JN , Church TS , Colabianchi N , Hussey J , Blair SN ((2012) ) Cardiorespiratory fitness as a predictor of dementia mortality in men and women. Med Sci Sports Exerc 44: , 253–259. |
[65] | Ganguli M , Du Y , Dodge HH , Ratcliff GG , Chang CC ((2006) ) Depressive symptoms and cognitive decline in late life: A prospective epidemiological study. Arch Gen Psychiatry 63: , 153–160. |
[66] | Robinson OJ , Vytal K , Cornwell BR , Grillon C ((2013) ) The impact of anxiety upon cognition: Perspectives from human threat of shock studies. Front Hum Neurosci 7: , 203. |
[67] | Voros V , Martin Gutierrez D , Alvarez F , Boda-Jorg A , Kovacs A , Tenyi T , Fekete S , Osvath P ((2020) ) The impact of depressive mood and cognitive impairment on quality of life of the elderly. Psychogeriatrics 20: , 271–277. |
[68] | Raman R , Quiroz YT , Langford O , Choi J , Ritchie M , Baumgartner M , Rentz D , Aggarwal NT , Aisen P , Sperling R , Grill JD ((2021) ) Disparities by race and ethnicity among adults recruited for a preclinical Alzheimer disease trial. JAMA Netw Open 4: , e2114364. |
[69] | Chapman KR , Bing-Canar H , Alosco ML , Steinberg EG , Martin B , Chaisson C , Kowall N , Tripodis Y , Stern RA ((2016) ) Mini Mental State Examination and Logical Memory scores for entry into Alzheimer’s disease trials. Alzheimers Res Ther 8: , 9. |
[70] | Chen C , Zissimopoulos JM ((2018) ) Racial and ethnic differences in trends in dementia prevalence and risk factors in the United States. Alzheimers Dement (N Y) 4: , 510–520. |
[71] | Hudomiet P , Hurd MD , Rohwedder S ((2018) ) Dementia prevalence in the United States in 2000 and 2012: Estimates based on a nationally representative study. J Gerontol B Psychol Sci Soc Sci 73: , S10–S19. |
[72] | Matthews KA , Xu W , Gaglioti AH , Holt JB , Croft JB , Mack D , McGuire LC ((2019) ) Racial and ethnic estimates of Alzheimer’s disease and related dementias in the United States (2015-2060) in adults aged ≥5 years. Alzheimers Dement 15: , 17–24. |
[73] | Mejia S , Gutierrez LM , Villa AR , Ostrosky-Solis F ((2004) ) Cognition, functional status, education, and the diagnosis of dementia and mild cognitive impairment in Spanish-speaking elderly. Appl Neuropsychol 11: , 196–203. |
[74] | Santana I , Duro D , Lemos R , Costa V , Pereira M , Simoes MR , Freitas S ((2016) ) Mini-Mental State Examination: Screening and diagnosis of cognitive decline, using new normative data. Acta Med Port 29: , 240–248. |
[75] | Spering CC , Hobson V , Lucas JA , Menon CV , Hall JR , O’Bryant SE ((2012) ) Diagnostic accuracy of the MMSE in detecting probable and possible Alzheimer’s disease in ethnically diverse highly educated individuals: An analysis of the NACC database. J Gerontol A Biol Sci Med Sci 67: , 890–896. |
[76] | Manly JJ , Gilmore-Bykovskyi A , Deters KD ((2021) ) Inclusion of underrepresented groups in preclinical Alzheimer disease trials-opportunities abound. JAMA Netw Open 4: , e2114606. |
[77] | Ostrosky-Solis F , Lopez-Arango G , Ardila A ((2000) ) Sensitivity and specificity of the Mini-Mental State Examination in a Spanish-speaking population. Appl Neuropsychol 7: , 25–31. |
[78] | National Coverage Determination for Monoclonal Antibodies Directed Against Amyloid for the Treatment of Alzheimer’s Disease, Centers for Medicare & Medicaid Services, https://www.cms.gov/medicare-coverage-database/view/ncacal-decision-memo.aspx?proposed=N&NCAId=305, Accessed August 10, 2022. |
[79] | Szklo M ((1998) ) Population-based cohort studies. Epidemiol Rev 20: , 81–90. |


