
Temporal Dementia and Cognitive Impairment Trends in the Very Old in the 21st Century
Abstract
Background:
Long-increasing dementia incidence and prevalence trends may be shifting. Whether such shifts have reached the very old is unknown.
Objective:
To investigate temporal trends in the incidence of dementia and cognitive impairment and prevalence of dementia, cognitive impairment, Alzheimer’s disease, vascular dementia, and unclassified dementia among 85-, 90-, and ≥ 95-year-olds in Sweden during 2000–2017.
Methods:
This study was conducted with Umeå 85 + /Gerontological Regional Database data from 2182 85-, 90-, and ≥ 95-year-olds in Sweden collected in 2000–2017. Using logistic regression, trends in the cumulative 5-year incidences of dementia and cognitive impairment; prevalences of dementia, cognitive impairment, Alzheimer’s disease, and vascular dementia; and Mini-Mental State Examination thresholds for dementia diagnosis were estimated.
Results:
Dementia and cognitive impairment incidences decreased in younger groups, which generally showed more-positive temporal trends. The prevalences of overall dementia, cognitive impairment, and Alzheimer’s disease were stable or increasing; longer disease durations and increasing dementia subtype classification success may mask positive changes in incidences. Vascular dementia increased while unclassified dementia generally decreased.
Conclusion:
The cognitive health of the very old may be changing in the 21st century, possibly indicating a trend break.
INTRODUCTION
The incidence and prevalence of dementia have long been increasing. Recently, however, temporal trends in the incidence and prevalence of overall dementia and cognitive impairment may have shifted.
Multiple reviews and meta-analyses of 21st-century data have revealed decreases in the incidence of dementia over time in Western and high-income countries [1–4]. A recent meta-analysis of ≥ 65-year-olds (mean 71–77 years) showed that this incidence had decreased by 13% per decade since 1998 [5]. Another meta-analysis showed a remarkable 80% decrease in the incidence of dementia with each 10-year increase in birth year in the last four decades among individuals aged 65–74 and 75–84 years, with a smaller (28%) decrease among individuals aged≥85 years [4]. Reasons for this trend break may include improvements in childhood conditions (e.g., nutrition), increased educational attainment, and reductions in cardiovascular risk [2, 6]. However, there seem to be regional differences in dementia incidence time trends, where the dementia incidence in non-Western or low- and middle-income countries may still be increasing [1, 2, 4].
In recent decades, the incidence of (mild) cognitive impairment has generally been stable [7, 8] or decreased [9–11]. Three studies of this incidence involved assessment at more than two timepoints; one showed a decreasing incidence of cognitive impairment [Mini-Mental State Examination (MMSE) score < 18] among≥60-year-olds (≥80 years: 77%) in China during 1998–2014 [9], and the other two showed stable trends of the incidence of mild cognitive impairment during 2015–2019 among≥65-year-olds in Germany [7] and during 1993–2016 among≥70-year-olds in the US, with no difference among birth cohorts over the range 1899–1946 [8].
The prevalence of dementia has remained stable over 50 years globally, except in India, as reported in a meta-analysis published in 2017 [12]. Reviews have also revealed a predominantly stable or declining dementia prevalence in recent decades [1–3].
Reports on recent temporal trends in the prevalence of cognitive impairment have been inconsistent, with data indicating declines [13–18], stability, and increases [7, 19–21]. Of five studies in which assessments were conducted at more than two timepoints, three revealed a decreasing prevalence during 1998–2010 among≥65-year-olds (≥85 years: 14%) in the US [16], 1998–2014 (and especially after 2008) among≥65-year-olds (≥80 years: 74%) in China [17], and among 60- and 81-year-olds 2001–2020 in Sweden [18]. Increasing prevalences were detected with data from general and specialist practices from 2015–2019 on≥65-year-olds in Germany [7] and data on≥50-year-olds (mean: 66.7 years) from 1996–2014 in the US [19], but only after controlling for practice effects in a manner that has since been criticized [22].
Reports on temporal trends in the prevalence of Alzheimer’s disease (AD) and vascular dementia (VaD) have also been mixed. A recent study of medical claims data from 1991–2017 on≥65-year-olds in the US revealed a non-linear trend in the prevalence of AD, with a peak in 2011 driven mainly by a decreasing incidence after about 2000 [23]. Prevalences were found to be stable for AD between 1994–1997 and 2010–2012 among≥65-year-olds (mean: 76.2 years) in the US [24] and for AD and VaD separately across pooled 5-year periods during 1990–2013 among≥65-year-olds in Korea, although the AD-to-VaD prevalence ratio doubled during this period [25]. Studies conducted with data from≥65-year-olds in Japan (1985–2012) and Taiwan (2004–2010) revealed an increasing prevalence of AD, and a stable VaD trend in the former case [26, 27].
Few studies have involved the investigation of age-specific temporal trends (with assessment at more than two timepoints) in the incidence of dementia in 21st-century populations aged≥85 years, and no study has involved the examination of the incidence of cognitive impairment or prevalence of dementia, AD, and VaD in such populations. This information is important for public health planning and health care policy making for this growing age group. We previously reported an increasing prevalence of dementia between 2000–2002 and 2005–2007 in Sweden, based on data from the two first cohorts of the population-based Umeå 85 + /Gerontological Regional Database (GERDA) study [28]. Here, we report temporal trends in the incidence of dementia and cognitive impairment and prevalence of dementia, cognitive impairment, AD, VaD, and unclassified dementia among 85-, 90-, and≥95-year-olds in Sweden during 2000–2017, based on data from four Umeå 85 + /GERDA cohorts.
METHODS
Data source
The Umeå 85 + /GERDA is maintained by Umeå University, Sweden, with the objectives of increasing knowledge about very old people’s living conditions and quality of life and providing data to support the planning of future elder care. For this study, cross-sectional and longitudinal Umeå 85 + /GERDA data were collected from four cohorts of 85-, 90-, and≥95-year-olds (2000–2002, 2005–2007, 2010–2012, and 2015–2017).
Participants and data collection
Residents of six municipalities (one predominantly urban and five rural) in northern Sweden were eligible to participate in the Umeå 85 + /GERDA study. Every other individual aged 85 years (as listed in population registers sampled from a randomized starting point) and all individuals aged 90 and≥95 years received written information about the study by mail and were subsequently contacted by telephone. Trained assessors visited consenting participants in their homes, including caring facilities, to collect data. Information was also collected from participants’ relatives and health care professionals as proxy respondents, and from medical records. Informed consent was obtained from all participants and, in cases of diagnosed or suspected cognitive impairment, from close relatives. Information on age and sex was obtained from population registers for all invited participants. The Umeå 85 + /GERDA study was approved by the Regional Ethical Review Board of Umeå (§99–326, §05–063M, §09–178M, and §2020-00275).
All Umeå 85 + /GERDA study participants who agreed to data collection were included in the present study, forming the full sample. Individuals included in multiple cohorts were included as unique cases for each cohort. One subsample of visited individuals and one of individuals followed for≥5 years were also examined; in cases of≥10 years follow-up, the first 5-year interval was used.
Data and diagnoses
Information on participants’ education, diagnoses, medical conditions, and drug prescriptions was collected during interviews and from medical records in regular care (inpatient and outpatient). Hearing and vision impairment was defined as the inability to hear a conversation at normal speaking volume and distance with or without participants’ hearing aids, and the inability to read large (5-mm-height) text at a normal distance with or without participants’ glasses, respectively. The MMSE was administered to assess cognitive function on a scale of 0–30, with higher scores indicating better function [29]. MMSE < 24 and < 18 were used to define different degrees of cognitive impairment, irrespective of dementia diagnosis.
An experienced specialist in geriatric medicine evaluated individuals in all cohorts and diagnosed dementia, AD, VaD, and unclassified dementia (unspecified and other subtypes) according to the criteria of the Diagnostic and Statistical Manual of Mental Disorders, Fourth Edition, Text Revision [30], using all available data, including medical records, prescriptions, educational level, and assessments performed as part of the study (MMSE; 15-item Geriatric Depression Scale [31]; Philadelphia Geriatric Center Morale Scale [32]; Life Orientation Scale [33]; Barthel ADL index [34]; ADL-staircase, including instrumental and personal activities of daily living [35]; Organic Brain Syndrome Scale, which includes assessments of spacial orientation, ability to recognize close relatives and staff, and cognitive fluctuations [36]; and hearing and vision assessments). In cases where a dementia diagnosis was made previously, the diagnostic evaluation was reviewed in light of the additional collected data. In cases where a previously undiagnosed dementia was suspected, a diagnosis was interpreted using cognitive performance in conjunction with clinical progression, education, and any disability (hearing or vision disability, aphasia, or impairments in activities of daily living) or comorbidity (such as depression, delirium, or stroke) as found through medical records or the Umeå85 + /GERDA data collection. The same specialist performed the evaluations at all time points. In 2000–2002, a few individuals were referred to Umeå University Hospital, Umeå, Sweden for comprehensive clinical evaluations, to validate the diagnostic procedure. Dementia subtype classification, i.e., AD and VaD, were normally based on cerebrospinal fluid analysis or neuroradiology examinations in conjunction with clinical progression and comorbidities. Cases of mixed AD and VaD dementia were considered to have both AD and VaD, which were analyzed separately. Unclassified dementia was used when the necessary diagnostic workup was insufficient to guide a diagnosis of dementia subtype.
Statistical analysis
Logistic regression analyses were performed to determine the probability of dementias or cognitive impairment (MMSE < 24 or < 18) with increasing participation year. Models for dementia were adjusted for sex alone and sex and educational level (≥8 years versus < 8 years), respectively. Models including MMSE scores were adjusted for sex alone and sex, educational level (≥8 years versus < 8 years), and hearing and vision impairment, respectively. After the estimation of logistic regression parameters, sex- and education-adjusted MMSE thresholds for the even odds of a dementia diagnosis were calculated by solving the regression equation for ρ=0.5 and xsex = population mean.
Multiple logistic regression analyses adjusted for sex and sex and educational level, respectively, were conducted to determine the probability of the 5-year incidence of dementia or decline to MMSE score < 24 or < 18 with increasing participation year.
Sex-adjusted models for dementia were constructed with data from the full sample; all other models, including the fully adjusted dementia models and all models with MMSE, were constructed with data from visited participants. Complete-case analysis was employed. Details on the evaluation of model assumptions are provided in the Supplementary Material. Differences between groups with or without missing values were investigated using the χ2 and independent-samples t tests. All tests were two tailed and p < 0.05 was considered to be significant. IBM SPSS Statistics (ver. 24.0 for Windows; IBM Corporation, Armonk, NY, USA) was used for the statistical analyses.
RESULTS
Figure 1 shows the flow of study participation. The full sample comprised 2,182 participants, of whom 1,711 were visited. Table 1 shows the participants’ demographic and clinical data. Large improvements in educational attainment were observed, in particular regarding the proportion of participants with≤6 years education. Supplementary Table 1 shows proportions of dementia among persons with cognitive impairment.
Fig. 1
Flow chart of study participation. GERDA, Gerontological Regional Database.
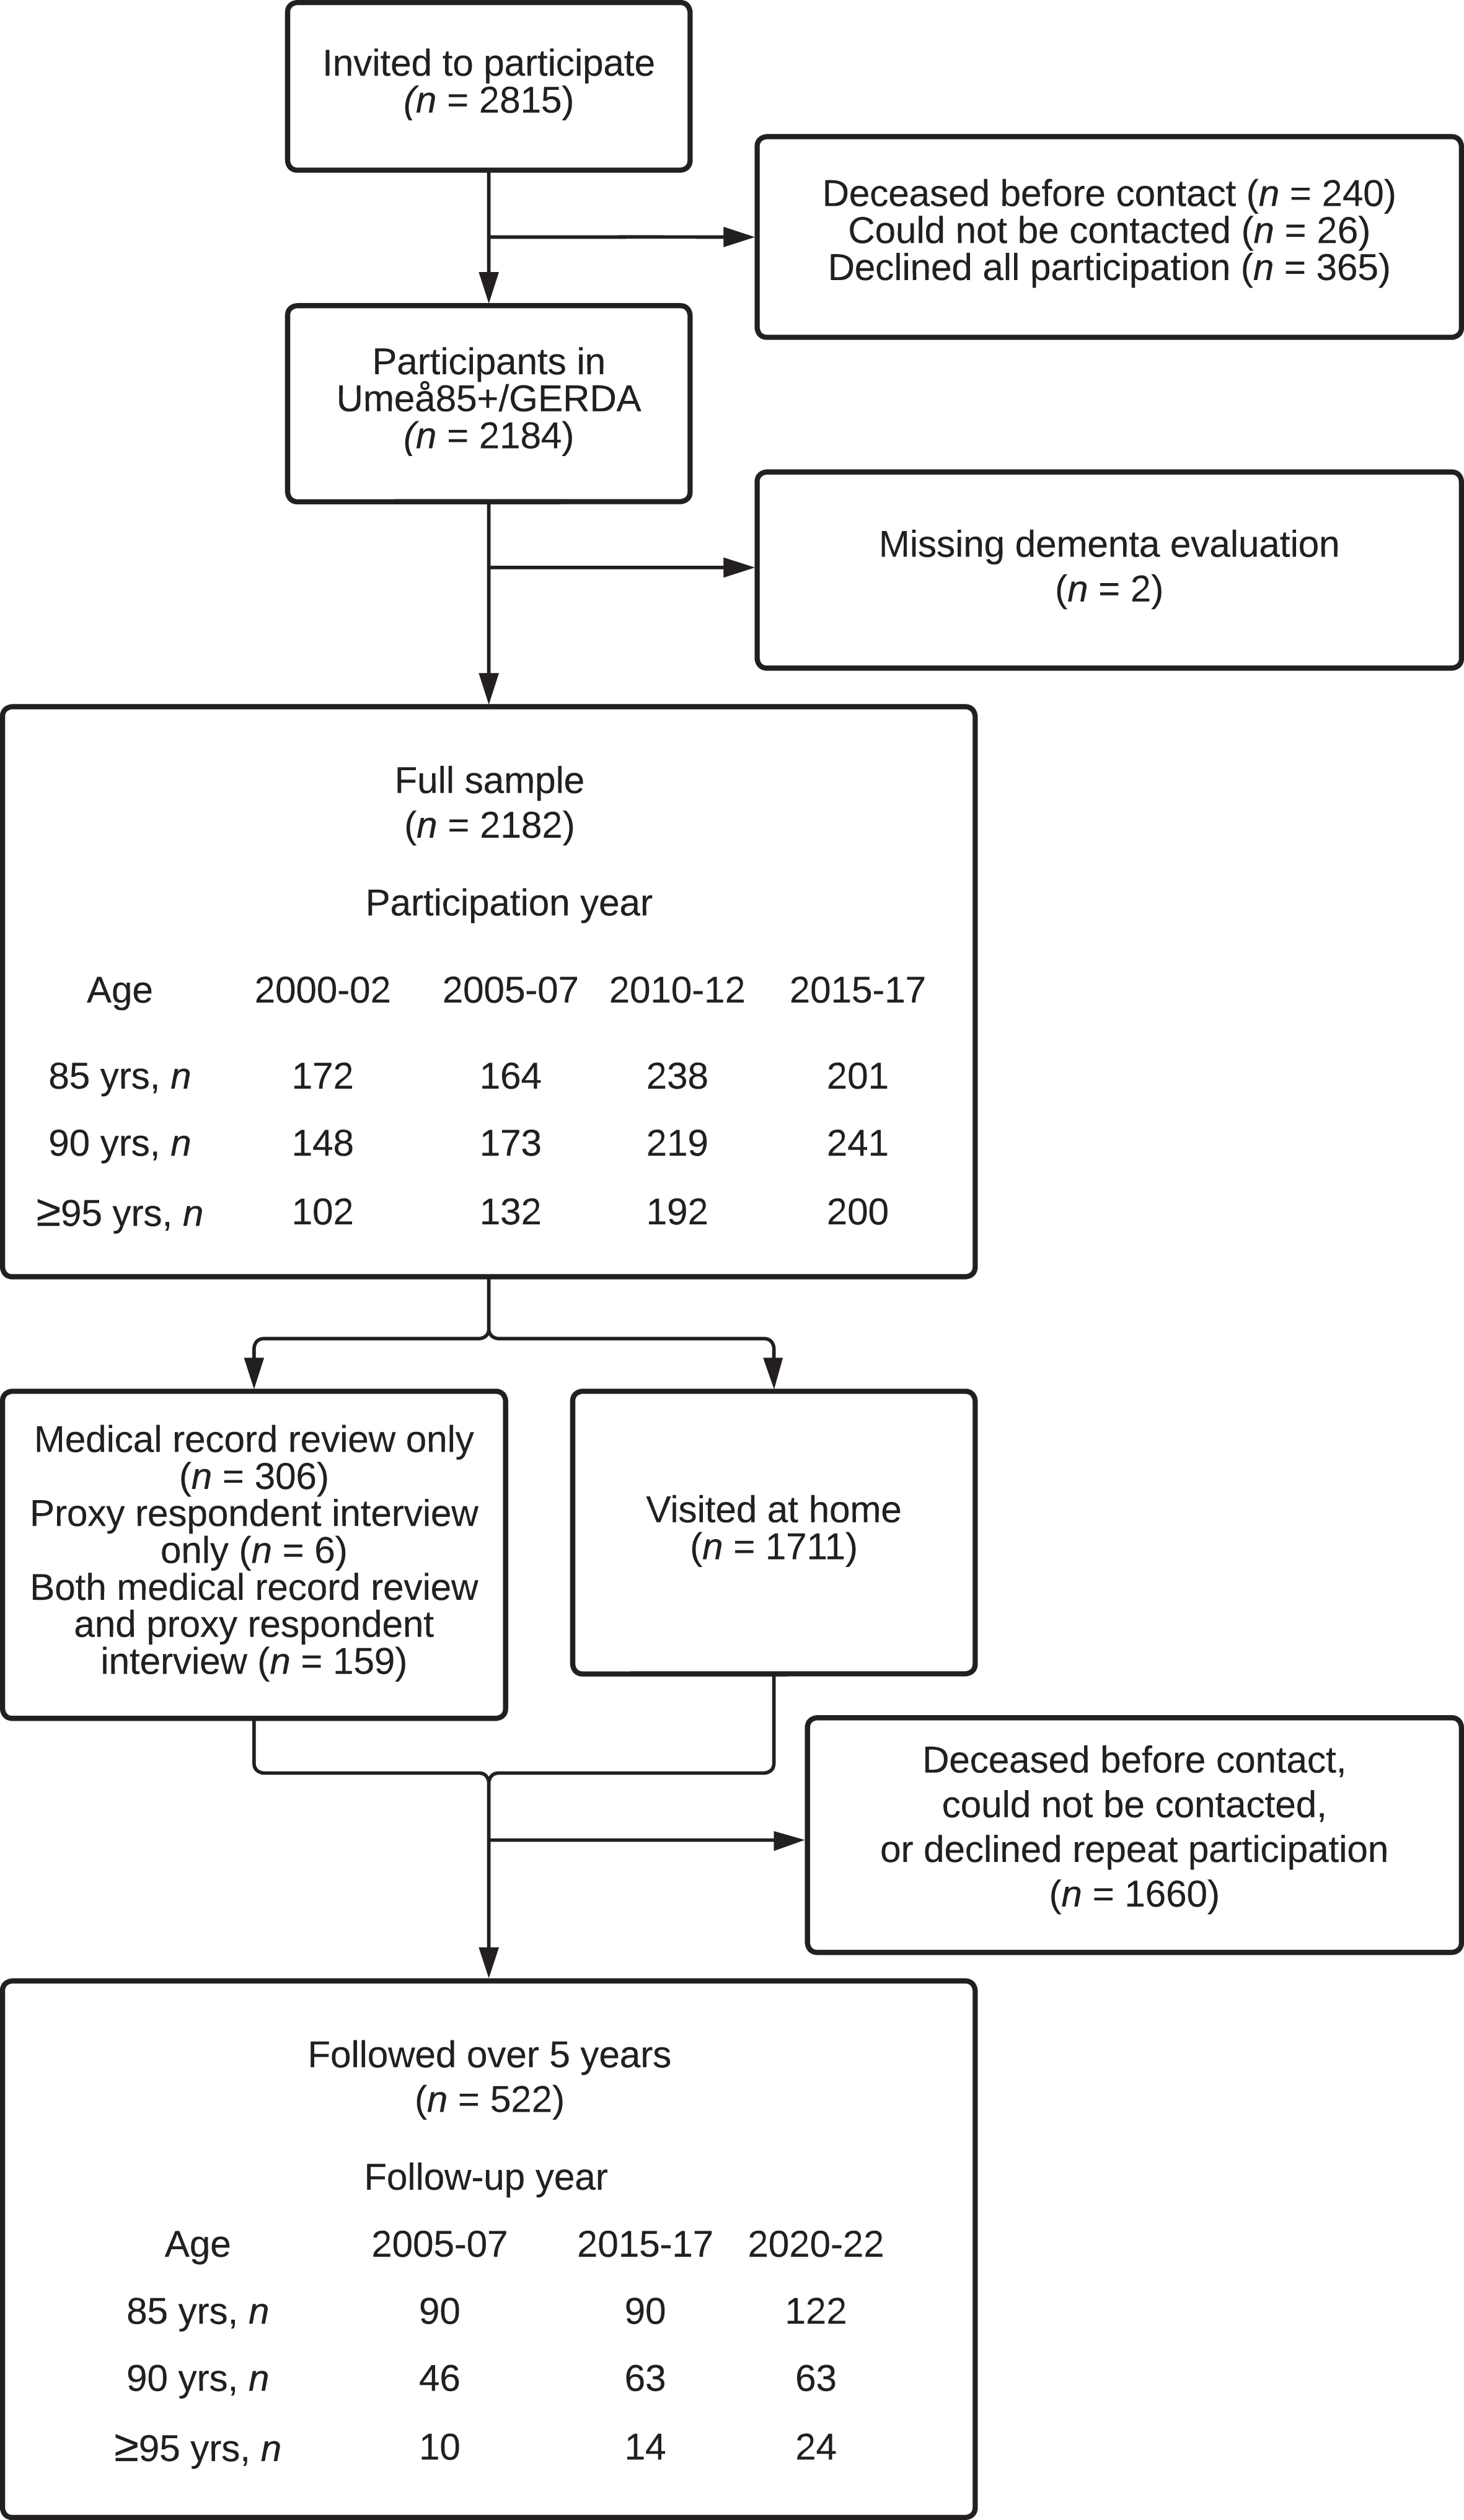
Table 1
Demographic and clinical data for the full sample
| Participation year/birth year | ||||
| 85 y | 2000–02/1915–17 | 2005–07/1920–22 | 2010–12/1925–27 | 2015–17/1930–32 |
| Participation, n (% of invited) | 172 (86.9) | 164 (77.7) | 238 (90.2) | 201 (75.3) |
| Women, n (%) | 119 (69.2) | 109 (66.5) | 145 (60.9) | 125 (62.2) |
| Education≥8 y, n (%) | 39 (27.1) | 24 (19.0) | 49 (30.8) | 78 (45.1) |
| Education 6–7 y, n (%) | 81 (56.3) | 95 (75.4) | 102 (64.2) | 93 (53.8) |
| Education < 6 y, n (%) | 24 (16.7) | 7 (5.6) | 8 (5.0) | 2 (1.2) |
| Vision impairment*, n (%) | 15 (10.6) | 13 (9.9) | 9 (5.6) | 7 (4.2) |
| Hearing impairment†, n (%) | 12 (8.4) | 8 (6.0) | 8 (4.9) | 18 (10.8) |
| Cholinesterase inhibitor use‡, n (%) | 4 (2.6) | 5 (3.0) | 16 (6.7) | 9 (4.5) |
| Memantine use‡, n (%) | N/A§ | 2 (1.2) | 2 (0.8) | 5 (2.5) |
| MMSE, median (IQR) | 26 (22–28) | 24 (20–27) | 25 (22–27) | 26 (24–28) |
| Barthel ADL index, median (IQR) | 20 (19–20) | 20 (17–20) | 20 (18–20) | 20 (18–20) |
| Hypertension, n (%) | 120 (70.2) | 107 (65.2) | 189 (79.4) | 155 (77.5) |
| Cerebrovascular disease, n (%) | 31 (18.1) | 39 (23.8) | 57 (23.9) | 33 (16.5) |
| Hip fracture, ever, n (%) | 23 (13.5) | 18 (11.0) | 34 (14.3) | 20 (10.0) |
| 90 y | 2000–02/1910–12 | 2005–07/1915–17 | 2010–12/1920–22 | 2015–17/1925–27 |
| Participation, n (%) | 148 (88.6) | 173 (83.2) | 219 (90.5) | 241 (81.7) |
| Women, n (%) | 100 (67.6) | 117 (67.6) | 149 (68.0) | 155 (64.3) |
| Education≥8 y, n (%) | 32 (24.1) | 36 (25.0) | 45 (26.9) | 66 (30.4) |
| Education 6–7 y, n (%) | 77 (57.9) | 86 (59.7) | 115 (68.9) | 147 (67.7) |
| Education < 6 y, n (%) | 24 (18.0) | 22 (15.3) | 7 (4.2) | 4 (1.8) |
| Vision impairment*, n (%) | 31 (23.8) | 29 (20.0) | 28 (19.2) | 19 (10.1) |
| Hearing impairment†, n (%) | 28 (20.7) | 28 (18.8) | 14 (9.3) | 36 (18.9) |
| Choline esterase inhibitor use‡, n (%) | 3 (2.2) | 14 (8.1) | 2 (0.9) | 4 (1.8) |
| Memantine use‡, n (%) | N/A§ | 0 (0.0) | 2 (0.9) | 2 (0.9) |
| MMSE, median (IQR) | 23 (19–27) | 22 (15–25) | 23 (17–27) | 23 (19–26) |
| Barthel ADL index, median (IQR) | 19 (14–20) | 19 (13–20) | 19 (15–20) | 19 (17–20) |
| Hypertension, n (%) | 75 (50.7) | 59 (34.1) | 59 (26.9) | 81 (33.8) |
| Cerebrovascular disease, n (%) | 32 (21.6) | 35 (20.2) | 67 (30.6) | 51 (21.3) |
| Hip fracture, ever, n (%) | 29 (19.6) | 29 (16.8) | 44 (20.1) | 33 (13.8) |
| ≥95 y | 2000–02/≤1905–07 | 2005–07/≤1910–12 | 2010–12/≤1915–17 | 2015–17/≤1920–22 |
| Participation, n (%) | 102 (87.9) | 132 (89.8) | 192 (87.3) | 200 (84.0) |
| Women, n (%) | 84 (82.4) | 102 (77.3) | 136 (70.8) | 157 (79.3) |
| Education≥8 y, n (%) | 15 (17.2) | 25 (23.1) | 27 (16.4) | 44 (24.3) |
| Education 6–7 y, n (%) | 55 (63.2) | 57 (52.8) | 126 (76.4) | 132 (72.9) |
| Education < 6 y, n (%) | 17 (19.5) | 26 (24.1) | 12 (7.3) | 5 (2.8) |
| Vision impairment*, n (%) | 38 (43.7) | 39 (37.1) | 39 (27.7) | 42 (27.1) |
| Hearing impairment†, n (%) | 37 (39.8) | 47 (42.3) | 44 (28.4) | 60 (37.0) |
| Choline esterase inhibitor use‡, n (%) | 1 (1.1) | 3 (2.3) | 6 (3.1) | 2 (1.0) |
| Memantine use‡, n (%) | N/A§ | 0 (0.0) | 0 (0.0) | 3 (1.5) |
| MMSE, median (IQR) | 20 (9–25) | 20 (13–23) | 19 (14–24) | 20 (15–24) |
| Barthel ADL index, median (IQR) | 13 (4–18) | 15 (9–19) | 16 (9–19) | 15 (8–18) |
| Hypertension, n (%) | 33 (32.4) | 65 (49.2) | 124 (64.6) | 109 (55.6) |
| Cerebrovascular disease, n (%) | 16 (15.7) | 31 (23.5) | 41 (21.4) | 45 (23.0) |
| Hip fracture, ever, n (%) | 30 (29.4) | 41 (31.1) | 54 (28.1) | 59 (29.9) |
Percentages are calculated as cell count/total count of included participants in each age group and participation year, if not otherwise stated. *Defined as inability to read large (5-mm) text at normal distance, with or without participants’ glasses. †Defined as inability to hear speech at normal volume and conversational distance, with or without participants’ hearing aids. ‡Only regular prescriptions are included. §Not available on the Swedish market. N/A, not available; MMSE, Mini-Mental State Examination; IQR, interquartile range; ADL, activities of daily living.
All models showed adequate goodness-of-fit and the absence of non-linearity, unless stated otherwise. Table 2 and Fig. 2 show the prevalence of dementia and cognitive impairment. The overall prevalence of dementia was stable over the study period among 85-year-olds and increased among 90- and≥95-year-olds. The prevalence of cognitive impairment (MMSE score < 24) was mostly stable but showed signs of non-linearity among 85-year-olds, peaking in 2005–2007 (Supplementary Material). The prevalence of AD increased over time only among≥95-year-olds. The sex-adjusted model of AD among 90-year-olds failed the goodness-of-fit test (Hosmer and Lemeshow χ2 = 16.302, df = 6, p = 0.012); as no outlier was found, these results are not shown. The prevalence of VaD increased in all three age groups. The prevalence of unclassified dementia decreased among 90- and≥95-year-olds; the sample of 85-year-olds with unclassified dementia was too small for analysis.
Table 2
Prevalence of dementia in the full sample and cognitive impairment among visited participants
| Participation year/birth year | Sex-adjusted | Fully adjusted | ||||||
| 85 y | 2000– | 2005– | 2010– | 2015– | OR (95% CI) | p | OR (95% CI) | p |
| 02/1915–17, | 07/1920–22, | 12/1925–27, | 17/1930–32, | |||||
| n (%) | n (%) | n (%) | n (%) | |||||
| Dementia, any | 35 (20.3) | 46 (28.0) | 65 (27.3) | 49 (24.4) | 1.06 (0.92–1.23) | 0.422 | 1.12 (0.94–1.34) | 0.180 |
| AD | 25 (14.5) | 22 (13.4) | 35 (14.7) | 26 (12.9) | 0.97 (0.81–1.17) | 0.746 | 0.97 (0.77–1.21) | 0.966 |
| VaD | 8 (4.7) | 18 (11.0) | 32 (13.4) | 23 (11.4) | 1.28 (1.03–1.59) | 0.029 | 1.40 (1.09–1.80) | 0.009 |
| Unclassified | 3 (1.7) | 7 (4.3) | 5 (2.1) | 7 (3.5) | –* | –* | –* | –* |
| MMSE < 24 | 46 (32.9) | 56 (42.7) | 53 (34.2) | 37 (22.4) | –† | –† | –‡ | –‡ |
| MMSE < 18 | 14 (10.0) | 20 (15.3) | 21 (13.5) | 12 (7.3) | 0.90 (0.72–1.13) | 0.375 | –* | –* |
| 90 y | 2000–02/ | 2005–07/ | 2010–12/ | 2015–17/ | OR (95% CI) | p | OR (95% CI) | p |
| 1910–12, n | 1915–17, n | 1920–22, n | 1925–27, n | |||||
| (%) | (%) | (%) | (%) | |||||
| Dementia, any | 36 (24.3) | 70 (40.5) | 86 (39.3) | 98 (40.7) | 1.21 (1.06–1.38) | 0.006 | 1.24 (1.07–1.45) | 0.005 |
| AD | 13 (8.8) | 44 (25.4) | 36 (16.4) | 53 (22.2) | –‡ | –‡ | 1.18 (0.98–1.42) | 0.088 |
| VaD | 9 (6.1) | 21 (12.1) | 54 (24.7) | 58 (24.3) | 1.61 (1.34–1.94) | <0.001 | 1.66 (1.34–2.05) | <0.001 |
| Unclassified | 15 (10.1) | 9 (5.2) | 7 (3.2) | 7 (2.9) | 0.47 (0.33–0.66) | <0.001 | 0.52 (0.34–0.78) | 0.002 |
| MMSE < 24 | 65 (50.8) | 85 (61.6) | 77 (52.7) | 101 (53.2) | 0.99 (0.86–1.14) | 0.991 | 1.04 (0.89–1.21) | 0.611 |
| MMSE < 18 | 28 (21.9) | 40 (29.0) | 35 (24.0) | 40 (21.1) | 0.95 (0.81–1.13) | 0.568 | 1.02 (0.85–1.22) | 0.856 |
| ≥95 y | 2000–02/ | 2005–07/ | 2010–12/ | 2015–17/ | OR (95% CI) | p | OR (95% CI) | p |
| ≤1905–07, n | ≤1910–12, n | ≤1915–17, n | ≤1920–22, n | |||||
| (%) | (%) | (%) | (%) | |||||
| Dementia, any | 48 (47.1) | 60 (45.5) | 108 (56.3) | 122 (61.0) | 1.26 (1.09–1.47) | 0.002 | 1.27 (1.07–1.51) | 0.008 |
| AD | 13 (12.7) | 30 (22.7) | 52 (27.1) | 66 (33.3) | 1.43 (1.19–1.71) | <0.001 | 1.34 (1.09–1.64) | 0.005 |
| VaD | 10 (9.8) | 16 (12.1) | 49 (25.5) | 52 (26.1) | 1.51 (1.23–1.84) | <0.001 | 1.57 (1.23–1.99) | <0.001 |
| Unclassified | 25 (24.5) | 18 (13.6) | 19 (9.9) | 12 (6.0) | 0.47 (0.36–0.61) | <0.001 | 0.49 (0.36–0.67) | <0.001 |
| MMSE < 24 | 53 (69.7) | 77 (81.1) | 92 (68.1) | 108 (69.7) | 0.92 (0.76–1.11) | 0.390 | 1.02 (0.82–1.25) | 0.877 |
| MMSE < 18 | 34 (44.7) | 42 (44.2) | 57 (42.2) | 66 (42.6) | 0.97 (0.82–1.15) | 0.736 | 1.08 (0.89–1.32) | 0.442 |
Percentages of dementia (full sample) and MMSE categories (visited participants) are calculated as cell count/total count of included participants in each age group and participation year. ORs and p values for the probability of events with increasing participation year were calculated using multiple logistic regression. The fully adjusted models were adjusted for sex and education for all outcomes and additionally for hearing and vision impairment for MMSE outcomes. The sex-adjusted analyses of dementia, AD, VaD, and unclassified dementia data were performed for the full sample; all other analyses were performed for visited participants. AD and VaD diagnoses were not mutually exclusive: participants with mixed AD and VaD dementia are represented in both rows. MMSE < 24 or < 18 denotes achieved points on the assessment, irrespective of dementia status. *Analysis not performed due to insufficient sample. †Results not shown due to indications of linearity in the logit. ‡Results not shown due to poor model fit. OR, odds ratio; CI, confidence interval; AD, Alzheimer’s disease; VaD, vascular dementia; MMSE, Mini-Mental State Examination.
Fig. 2
Prevalences of dementia and cognitive impairment. The prevalences of MMSE < 24 or < 18 were investigated among visited participants; all other prevalences were investigated in the full sample. MMSE < 24 or < 18 denotes achieved points on the assessment, irrespective of dementia status. *p < 0.05 for regression of prevalence with later participation year, sex adjusted (except for MMSE score < 24 among 85-year-olds, which was adjusted for sex and education, as shown in the Supplement for the non-linear model). **p < 0.01 and ***p < 0.001 for regression of prevalence with later participation year, sex adjusted. AD, Alzheimer’s disease; VaD, vascular dementia; MMSE, Mini-Mental State Examination.
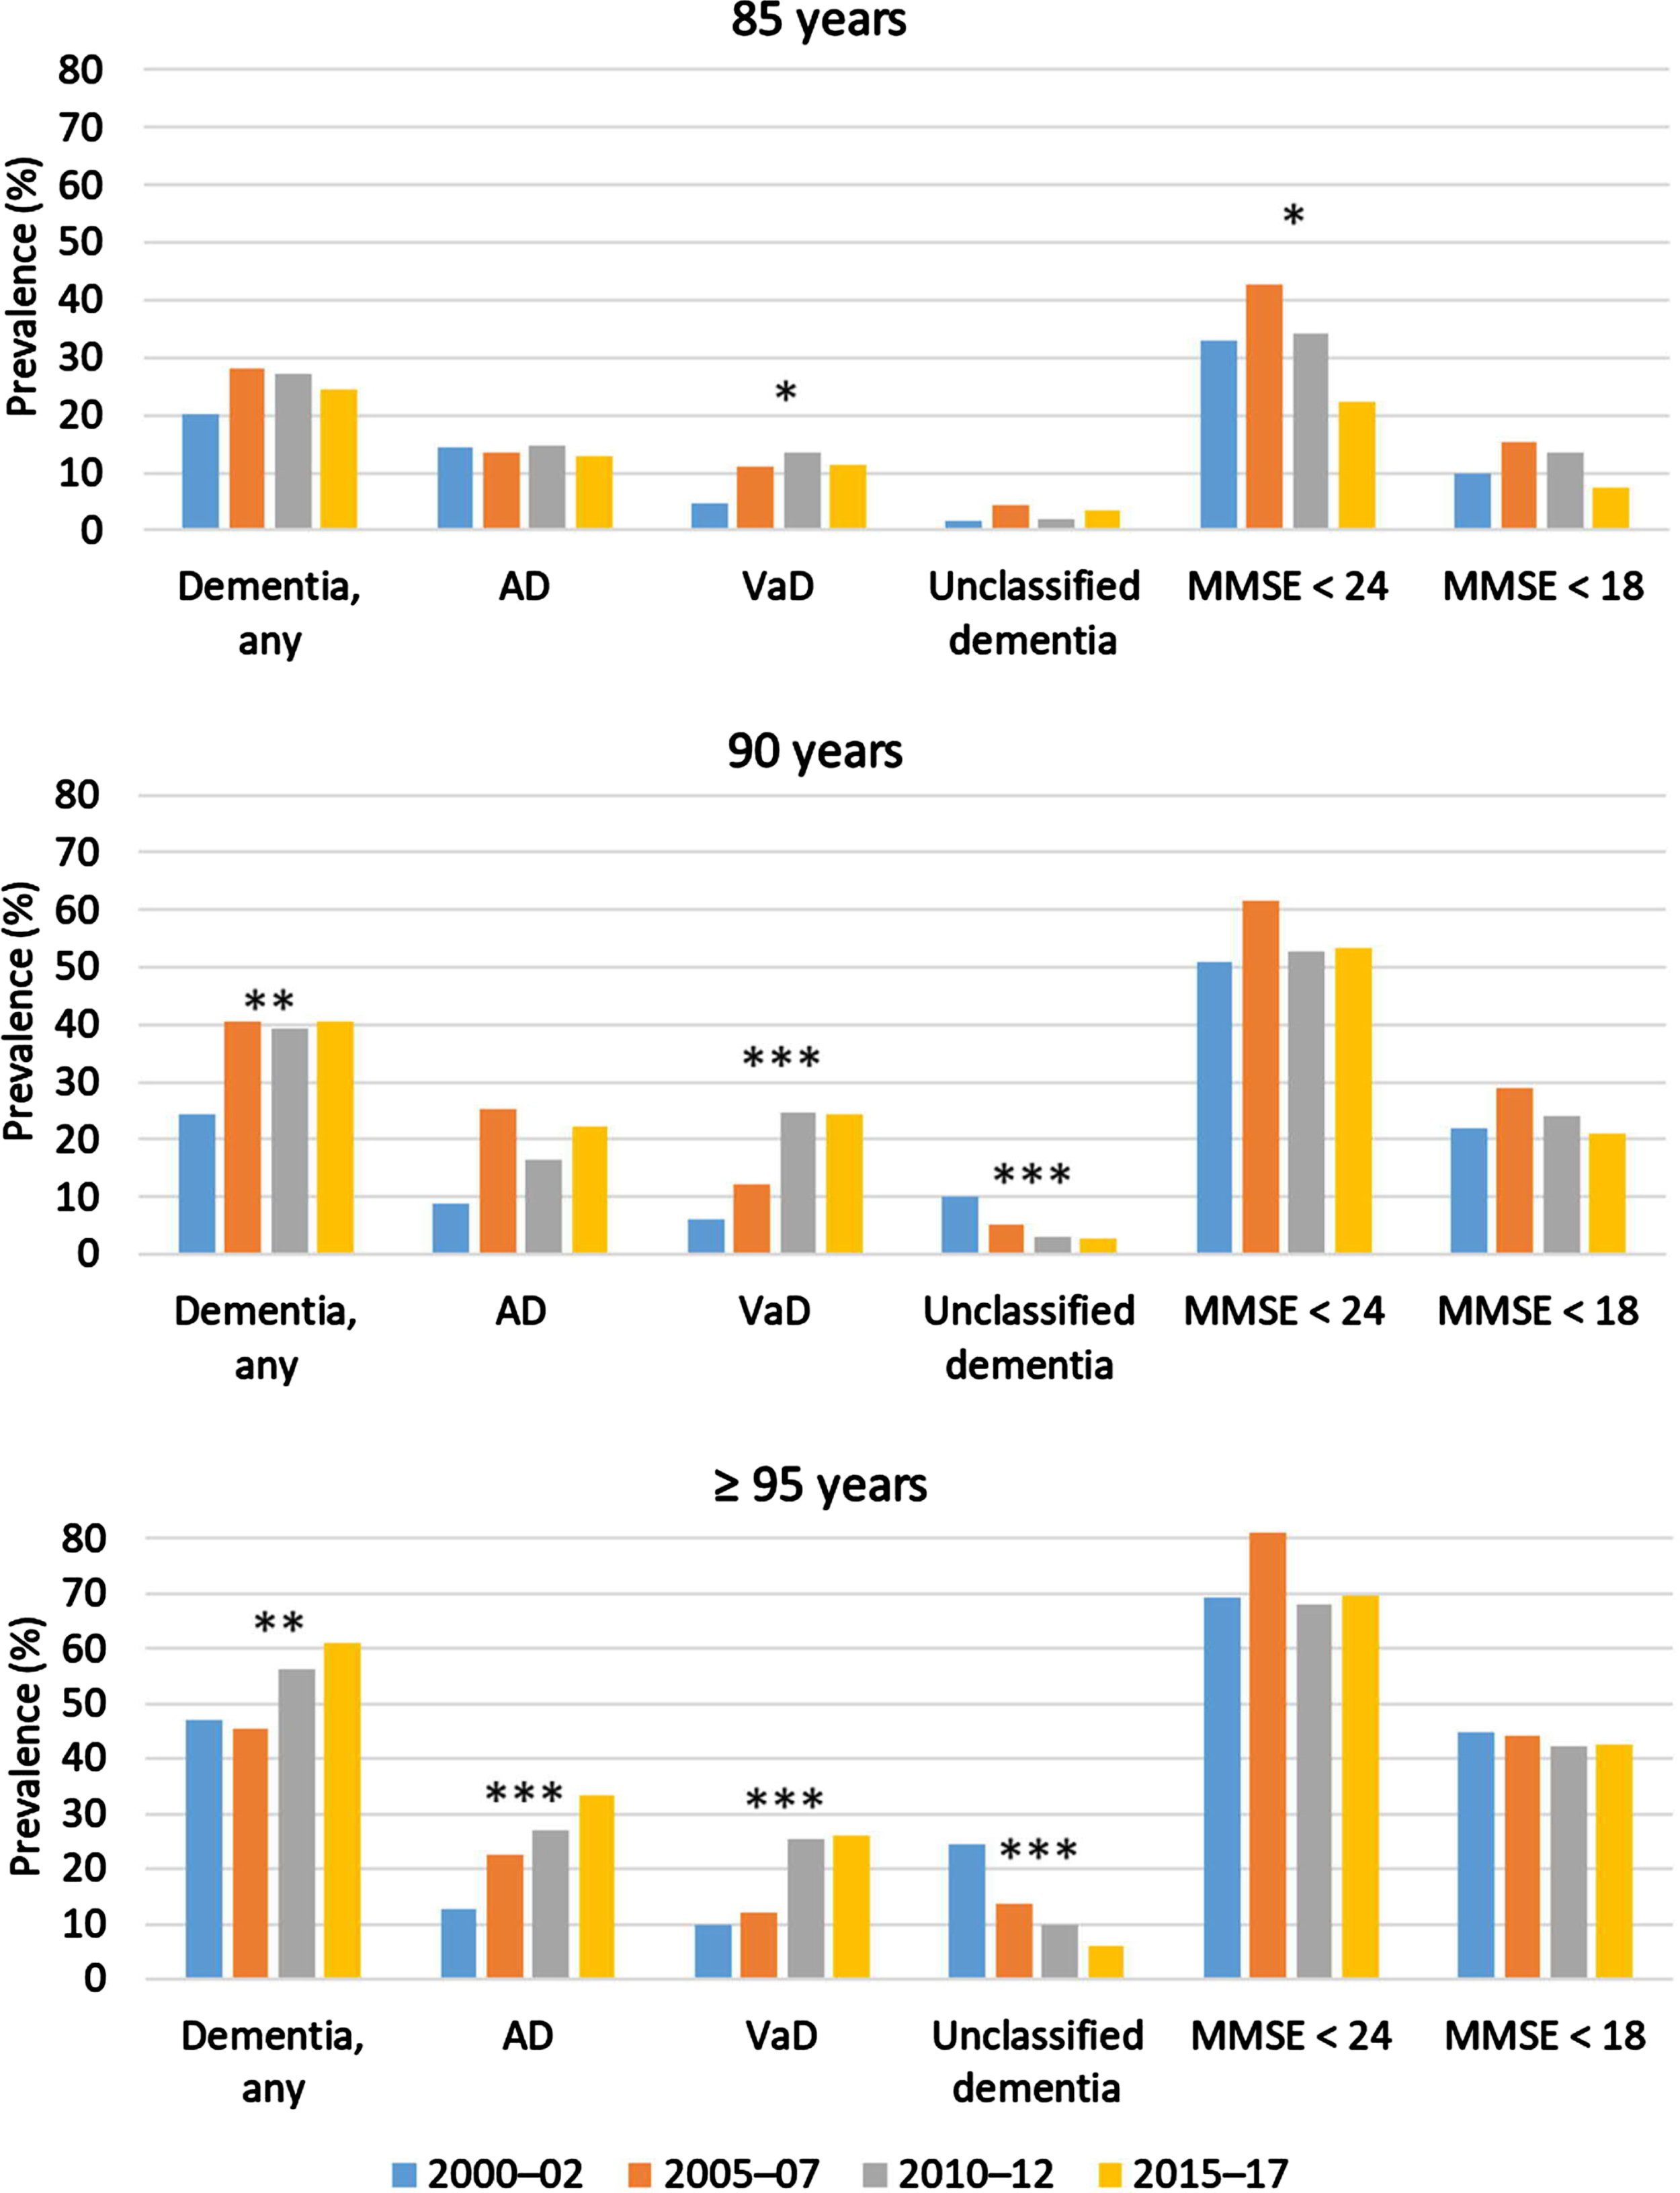
Table 3 and Supplementary Figure 1 show estimated MMSE score thresholds for dementia diagnosis. In all age groups, this threshold generally increased after 2005–2007, with the largest increase observed among≥95-year-olds. The models for 90-year-olds in 2010–2012 and 2015–2017 failed the Box–Tidwell test (p = 0.003), indicating the violation of linearity in the logit.
Table 3
Estimated MMSE score thresholds for the diagnosis of dementia among visited participants
| Age groups | 2000–02 | 2005–07 | 2010–12 | 2015–17 |
| 85 y | 19.4 | 19.9 | 20.8 | 22.5 |
| 90 y | 17.9 | 19.5 | 21.5* | 20.6* |
| ≥95 y | 17.2 | 16.0 | 20.6 | 21.4 |
The estimated MMSE threshold was defined as the baseline MMSE score under which 50% of participants were diagnosed with dementia in their index participation year, as estimated by logistic regression adjusted for sex and education. *This regression failed the Box-Tidwell test (p = 0.003), indicating the violation of linearity in the logit. MMSE, Mini-Mental State Examination.
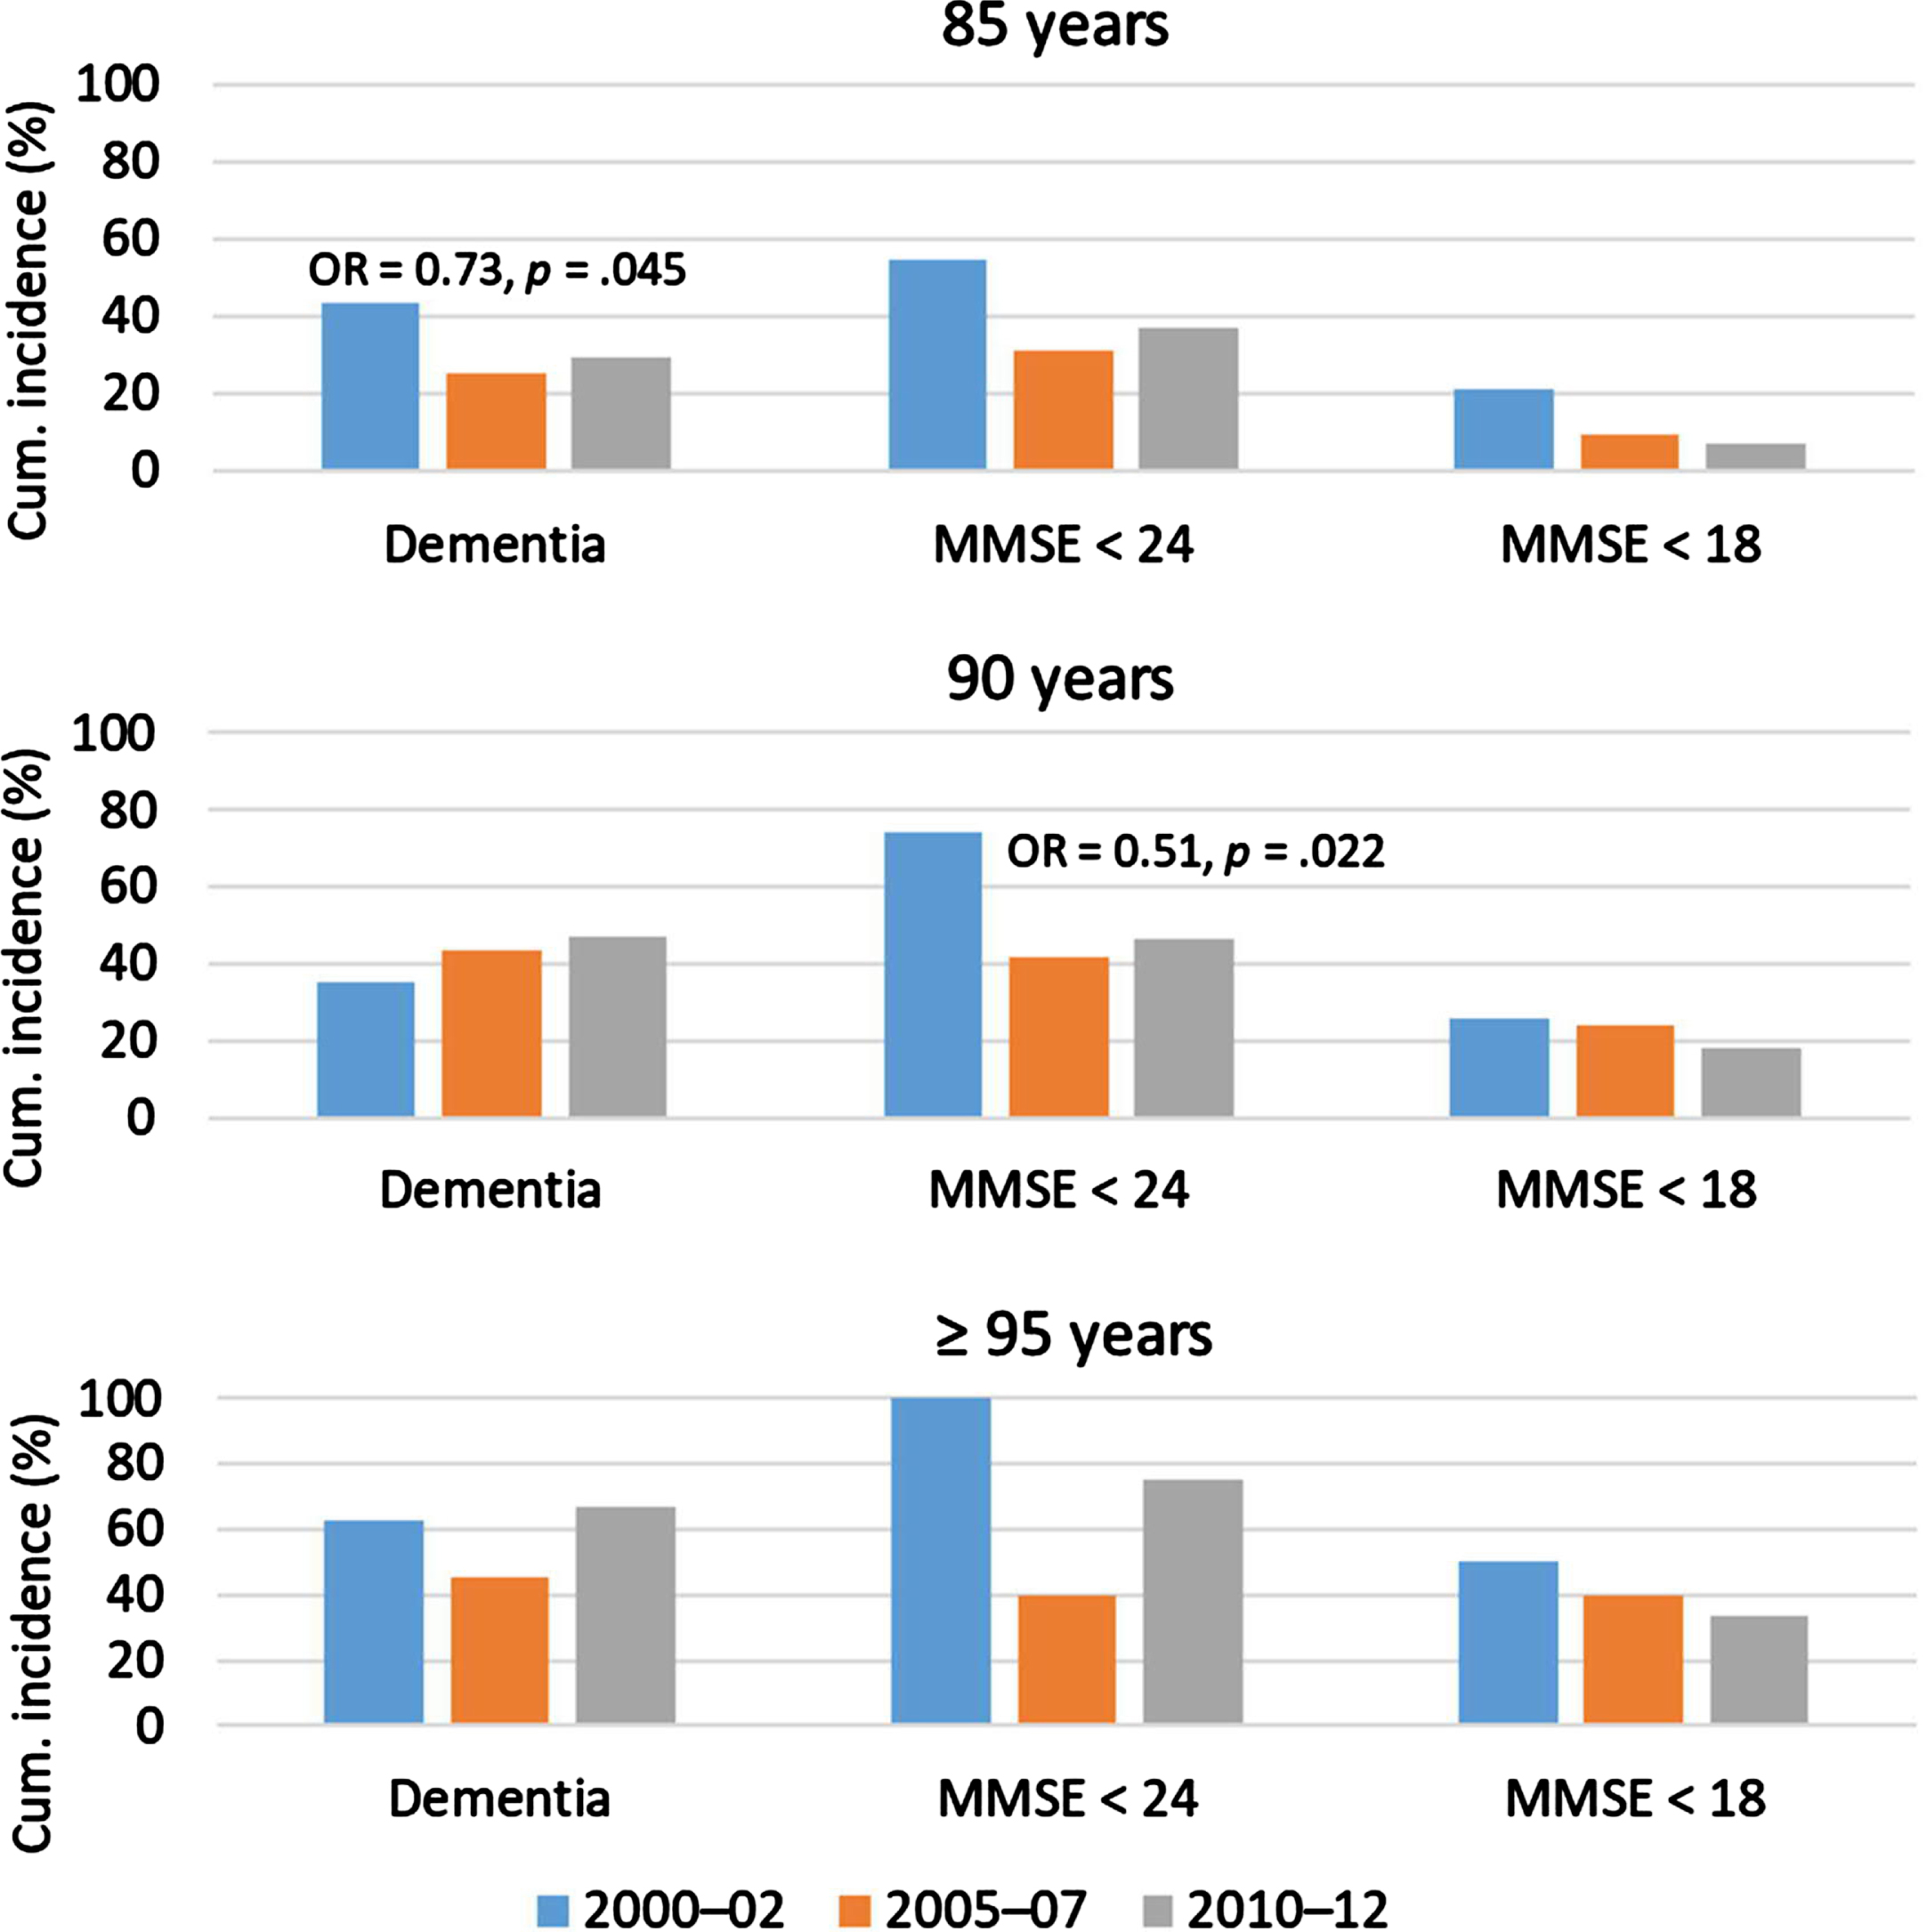
Figure 3 and Supplementary Tables 2 and 3 show the 5-year cumulative incidence of dementia and cognitive impairment. There were 454 followed participants at risk of incident dementia and 258 at risk of incident cognitive impairment. The cumulative 5-year dementia incidence changed only among 85-year-olds, with the sex-adjusted analysis revealing a decline. The cumulative 5-year incidence of decline to MMSE score < 24 changed only among 90-year-olds, for whom a decline was observed. The sample of ≥ 95-year-olds at risk of this incident decline and those of all age groups at risk of incident decline to MMSE score < 18 were too small to analyze.
Fig. 3
Proportions of followed participants with incident dementia or decline from MMSE score≥24 to < 24 or < 18. ORs and p values are shown when significant, from sex-adjusted regression of incidence with later participation year. The analyses of MMSE were performed for visited participants. MMSE < 24 or < 18 denotes achieved points on the assessment, irrespective of dementia status. MMSE, Mini-Mental State Examination; OR, odds ratio.
The distribution of age groups and sex did not differ between participants and those who declined participation, as presented in the Supplementary Material together with differences between those included and not included in subsamples. Missing data patterns are described in the Supplementary Material.
DISCUSSION
In this population-based cohort study, we observed different temporal trends of the prevalence and incidence of dementia and cognitive impairment among 85-, 90-, and≥95-year-olds in Sweden. Decreasing cumulative 5-year incidences of dementia and cognitive impairment were observed only in the younger age groups. The overall prevalences of dementia, cognitive impairment, and AD were mainly stable or increased, with more favorable tendencies observed in younger than in older age groups. The prevalence of VaD increased in all age groups, while that of unclassified dementia decreased.
Dementia incidence
The trend of decreasing dementia incidence over time among 85-year-olds observed in the sex-adjusted analysis is in line with previous findings from Western and high-income countries [4, 5, 37]. In the sex- and education-adjusted analysis, a similar, but nonsignificant, effect size was seen, indicating power issues. The peak may have been around or before 1915–1917 for 85-year-olds, while the incidence for 90-year-olds born in those years was static, suggesting that the changing trend in the former group represents a delay in dementia onset at older ages. The stable dementia incidences observed among 90- and≥95-year-olds are in line with results from the Swedish National Patient Register, which show a trend break not affecting≥90-year-olds [38].
Cognitive impairment incidence
The declining incidence of cognitive impairment among 90-year-olds and stability of this incidence among 85-year-olds in the present study are in line with previous findings of stable or decreasing incidences of (mild) cognitive impairment [7–11]. Although the cognitive impairment incidence trend was not significant among 85-year-olds, the odds ratio indicated a similar effect size in this age group and the p value approached borderline significance, potentially reflecting a power problem. These findings suggest that a positive change in cognitive health trends preceded the decreasing dementia incidence among 85-year-olds and had already affected 90-year-olds. The decrease coincided with large increases in levels of educational attainment, which may comprise a contributing factor.
Dementia prevalence
The stable prevalence of dementia among 85-year-olds in this study is in line with findings among the general population [12]. Two previous studies in which assessment was performed at only two timepoints, including another Umeå 85 + /GERDA study, also revealed that the prevalence of dementia was stable or increased in later years among age groups≥85 years [28, 39]. The increasing dementia prevalence observed among 90- and≥95-year-olds in this study may have resulted from increased disease duration at these ages, as the 5-year incidence of dementia did not increase in the intervals leading up to those ages (i.e., among 85- and 90-year-olds). Increased disease duration may result from longer survival with dementia, as observed in some previous studies [1, 26, 40].
Cognitive impairment prevalence
The prevalences of severe and mild–severe cognitive impairment appeared stable among 90- and≥95-year-olds in this study, indicating that their cognitive health had not worsened despite the simultaneously increasing prevalence of dementia. This stability in relation to the declining incidence of cognitive impairment among 85- and 90-year-olds (although the former was affected by power issues) allows the inference of a simultaneous increase in the duration of cognitive impairment.
Among 85-year-olds, the prevalence of cognitive impairment showed a non-linear trend, peaking in 2005–2007 (birth cohorts 1920–1922) and declining thereafter. This shift may be attributed, at least in part, to the large improvements in educational attainment seen around this time, as MMSE scores are influenced by education. It also corresponds perfectly with the timing of the marked decrease in the incidence of dementia in birth cohorts postdating 1920 in the Einstein Aging Study [41]; dementia is a major cause of cognitive impairment among the very old.
In a nationwide study of Danish nonagenarians from birth cohorts 1905 and 1915 conducted in 1998 and 2010, participants in the younger cohort scored better on cognitive tests, indicating that the shift toward the decreasing prevalence of cognitive impairment had already occurred in between these birth cohorts in Denmark [13], as shown in most previous studies [13–18]. Geographical variations in the prevalence of dementia in affluent countries, including greater prevalence in northern and rural areas, have been observed [42, 43], possibly explaining the delay in northern Sweden.
AD and VaD prevalence
The prevalence of AD increased over time only among≥95-year-olds in this study; it remained stable in younger age groups, in line with previous findings for≥65-year-olds in the US and Korea [24, 25] and in contrast to increasing trends observed in Japan and Taiwan [26, 27].
In contrast, the VaD prevalence increased in all three age groups in the present study, in disagreement with findings from Korea and Japan [25, 26]. This difference could be caused by greater exposure to Western lifestyle–associated factors (e.g., unhealthy diet and inactivity) among the Umeå 85 + /GERDA study participants [44]. Furthermore, the population of northern Sweden has Finnish ethnic and genetic influences, which may entail an increased propensity for hypercholesterolemia, possibly contributing to an increased VaD risk [45]. Major improvements in cardiovascular risk factors during 1986–2009 have been observed in northern Sweden [46] and may be associated with improved brain health [47, 48]; however, the full effect of this shift may not have reached the very old. Improvements in survival after cardiovascular events during this period also may have contributed to the increasing VaD incidence [49].
In the present Umeå 85 + /GERDA cohorts, the decreasing prevalence of unclassified dementia among 90- and≥95-year-olds and low prevalence of this diagnosis among 85-year-olds may reflect increasingly successful dementia subtype classification. The Medicare data–based study yielded similar results [16]. Such improvements may contribute temporarily to the prevalence of AD and VaD without necessarily increasing the overall prevalence of dementia.
Earlier diagnosis
The shift in later years toward earlier diagnosis observed in this study may have led to an increase in the documented prevalence of overall dementia, AD, and VaD, as in the Personnes Agées Quid and Aging Multidisciplinary Investigation studies [15]. Accordingly, we found that dementia diagnoses were made at higher levels of cognitive functioning in later years, especially among≥95-year-olds. Similar conclusions regarding earlier dementia and AD diagnoses were drawn for the Medicare population [16, 23]. In contrast, in the Kungsholmen Project and Swedish National study on Aging and Care in Kungsholmen, mean MMSE scores among patients with dementia did not differ between the 1987–1989 and 2001–2004 cohorts [39], which might be explained in part by the earlier time frame of data collection relative to the other studies.
Earlier dementia diagnosis may be the result of the improved sensitivity of diagnostic methods or increased tendency among caregivers to perform evaluation. It may also indicate an increasing populational tendency to seek medical evaluation for mild dementia-related symptoms in later years, possibly following improvements in educational attainment. Although our models were adjusted for education (≥8 years), large changes occurred over the years 2000 to 2017 in the proportion of participants with≤6 years education (which may not have been captured fully by the 8-year cutoff) and may have contributed to this development.
Earlier dementia diagnosis prolongs the disease duration, which in turn impacts the prevalence. Thus, temporal trends in the prevalence and incidence of dementia should be interpreted in relation to the timing of diagnosis.
Future projections
As expected, the population of eligible Umeå 85 + /GERDA participants grew over time, reflecting populational aging, which entails increases in health and social costs related to dementia care. Based on the current results and the state of the field, however, there is still cause for optimism. The cohort effects observed in the present study had not yet affected the oldest participants (in whom prevalences were highest) and may bring about future changes in these age groups. The trend shift in cognitive health in the present study coincided with the improvement in educational attainment, which as a contributing factor may have a continuing, stable effect on all later birth cohorts. If the prevalence of dementia in the oldest age groups were to continue to increase, even a slight delay in disease onset (as indicated by the present study) may have major economic and societal effects [50]. Furthermore, the oldest old may not yet be experiencing the full benefits of cardiovascular risk factor control on brain health.
In addition, the effects of the increasing dementia and cognitive impairment durations on the dementia prevalence may be temporary. Once these effects have played out fully, the declining dementia incidence may also be reflected in a declining prevalence. This conjecture is supported by the generally more positive incidence and prevalence trends for cognitive impairment, which are not influenced by disease-prolonging trends in the timing of diagnosis and may thus be better estimates of general cognitive health than are their counterparts for overall dementia.
Study strengths and limitations
The performance of home visitation, including caring facilities, in the Umeå 85 + /GERDA study ensured the participation of frail persons. This factor and the inclusion of participants from urban and rural areas contributed to the high degree of representativity for the sampled age groups. The participation rate for the full sample was very high, ensuring excellent generalizability of the results. However, women and persons with lower educational levels were underrepresented among the visited participants. As expected, men and persons with baseline dementia or cognitive impairment were underrepresented and the mean age was younger in the subsample of followed participants, likely due to survival bias. The incidences of dementia and cognitive impairment are likely also underrepresented, especially in the older age groups, as follow-up information was collected only from those participating in 5-year follow-up assessments. The estimation of dementia diagnosis decreases the likelihood of type II error while impairing comparability with other studies. Furthermore, the same professional conducted dementia evaluations for all participants using the same criteria, ensuring consistency.
Conclusion
The cognitive health of the very old seems to be undergoing changes in the 21st century. Incidences of dementia and cognitive impairment are declining in younger age groups, possibly reflecting delayed disease onset. This change was observed in parallel with large improvements in educational attainment. The prevalences of overall dementia, cognitive impairment, and AD have not yet begun to decline, although the trends are more favorable in younger than in older age groups and the prevalence of cognitive impairment among 85-year-olds may just be beginning to shift. Among 90- and≥95-year-olds, stable trends in the prevalence of cognitive impairment indicate no worsening of cognitive health, despite parallel increases in the prevalence of dementia; increases in dementia and cognitive impairment disease durations were inferred from discrepancies in simultaneous prevalence and incidence trends. The prevalence of VaD may still be increasing. Unclassified dementia seems to be becoming rarer, increasing the prevalences of specified dementias. Dementia appears to have been diagnosed earlier in recent years. Considering the favorable trends observed in younger birth cohorts, the signs of delayed dementia onset, and potentially self-limiting effects of increasing disease durations on prevalences in the oldest age groups, there may be cause for optimism regarding the future societal burden of dementia.
ACKNOWLEDGMENTS
We wish to thank all of the Umeå 85 + /GERDA participants, their relatives, and nurses, and all individuals who helped with data collection, for their fundamental contributions to the study.
FUNDING
This work was supported by the Swedish Research Council (grant no. K2014–99X-22610–01–6); a regional agreement between Umeå University and Västerbotten County Council on cooperation in the fields of medicine, odontology and health; the Research Foundation of the Faculty of Medicine and Odontology at Umeå University; the Swedish Dementia Association; the Strategic Research Area Health Care Science (SFO-V); the European Union and Regional Development Fund: and the Interreg IIIA Mitt-Scandia and the Bothnia-Atlantica Program.
CONFLICT OF INTEREST
The authors have no conflict of interest to report.
DATA AVAILABILITY
The data supporting the findings of this study are available on reasonable request from the corresponding author. The data are not publicly available due to privacy or ethical restrictions.
SUPPLEMENTARY MATERIAL
[1] The supplementary material is available in the electronic version of this article: https://dx.doi.org/10.3233/JAD-220915.
REFERENCES
[1] | Prince M , Ali G-C , Guerchet M , Prina AM , Albanese E , Wu Y-T ((2016) ) Recent global trends in the prevalence and incidence of dementia, and survival with dementi. Alzheimers Res Ther 8: , 23. |
[2] | Wu YT , Beiser AS , Breteler MMB , Fratiglioni L , Helmer C , Hendrie HC , Honda H , Ikram MA , Langa KM , Lobo A , Matthews FE , Ohara T , Penérès K , Qiu C , Seshadri S , Sjölund BM , Skoog I , Brayne C ((2017) ) The changing prevalence and incidence of dementia over time: Current evidenc. Nat Rev Neurol 13: , 327–329. |
[3] | Stephan BCM , Birdi R , Tang EYH , Cosco TD , Donini LM , Licher S , Ikram MA , Siervo M , Robinson L ((2018) ) Secular trends in dementia prevalence and incidence worldwide: A systematic review. J Alzheimers Dis 66: , 653–680. |
[4] | Gao S , Burney HN , Callahan CM , Purnell CE , Hendrie HC ((2019) ) Incidence of dementia and Alzheimer disease over time: A meta-analysis. J Am Geriatr Soc 67: , 1361–1369. |
[5] | Wolters FJ , Chibnik LB , Waziry R , Anderson R , Berr C , Beiser A , Bis JC , Blacker D , Bos D , Brayne C , Dartigues JF , Darweesh SKL , Davis-Plourde KL , de Wolf F , Debette S , Dufouil C , Fornage M , Goudsmit J , Grasset L , Gudnason V , Hadjichrysanthou C , Helmer C , Ikram MA , Ikram MK , Joas E , Kern S , Kuller LH , Launer L , Lopez OL , Matthews FE , McRae-McKee K , Meirelles O , Mosley TH Jr , Pase MP , Psaty BM , Satizabal CL , Seshadri S , Skoog I , Stephan BCM , Wetterberg H , Wong MM , Zettergren A , Hofman A ((2020) ) Twenty-seven-year time trends in dementia incidence in Europe and the United States: The Alzheimer Cohorts Consortium. Neurology 95: , e519–531. |
[6] | Clouston SAP , Terrera GM , Rodgers JL , O’Keefe P , Mann FD , Lewis NA , Wänström L , Kaye J , Hofer SM ((2021) ) Cohort and period effects as explanations for declining dementia trends and cognitive aging. Popul Dev Rev 47: , 611–637. |
[7] | Bohlken J , Riedel-Heller S , Steininger G , Kostev K , Michalowsky B ((2021) ) Trends in dementia and mild cognitive impairment prevalence and incidence in german general and specialist practices between 2015 and 2019. J Alzheimers Dis 79: , 1683–1690. |
[8] | Derby CA , Katz MJ , Rozner S , Lipton RB , Hall CB ((2019) ) A birth cohort analysis of amnestic mild cognitive impairment incidence in the Einstein Aging Study (EAS) cohort. J Alzheimers Dis 70: , 271–281. |
[9] | Gao M , Kuang W , Qiu P , Wang H , Lv X , Yang M ((2017) ) The time trends of cognitive impairment incidence among older Chinese people in the community: Based on the CLHLS cohorts from 1998 to 2014. Age Ageing 46: , 787–793. |
[10] | Mejia-Arango S , Avila J , Downer B , Garcia MA , Michaels-Obregon A , Saenz JL , Samper-Ternent R , Wong R ((2021) ) Effect of demographic and health dynamics on cognitive status in Mexico between 2001 and 2015: Evidence from the Mexican Health and Aging Study. Geriatrics 6: , 63. |
[11] | Downer B , Garcia MA , Raji M , Markides KS ((2018) ) Cohort differences in cognitive impairment and cognitive decline among Mexican-Americans aged 75 years or older. Am J Epidemiol 188: , 119–129. |
[12] | Cova I , Markova A , Campini I , Grande G , Mariani C , Pomati S ((2017) ) Worldwide trends in the prevalence of dementia. J Neurol Sci 379: , 259–260. |
[13] | Christensen K , Thinggaard M , Oksuzyan A , Steenstrup T , Andersen-Ranberg K , Jeune B , McGue M , Vaupel JW ((2013) ) Physical and cognitive functioning of people older than 90 years: A comonparis of two Danish cohorts born 10 years apart. Lancet 382: , 1507–1513. |
[14] | Langa KM , Larson EB , Crimmins EM , Faul JD , Levine DA , Kabeto MU , Weir DR ((2017) ) A comonparis of the prevalence of dementia in the United States in 2000 and 2012. JAMA Intern Med 177: , 51–58. |
[15] | Pérès K , Brayne C , Matharan F , Grasset L , Helmer C , Letenneur L , Foubert-Samier A , Baldi I , Tison F , Amieva H , Dartigues JF ((2017) ) Trends in prevalence of dementia in French farmers from two epidemiological cohorts. J Am Geriatr Soc 65: , 415–420. |
[16] | Akushevich I , Yashkin AP , Kravchenko J , Ukraintseva S , Stallard E , Yashin AI ((2018) ) Time trends in the prevalence of neurocognitive disorders and cognitive impairment in the United States: The effects of disease severity and improved ascertainment. J Alzheimers Dis 64: , 137–148. |
[17] | Kuang W , Gao M , Tian L , Wan Y , Qiu P ((2020) ) Trends in the prevalence of cognitive impairment in Chinese older adults: Based on the Chinese Longitudinal Healthy Longevity Survey cohorts from 1998 to 2014. Int Health 12: , 378–387. |
[18] | Overton M , Pihlsgård M , Elmståhl S ((2022) ) Secular trends in prevalent mild cognitive impairment: Data from the Swedish population-based study Good Aging in Skåne. Alzheimers Dement 8: , e12260. |
[19] | Hale JM , Schneider DC , Gampe J , Mehta NK , Myrskylä M ((2020) ) Trends in the risk of cognitive impairment in the United States, 1996–2014. Epidemiology 31: , 745–754. |
[20] | Richardson C , Stephan BCM , Robinson L , Brayne C , Matthews FE Cognitive Function and Ageing Study Collaboration ((2019) ) Two-decade change in prevalence of cognitive impairment in the UK. Eur J Epidemiol 34: , 1085–1092. |
[21] | Lu H , Wang X-D , Shi Z , Yue W , Zhang Y , Liu S , Liu S , Zhao L , Xiang L , Zhang Y , Guan Y , Su W , Li Z , Wang J , Wisniewski T , Ji Y ((2019) ) Comparative analysis of cognitive impairment prevalence and its etiological subtypes in a rural area of northern China between 2010 and 2015. Sci Rep 9: , 851. |
[22] | Lee M , Halpern-Manners A , Warren JR ((2021) ) The prevalence of cognitive impairment is not increasing in the United States: A critique of Hale et al. (2020). Epidemiology 32: , 712–716. |
[23] | Akushevich I , Yashkin AP , Kravchenko J , Yashin AI ((2021) ) Analysis of time trends in Alzheimer’s disease and related dementias using partitioning approach. J Alzheimers Dis 82: , 1277–1289. |
[24] | Rajan KB , Weuve J , Barnes LL , Wilson RS , Evans DA ((2019) ) Prevalence and incidence of clinically diagnosed Alzheimer’s disease dementia from 1994 to 2012 in a population study. Alzheimers Dement 15: , 1–7. |
[25] | Kim YJ , Han JW , So YS , Seo JY , Kim KY , Kim KW ((2014) ) Prevalence and trends of dementia in Korea: A systematic review and meta-analysis. J Korean Med Sci 29: , 903–912. |
[26] | Ohara T , Hata J , Yoshida D , Mukai N , Nagata M , Iwaki T , Kitazono T , Kanba S , Kiyohara Y , Ninomiya T ((2017) ) Trends in dementia prevalence, incidence, and survival rate in a Japanese community. Neurology 88: , 1925–1932. |
[27] | Liu CC , Li CY , Sun Y , Hu SC ((2019) ) Gender and age differences and the trend in the incidence and prevalence of dementia and Alzheimer’s disease in Taiwan: A 7-year national population-based study. Biomed Res Int 2019: , 5378540. |
[28] | Mathillas J , Lövheim H , Gustafson Y ((2011) ) Increasing prevalence of dementia among very old people. Age Ageing 40: , 243–249. |
[29] | Folstein MF , Folstein SE , McHugh PR ((1975) ) “Mini-mental state”: A practical method for grading the cognitive state of patients for the clinician. J Psychiatr Res 12: , 189–198. |
[30] | American Psychiatric Association (2000) Diagnostic and statistical manual of mental disorders. 4th ed, text revision.American Psychiatric Publishing, Inc., Washington, DC |
[31] | Sheikh JI , Yesavage JA ((1986) ) Geriatric Depression Scale (GDS): Recent evidence and development of a shorter version. Clin Gerontol 5: , 165–73. |
[32] | Lawton MP ((1975) ) The Philadelphia geriatric center morale scale: A revision. J Gerontol 30: , 85–89. |
[33] | Tilvis RS , Laitala V , Routasalo P , Strandberg TE , Pitkala KH ((2012) ) Positive life orientation predicts good survival prognosis in old age. Arch Gerontol Geriatr 55: , 133–137. |
[34] | Collin C , Wade D , Davies S , Horne V ((1988) ) The Barthel ADL Index: A reliability study. Int Disabil Stud 10: , 61–63. |
[35] | Sonn U ((1996) ) Longitudinal studies of dependence in daily life activities among elderly persons. Scand J Rehabil Med Suppl 34: , 1–35. |
[36] | Jensen E , Dehlin O , Gustafson L ((1993) ) A comonparis between three psychogeriatric rating scales. Int J Geriatr Psychiatry 8: , 215–229. |
[37] | Ding M , Qiu C , Rizzuto D , Grande G , Fratiglioni L ((2020) ) Tracing temporal trends in dementia incidence over 25 years in central Stockholm, Sweden. Alzheimers Dement 16: , 770–778. |
[38] | Seblova D , Quiroga ML , Fors S , Johnell K , Lövdén M , de Leon AP , Svensson AC , Wicks S , Lager A ((2018) ) Thirty-year trends in dementia: A nationwide population study of Swedish inpatient records. Clin Epidemiol 10: , 1679–1693. |
[39] | Qiu C , von Strauss E , Bäckman L , Winblad B , Fratiglioni L ((2013) ) Twenty-year changes in dementia occurrence suggest decreasing incidence in centra Stockholm. Sweden Neurol 80: , 1888–1894. |
[40] | Grasset L , Pérès K , Joly P , Sabathé C , Foubert-Samier A , Dartigues J-F , Helmer C ((2019) ) Secular trends of mortality and dementia-free life expectancy over a 10-year period in France. Eur J Epidemiol 34: , 115–123. |
[41] | Derby CA , Katz MJ , Lipton RB , Hall CB ((2017) ) Trends in dementia incidence in a birth cohort analysis of the Einstein Aging Study. JAMA Neurol 74: , 1345–1351. |
[42] | Russ TC , Batty GD , Hearnshaw GF , Fenton C , Starr JM ((2012) ) Geographical variation in dementia: Systematic review with meta-analysis. Int J Epidemiol 41: , 1012–1032. |
[43] | Russ TC , Gatz M , Pedersen NL , Hannah J , Wyper G , Batty GD , Deary IJ , Starr JM ((2015) ) Examining the role of environmental factors in Sweden and Scotland. Epidemiology 26: , 263–270. |
[44] | Kalaria RN , Maestre GE , Arizaga R , Friedland RP , Galasko D , Hall K , Luchsinger JA , Ogunniyi A , Perry EK ((2008) ) Alzheimer’s disease and vascular dementia in developing countries: Prevalence, management, and risk factors. Lancet Neurol 7: , 812–826. |
[45] | Nylander PO , Asplund K , Beckman L , Stegmayr B , Johansson I ((1993) ) Population studies in northerSweden.18.Geographical covariation between hypercholesterolemia and Finnish genetic influence. Hum Hered 43: , 147–154. |
[46] | Eriksson M , Holmgren L , Janlert U , Jansson J-H , Lundblad D , Stegmayr B , Söderberg S , Eliasson M ((2011) ) Large improvements in major cardiovascular risk factors in the population of northern Sweden: The MONICA study 1986–2009. J Intern Med 269: , 219–231. |
[47] | Grande G , Qiu C , Fratiglioni L ((2020) ) Prevention of dementia in an ageing world: Evidence and biological rationale. Ageing Res Rev 64: , 101045. |
[48] | Yaffe K , Vittinghoff E , Pletcher MJ , Hoang TD , Launer LJ , Whitmer RA , Coker LH , Sidney S ((2014) ) Early adult to midlife cardiovascular risk factors and cognitive function. Circulation 129: , 1560–1567. |
[49] | Modig K , Andersson T , Drefahl S , Ahlbom A ((2013) ) Age-specific trends in morbidity, mortality and case-fatality from cardiovascular disease, myocardial infarction and stroke in advanced age: Evaluation in the Swedish population. PLoS One 8: , 64928–. |
[50] | Brodaty H , Breteler MM , Dekosky ST , Dorenlot P , Fratiglioni L , Hock C , Kenigsberg P-A , Scheltens P , De Strooper B ((2011) ) The world of dementia beyond 2020. J Am Geriatr Soc 59: , 923–927. |

