
Low Ankle-Brachial Index Relates to Alzheimer-Signature Cerebral Glucose Metabolism in Cognitively Impaired Older Adults
Abstract
Background:
Ankle-brachial index (ABI), an indicator of atherosclerosis or arterial stiffness, has been associated with Alzheimer’s disease (AD) dementia and related cognitive impairment. Nevertheless, only limited information is available regarding its contribution to brain alterations leading to cognitive decline in late-life.
Objective:
We aimed to investigate the relationship of ABI with in vivo AD pathologies and cerebrovascular injury in cognitively impaired older adults.
Methods:
Total 127 cognitively impaired (70 mild cognitive impairment and 57 AD dementia) individuals, who participated in an ongoing prospective cohort study, were included. All participants underwent comprehensive clinical and neuropsychological assessment, ABI measurement, apolipoprotein E (APOE) ɛ4 genotyping, and multi-modal brain imaging including [11C] Pittsburgh Compound B (PiB)-positron emission tomography (PET) and [18F] fludeoxyglucose (FDG)-PET, and MRI.
Results:
General linear model analysis showed significant relationship between ABI strata (low ABI: <1.00, normal ABI: 1.00–1.29, and high ABI: ≥1.30) and AD-signature region cerebral glucose metabolism (AD-CM), even after controlling age, sex, clinical dementia rating–sum of box, and APOE ɛ4 positivity (p = 0.029). Post hoc comparison revealed that low ABI had significantly lower AD-CM than middle and high ABI, while no difference of AD-CM was found between middle and high ABI. There was no significant difference of global Aβ deposition, AD-signature region cortical thickness, and white matter hyperintensity volume between the three ABI strata.
Conclusion:
Our findings suggest that lower ABI, likely related to atherosclerosis, may contribute to the aggravation of AD-related regional neurodegeneration in cognitively impaired older adults.
INTRODUCTION
The ankle-brachial pressure index (ABI), the ratio of the ankle and brachial systolic blood pressure (SBP), is a widely used non-invasive measure of arterial health. A low ABI reflects the presence of atherosclerosis of the arterial walls in the lower extremities and it is regarded as a good indicator of generalized atherosclerosis [1, 2], while high ABI indicates arterial stiffness or arteriosclerosis of the vessel wall [3, 4].
Several epidemiological studies showed that low ABI was related to an increased risk or progression of AD and related cognitive impairment, suggesting presence of relationship of atherosclerosis of cerebral arteries to AD dementia and cognitive decline in older adults [2, 5–7]. Some studies also reported that both high and low ABI were related to increased risk of cognitive impairment or dementia, particularly a U-shaped relationship [8, 9].
Nevertheless, relatively limited information is available for brain alterations related to the relationship between ABI levels and cognitive impairment. While our group previously reported a positive association between a high ABI and increased amyloid-β (Aβ) burden in cognitively healthy older adults [10], to our knowledge, no studies examined the association between ABI levels and brain alterations such as AD pathologies and cerebrovascular injury in cognitively impaired individuals.
We aimed to investigate the relationship of ABI levels with in vivo AD pathologies and cerebrovascular injury measured by multi-modal brain imaging scans in older adults with cognitiveimpairment (CI).
METHODS
Participants
The present study was part of the Korean Brain Aging Study for the Early Diagnosis and Prediction of Alzheimer’s Disease (KBASE) [11], an ongoing prospective cohort study, which started in 2014. In total, 127 older adults (55–90 years of age) with CI (i.e., 70 mild cognitive impairment (MCI) and 57 AD dementia patients) were included in this study. All individuals with MCI had a Clinical Dementia Rating (CDR) score of 0.5 and met the core clinical criteria for diagnosis of MCI according to the recommendations of the NIA-AA guidelines [12]. For the AD dementia group, participants who fulfilled the following inclusion criteria were recruited: 1) criteria for dementia in accordance with the Diagnostic and Statistical Manual of Mental Disorders 4th Edition (DSM-IV-TR) [13], 2) the criteria for probable AD dementia in accordance with the NIA-AA guidelines [14], and 3) a global CDR score of 0.5 or 1. For both MCI and AD dementia groups, individuals with the following conditions were excluded from the study: 1) presence of major psychiatric illness; 2) significant neurological (e.g., cerebrovascular disease) or medical condition or comorbidities that could affect mental function; 3) contraindications to MRI (e.g., pacemaker, claustrophobia); 4) illiteracy; 5) presence of significant visual/hearing difficulty, and severe communication or behavioral problems that would make clinical examination or brain scan difficult; 6) taking an investigational drug; and 7) pregnant or breastfeeding. Details of the KBASE cohort and recruitment of participants were previously described [11]. The study protocol was approved by the Institutional Review Boards of Seoul National University Hospital (C-1401-027-547) and SNU-SMG Boramae Center (26–2015-60), Seoul, South Korea, and was conducted in accordance with the recommendations of the current version of the Declaration of Helsinki. All participants or their legal representatives provided written informed consent to participate in this study after receiving a complete description of thestudy.
Clinical and neuropsychological assessments
All subjects underwent standardized clinical assessments by trained psychiatrists based on the KBASE clinical assessment protocol which incorporated the Korean version of the Consortium to Establish a Registry for Alzheimer’s Disease Assessment Packet (CERAD-K) [15]. The KBASE neuropsychological assessment protocol incorporating the CERAD-K neuropsychological battery [16] was also administered to all participants by trained neuropsychologist or psychometrists. Reliable informants provided information regarding participants’ cognitive, emotional, and functional changes as well as medical history. A panel of psychiatrists and a clinical neuropsychologist with expertise in dementia research made clinical decisions regarding the CI (i.e., MCI or AD dementia) diagnosisand CDR.
Determining the APOE genotype
Genomic DNA was extracted from venous blood, and apolipoprotein E (APOE) genotyping was performed according to the method described by Wenham et al. [17].
Measurement of ABI
At baseline, SBP in the right arm (brachial artery) and the bilateral ankle (posterior tibial artery) was measured three times in the supine position using a hand-held Doppler device (BIDOP ES-100V3, Hadeco, Inc., Kawasaki, Japan) following the standard protocol [2, 18, 19]. The mean of the three measurements for each ankle and for the right arm was calculated for each individual. ABI was computed by dividing the average of each ankle SBP by the average of the brachial SBP measurements, and the lower ABI value was chosen [2, 18, 19].
Measurement of cerebral Aβ deposition
Participants underwent simultaneous three-dimensional (3D) PiB-PET and 3D T1-weighted MRI using a 3.0T Biograph mMR (PET-MR) scanner (Siemens, Washington DC, USA) according to the manufacturer’s guidelines. Details of PiB-PET image acquisition and preprocessing are presented in the Supplementary Methods. The automatic anatomic labeling algorithm and a region combining method [20] were used to determine regions of interests (ROIs) to characterize the PiB retention level in the frontal, lateral parietal, posterior cingulate-precuneus, and lateral temporal regions. The standardized uptake value ratio (SUVR) values for each ROI were calculated by dividing the mean value for all voxels within each ROI by the mean cerebellar uptake value in the same image. A global cortical ROI consisting of the four ROIs was also defined, and a global Aβ retention value was generated by dividing the mean value for all voxels of the global cortical ROI by the mean cerebellar uptake value in the same image [20, 21]. Each participant was classified as Aβ positive (Aβ+) if the global Aβ retention value was >1.21 or as Aβ negative (Aβ–) if the global Aβ retention value was ≤1.21 [22].
Measurement of AD-signature region neurodegeneration
Participants also received FDG-PET imaging using the same PET-MR machine described above. Details of the [18F] FDG-PET image acquisition and preprocessing are presented in the Supplementary Methods. AD-signature FDG ROIs including the angular gyri, posterior cingulate cortex, and inferior temporal gyri, which are sensitive to alterations associated with AD [23], were determined. AD-signature region cerebral glucose metabolism (AD-CM) was defined as voxel-weighted mean SUVR extracted from the AD-signature FDG ROIs. Details of MR image acquisition and preprocessing are also presented in the Supplementary Methods. AD-signature region cortical thickness (AD-CT) was defined as a mean cortical thickness values obtained from AD-signature regions, including the entorhinal, inferior temporal, middle temporal, and fusiform gyrus, according to a previous study [24].
Measurement of white matter hyperintensities
Participants underwent MRI scans with fluid attenuated inversion recovery (FLAIR) using the same 3.0T PET-MR scanner. We used a previously validated automatic procedure [25] in order to measure white matter hyperintensity (WMH) volume. Details of the volume measurement of WMH are presented in the Supplementary Methods.
Statistical analysis
Referring to previous reports which indicated a U-shape relationship between ABI and cognitive impairment (i.e., the contribution of both low and high ABI to cognitive decline) [8, 9], we divided the ABI into three strata, i.e., low ABI: <1.00, normal ABI: 1.00–1.29, and high ABI: ≥1.30, to identify the ABI level that primarily affects neuroimaging markers. This categorization was based on reports suggesting that an ABI <1.00 may indicate subclinical atherosclerosis in lower extremity arteries [2], and that an ABI value of 1.30 is the cut-off point at which the ABI reflects arterial stiffness [26]. Group differences of participant characteristics between the low ABI, normal ABI, and high ABI groups were analyzed by analysis of variance or chi-squared test. The differences in imaging markers were tested among ABI strata using the general linear model (GLM) analysis with post-hoc tests using the least significant difference (LSD) method (pairwise comparison). The model included age, gender, APOE ɛ4 positivity, and CDR-SOB as covariates. To explore the moderating effects of age [younger (≤70 years) versus older (>70 years)], sex, and APOE ɛ4 positivity on the association between ABI and the neuroimaging biomarker(s), additional GLM analyses were repeated including a two-way interaction term between the ABI strata and each of the factors mentioned above as an additional independent variable. All statistical analyses were conducted using SPSS software (ver. 20.0 for Windows; SPSS Inc., Chicago, IL, USA) and a two-tailed p-value <0.05 was considered significant.
RESULTS
Demographic and clinical characteristics of the subjects
The demographic and clinical characteristics of the subjects are presented in Table 1. There were significant differences for sex, blood pressure, AD-CM, and AD-CT between the low, normal, and high ABI groups. However, age, APOE ɛ4 positivity, CDR (0.5/1), CDR-SOB, MMSE score, global Aβ retention value, or WMH volume did not show significant differences between the three ABI groups.
Table 1
Descriptive statistics by ABI groups
| Characteristics | Total (n = 127) | Low ABI (n = 14) | Normal ABI (n = 87) | High ABI (n = 26) | F/χ2 | p | p for low versus normal ABI | p for low versus high ABI | p for normal versus high ABI |
| Age (y) | 73.17 (7.30) | 75.35 (6.76) | 72.92 (7.18) | 72.81 (8.04) | 0.708 | 0.495 | |||
| Gender (male) | 38 (29.9%) | 8 (57.1%) | 17 (21.8%) | 13 (50.0%) | 14.420 (χ2) | 0.001* | <0.05 | NS | <0.05 |
| Education (y) | 9.82 (5.20) | 10.57 (5.47) | 9.37 (5.14) | 10.92 (5.25) | 1.061 | 0.349 | |||
| APOE ɛ4 (+) | 59 (46.4%) | 5 (35.7%) | 40 (45.9%) | 14 (53.8%) | 1.228 (χ2) | 0.541 | |||
| Systolic BP (mmHg) | 123.54 (17.84) | 120.71 (21.65) | 127.24 (16.96) | 112.69 (14.02) | 7.569 | 0.001* | NS | NS | <0.001 |
| Diastolic BP (mmHg) | 77.09 (10.77) | 72.85 (13.36) | 78.97 (1.035) | 73.08 (9.28) | 4.432 | 0.014* | 0.045 | 0.029 | 0.013 |
| CDR (0.5/1) | 89/38 | 9/5 | 63/24 | 17/9 | 0.724 (χ2) | 0.696 | |||
| CDR (SOB) | 3.12 (1.91) | 3.50 (2.17) | 2.90 (1.81) | 3.68 (2.04) | 1.986 | 0.142 | |||
| MMSE | 19.65 (4.44) | 18.07 (4.20) | 20.08 (4.62) | 19.04 (3.80) | 1.553 | 0.216 | |||
| Diagnosis (MCI/AD) | 70/57 | 7/7 | 52/35 | 11/15 | 2.634 (χ2) | 0.268 | |||
| Global Aβ retention value | 1.76 (0.50) | 1.69 (0.46) | 1.74 (0.50) | 1.86 (0.554) | 0.688 | 0.505 | |||
| AD-CM | 1.36 (0.15) | 1.25 (0.08) | 1.36 (0.15) | 1.36 (0.15) | 3.792 | 0.025* | 0.007 | 0.025 | NS |
| AD-CT | 2.52 (0.29) | 2.37 (0.31) | 2.56 (0.29) | 2.47 (0.25) | 3.053 | 0.051 | 0.026 | NS | NS |
| WMH | 6.01 (5.18) | 6.16 (4.20) | 6.09 (5.35) | 5.60 (5.31) | 0.076 | 0.926 |
ABI, ankle brachial index; APOE, apolipoprotein E; Aβ, cerebral amyloid-β; BP, blood pressure; CDR, Clinical Dementia Rating; SOB, sum of boxes; MMSE, Mini-Mental State Examination; MCI, mild cognitive impairment; AD-CM, Alzheimer’s disease signature regional cerebral glucose metabolism; WMH, white matter hyperintensity; NS, non specific.
Association between the ABI and cerebral Aβ deposition
As shown in Table 2, GLM analysis controlling age, gender, APOE ɛ4 status, and CDR-SOB as covariates showed that the three stratified ABI groups did not have significantly different global Aβ retention.
Table 2
Effect of the ABI on global cerebral Aβ retention, AD-CM, AD-CT, and WMH: Results from GLM analyses
| ABI strata (ABI < 1.00, 1.00∼1.29 and ≥1.30) | |||||
| Neuroimaging markers | Type III SS | df | Mean square | F | p |
| Global Aβ retention value | 0.108 | 1 | 0.054 | 0.259 | 0.772 |
| AD-CM | 0.146 | 1 | 0.073 | 3.634 | 0.029* |
| AD-CT | 0.055 | 1 | 0.027 | 0.496 | 0.610 |
| WMH | 9.476 | 1 | 4.738 | 0.198 | 0.820 |
ABI, ankle brachial index; Aβ, cerebral amyloid-β; AD-CM, AD-signature region cerebral glucose metabolism; AD-CT AD-signature cortical thickness; WMH, white matter hyperintensity; SS, square sum. *p < 0.05, p values by general linear model (GLM) analysis controlling age, gender, APOE ɛ4 positivity, and CDR-SOB as covariates.
Association between the ABI and AD-signature region neurodegeneration
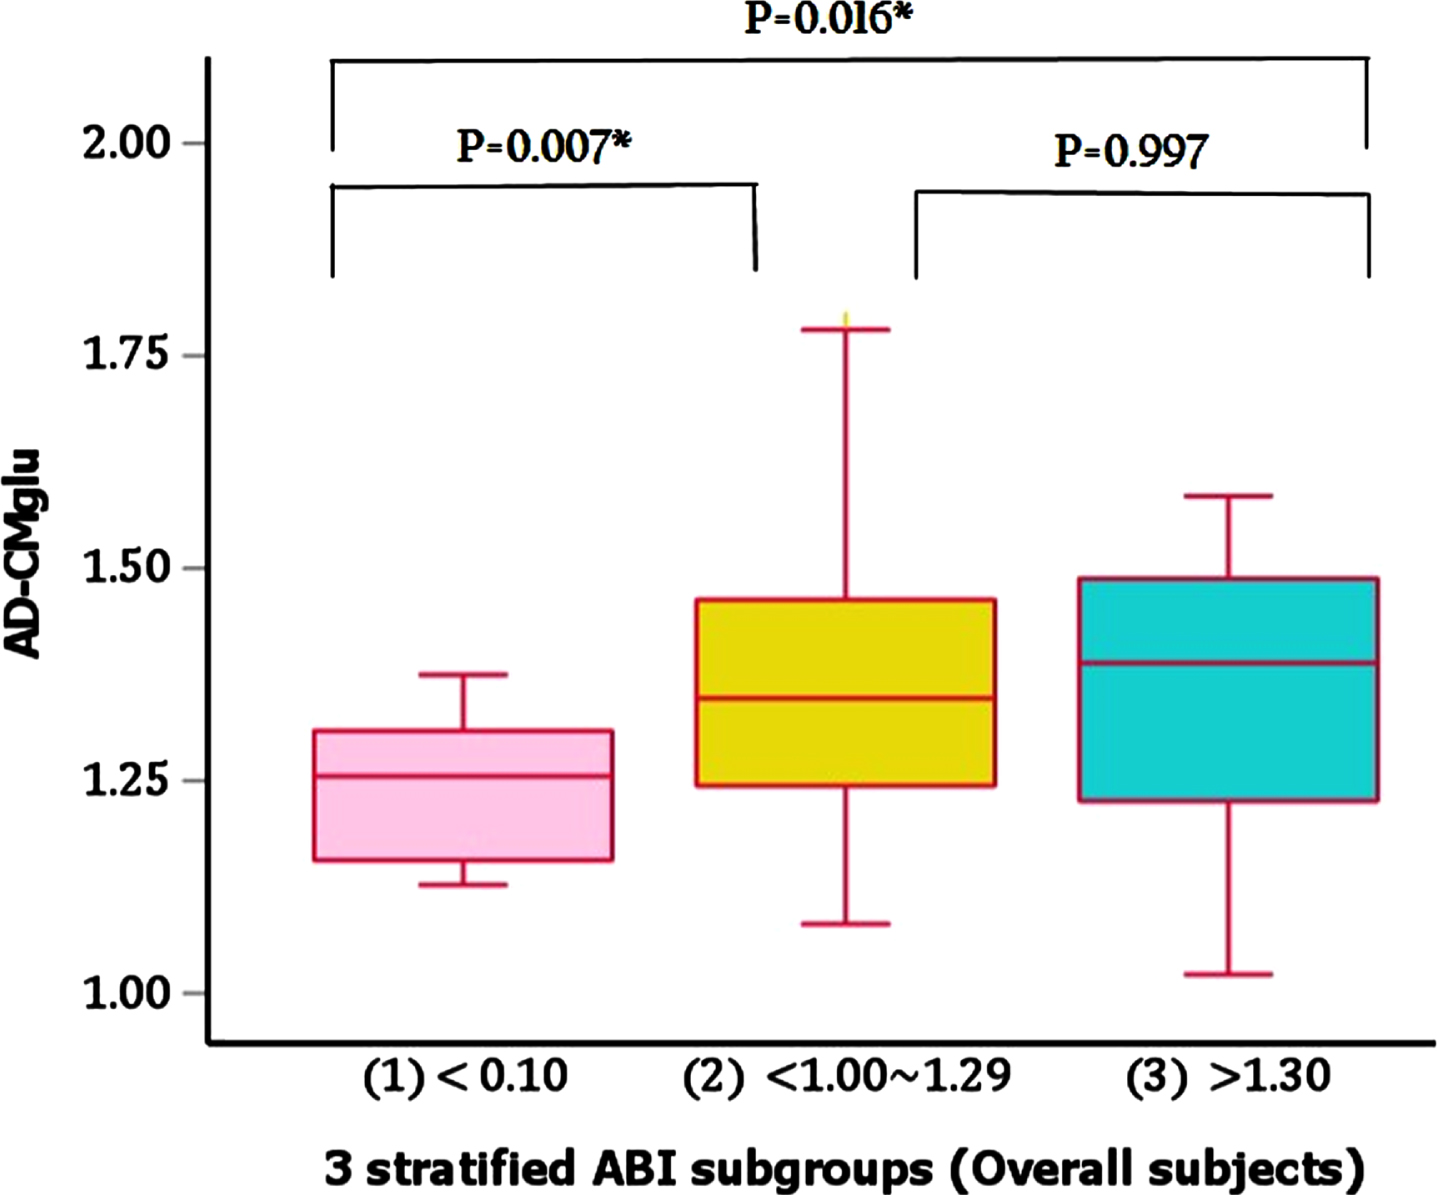
In contrast to the finding for Aβ retention, there were significantly different AD-CM values between the three ABI groups even after controlling age, sex, APOE ɛ4 positivity, and CDR-SOB as covariates (Table 2). The post-hoc comparisons showed that low ABI group had significantly lower AD-CM than both normal and high ABI groups (Fig. 1). In regard of AD-CT, however, we did not find any significant difference between the ABI groups after controlling the same covariates (Table 2).
Fig. 1
Comparisons of AD-CM between 3 stratified ABI subgroups in overall subjects. AD-CMglu, AD-signature region cerebral glucose metabolism; ABI, ankle-brachial index.
Association between the ABI and white matter hyperintensities
There was no significant association of the ABI groups with WMH volume after controlling for age, sex, CDR-SOB, and APOE ɛ4 positivity (Table 2).
Moderation of age, sex, and APOE ɛ4 positivity on the association between ABI and neuroimaging biomarkers
Exploratory analyses demonstrated that there was no significant ABI groups×age (or ABI group×sex or ABI group×APOE ɛ4 positivity) interaction effect on any neuroimaging biomarkers (Table 3).
Table 3
Interaction effect of the ABI strata and APOE ɛ4 positivity (or age, or gender) on neuroimaging biomarkers
| Global Aβ retention | AD-CM | AD-CT | WMH | |||||||||||||||||
| Type III SS | df | MeanSquare | F | p | Type III SS | df | MeanSquare | F | p | Type III SS | df | MeanSquare | F | p | Type III SS | df | MeanSquare | F | p | |
| APOE ɛ4 | 1.959 | 1 | 1.959 | 9.239 | 0.003 | 0.005 | 1 | 0.005 | 0.255 | 0.615 | 0.060 | 1 | 0.060 | 1.064 | 0.305 | 44.533 | 1 | 44.533 | 1.835 | 0.178 |
| ABI_s | 0.013 | 2 | 0.006 | 0.030 | 0.970 | 0.107 | 2 | 0.054 | 2.633 | 0.076 | 0.020 | 2 | 0.010 | 0.176 | 0.839 | 7.566 | 2 | 3.783 | 0.156 | 0.856 |
| ABI_s×APOE ɛ4 status | 0.131 | 2 | 0.066 | 0.310 | 0.734 | 0.005 | 2 | 0.003 | 0.124 | 0.884 | 0.032 | 2 | 0.016 | 0.283 | 0.754 | 7.265 | 2 | 3.632 | 0.150 | 0.861 |
| APOE ɛ4 | 3.667 | 1 | 3.667 | 17.589 | <0.001 | 0.024 | 1 | 0.024 | 1.207 | 0.274 | 0.091 | 1 | 0.091 | 1.618 | 0.206 | 71.732 | 1 | 71.732 | 2.952 | 0.089 |
| ABI_s | 0.537 | 2 | 0.269 | 1.289 | 0.279 | 0.011 | 2 | 0.006 | 0.276 | 0.759 | 0.039 | 2 | 0.020 | 0.349 | 0.706 | 4.173 | 2 | 2.086 | 0.086 | 0.918 |
| ABI_s×age | 0.545 | 2 | 0.273 | 1.307 | 0.274 | 0.018 | 2 | 0.009 | 0.455 | 0.635 | 0.039 | 2 | 0.020 | 0.352 | 0.704 | 3.283 | 2 | 1.641 | 0.068 | 0.935 |
| APOE ɛ4 | 3.564 | 1 | 3.564 | 16.946 | <0.001 | 0.022 | 1 | 0.022 | 1.062 | 0.305 | 0.097 | 1 | 0.097 | 1.750 | 0.189 | 80.717 | 1 | 80.717 | 3.473 | 0.065 |
| ABI_s | 0.379 | 2 | 0.189 | 0.901 | 0.409 | 0.035 | 2 | 0.017 | 0.861 | 0.426 | 0.156 | 2 | 0.078 | 1.411 | 0.248 | 18.670 | 2 | 9.335 | 0.402 | 0.670 |
| ABI_s×gender | 0.329 | 2 | 0.165 | 0.783 | 0.460 | 0.016 | 2 | 0.008 | 0.401 | 0.670 | 0.108 | 2 | 0.054 | 0.971 | 0.382 | 112.663 | 2 | 56.332 | 2.424 | 0.094 |
ABI, ankle brachial index; Aβ, cerebral amyloid-β; AD-CM, AD-signature region cerebral glucose metabolism; AD-CT, AD-signature cortical thickness; WMH, white matter hyperintensity; APOE, apolipoprotein E; SS, square sum; ABI strata, ABI <1.00, 1.00∼1.29 and ≥1.30; CDR, Clinical Dementia Rating; SOB, sum of boxes. *p < 0.05, p values by general linear model (GLM) analysis controlling age, gender, APOE ɛ4 positivity, and CDR-SOB as covariates.
DISCUSSION
In the present study, we found that low ABI group had significantly lower AD-CM than the other ABI groups after controlling for the effects of CDR-SOB, a measure of functional severity by cognitive impairment, as well as age, sex, and APOE ɛ4 positivity. The finding is comparable with the previous reports that a low ABI was related to an increased risk of cognitive impairment or dementia syndrome including AD dementia [2, 5, 7, 27]. This probably corresponds to the left side of the U-shaped relationship found previously between the ABI and cognitive impairment [8]. Given that a lower ABI is an indicator of generalized atherosclerosis [1, 2] including atherosclerosis in the brain [28, 29], cerebral atherosclerosis may causes a lowered cerebral perfusion, which can induce subsequent brain hypometabolism through reduced oxygen supply [5, 28].
In contrast to AD-CM, neither AD-CT nor WMH volume was related to low ABI. This may be explained by the fact that we excluded subjects with a history of stroke or severe vascular lesions including infarcts and hemorrhages on brain MRI from the current study. Such strict application of exclusion criteria might result in ruling out subjects with severe cerebral atherosclerosis. In line with this, the number of subjects with a low ABI was relatively small (n = 11, 11.0%). Subsequently, it would be hard to detect the structural brain changes such as decrease of AD-CT and increase of WMH volume due to severe atherosclerosis.
There was no significant association between ABI and brain amyloid deposition. Such lack of significant finding for CI individuals in the present study appears contrast to our previous report for the association between high ABI and increased cerebral amyloid deposition in cognitively normal (CN) old adults [10]. This discrepancy may be due to the different range of cerebral amyloid accumulation levels between CN and CI individuals. Cerebral Aβ deposition begins 10–20 years before development of AD dementia [30]. It gradually increases in the stage of CN and reaches a state of near saturation in the stages of MCI and dementia, i.e., CI stage [31, 32]. Therefore, detection of an association between ABI and cerebral Aβ deposition may be difficult in CI comparedto CN.
To the best of our knowledge, this study is the first to show association between low ABI and decreased AD-CM in CI individuals. Nevertheless, several limitations needed to be mentioned. First, as this was a cross-sectional study, causal relationship cannot be inferred. Further longitudinal studies are needed. Second, the relatively small number of subjects with abnormal ABI, low ABI subjects in particular, was included. This may have made it difficult to detect a weak association between ABI and brain biomarker. Third, there was a significant gender difference between normal ABI and low/high ABI groups in our participants. The difference could potentially affect the results. However, we statistically controlled gender as a covariates when analyzing between-ABI group difference of neuroimaging makers to minimize such potential confounding effect of it. In addition, we did not find any moderation effect of gender on the relationship between ABI group and neuroimaging markers as shown in Table 3. Given together, it is not likely that our findings were affected by between-group gender difference. Finally, only Asians (specifically Koreans) were included in this study. The prevalence of abnormal ABI status or peripheral arterial disease is lower in Asian or white older adults than black ones [33]. Given such ethnic difference for ABI and related arterial conditions, our observations need to be replicated further in other ethnic populations.
In conclusion, the present findings suggest that lower ABI, probably related to cerebral atherosclerosis, may contribute to hypometabolism of AD-related brain regions in cognitively impaired older individuals.
FUNDING
This study was supported by a grant from the Ministry of Science and ICT, Republic of Korea (grant No: NRF-2014M3C7A1046042), a grant from the Ministry of Health & Welfare, Republic of Korea (HI18C0630 & HI19C0149), a grant from the Seoul National University Hospital, Republic of Korea (No. 3020200030) and a grant from the National Institute of Aging, United States of America (U01AG072177). The funding source had no role in the study design, data collection, data analysis, data interpretation, writing of the manuscript, or decision to submit it for publication.
CONFLICT OF INTEREST
The authors have no conflict of interest to report.
DATA AVAILABILITY
The data of the current study are not freely accessible because the IRB of Seoul National University Hospital prohibits public data-sharing for privacy reasons. However, the data can be available from the independent data-sharing committee of the KBASE research group on reasonable request after approval by the IRB. Requests for data access can be submitted to the administrative coordinator of the KBASE group by e-mail (E-mail: [email protected].), who is independent of the authors.
ACKNOWLEDGMENTS
We thank all the members of the KBASE Research Group for their contribution. Members of the KBASE Research Group are listed elsewhere http://kbase.kr. We also sincerely thank the subjects for their participation in this study.
SUPPLEMENTARY MATERIAL
[1] The supplementary material is available in the electronic version of this article: https://dx.doi.org/10.3233/JAD-220911.
REFERENCES
[1] | Fowkes FGR ((1988) ) The measurement of atherosclerotic peripheral arterial-disease in epidemiological surveys, Int J Epidemiol 17: , 248–254. |
[2] | Laurin D , Masaki KH , White LR , Launer LJ ((2007) ) Ankle-to-brachial index and dementia: The Honolulu-Asia Aging Study, Circulation 116: , 2269–2274. |
[3] | Sutton-Tyrrell K , Venkitachalam L , Kanaya AM , Boudreau R , Harris T , Thompson T , Mackey RH , Visser M , Vaidean GD , Newman AB ((2008) ) Relationship of ankle blood pressures to cardiovascular events in older adults, Stroke 39: , 863–869. |
[4] | Rabkin SW , Chan SH , Sweeney C ((2012) ) Ankle-brachial index as an indicator of arterial stiffness in patients without peripheral artery disease, Angiology 63: , 150–154. |
[5] | van Oijen M , de Jong FJ , Witteman JC , Hofman A , Koudstaal PJ , Breteler MM ((2007) ) Atherosclerosis and risk for dementia, Ann Neurol 61: , 403–410. |
[6] | Oh YS , Kim JS , Park JW , An JY , Park SK , Shim YS , Yang DW , Lee KS ((2016) ) Arterial stiffness and impaired renal function in patients with Alzheimer’s disease, Neurol Sci 37: , 451–457. |
[7] | Guerchet M , Aboyans V , Nubukpo P , Lacroix P , Clement JP , Preux PM ((2011) ) Ankle-brachial index as a marker of cognitive impairment and dementia in general population. A systematic review, Atherosclerosis 216: , 251–257. |
[8] | Espeland MA , Beavers KM , Gibbs BB , Johnson KC , Hughes TM , Baker LD , Jakicic J , Korytkowski M , Miller M , Bray GA ((2015) ) Ankle-brachial index and inter-artery blood pressure differences as predictors of cognitive function in overweight and obese older adults with diabetes: Results from the Action for Health in Diabetes movement and memory study, Int J Geriatr Psychiatry 30: , 999–1007. |
[9] | Wohlfahrt P , Palous D , Ingrischova M , Krajcoviechova A , Seidlerova J , Galovcova M , Bruthans J , Jozifova M , Adamkova V , Filipovsky J , Cifkova R ((2011) ) A high ankle-brachial index is associated with increased aortic pulse wave velocity: The Czech post-MONICA study, Eur J Cardiovasc Prev Rehabil 18: , 790–796. |
[10] | Moon SW , Byun MS , Yi D , Lee JH , Jeon SY , Lee Y , Kee BS , Lee DY , Group KR ((2019) ) The ankle-brachial index is associated with cerebral beta-amyloid deposition in cognitively normal older adults, J Gerontol A Biol Sci Med Sci 74: , 1141–1148. |
[11] | Byun MS , Yi D , Lee JH , Choe YM , Sohn BK , Lee JY , Choi HJ , Baek H , Kim YK , Lee YS , Sohn CH , Mook-Jung I , Choi M , Lee YJ , Lee DW , Ryu SH , Kim SG , Kim JW , Woo JI , Lee DY , Group KR ((2017) ) Korean Brain Aging Study for the early diagnosis and prediction of Alzheimer’s disease: Methodology and ine sample characteristics, Psychiatry Investig 14: , 851–863. |
[12] | Albert MS , DeKosky ST , Dickson D , Dubois B , Feldman HH , Fox NC , Gamst A , Holtzman DM , Jagust WJ , Petersen RC , Snyder PJ , Carrillo MC , Thies B , Phelps CH ((2011) ) The diagnosis of mild cognitive impairment due to Alzheimer’s disease: Recommendations from the National Institute on Aging-Alzheimer’s Association workgroups on diagnostic guidelines for Alzheimer’s disease, Alzheimers Dement 7: , 270–279. |
[13] | American Psychiatric Association ((2000) ) Diagnostic and Statistical Manual of Mental Disorders: DSM-IV-TR. American Psychiatric Association Press, Washington, DC.(2000) Diagnostic criteria from DSM-IV-TR, American Psychiatric Association, Washington, DC. |
[14] | McKhann GM , Knopman DS , Chertkow H , Hyman BT , Jack CR Jr , Kawas CH , Klunk WE , Koroshetz WJ , Manly JJ , Mayeux R , Mohs RC , Morris JC , Rossor MN , Scheltens P , Carrillo MC , Thies B , Weintraub S , Phelps CH ((2011) ) The diagnosis of dementia due to Alzheimer’s disease: Recommendations from the National Institute on Aging-Alzheimer’s Association workgroups on diagnostic guidelines for Alzheimer’s disease, Alzheimers Dement 7: , 263–269. |
[15] | Lee JH , Lee KU , Lee DY , Kim KW , Jhoo JH , Kim JH , Lee KH , Kim SY , Han SH , Woo JI ((2002) ) Development of the Korean version of the Consortium to Establish a Registry for Alzheimer’s Disease Assessment Packet (CERAD-K): Clinical and neuropsychological assessment batteries, J Gerontol B Psychol Sci Soc Sci 57: , P47–P53. |
[16] | Lee DY , Lee KU , Lee JH , Kim KW , Jhoo JH , Kim SY , Yoon JC , Woo SI , Ha J , Woo JI ((2004) ) A normative study of the CERAD neuropsychological assessment battery in the Korean elderly, J Int Neuropsychol Soc 10: , 72–81. |
[17] | Wenham PR , Price WH , Blandell G ((1991) ) Apolipoprotein E genotyping by one-stage PCR, Lancet 337: , 1158–1159. |
[18] | Curb JD , Masaki K , Rodriguez BL , Abbott RD , Burchfiel CM , Chen R , Petrovitch H , Sharp D , Yano K ((1996) ) Peripheral artery disease and cardiovascular risk factors in the elderly. The Honolulu Heart Program, Arterioscler Thromb Vasc Biol 16: , 1495–1500. |
[19] | Abbott RD , Rodriguez BL , Petrovitch H , Yano K , Schatz IJ , Popper JS , Masaki KH , Ross GW , Curb JD ((2001) ) Ankle-brachial blood pressure in elderly men and the risk of stroke: The Honolulu Heart Program, J Clin Epidemiol 54: , 973–978. |
[20] | Reiman EM , Chen K , Liu X , Bandy D , Yu M , Lee W , Ayutyanont N , Keppler J , Reeder SA , Langbaum JB , Alexander GE , Klunk WE , Mathis CA , Price JC , Aizenstein HJ , DeKosky ST , Caselli RJ ((2009) ) Fibrillar amyloid-beta burden in cognitively normal people at 3 levels of genetic risk for Alzheimer’s disease, Proc Natl Acad Sci U S A 106: , 6820–6825. |
[21] | Choe YM , Sohn BK , Choi HJ , Byun MS , Seo EH , Han JY , Kim YK , Yoon EJ , Lee JM , Park J , Woo JI , Lee DY ((2014) ) Association of homocysteine with hippocampal volume independent of cerebral amyloid and vascular burden, Neurobiol Aging 35: , 1519–1525. |
[22] | Villeneuve S , Rabinovici GD , Cohn-Sheehy BI , Madison C , Ayakta N , Ghosh PM , La Joie R , Arthur-Bentil SK , Vogel JW , Marks SM , Lehmann M , Rosen HJ , Reed B , Olichney J , Boxer AL , Miller BL , Borys E , Jin LW , Huang EJ , Grinberg LT , DeCarli C , Seeley WW , Jagust W ((2015) ) Existing Pittsburgh Compound-B positron emission tomography thresholds are too high: Statistical and pathological evaluation, Brain 138: , 2020–2033. |
[23] | Jack CR Jr. , Wiste HJ , Weigand SD , Rocca WA , Knopman DS , Mielke MM , Lowe VJ , Senjem ML , Gunter JL , Preboske GM , Pankratz VS , Vemuri P , Petersen RC ((2014) ) Age-specific population frequencies of cerebral beta-amyloidosis and neurodegeneration among people with normal cognitive function aged 50-89 years: A cross-sectional study, Lancet Neurol 13: , 997–1005. |
[24] | Jack CR Jr. , Wiste HJ , Weigand SD , Knopman DS , Mielke MM , Vemuri P , Lowe V , Senjem ML , Gunter JL , Reyes D , Machulda MM , Roberts R , Petersen RC ((2015) ) Different definitions of neurodegeneration produce similar amyloid/neurodegeneration biomarker group findings, Brain 138: , 3747–3759. |
[25] | Tsai JZ , Peng SJ , Chen YW , Wang KW , Li CH , Wang JY , Chen CJ , Lin HJ , Smith EE , Wu HK , Sung SF , Yeh PS , Hsin YL ((2014) ) Automated segmentation and quantification of white matter hyperintensities in acute ischemic stroke patients with cerebral infarction, PLoS One 9: , e104011. |
[26] | Hiatt WR ((2001) ) Medical treatment of peripheral arterial disease and claudication, N Engl J Med 344: , 1608–1621. |
[27] | Price JF , McDowell S , Whiteman MC , Deary IJ , Stewart MC , Fowkes FG ((2006) ) Ankle brachial index as a predictor of cognitive impairment in the general population: Ten-year follow-up of the Edinburgh Artery Study, J Am Geriatr Soc 54: , 763–769. |
[28] | de la Torre JC ((2004) ) Is Alzheimer’s disease a neurodegenerative or a vascular disorder? Data, dogma, and dialectics, Lancet Neurol 3: , 184–190. |
[29] | Weitz JI , Byrne J , Clagett GP , Farkouh ME , Porter JM , Sackett DL , Strandness DE Jr , Taylor LM ((1996) ) Diagnosis and treatment of chronic arterial insufficiency of the lower extremities: A critical review, Circulation 94: , 3026–3049. |
[30] | Holtzman DM , Morris JC , Goate AM ((2011) ) Alzheimer’s disease: The challenge of the second century, Sci Transl Med 3: , 77sr71. |
[31] | Sperling RA , Aisen PS , Beckett LA , Bennett DA , Craft S , Fagan AM , Iwatsubo T , Jack CR Jr , Kaye J , Montine TJ , Park DC , Reiman EM , Rowe CC , Siemers E , Stern Y , Yaffe K , Carrillo MC , Thies B , Morrison-Bogorad M , Wagster MV , Phelps CH ((2011) ) Toward defining the preclinical stages of Alzheimer’sdisease: Recommendations from the National Institute onAging-Alzheimer’s Association workgroups on diagnostic guidelinesfor Alzheimer’s disease, Alzheimers Dement 7: , 280–292. |
[32] | Jack CR Jr , Knopman DS , Jagust WJ , Shaw LM , Aisen PS , Weiner MW , Petersen RC , Trojanowski JQ ((2010) ) Hypothetical model of dynamic biomarkers of the Alzheimer’s pathological cascade, Lancet Neurol 9: , 119–128. |
[33] | Vitalis A , Lip GY , Kay M , Vohra RK , Shantsila A ((2017) ) Ethnic differences in the prevalence of peripheral arterial disease: A systematic review and meta-analysis, Expert Rev Cardiovasc Ther 15: , 327–338. |

