
Impaired Early Insulin Response to Glucose Load Predicts Episodic Memory Decline: A 10-Year Population-Based Cohort Follow-Up of 45–74-Year-Old Men and Women
Abstract
Background:
Diabetes increases the risk for cognitive decline, but the mechanisms behind this association remain unknown. Impaired early insulin secretion in elderly men and insulin resistance, both of which are pathophysiological features of type 2 diabetes, have previously been linked to Alzheimer’s disease.
Objective:
To examine if the early insulin response to oral glucose load predicts cognitive performance after 10 years in men and women aged 45-74 years.
Methods:
This study was based on a subpopulation of the Health 2000 Survey, a Finnish nationwide, population-based health examination study, and its follow-up, the Health 2011 Study. In total, 961 45–74-year-old individuals (mean age at baseline 55.6 years, 55.8% women) were examined. An oral glucose tolerance test was performed in 2001–2002, and early insulin response was defined as the ratio of the 30-min increment in insulin concentration to that of glucose concentration. Cognitive function was evaluated at baseline and follow-up with categorical verbal fluency, word-list learning, and word-list delayed recall. Statistical analyses were performed using multivariable linear models adjusted for age, sex, education, APOE &z.epsi;4 genotype, vascular risk factors including diabetes, and depressive symptoms.
Results:
A lower early insulin response to glucose load predicted lower performance (β: 0.21, p = 0.03) and greater decline (β: 0.19, p = 0.03) in the word-list delayed recall test. Baseline early insulin response did not predict verbal fluency or word-list learning (all p-values≥0.13).
Conclusion:
Our results suggest that decreased early insulin secretion predicts episodic memory decline in middle-aged to elderly men and women.
INTRODUCTION
Diabetes increases the risk for cognitive decline and Alzheimer’s disease, the most common cause of dementia [1, 2], but the underlying biological mechanisms are not fully understood. There are a number of studies on glucose regulation and cognitive decline, but the results have been somewhat inconsistent [3, 4]. According to a systematic review, higher levels of glycemia are weakly associated with cognitive decline among people with type 2 diabetes [5]. Consistently, among people without diabetes, higher glucose levels are associated with weaker cognitive function [6], faster cognitive decline [3], and an increased risk of dementia [7]. A recent study did not find shared genetic risk factors for diabetes and Alzheimer’s disease [8]. Further, no increase in neuritic plaques or neurofibrillary tangles has been found in individuals with diabetes in large neuropathological studies [9, 10]. However, a recent large population-based study showed that diabetes is related to amyloid-β burden measured with positron emission tomography (PET) in non-demented adults [11].
It has been suggested that cognitive decline associated with diabetes would be determined by multiple etiologies [12, 13]. Presumably, the risk for cognitive decline begins increasing before blood glucose levels reach diabetic thresholds, i.e., at prediabetic stages [12]. Conditions related to prediabetes already, such as obesity, the metabolic syndrome, and insulin resistance, are linked to a heightened risk of cognitive impairment, dementia, and Alzheimer’s disease [12, 14–18].
Impaired insulin secretion and insulin resistance are the hallmarks of prediabetes and type 2 diabetes. Several previous studies have found an association between insulin resistance and cognitive decline or Alzheimer’s disease [14, 15, 18, 19]. However, less is known about the relationship between impaired insulin secretion and the risk for cognitive decline. Pancreatic β-cell dysfunction, leading to impaired insulin secretion, occurs already at prediabetic stages [20, 21] and impaired early insulin secretion is an independent predictor of future type 2 diabetes [22, 23]. A previous study has shown that a low early insulin response to oral glucose challenge, a marker of pancreatic β-cell function and first-phase insulin secretion, is associated with an increased risk for Alzheimer’s disease, but the study population included men only [24].
We have previously reported that the homeostasis model of insulin resistance (HOMA-IR), an estimate of insulin resistance, predicts cognitive decline [14, 15] and that insulin resistance at midlife predicts brain amyloid deposition after 15 years [25]. We have also shown that the 2-h post-load glucose value in the 2-h oral glucose tolerance test predicts episodic memory decline after 10 years [26]. The present study aimed to examine, based on previous studies, if early insulin response to oral glucose load can predict cognitive decline. We hypothesized that a lower early insulin response to oral glucose load would be associated with cognitive decline after 10 years. To test this hypothesis, we studied 961 middle-aged men and women who participated in the Finnish population-based Health 2000 survey, its supplemental examinations, and its follow-up study, the Health 2011 survey.
MATERIALS AND METHODS
Participants
Participants included in the present study had attended the Finnish Health 2000 Examination Survey, its in-depth examinations on a subpopulation in 2001–2002, and the Health 2011 follow-up survey conducted by the Finnish National Institute for Health and Welfare [27, 28].
The Health 2000 survey was a comprehensive, nationwide, population-based survey carried out in 2000–2001. Altogether 8,028 adults living in Finland, aged 30 and over, were randomly selected from the Finnish population registry. In total 84% (n = 6,770) participated in the examinations [27]. A subsample of the main study population was invited to take further examinations in 2001–2002 to study cardiovascular health and diabetes more thoroughly. From those who had participated in the Health 2000 examination, those who were aged 45–74, and who lived near one of the five central university hospital cities in Finland (n = 1,867), were invited to the supplemental cardiovascular investigation. Altogether 1,526 (82% of the invited) attended the supplemental survey [29] (Fig. 1). All the individuals who had been invited to the original Health 2000 Survey, who were still living, who lived in Finland, and who had not refused to participate, were invited to participate in the Health 2011 follow-up survey [28].
Fig. 1
Flow chart of the study population.
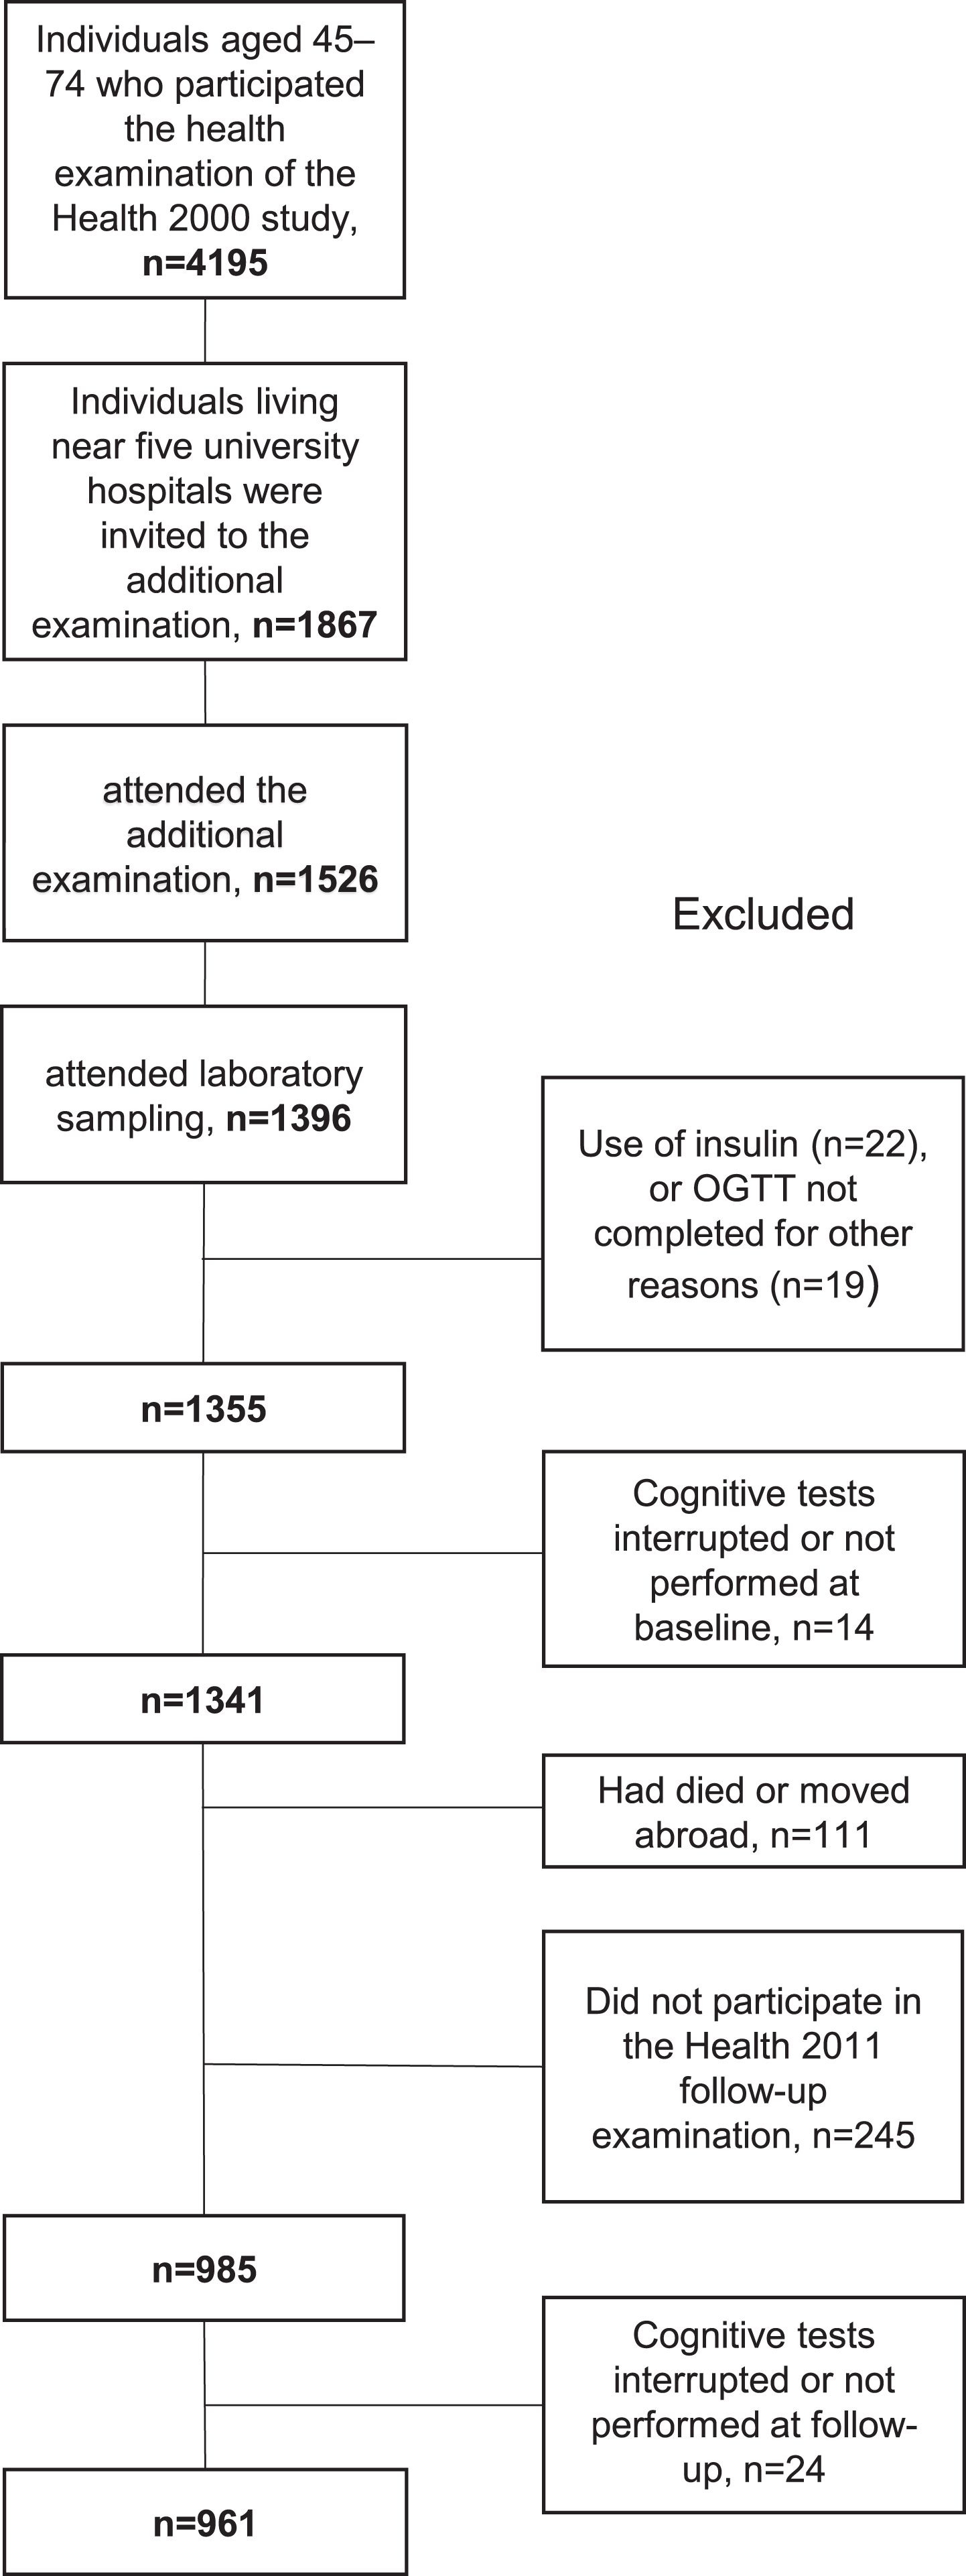
The present study’s population consists of those who had participated in all three examinations. Those who did not undergo an oral glucose tolerance test due to the use of insulin (n = 22) or other reasons (n = 19), were excluded from this study, as well as those with missing cognitive test results at baseline (n = 14) or follow-up (n = 24). Altogether 111 individuals had died or were lost to follow-up. The total number of participants included in the present study is 961. (Fig. 1).
The Ethics Committee for epidemiology and public health in the hospital district of Helsinki and Uusimaa, Finland approved the studies. Written informed consent was obtained from all of the participants before attending the studies.
Baseline measurements
In the Health 2000 Survey, the APOE genotype was determined with a protocol that has been described previously [30]. Those with one or two &z.epsi;4 alleles were regarded as APOE &z.epsi;4-carriers. Information about the participants’ education and smoking status was obtained through interviews and questionnaires. Possible depressive symptoms were evaluated with the Beck depression inventory (BDI) [31]. HbA1c was analyzed as previously reported [14].
In the supplemental cardiovascular examinations in 2001–2002, body mass index (BMI) was determined, and blood pressure (BP) was measured in a sitting position from the right arm three times with the oscillometric OMRON M4 blood pressure measuring device (Omron Matsusaka Co, Japan, OMRON Healthcare Europe B.V., Hoofddorp, The Netherlands) [29]. The mean of three measurements was used in the analyses. Hypertension was defined as systolic BP≥140 or diastolic BP≥90 mmHg or the use of antihypertensive treatment. Information about the participants’ medical history and medication was obtained through interviews and questionnaires. Blood samples were drawn after an overnight fast of 10–12 h. Serum fasting cholesterol [32], glucose, and insulin values [33] were determined as previously reported. Individuals with serum total cholesterol > 6.5 or cholesterol-lowering pharmaceuticals were considered to have hypercholesterolemia. An oral glucose tolerance test was performed according to international guidelines [34]. Participants were given a glucose solution of 300 ml containing 75 g of glucose and water, and blood samples were drawn before and at 30 and 120 minutes after the glucose load. Plasma glucose concentrations were determined by the glucose dehydrogenase method (Diagnostica Merck, Darmstadt, Germany) in an automated clinical chemistry analyzer (Thermo Clinical Labsystems, Konelab, Vantaa, Finland), and plasma insulin concentrations were measured with an RIA kit (Phadeseph insulin RIA; Pharmacia, Uppsala, Sweden) as previously reported [33]. Early insulin response to a glucose load was defined as the ratio of the 30-min increment in insulin concentration (30-min insulin minus fasting insulin) to the 30-min increment in glucose concentration (30-min glucose minus fasting glucose) [24]. HOMA-IR was calculated using the equation fasting insulin (μU/ml) times fasting glucose (mmol/l) divided by 22.5 [35].
Cognitive tests
Categorical verbal fluency, word-list learning, and word-list delayed recall tests from the Finnish version of the CERAD (Consortium to Establish a Registry for Alzheimer’s Disease) test battery [36, 37] were used to evaluate cognitive function at baseline and follow-up [26, 28, 29]. The procedures regarding cognitive testing in the Health 2000 and 2011 studies have been described in detail earlier [14, 28, 29]. The changes in verbal fluency, word-list learning, and word-list delayed recall test results during the follow-up were calculated as cognitive test scores in 2011 minus cognitive test scores in 2000. Thus, a negative change indicates a decline in test scores during the follow-up and a positive change indicates that the person performed better at the follow-up.
Statistical analyses
Logarithmic transformation was used to achieve a normal distribution of the non-normally distributed variables (insulin values, early insulin response, HOMA-IR, and BDI score).
For descriptive purposes only, the study population was divided into three groups (normal glucose metabolism, impaired fasting glucose (IFG) or impaired glucose tolerance (IGT), and diabetes) according to World Health Organization criteria for IFG, IGT, and diabetes [34]. Normal glucose metabolism was defined as no use of diabetes medication, and fasting glucose < 6.1 mmol/l, and 2-h post-load glucose value < 7.8 mmol/l. IFG was defined as no use of diabetes medication, and fasting glucose 6.1-6.9 mmol/l, and a 2-h post-load glucose value < 7.8 mmol/l. IGT was defined as no use of oral diabetes medication, fasting glucose < 7.0 mmol/l, and 2-h post-load glucose value≥7.8 mmol/l and < 11.1 mmol/l. Individuals using diabetes medication or with fasting glucose≥7.0 mmol/l or 2-h post-load glucose value≥11.1 mmol/l were categorized as having type 2 diabetes. p-values for differences between the three groups were assessed with Oneway Anova for continuous variables and with Chi Squared test for categorical variables. Multiple comparison p-values were calculated using Tukey’s HSD for continuous variables and using Bonferroni corrections for categorical variables. Additionally, participants with IFG and IGT were compared with a two-sample t-test for continuous variables and with Pearson’s Chi-Squared test for categorical variables. In all further analyses, insulin values, early insulin response, and HOMA-IR were handled as continuous variables.
Associations between the explanatory variables (insulin values, early insulin response, HOMA-IR) and cognitive test scores at follow-up, as well as the associations between the explanatory variables and the change in cognitive test results, were studied using multivariable linear models. The analyses were adjusted for known risk factors for cognitive decline. The adjustments were similar to those used in our previously published study evaluating the association between 2-h post-load glucose and cognitive performance [26]. First, the analyses were adjusted for age, sex, and duration of education. Then the analyses were further adjusted for APOE &z.epsi;4 genotype, type 2 diabetes, hypertension, hypercholesterolemia, BMI, BDI score, and smoking status. The analyses regarding the change in cognitive test scores (from 2000 to 2011) were additionally adjusted for baseline cognitive test results. [26] We also performed sensitivity analyses excluding those with treated diabetes. The normality assumptions of the analyses were verified from the residuals.
The differences between the 45–74-year-old individuals of the main Health 2000 study and those included in this study were analyzed by Student’s t-test for continuous variables and Pearson’s Chi-Squared test for categorical variables. The differences between those who dropped out from the follow-up study and those who completed the follow-up study were analyzed similarly.
Statistical significance was set at p < 0.05. SAS JMP Pro 14 (SAS Institute, Cary; NC, USA) was used to the statistical analyses.
Interactions
Age, sex, APOE &z.epsi;4 genotype, and type 2 diabetes interactions for fasting insulin, 2-h insulin, and early insulin response on the cognitive test results at follow-up were analyzed in the age, sex, and education adjusted model. The interaction ‘2-hour insulin x APOE &z.epsi;4’ was significant for word-list recall in 2011 (p = 0.01), and therefore the analysis was stratified by APOE genotype. Other interactions were insignificant (all p-values≥0.06).
RESULTS
Demographics
Characteristics of the study population according to three glucose tolerance groups are shown in Table 1. Participants with type 2 diabetes were older, less educated, and had higher systolic BP and higher BMI compared to those with normal glucose metabolism. Participants with IFG/IGT were older and had higher systolic BP and higher BMI than those with normal glucose metabolism. Participants with type 2 diabetes had higher systolic BP and BMI compared to participants with IFG/IGT. Participants with IFG/IGT had higher 30-min insulin values than participants with normal glucose metabolism and participants with diabetes, but there was no difference between normal glucose metabolism and type 2 diabetes groups in the 30-min insulin values (Table 1). Compared to those with IGT, participants with IFG were more frequently men (p = 0.04) and had lower 2-h insulin (p < 0.0001). There were no differences between the IFG and IGT groups in fasting or 30-min insulin levels (p≥0.90), early insulin response (p = 0.59), HOMA-IR (p = 0.19), HbA1c (p = 0.92), total cholesterol (p = 0.16), systolic blood pressure (p = 0.07), or BMI (p = 0.33) (data not shown).
Table 1
Characteristics of the study population according to three glucose tolerance groups
| Normal glucose | IFG (n = 94) or | Type 2 diabetes | p | |
| metabolism | IGT (n = 161) | N = 84 | ||
| N = 622 | N = 255 | |||
| Age | 54.8 (7.3) | 56.9 (7.5)*** | 57.5 (7.1)** | <0.0001 |
| Women, n (%) | 380 (61.1) | 114 (44.7)*** | 42 (50) | <0.0001 |
| Years of education | 11.8 (3.9) | 11.2 (3.8) | 10.5 (3.4)** | 0.001 |
| APOE &z.epsi;4 genotype, n (%) | 199 (33.4) | 75 (31.1) | 30 (36.1) | 0.67 |
| Fasting glucose (mmol/l), median (Q1, Q3) | 5.4 (5.1, 5.6) | 6.1 (5.7, 6.3)*** | 7.1 (6.6, 8.0)*** ††† | <0.0001 |
| 30 min glucose (mmol/l) in OGGT, median (Q1, Q3) | 8.0 (7.1, 8.8) | 9.5 (8.7, 10.2)*** | 11.3 (9.8, 13.1)*** ††† | <0.0001 |
| 2 h glucose (mmol/l) in OGTT, median (Q1, Q3) | 5.6 (4.7, 6.5) | 8.1 (6.6, 9.0)*** | 12.9 (11.4, 16.1)*** ††† | <0.0001 |
| Fasting insulin (mU/l), median (Q1, Q3) | 6.5 (5.0, 8.5) | 9.5 (6.9, 13.2)*** | 12.5 (9.6, 17.3)*** ††† | <0.0001 |
| 30 min insulin (mU/l) in OGTT, median (Q1, Q3) | 39 (28, 55) | 47 (30, 65)** | 38 (28, 57.) | 0.002 |
| 2 h insulin (mU/l) in OGTT, median (Q1, Q3) | 30 (20, 43) | 54 (35, 85)*** | 64 (41, 112)*** | <0.0001 |
| Early insulin response (mU/mmol), median (Q1, Q3) | 12.7 (8.5, 21.0) | 10.4 (7.2, 15.1)*** | 6.7 (4.4, 9.9)*** ††† | <0.0001 |
| HOMA-IR, median (Q1, Q3) | 1.5 (1.2, 2.1) | 2.6 (1.8, 3.7)*** | 4.1 (3.0, 6.0)*** ††† | <0.0001 |
| HbA1c (%) | 5.6 (0.3) | 5.8 (0.4)*** | 6.5 (0.9)*** ††† | <0.0001 |
| Serum total cholesterol (mmol/l) | 5.6 (0.9) | 5.7 (1.0) | 5.5 (1.0) | 0.20 |
| Systolic blood pressure (mmHg) | 131 (19) | 144 (21)*** | 151 (21)*** † | <0.0001 |
| BMI (kg/m2) | 26.0 (3.9) | 28.7 (4.6)*** | 30.1 (4.5)*** † | <0.0001 |
| BDI score, median (Q1, Q3) | 5 (2, 11) | 5 (2, 9) | 6 (3, 12) | 0.41 |
| Current smoking, n (%) | 96 (15.4) | 33 (12.9) | 13 (15.5) | 0.63 |
| Verbal fluency in 2000 | 25.6 (6.8) | 24.9 (7.3) | 23.3 (5.9)* | 0.01 |
| Word-list learning in 2000 | 21.6 (3.7) | 20.9 (3.6)* | 20.2 (3.7)** | 0.001 |
| Word-list delayed recall in 2000 | 7.3 (1.6) | 7.0 (1.8) | 6.8 (1.8)* | 0.01 |
| Verbal fluency in 2011 | 24.2 (7.0) | 23.6 (7.3) | 21.4 (6.0)** † | 0.002 |
| Word-list learning in 2011 | 20.9 (4.4) | 20.1 (4.2) | 18.3 (4.4)*** †† | <0.0001 |
| Word-list delayed recall in 2011 | 7.2 (2.0) | 6.7 (2.1)** | 6.0 (2.3)*** † | <0.0001 |
The values are given as mean (SD) unless stated otherwise. p-values for differences between the glucose tolerance groups were assessed with Oneway ANOVA for continuous variables and with Chi Squared test for categorical variables. Multiple comparison p-values were calculated using Tukey’s HSD for continuous variables and using Bonferroni corrections for categorical variables. Multiple comparison p-values: compared to normal glucose tolerance group *p < 0.05, **p < 0.01, ***p < 0.001; IFG/IGT group compared to diabetes †p < 0.05, ††p < 0.01, †††p < 0.001. OGTT, oral glucose tolerance test.
Compared to the 45-74-year-old participants of the main Health 2000 study, the participants of the present study were younger (mean age at baseline 55.6 years versus 57.3 years, p < 0.0001), more educated (education in years, mean 11.6 years versus 10.4 years, p < 0.0001), and less frequently smokers (14.8 % versus 21.8%, p < 0.0001). Those who did not participate in the follow-up examinations were older (mean age at baseline 59.0 years versus 55.6 years, p < 0.0001), less educated (education in years, mean 10.3 years versus 11.6 years,<0.0001), and more frequently smokers (29.7% versus 14.8%, p < 0.0001) than those included in this study.
Supplementary Table 1 shows the number of individuals using oral diabetes medication, systemic corticosteroids, antidepressants, antipsychotics, antihypertensive, or cholesterol-lowering medication.
Predictors of cognitive performance at the 10-year follow-up
The results of the age, sex, and education-adjusted analyses and the fully adjusted models (adjusted further for APOE &z.epsi;4 genotype, type 2 diabetes, hypertension, hypercholesterolemia, BMI, BDI-score, and smoking status) are shown in Table 2. There was a positive association between early insulin response and word-list delayed recall performance, i.e., a lower early insulin response predicted a lower score, and conversely, a higher early insulin response predicted a better score in the word-list delayed recall test at follow-up (fully adjusted analysis: β: 0.21, p = 0.03). The association remained borderline significant when HOMA-IR was included in the analyses (p = 0.056). (Data not shown). In the less adjusted analyses (adjusted for age, sex, and education), higher fasting insulin and HOMA-IR predicted worse scores in the verbal fluency test (Table 2).
Table 2
Baseline fasting insulin, 2-h insulin, and early insulin response of the oral glucose tolerance test, and HOMA-IR as predictors of the cognitive test results at the 10-year follow-up
| Verbal fluency 2011 | Word-list learning 2011 | Word-list delayed recall 2011 | ||||
| Slope (95% CI) | r2adj | Slope (95% CI) | r2adj | Slope (95% CI) | r2adj | |
| Age, sex, and education adjusted | ||||||
| Insulin 00 | –1.41** | 0.17 | –0.47 | 0.28 | –0.03 | 0.21 |
| (–2.29 to –0.53) | (–0.98 to 0.04) | (–0.28 to 0.22) | ||||
| Insulin 120 | –0.59 | 0.16 | –0.20 | 0.28 | –0.01 | 0.21 |
| (–1.18 to 0.01) | (–0.54 to 0.15) | (–0.18 to 0.17) | ||||
| Early insulin response | –0.36 | 0.16 | 0.01 | 0.28 | 0.24** | 0.22 |
| (–0.94 to 0.22) | (–0.32 to 0.35) | (0.07 to 0.40) | ||||
| HOMA-IR | –1.25** | 0.17 | –0.49* | 0.29 | –0.09 | 0.21 |
| (–2.00 to –0.50) | (–0.93 to –0.05) | (–0.30 to 0.13) | ||||
| Fully adjusted model | ||||||
| Insulin 00 | –0.87 | 0.17 | 0.51 | 0.30 | 0.27 | 0.23 |
| (–2.09 to 0.35) | (–0.20 to 1.22) | (–0.08 to 0.63) | ||||
| Insulin 120 | –0.04 | 0.17 | 0.18 | 0.30 | 0.13 | 0.23 |
| (–0.77 to 0.69) | (–0.22 to 0.61) | (–0.08 to 0.34) | ||||
| Early insulin response | –0.51 | 0.17 | –0.15 | 0.30 | 0.21* | 0.23 |
| (–1.17 to 0.15) | (–0.54 to 0.23) | (0.02 to 0.40) | ||||
| HOMA-IR | –0.89 | 0.17 | 0.36 | 0.30 | 0.17 | 0.23 |
| (–1.98 to 0.21) | (–0.28 to 0.99) | (–0.15 to 0.49) | ||||
The results are shown as slope (95% confidence interval). A logarithmic transformation is used for insulin values, early insulin response, and HOMA-IR. The fully adjusted model is further adjusted for APOE &z.epsi;4 genotype, type 2 diabetes, hypertension, hypercholesterolemia, BMI, BDI-score, and smoking. r2adj, adjusted coefficient of determination of each model of adjustment. *p < 0.05, **p < 0.01, ***p < 0.001.
In the sensitivity analyses (those with treated diabetes excluded), the association between lower early insulin response and lower word-list delayed recall test remained significant in the age, sex, and education-adjusted analysis (β: 0.20, p = 0.02) but not in the fully adjusted analysis (β: 0.18, p = 0.07) (data not shown).
Because the interaction ‘2-hour insulin x APOE &z.epsi;4’ was significant for predicting word-list recall in 2011, the analysis was stratified by APOE genotype. The 2-h insulin value did not predict performance in verbal fluency in 2011 among APOE &z.epsi;4 negative nor positive participants in the analyses adjusted for age, sex, education, type 2 diabetes, hypertension, hypercholesterolemia, BMI, BDI-score, and smoking status (p-values≥0.34) (data not shown).
3.3Change in cognitive performance after 10 years
The results of the analyses evaluating the associations between the explanatory variables at baseline and the change in cognitive test results during the follow-up are shown in Table 3. The association between baseline early insulin response and change in word-list delayed recall during the 10-year follow-up was also positive, i.e., a lower early insulin response in 2001–2002 predicted larger decline and a higher early insulin response predicted respectively a lower decline (or even better performance at follow-up) from baseline to follow-up (fully adjusted analysis: β: 0.19, p = 0.03). In the analyses adjusted only for age, sex, education, and the cognitive test score at baseline, higher fasting insulin and HOMA-IR predicted a steeper decline in the verbal fluency test (Table 3).
Table 3
Baseline fasting insulin, 2-h insulin, and early insulin response of the oral glucose tolerance test, and HOMA-IR as predictors of the 10-year change in cognitive test scores
| Change in verbal | Change in word-list | Change in word-list delayed | ||||
| fluency 2011–2000 | learning 2011–2000 | recall 2011–2000 | ||||
| slope (95% CI) | r2adj | slope (95% CI) | r2adj | slope (95% CI) | r2adj | |
| Age, sex, education, and baseline cognitive test scores adjusted | ||||||
| Insulin 00 | –0.76* | 0.23 | –0.36 | 0.20 | 0.06 | 0.19 |
| (–1.48 to –0.03) | (–0.81 to 0.09) | (–0.19 to 0.32) | ||||
| Insulin 120 | –0.31 | 0.23 | –0.11 | 0.20 | 0.06 | 0.19 |
| (–0.80 to 0.18) | (–0.41 to 0.20) | (–0.11 to 0.23) | ||||
| early insulin response | –0.20 | 0.23 | –0.04 | 0.20 | 0.21** | 0.19 |
| (–0.68 to 0.27) | (–0.34 to 0.25) | (0.06 to 0.35) | ||||
| HOMA-IR | –0.67* | 0.23 | –0.37 | 0.20 | 0.01 | 0.19 |
| (–1.29 to –0.04) | (–0.76 to 0.02) | (–0.22 to 0.23) | ||||
| Fully adjusted model | ||||||
| Insulin 00 | –0.54 | 0.25 | 0.42 | 0.23 | 0.21 | 0.21 |
| (–1.55 to 0.47) | (–0.22 to 1.05) | (–0.10 to 0.53) | ||||
| Insulin 120 | –0.02 | 0.25 | 0.17 | 0.22 | 0.11 | 0.21 |
| (–0.62 to 0.59) | (–0.21 to 0.54) | (–0.08 to 0.30) | ||||
| early insulin response | –0.28 | 0.25 | –0.19 | 0.23 | 0.19* | 0.21 |
| (–0.82 to 0.27) | (–0.54 to 0.15) | (0.02 to 0.36) | ||||
| HOMA-IR | –0.54 | 0.25 | 0.31 | 0.22 | 0.13 | 0.20 |
| (–1.45 to 0.36) | (–0.25 to 0.88) | (–0.16 to 0.42) | ||||
The results are shown as slope (95% confidence interval). The change in the cognitive test scores at follow-up was calculated by the equation: “cognitive test score at follow-up (year 2011) minus cognitive test score at baseline (year 2000)”. A negative change indicates a decline in cognitive performance. Thus, a positive slope on the early insulin response in relation to the change in word-list delayed recall 2011–2000 indicates that a lower insulin response was associated with more cognitive decline. A logarithmic transformation is used for insulin values, early insulin response, and HOMA-IR. The fully adjusted model is further adjusted for APOE &z.epsi;4 genotype, type 2 diabetes, hypertension, hypercholesterolemia, BMI, BDI-score, and smoking. r2adj, adjusted coefficient of determination of each model of adjustment. *p < 0.05, **p < 0.01, ***p < 0.001.
In the sensitivity analyses, the association between a lower early insulin response and more deterioration in the word-list delayed recall test remained significant in the age, sex, and education-adjusted analysis (β: 0.16, p = 0.04) but not in the fully adjusted analysis (β: 0.16, p = 0.08) (data not shown).
Age, years of education, and sex were the most important variables predicting cognitive test results as well as change in the cognitive scores. When predicting word-list delayed recall, adding early insulin response to the model after age, sex, and years of education improved the model only slightly (adjusted r2 improved from 21% to 22%). Similarly, when predicting change in word-list delayed recall, adding early insulin response to the model after age, sex, and years of education improved the model only slightly (adjusted r2 improved from 18% to 19%).
DISCUSSION
This study indicates that impaired early insulin secretion in the oral glucose tolerance test predicts episodic memory decline 10 years later. A lower early insulin response was associated with poorer word-list delayed recall (recalling 10 words after 5 min) at follow-up as well as a greater decline from the baseline.
A previous study that examined 1,125 elderly men with a follow-up of 12 years, showed that low early insulin response is associated with increased risk for Alzheimer’s disease but not for vascular dementia [24]. The same study group also showed that impaired insulin secretion at midlife, assessed with the intravenous glucose tolerance test, is associated with an increased risk for Alzheimer’s disease and also for any dementia or cognitive decline among men (n = 1,792, follow-up 32 years) [38]. In line with these results, in our present study on a cohort of middle-aged men and women, a lower early insulin response predicted a weaker performance in episodic memory after 10 years. In the sensitivity analyses with treated diabetes excluded, the association remained significant in the analysis adjusted for age, sex, and education, but was just slightly lost in the fully adjusted analysis. It was expected that those with diabetes might drive the association between lower early insulin response and lower cognitive performance since those with diabetes had lower early insulin response values and also lower cognitive scores than those without diabetes. Among metabolically healthy individuals, the association was attenuated, albeit still significant in the age, sex, and education adjusted model.
Hyperinsulinemia as well has previously been linked to Alzheimer’s disease and cognitive decline [39, 40]. In a cohort of 683 persons aged 65 years and older from northern Manhattan (follow-up 5.4 years), hyperinsulinemia was associated with a decline in memory-related cognitive scores and also with a higher risk for Alzheimer’s disease [40]. Another study (n = 7,148, aged 45-64 years at baseline, follow-up of 6 years) showed that fasting hyperinsulinemia and HOMA-IR at baseline were associated with lower baseline cognitive test results and greater cognitive decline [39]. Our results are in concordance with the previous studies. We found that higher fasting insulin was associated with poorer performance and greater decline in verbal fluency but only in the less (age, sex, and education) adjusted analyses.
We have previously shown that insulin resistance measured by HOMA-IR predicts a decline in verbal fluency, but we did not find an association between HOMA-IR and word-list learning or word-list delayed recall [14]. The previous study was performed partly with the same study population as the present study. Here, we repeat the result concerning the association between greater HOMA-IR values and a steeper decline in the verbal fluency test but only in the less (age, sex, and education) adjusted model. Compared to the present study, the previous study population was notably larger and younger. Of note is also that the previous study reported HOMA-IR values calculated from blood samples taken in 2000, and in the present study from those taken in 2001-2002, which could also explain the slight differences in the results. In another previous study of ours—that was performed with the same study population as the present study—we showed that a 2-h glucose value in the oral glucose tolerance test predicts a decline in word-list recall after 10 years [26]. HOMA-IR seems to associate with weaker performance in verbal fluency [14], which can be regarded as a measurement of executive and language functions [41], whereas lower early insulin response (reflecting beta-cell dysfunction) and 2-h glucose (reflecting consequent hyperglycemia) [26] seem to associate with episodic memory decline. Brain vascular changes have previously been linked to an increased risk of future cognitive decline particularly in the domains of executive functions and processing speed [42, 43] while in Alzheimer’s disease, episodic memory is typically affected early.
Our study population was on average 56 years at baseline, and 65 years at follow-up. Midlife seems to be an essential period in developing cognitive problems in the future; midlife but not late-life vascular and metabolic risk factors have been shown to increase the risk of cognitive decline [44]. Our findings strengthen the previous studies suggesting an association between midlife metabolic risk factors and late-life cognitive decline. The exact mechanisms that link midlife risk factors to late-life cognitive decline and dementia are not clear, but it is well-established that the development of Alzheimer’s disease pathology is gradual, and amyloid-β, the early neuropathological hallmark that can be detected in Alzheimer’s disease, accumulates years before the onset of the symptoms [45]. A previous neuropathological study showed that fasting insulin and HOMA-IR, as well as 2-h post-load glucose in the oral glucose tolerance test, all measured on average 12.5 years before death, increased the risk for amyloid accumulation [46]. However, another study found no significant association between HOMA-IR, diabetes, or lifetime glucose intolerance (evaluated by oral glucose tolerance test) and neither postmortem Alzheimer’s disease pathology nor brain amyloid accumulation detected by PET [47].
An oral glucose tolerance test is widely used to diagnose IGT and diabetes, but single glucose or insulin measures of the oral glucose tolerance test alone do not directly provide a measure of insulin sensitivity [48]. Elevated glucose levels in the oral glucose tolerance test reflect postprandial hyperglycemia. However, 2-h post-load glucose does not distinguish between the underlying pathophysiologic disturbances: insulin resistance and impaired beta-cell function of the pancreas [48–50]. Both insulin resistance and impaired insulin secretion predict worsening glucose tolerance and type 2 diabetes [22, 51, 52]. Hyperinsulinemia is closely related to insulin resistance, while early insulin response can be considered an indicator of beta-cell function. Insulin resistance and hyperinsulinemia have previously been linked to an increased risk for cognitive decline and Alzheimer’s disease [14, 16, 18, 39]. In the present study, we found that a lower early insulin response predicts worse performance in episodic memory 10 years later, which is in concordance with the previous study which showed that low early insulin response is associated with increased risk for Alzheimer’s disease [24]. Thus, it seems that decreased early insulin secretion— along with insulin resistance [14, 16]— is associated with cognitive decline and possibly also with the development of Alzheimer’s disease.
There are several potential mechanisms that link low early insulin response, hyperinsulinemia, insulin resistance, and IGT to cognitive decline, dementia in general (including vascular dementia), and to Alzheimer’s disease. It has been suggested that the associations found between hyperglycemia and cognitive decline in people with diabetes could be explained simply by the increased risk for microvascular and macrovascular disease mediated by hyperglycemia [12]. Emerging evidence shows that insulin influences the brain in numerous ways and that insulin is crucial for brain health [53, 54]. Chronic peripheral hyperinsulinemia seems to downregulate insulin receptors in the blood-brain barrier resulting in a decreased amount of insulin transported into the brain [53]. Alzheimer’s disease seems to be associated with cerebral insulin resistance [54]. In the brain, insulin resistance impairs synaptic integrity [53]. In addition, insulin and amyloid-β share a common degrading enzyme, the insulin degrading enzyme. When this enzyme is downregulated in mice with insulin resistance and lower brain insulin levels, brain amyloid accumulation is increased [54]. The evidence showing that peripheral and brain insulin resistance might contribute to the development of Alzheimer’s disease has provided new targets to develop novel therapies for Alzheimer’s disease. Intranasal insulin, metformin, and GLP-1 receptor agonists, especially liraglutide, have been studied as potential drugs [53]. A small, but randomized, controlled study, suggested that liraglutide might slow down memory function decline in individuals with diabetes [55]. Another study demonstrated that patients with diabetes and Alzheimer’s disease -related cognitive impairment, who were treated with dipeptidyl peptidase-4 inhibitors, had a lower global amyloid burden than patients with diabetes and Alzheimer’s disease-related cognitive impairment without treatment with dipeptidyl peptidase-4 inhibitors [56]. Additionally, patients with dipeptidyl peptidase-4 inhibitors showed slower longitudinal cognitive decline [56].
Our study has some limitations. First, brain imaging with different modalities (including assessment of atrophy and vascular changes and amyloid-β imaging) could have been beneficial in order to evaluate the mechanisms mediating cognitive decline. However, brain imaging was not included in this health examination survey. Second, comprehensive neuropsychological testing could have been more sensitive in detecting subtle cognitive decline than the tests that were used (parts of CERAD). The strengths of this study in summary are: a large, population-based study population, measuring insulin and glucose values at different time points of the oral glucose tolerance test and thus enabling the calculation of early insulin response, the long follow-up time, performing cognitive tests both at baseline and at follow-up, and the possibility to adjust the analyses for previously reported risk factors of cognitive decline.
Here, we show that a lower early insulin response in an oral glucose tolerance test predicts a decline in episodic memory after a 10-year follow-up in a middle-aged sample including both men and women. Our results suggest that insulin secretion is associated with cognitive decline and that therapies targeted not only at insulin resistance but at impaired early insulin secretion as well might be useful to prevent cognitive decline.
ACKNOWLEDGMENTS
We sincerely thank all the study participants for their contribution. MSc Eliisa Löyttyniemi (Department of Biostatistics, University of Turku, Finland) is acknowledged for her statistical guidance.
FUNDING
S.T. received personal grants from the Finnish Medical Foundation, the Juho Vainio Foundation, the Finnish Brain Foundation (Suomen Aivosäätiö sr), the Maud Kuistila Foundation, and the Finnish State Research Funding (ERVA). L.L.E. was supported by the Emil Aaltonen Foundation. M.V. was supported by King Gustaf V’s and Queen Victoria’s Freemasons’ Foundation. J.O.R. was supported by grants from the Academy of Finland research grants (#310962 to J.O.R.), the Sigrid Juselius Foundation and Finnish State Research Funding (ERVA).
CONFLICT OF INTEREST
J.O.R. serves as a neurology consultant for Clinical Research Services Turku (CSRT Oy). Other authors have no conflict of interest to report.
DATA AVAILABILITY
Anonymized data can be requested on reasonable request for a study that has been approved by a local ethics committee and that corresponds with the research areas of the Finnish Institute for Health and Welfare Biobank. The applications are to be directed to the Finnish Institute for Health and Welfare (thl.fi/en/web/thl-biobank/for-researchers).
SUPPLEMENTARY MATERIAL
[1] The supplementary material is available in the electronic version of this article: https://dx.doi.org/10.3233/JAD-220894.
REFERENCES
[1] | Zhang J , Chen C , Hua S , Liao H , Wang M , Xiong Y , Cao F ((2017) ) An updated meta-analysis of cohort studies: Diabetes and risk of Alzheimer’s disease. Diabetes Res Clin Pract 124: , 41–47. |
[2] | Cheng G , Huang C , Deng H , Wang H ((2012) ) Diabetes as a risk factor for dementia and mild cognitive impairment: A meta-analysis of longitudinal studies. Intern Med J 42: , 484–491. |
[3] | Marseglia A , Fratiglioni L , Kalpouzos G , Wang R , Bäckman L , Xu W ((2019) ) Prediabetes and diabetes accelerate cognitive decline and predict microvascular lesions: A population-based cohort study. Alzheimers Dement 15: , 25–33. |
[4] | Christman AL , Matsushita K , Gottesman RF , Mosley T , Alonso A , Coresh J , Hill-Briggs F , Sharrett AR , Selvin E ((2011) ) Glycated haemoglobin and cognitive decline: The Atherosclerosis Risk in Communities (ARIC) study. Diabetologia 54: , 1645–1652. |
[5] | Geijselaers SLC , Sep SJS , Stehouwer CDA , Biessels GJ ((2015) ) Glucose regulation, cognition, and brain MRI in type 2 diabetes: A systematic review. Lancet Diabetes Endocrinol 3: , 75–89. |
[6] | Kerti L , Witte AV , Winkler A , Grittner U , Rujescu D , Flöel A ((2013) ) Higher glucose levels associated with lower memory and reduced hippocampal microstructure. Neurology 81: , 1746–1752. |
[7] | Crane PK , Walker R , Hubbard RA , Li G , Nathan DM , Zheng H , Haneuse S , Craft S , Montine TJ , Kahn SE , McCormick W , McCurry SM , Bowen JD , Larson EB ((2013) ) Glucose levels and risk of dementia. N Engl J Med 369: , 540–548. |
[8] | Hardy J , de Strooper B , Escott-Price V ((2022) ) Diabetes and Alzheimer’s disease: Shared genetic susceptibility? Lancet Neurol 21: , 962–964. |
[9] | Abner EL , Nelson PT , Kryscio RJ , Schmitt FA , Fardo DW , Woltjer RL , Cairns NJ , Yu L , Dodge HH , Xiong C , Masaki K , Tyas SL , Bennett DA , Schneider JA , Arvanitakis Z ((2016) ) Diabetes is associated with cerebrovascular but not Alzheimer’s disease neuropathology. Alzheimers Dement 12: , 882–889. |
[10] | Dos Santos Matioli MNP , Suemoto CK , Rodriguez RD , Farias DS , Da Silva MM , Leite REP , Ferretti-Rebustini REL , Farfel JM , Pasqualucci CA , Jacob Filho W , Arvanitakis Z , Naslavsky MS , Zatz M , Grinberg LT , Nitrini R ((2017) ) Diabetes is not associated with Alzheimer’s disease neuropathology. J Alzheimers Dis 60: , 1035–1043. |
[11] | van Arendonk J , Neitzel J , Steketee RME , van Assema DME , Vrooman HA , Segbers M , Ikram MA , Vernooij MW ((2023) ) Diabetes and hypertension are related to amyloid-beta burden in the population-based Rotterdam Study. Brain 146: , 337–348. |
[12] | Biessels GJ , Strachan MWJ , Visseren FLJ , Kappelle LJ , Whitmer RA ((2014) ) Dementia and cognitive decline in type 2 diabetes and prediabetic stages: Towards targeted interventions. Lancet Diabetes Endocrinol 2: , 246–255. |
[13] | Srikanth V , Sinclair AJ , Hill-Briggs F , Moran C , Biessels GJ ((2020) ) Type 2 diabetes and cognitive dysfunction— towards effective management of both comorbidities. Lancet Diabetes Endocrinol 8: , 535–545. |
[14] | Ekblad LL , Rinne JO , Puukka P , Laine H , Ahtiluoto S , Sulkava R , Viitanen M , Jula A ((2017) ) Insulin resistance predicts cognitive decline: An 11-year follow-up of a nationally representative adult population sample. Diabetes Care 40: , 751–758. |
[15] | Toppala S , Ekblad LL , Lötjönen J , Helin S , Hurme S , Johansson J , Jula A , Karrasch M , Koikkalainen J , Laine H , Parkkola R , Viitanen M , Rinne JO ((2019) ) Midlife insulin resistance as a predictor for late-life cognitive function and cerebrovascular lesions. J Alzheimers Dis 72: , 215–228. |
[16] | Kuusisto J , Koivisto K , Mykkänen L , Helkala EL , Vanhanen M , Hänninen T , Kervinen K , Kesäniemi YA , Riekkinen PJ , Laakso M ((1997) ) Association between features of the insulin resistance syndrome and Alzheimer’s disease independently of apolipoprotein E4 phenotype: Cross sectional population based study. BMJ 315: , 1045–1049. |
[17] | Whitmer RA , Gustafson DR , Barrett-Connor E , Haan MN , Gunderson EP , Yaffe K ((2008) ) Central obesity and increased risk of dementia more than three decades later. Neurology 71: , 1057–1064. |
[18] | Schrijvers EMC , Witteman JCM , Sijbrands EJG , Hofman A , Koudstaal PJ , Breteler MMB ((2010) ) Insulin metabolism and the risk of Alzheimer disease: The Rotterdam Study. Neurology 75: , 1982–1987. |
[19] | Kuusisto J , Koivisto K , Mykkänen L , Helkala EL , Vanhanen M , Hänninen T , Pyörälä K , Riekkinen P , Laakso M ((1993) ) Essential hypertension and cognitive function: The role of hyperinsulinemia. Hypertension 22: , 771–779. |
[20] | Kanat M , Mari A , Norton L , Winnier D , DeFronzo RA , Jenkinson C , Abdul-Ghani MA ((2012) ) Distinct β-cell defects in impaired fasting glucose and impaired glucose tolerance. Diabetes 61: , 447–453. |
[21] | Tabak AG , Herder C , Rathmann W , Brunner EJ , Kivimäki M ((2012) ) Prediabetes: A high-risk state for diabetes development. Lancet 379: , 2279–2290. |
[22] | Weyer C , Tataranni A , Bogardus C , Pratley RE ((2001) ) Insulin resistance and insulin secretory dysfunction are independent predictors of worsening of glucose tolerance during each stage of type 2 diabetes development. Diabetes Care 24: , 89–94. |
[23] | Lillioja S , Mott DM , Spraul M , Ferraro R , Foley JE , Ravussin E , Knowler WC , Bennett PH , Bogardus C ((1993) ) Insulin resistance and insulin secretory dysfunction as precursors of non-insulin-dependent diabetes mellitus: Prospective studies of Pima Indians. N Engl J Med 329: , 1988–1992. |
[24] | Rönnemaa E , Zethelius B , Sundelöf J , Sundström J , Degerman-Gunnarsson M , Lannfelt L , Berne C , Kilander L ((2009) ) Glucose metabolism and the risk of Alzheimer’s disease and dementia: A population-based 12 year follow-up study in 71-year-old men. Diabetologia 52: , 1504–1510. |
[25] | Ekblad LL , Johansson J , Helin S , Viitanen M , Laine H , Puukka P , Jula A , Rinne JO ((2018) ) Midlife insulin resistance, APOE genotype, and late-life brain amyloid accumulation. Neurology 90: , e1150–e1157. |
[26] | Toppala S , Ekblad LL , Viitanen M , Rinne JO , Jula A ((2021) ) Oral glucose tolerance test predicts episodic memory decline: A 10-year population-based follow-up study. Diabetes Care 44: , 2435–2437. |
[27] | Aromaa A , Koskinen S (2004) Health and functional capacity in Finland. Baseline results of the Health 2000 Health Examination Survey. Publications of the National Public Health Institute, Helsinki; B12, http://www.julkari.fi/handle/10024/78534. Accessed 3 January 2021. |
[28] | Lundqvist A , Mäki-Opas T , Eds. (2016) Health 2011 Survey –Methods. Tampere, Finland, Finnish National Institute for Health and Welfare, https://urn.fi/URN:ISBN:978-952-302-669-8. Accessed 3 January 2021. |
[29] | Heistaro S (2008) Methodology report: Health 2000 survey. Publications of the National Public Health Institute, Helsinki; B26, http://www.julkari.fi/handle/10024/78185. Accessed 3 January 2021. |
[30] | Jänis MT , Siggins S , Tahvanainen E , Vikstedt R , Silander K , Metso J , Aromaa A , Taskinen MR , Olkkonen VM , Jauhiainen M , Ehnholm C ((2004) ) Active and low-active forms of serum phospholipid transfer protein in a normal Finnish population sample. J Lipid Res 45: , 2303–2309. |
[31] | Beck AT , Steer RA , Brown GK (1996) Manual for the Beck Depression Inventory-II, Psychological Corporation, San Antonio, TX. |
[32] | Turunen AW , Jula A , Suominen AL , Männistö S , Marniemi J , Kiviranta H , Tiittanen P , Karanko H , Moilanen L , Nieminen MS , Kesäniemi YA , Kähönen M , Verkasalo PK ((2013) ) Fish consumption, omega-3 fatty acids, and environmental contaminants in relation to low-grade inflammation and early atherosclerosis. Environ Res 120: , 43–54. |
[33] | Luotola K , Pääkkönen R , Alanne M , Lanki T , Moilanen L , Surakka I , Pietilä A , Kähönen M , Nieminen MS , Kesäniemi YA , Peters A , Jula A , Perola M , Salomaa V ((2009) ) Association of variation in the interleukin-1 gene family with diabetes and glucose homeostasis. J Clin Endocrinol Metab 94: , 4575–4583. |
[34] | Alberti K , Zimmet P ((1998) ) Definition, diagnosis and classification of diabetes mellitus and its complications. Part 1: Diagnosis and classification of diabetes mellitus provisional report of a WHO consultation. Diabet Med 15: , 539–553. |
[35] | Matthews DR , Hosker JP , Rudenski AS , Naylor BA , Treacher DF , Turner RC ((1985) ) Homeostasis model assessment: Insulin resistance and beta-cell function from fasting plasma glucose and insulin concentrations in man. Diabetologia 28: , 412–419. |
[36] | Morris JC , Heyman A , Mohs RC , Hughes JP , van Belle G , Fillenbaum G , Mellits ED , Clark C ((1989) ) The consortium to establish a registry for Alzheimer’s disease (CERAD). Part I. Clinical and neuropsychological assessment of Alzheimer’s disease. Neurology 39: , 1159–1165. |
[37] | Hänninen T , Pulliainen V , Salo J , Hokkanen L , Erkinjuntti T , Koivisto K , Viramo P , Soininen H , Asiantuntijaryhmä SM ((1999) ) Kognitiiviset testit muistihäiriöiden ja alkavan dementian varhaisdiagnostiikassa: CERAD-tehtäväsarja. [Cognitive tests in diagnosing memory disorders and early dementia: CERAD-nb]. Suom Laakaril 15: , 1967–1975. |
[38] | Rönnemaa E , Zethelius B , Sundelöf J , Sundström J , Degerman-Gunnarsson M , Berne C , Lannfelt L , Kilander L ((2008) ) Impaired insulin secretion increases the risk of Alzheimer disease. Neurology 71: , 1065–1071. |
[39] | Young SE , Mainous AG , Carnemolla M ((2006) ) Hyperinsulinemia and cognitive decline in a middle-aged cohort. Diabetes Care 29: , 2688–2693. |
[40] | Luchsinger JA , Tang MX , Shea S , Mayeux R ((2004) ) Hyperinsulinemia and risk of Alzheimer disease. Neurology 63: , 1187–1192. |
[41] | Shao Z , Janse E , Visser K , Meyer AS ((2014) ) What do verbal fluency tasks measure? Predictors of verbal fluency performance in older adults. Front Psychol 5: , 772. |
[42] | Debette S , Markus HS ((2010) ) The clinical importance of white matter hyperintensities on brain magnetic resonance imaging: Systematic review and meta-analysis. BMJ 341: , c3666. |
[43] | Carey CL , Kramer JH , Josephson SA , Mungas D , Reed BR , Schuff N , Weiner MW , Chui HC ((2008) ) Subcortical lacunes are associated with executive dysfunction in cognitively normal elderly. Stroke 39: , 397–402. |
[44] | Winblad B , Amouyel P , Andrieu S , Ballard C , Brayne C , Brodaty H , Cedazo-Minguez A , Dubois B , Edvardsson D , Feldman H , Fratiglioni L , Frisoni GB , Gauthier S , Georges J , Graff C , Iqbal K , Jessen F , Johansson G , Jönsson L , Kivipelto M , Knapp M , Mangialasche F , Melis R , Nordberg A , Rikkert MO , Qiu C , Sakmar TP , Scheltens P , Schneider LS , Sperling R , Tjernberg LO , Waldemar G , Wimo A , Zetterberg H ((2016) ) Defeating Alzheimer’s disease and other dementias: A priority for European science and society. Lancet Neurol 15: , 455–532. |
[45] | Jack CR , Knopman DS , Jagust WJ , Shaw LM , Aisen PS , Weiner MW , Petersen RC , Trojanowski JQ ((2010) ) Hypothetical model of dynamic biomarkers of the Alzheimer’s pathological cascade. Lancet Neurol 9: , 119–128. |
[46] | Matsuzaki T , Sasaki K , Tanizaki Y , Hata J , Fujimi K , Matsui Y , Sekita A , Suzuki SO , Kanba S , Kiyohara Y , Iwaki T ((2010) ) Insulin resistance is associated with the pathology of Alzheimer disease: The Hisayama study. Neurology 75: , 764–770. |
[47] | Thambisetty M , Metter EJ , Yang A , Dolan H , Marano C , Zonderman AB , Troncoso JC , Zhou Y , Wong DF , Ferrucci L , Egan J , Resnick SM , O’Brien RJ ((2013) ) Glucose intolerance, insulin resistance, and pathological features of Alzheimer disease in the Baltimore longitudinal study of aging. JAMA Neurol 70: , 1167–1172. |
[48] | Matsuda M , DeFronzo RA ((1999) ) Insulin sensitivity indices obtained from oral glucose tolerance testing: Comparison with the euglycemic insulin clamp. Diabetes Care 22: , 1462–1470. |
[49] | Kim SH , Reaven GM ((2008) ) Isolated impaired fasting glucose and peripheral insulin sensitivity: Not a simple relationship. Diabetes Care 31: , 347–352. |
[50] | Abdul-Ghani MA , Jenkinson CP , Richardson DK , Tripathy D , DeFronzo RA ((2006) ) Insulin secretion and action in subjects with impairedfasting glucose and impaired glucose tolerance: Results from theveterans administration genetic epidemiology study.. Diabetes 55: , 1430–1435. |
[51] | Zethelius B , Hales CN , Lithell HO , Berne C ((2004) ) Insulin resistance, impaired early insulin response, and insulin propeptides as predictors of the development of type 2 diabetes: A population-based, 7-year follow-up study in 70-year-old men. Diabetes Care 27: , 1433–1438. |
[52] | Tabak AG , Jokela M , Akbaraly TN , Brunner EJ , Kivimäki M , Witte DR ((2009) ) Trajectories of glycaemia, insulin sensitivity, and insulin secretion before diagnosis of type 2 diabetes: An analysis from the Whitehall II study. Lancet 373: , 2215–2221. |
[53] | Kellar D , Craft S ((2020) ) Brain insulin resistance in Alzheimer’s disease and related disorders: Mechanisms and therapeutic approaches. Lancet Neurol 19: , 758–766. |
[54] | Cholerton B , Baker LD , Craft S ((2013) ) Insulin, cognition, and dementia. Eur J Pharmacol 719: , 170–179. |
[55] | Vadini F , Simeone PG , Boccatonda A , Guagnano MT , Liani R , Tripaldi R , Di Castelnuovo A , Cipollone F , Consoli A , Santilli F ((2020) ) Liraglutide improves memory in obese patients with prediabetes or early type 2 diabetes: A randomized, controlled study. Int J Obes 44: , 1254–1263. |
[56] | Jeong SH , Kim HR , Kim J , Kim H , Hong N , Jung JH , Baik K , Cho H , Lyoo CH , Ye BS , Sohn YH , Seong J-K , Lee PH ((2021) ) Association of dipeptidyl peptidase-4 inhibitor use and amyloid burden in diabetic patients with AD-related cognitive impairment. Neurology 97: , e1110–e1122. |


