
FMRI Complexity Correlates with Tau-PET and Cognitive Decline in Late-Onset and Autosomal Dominant Alzheimer’s Disease
Abstract
Background:
Neurofibrillary tangle pathology detected with tau-PET correlates closely with neuronal injury and cognitive symptoms in Alzheimer’s disease (AD). Complexity of rs-fMRI has been demonstrated to decrease with cognitive decline in AD.
Objective:
We hypothesize that the rs-fMRI complexity provides an index for tau-related neuronal injury and cognitive decline in the AD process.
Methods:
Data was obtained from the Alzheimer’s Disease Neuroimaging Initiative (ADNI3) and the Estudio de la Enfermedad de Alzheimer en Jalisciences (EEAJ) study. Associations between tau-PET and rs-fMRI complexity were calculated. Potential pathways relating complexity to cognitive function mediated through tau-PET were assessed by path analysis.
Results:
We found significant negative correlations between rs-fMRI complexity and tau-PET in medial temporal lobe of both cohorts, and associations of rs-fMRI complexity with cognitive scores were mediated through tau-PET.
Conclusion:
The association of rs-fMRI complexity with tau-PET and cognition, suggests that a reduction in complexity is indicative of tau-related neuropathology and cognitive decline in AD processes.
INTRODUCTION
With the growing healthcare burden of Alzheimer’s disease (AD) worldwide, biomarkers for pre-symptomatic stages of AD have become increasingly important for the development of preventative interventions [1]. Based on studies of late-onset AD (LOAD) such as the Alzheimer’s Disease Neuroimaging Initiative (ADNI) study, amyloid-PET imaging of amyloid-β (Aβ) accumulation in the brain is considered an early marker for the preclinical stage of AD (10-15 years before symptom onset), while tau imaging correlates more closely with neuronal injury and cognitive decline [2]. In finding biomarkers for pre-symptomatic AD, fully-penetrant autosomal dominant AD (ADAD) provides a valuable scientific window into the very early stages of AD development [3–5]. Imaging studies in ADAD such as those by the Dominantly Inherited Alzheimer’s Network (DIAN) show that the overall patterns of Aβ and tau accumulation, atrophy, and hypometabolism/hypoperfusion in ADAD parallel those of LOAD [6–10]. Notably, for tau-PET, a recent DIAN study showed more pronounced tau accumulation in ADAD subjects as compared to LOAD [10]. Further highlighting the effect of tau deposition on cognitive decline, both ADNI [11] and the Harvard Aging Brain Study [12] reported that tau accumulation, regardless of initial amyloid status, leads to more severe cognitive decline. Finally, the level of tau accumulation, but not amyloid, was found to be predictive of the rate of subsequent atrophy [13]. These accumulating findings indicate that tau deposition plays an important role in cognitive decline and neurodegeneration in the progression of AD.
The functional brain architecture of brain networks assessed based on functional magnetic resonance imaging (fMRI) has also been associated with the spread of tau accumulation [14]. Although widely used in AD [15, 16], functional connectivity (FC) analysis of a resting state fMRI (rs-fMRI) has limited capability to characterize dynamic changes of BOLD signal fluctuations within time scales of seconds to minutes (i.e., non-stationary processes) [17]. There is accumulating evidence that the inherent moment-to-moment variability of BOLD fMRI possesses physiologically meaningful information [18] and can provide relevant complementary information to FC [19].
A variety of complexity metrics derived from the fields of nonlinear statistics and information theory have been developed to describe the dynamics of physiological systems [20], including approximate entropy (ApEn) [21], sample entropy (SampEn) [22], and multi-scale entropy (MSE) [23]. Recent studies showed relationships between decreased entropy measures of BOLD fMRI and normal aging [24–27], APOE ɛ4 genotype [28], as well as with deteriorating cognitive performance associated with ADAD [24] and mild LOAD [29]. In particular, MSE analysis at higher time scales or lower temporal frequencies has been shown to be more sensitive in detecting aging effects and AD progression.
Based on the emerging associations between cognitive decline and tau-accumulation as well as reduction of entropy, we hypothesize that the complexity of BOLD signals at higher time scales (i.e., slower frequencies) provides an index of the information processing capacity of regional neuron populations, and is therefore sensitive to tau-related neuronal injury and cognitive decline in the processes of AD.
METHODS
Subjects
Late Onset AD (LOAD) cohort: ADNI3
Data used in this study were obtained from the ADNI database (http://adni.loni.usc.edu). The ADNI was launched in 2003 as a public-private partnership, led by Principal Investigator M.W. Weiner, MD. The primary goal of ADNI has been to test whether serial MRI, PET, other biological markers, and clinical and neuropsychological assessment can be combined to measure the progression of mild cognitive impairment (MCI) and early AD. In our study we evaluated the relationship of tau-PET and complexity of rs-fMRI and thus we identified ADNI participants from phase 3 study (ADNI3) that had a tau-PET (tracer: 18F-AV1451), rs-fMRI, and a T1w structural scan. rs-fMRI was acquired using gradient-echo echo-planar imaging (GE-EPI) in PA phase encoding direction with isotropic voxel size of 3.4x3.4x3.4 mm3, TR/TE=3000/30 ms, acquisition time 10 min with 197 volumes. We identified 145 subjects, with mean(±std) age of 72.3(7.6) years and gender distribution of 80M/65F. Cognitive assessment in this ANDI3 cohort classified 88 as cognitively normal (CN), 50 with MCI, and 7 with mild AD. Details of clinical diagnosis in ADNI have been previously described [30, 31]. Briefly, CN participants had a Mini-Mental State Examination (MMSE) score of > 26 and a Clinical Dementia Rating (CDR) of 0. Participants with probable AD had an MMSE score < 24, and a CDR of 0.5 or 1.0. MCI, early MCI (EMCI), and late MCI (LMCI) were pooled into one MCI group (N = 45). Detailed demographic and clinical information for the three ADNI3 groups can be found in Table 1.
Table 1
Demographic of ADNI and EEAJ cohorts
| ADNI | CN | MCI | AD | Statistic | Significance | Effect |
| N | 88 | 50 | 7 | |||
| age (mean/std) | 72.6 (7.8) | 72.4 (7.1) | 67.3 (8.0) | F=1.62 | p=0.202 | n.s |
| gender (m/f) | 53/35 | 25/25 | 2/5 | χ2 = 3.5 | p=0.178 | n.s |
| MMSE (mean/std) | 28.9 (1.37) | 28.2 (2.00) | 22.4 (2.99) | F=46.6 | p<1e-15 | CN>MCI>AD |
| CDR (N: 0 / 0.5 / 1 />1]) | 88/0/0/0 | 14/34/2/0 | 1/1/5 | χ2 = 123.4 | p<1e-6 | CN<MCI<AD |
| CDR SOB (mean/std) | 0.03 (0.13) | 1.33 (1.84) | 5.36 (2.12) | F=77.5 | p<1e-22 | CN<MCI<AD |
| EEAJ | CN | MCI | AD | Statistic | Significance | Effect |
| N | 20 | 13 | 8 | |||
| age (mean/std) | 30.6 (6.7) | 41.8 (9.3) | 46.3 (11.4) | F=12.5 | p<0.0001 | CN< (MCI = AD) |
| gender (m/f) | 10/10 | 8/5 | 4/4 | χ2 = 0.48 | p=0.788 | n.s |
| MMSE (mean/std) | 28.8 (1.44) | 19.8 (6.27) | 12.3 (5.47) | F=43.0 | p<1e-09 | CN>MCI>AD |
| CDR (N: 0 / 0.5 / 1 />1]) | 20/0/0/0 | 0/5/8/0 | 0/0/2/5 | χ2 = 68.8 | p<1e-6 | CN<MCI<AD |
| CDR SOB (mean/std) | 0.05 (0.15) | 4.31 (2.43) | 10.69 (3.28) | F=85.5 | p<1e-14 | CN<MCI<AD |
MMSE, Mini-Mental State Exam; CDR, Cognitive Dementia Rating; CN, cognitively normal; MCI, mild cognitive impairment; AD, Alzheimer’s disease.
Autosomal Dominant AD (ADAD) cohort: EEAJ
A second cohort of participants came from the Estudio de la Enfermedad de Alzheimer en Jalisciences (EEAJ, PI John M Ringman), a study that is focused on understanding AD in persons of Mexican Mestizo origin that are at-risk for fully-penetrant ADAD (due to either the A431E, or I180F PSEN1 or V717I APP mutations). This dataset included 20 CN, 13 MCI, and 8 AD subjects with mean(±std) age of 37.2(10.7) years and gender distribution of 19F/22M. Cognitive status was determined by a comprehensive neuropsychological testing according to the UDS3 of the NIA-funded Alzheimer’s Disease Centers [32] including MMSE and CDR. Diagnoses were rendered according to the UDS protocol [32, 33] adjudicated by author JMR. These study participants had a T1w structural, a tau-PET (tracer: 18F-AV1451) and two rs-fMRI scans with opposite phase encoding (AP/PA) based on the Human Connectome Project protocol using a multiband (MB) GE-EPI sequence with isotropic voxel size = 2x2x2 mm3, TR/TE=720/33 ms, MB factor = 8, and acquisition time of 5 min with 420 volumes. Detailed demographic information for the three EEAJ groups can be found in Table 1.
ADNI3 or EEAJ studies are in accordance with the Declaration of Helsinki and approved by the respective institutional review boards.
Data availability is provided through the ADNI and EEAJ steering committees and data use agreements.
Data preprocessing
Resting-state fMRI
FMRI data were motion-corrected, normalized to Montreal Neurological Institute (MNI) canonical space and smoothed with an 8 mm Gaussian kernel. Physiological and motion related signal fluctuations were regressed out based on eroded white matter and cerebrospinal fluid masks, generated from probabilistic tissue segmentation masks of T1w-images, and 12 motion parameters (x,y,z translation and rotation plus first derivatives), respectively. Framewise displacement (FD) was computed for each subject and statistically compared across the groups (CN, MCI, AD) in each cohort to evaluate whether there are significant differences in head movements between the groups. The FD comparison did not reveal statistically significant differences and results can be found in Supplementary Table 1. MSE was computed using the in-house developed LOFT Complexity Toolbox (github.com/kayjann/complexity). MSE analysis is based on sample entropy (SampEn) extended to additional temporal scales. SampEn estimates the likelihood that patterns with a length of m time points recur in the time series. Two patterns match if the distance is less than a selected threshold value, r. The distance is calculated by the maximum absolute component-wise difference. Then the likelihood of recurring patterns is also estimated for m + 1-length patterns. The ratio between these two values for m and m + 1 is the average conditional probability that if two m-length patterns match for a given threshold r, then they will continue to match for an additional time point. Different time scales were calculated by coarse-grained averaging of the original BOLD time-series. Temporal frequency was calculated by 1/(scale*TR), thus low-scales represent higher frequency complexity (scale 1 is the original temporal resolution) while higher scales capture complexity of low frequency signal fluctuations. In total we calculated 6 scales in each cohort with pattern matching length m = 2 and pattern matching threshold r = 0.50. The choice of these parameters was in the reported range of values for fMRI data in literature [34, 35] and based on previous work in our laboratory [25, 29, 36]. As previous research in AD demonstrated that AD, MCI, and CN show the largest differences in high-scale entropy (low-frequency), we limited further analysis to the highest scale in each cohort. For the EEAJ cohort MSE was calculated for AP and PA scans separately and then averaged into a single map. The MSE maps for the AP and PA scans separately and statistical assessment of effects of phase encoding direction are available in Supplementary Figures 5 and 6.
Tau-PET
Tau-PET data were normalized into MNI space and smoothed with an 8 mm Gaussian kernel. Cerebellar segmentation was performed with SUIT (https://www.diedrichsenlab.org/imaging/suit.htm), and dorsal regions were removed from the cerebellar region of interest (ROI) [37]. Average PET signals were extracted for reference regions in inferior cerebellar gray matter in native PET space. Parametric standardized uptake value ratio (SUVR) maps were created by dividing the PET signal in each voxel by the average signal in the cerebellar reference region.
Statistical analysis
For the ADNI and EEAJ cohort, we first calculated the average MSE and tau-PET SUVR maps for each group: CN, MCI, and AD. This provided a visual representation of the spatial pattern of changes in each metric with progressive disease severity. Secondly, we calculated an ANOVA with factor group (CN, MCI, AD) to identify areas with statistically significant changes between the groups for MSE and tau-PET, respectively. Post-hoc t-test revealed direction of effects as increases or decreases in either metric between the three diagnostic groups. We expected to see decreases in rs-fMRI MSE along with increases in tau-PET SUVR values in brain areas known to be involved in disease progression such as the medial and inferior temporal lobe, PCC, and potentially parietal and frontal cortex, which will be a confirmation of data consistency with the current literature.
Association between rs-fMRI MSE and tau-PET SUVR
To assess the relationship between rs-fMRI MSE and tau-PET SUVR we performed voxel-wise partial correlation analysis including age, gender, and regional gray matter volume as covariates. Regional gray matter volume was calculated based on individually segmented T1w-images using SPM12’s Dartel algorithm. This analysis was performed for the ADNI and EEAJ cohorts independently. Statistical significance was set at p < 0.05 and multiple comparison correction was applied using a cluster-size threshold estimation in alpha-sim (http://www.nitrc.org/projects/rest/) using 1000 permutations. In addition to the voxel-wise analysis, we repeated the correlation analysis for larger ROIs based on parcellation of the cortex into the AAL atlas ROIs. This approach benefited from improved signal-to-noise ratio (SNR) for both MSE and SUVR. Results for both voxel-wise and ROI-based analyses were projected onto cortical surfaces for visualization using the Quantitative Imaging Toolkit (QIT, https://cabeen.io/qitwiki, [38]).
Association between rs-fMRI MSE and cognitive scores
Based on the findings in the voxel-wise analysis between MSE and tau-PET we identified three clusters with significant voxel-wise correlations that were located in disease relevant cortical areas. From each of these clusters we extracted the average MSE and tau-PET SUVR values to calculate the association with CDR Sum of Boxes (CDR-SOB) and MMSE scores, respectively. First, partial correlation analysis including age, gender, and average regional gray matter volume as covariates was computed between regional mean MSE and CDR-SOB or MMSE scores, respectively. Results were displayed using partial-regression plots with adjusted values. Residual plots were used to assess the model integrity. Correlation analyses were performed using the Statistics and Machine Learning Toolbox in MatLab. To address skewed data distribution in the cognitive scores we used rank transformed data.
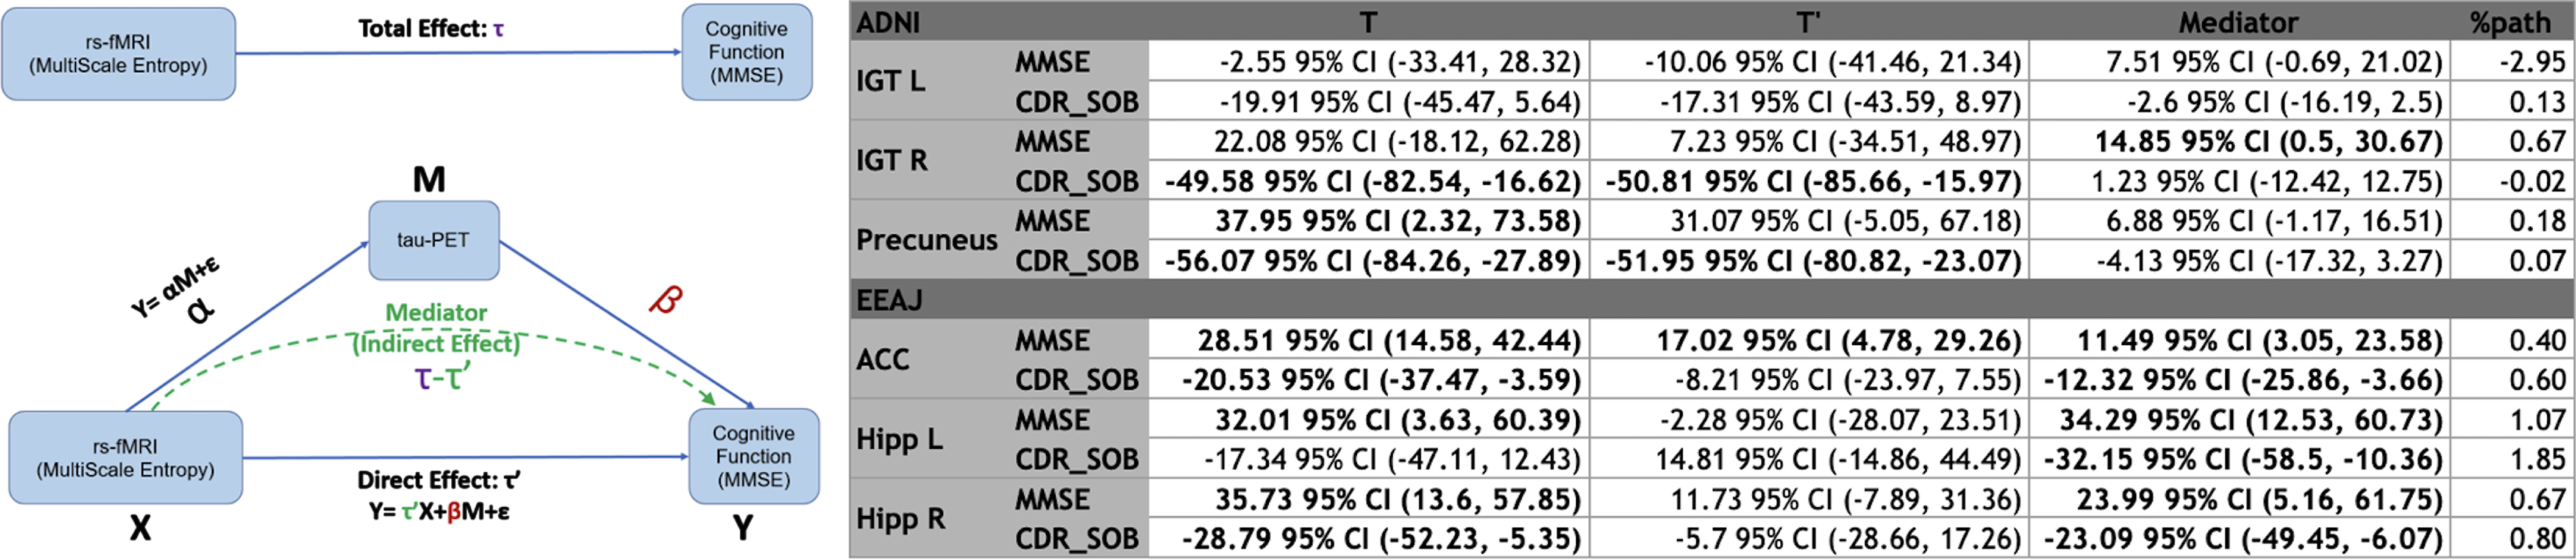
Second, to show the association between our novel imaging marker MSE and cognitive function in relation to tauopathy, we performed mediation analyses within these regional of interests. Tau is a known imaging marker that is associated with cognitive function. Through the mediation model, we can demonstrate the association between novel imaging marker (MSE) to the clinical outcome can be partially explained by the known imaging marker (tau). For the model setting, the dependent variable (Y) is cognitive function, the independent variable (X) is the MSE-MRI, the mediator is tau (M). Mediation effects [39] were tested in SAS software and statistical significance was tested by 95% confidence-interval estimated with 1000 bootstrapping samples. Finally, we ran a voxel-wise correlation analysis between MSE values and MMSE or CDR-SOB rank-transformed scores in both cohorts to show the extent of associations between MSE and global cognitive scores that may involve additional cortical areas besides cortex affected by tau accumulation.
RESULTS
Entropy and tau-PET
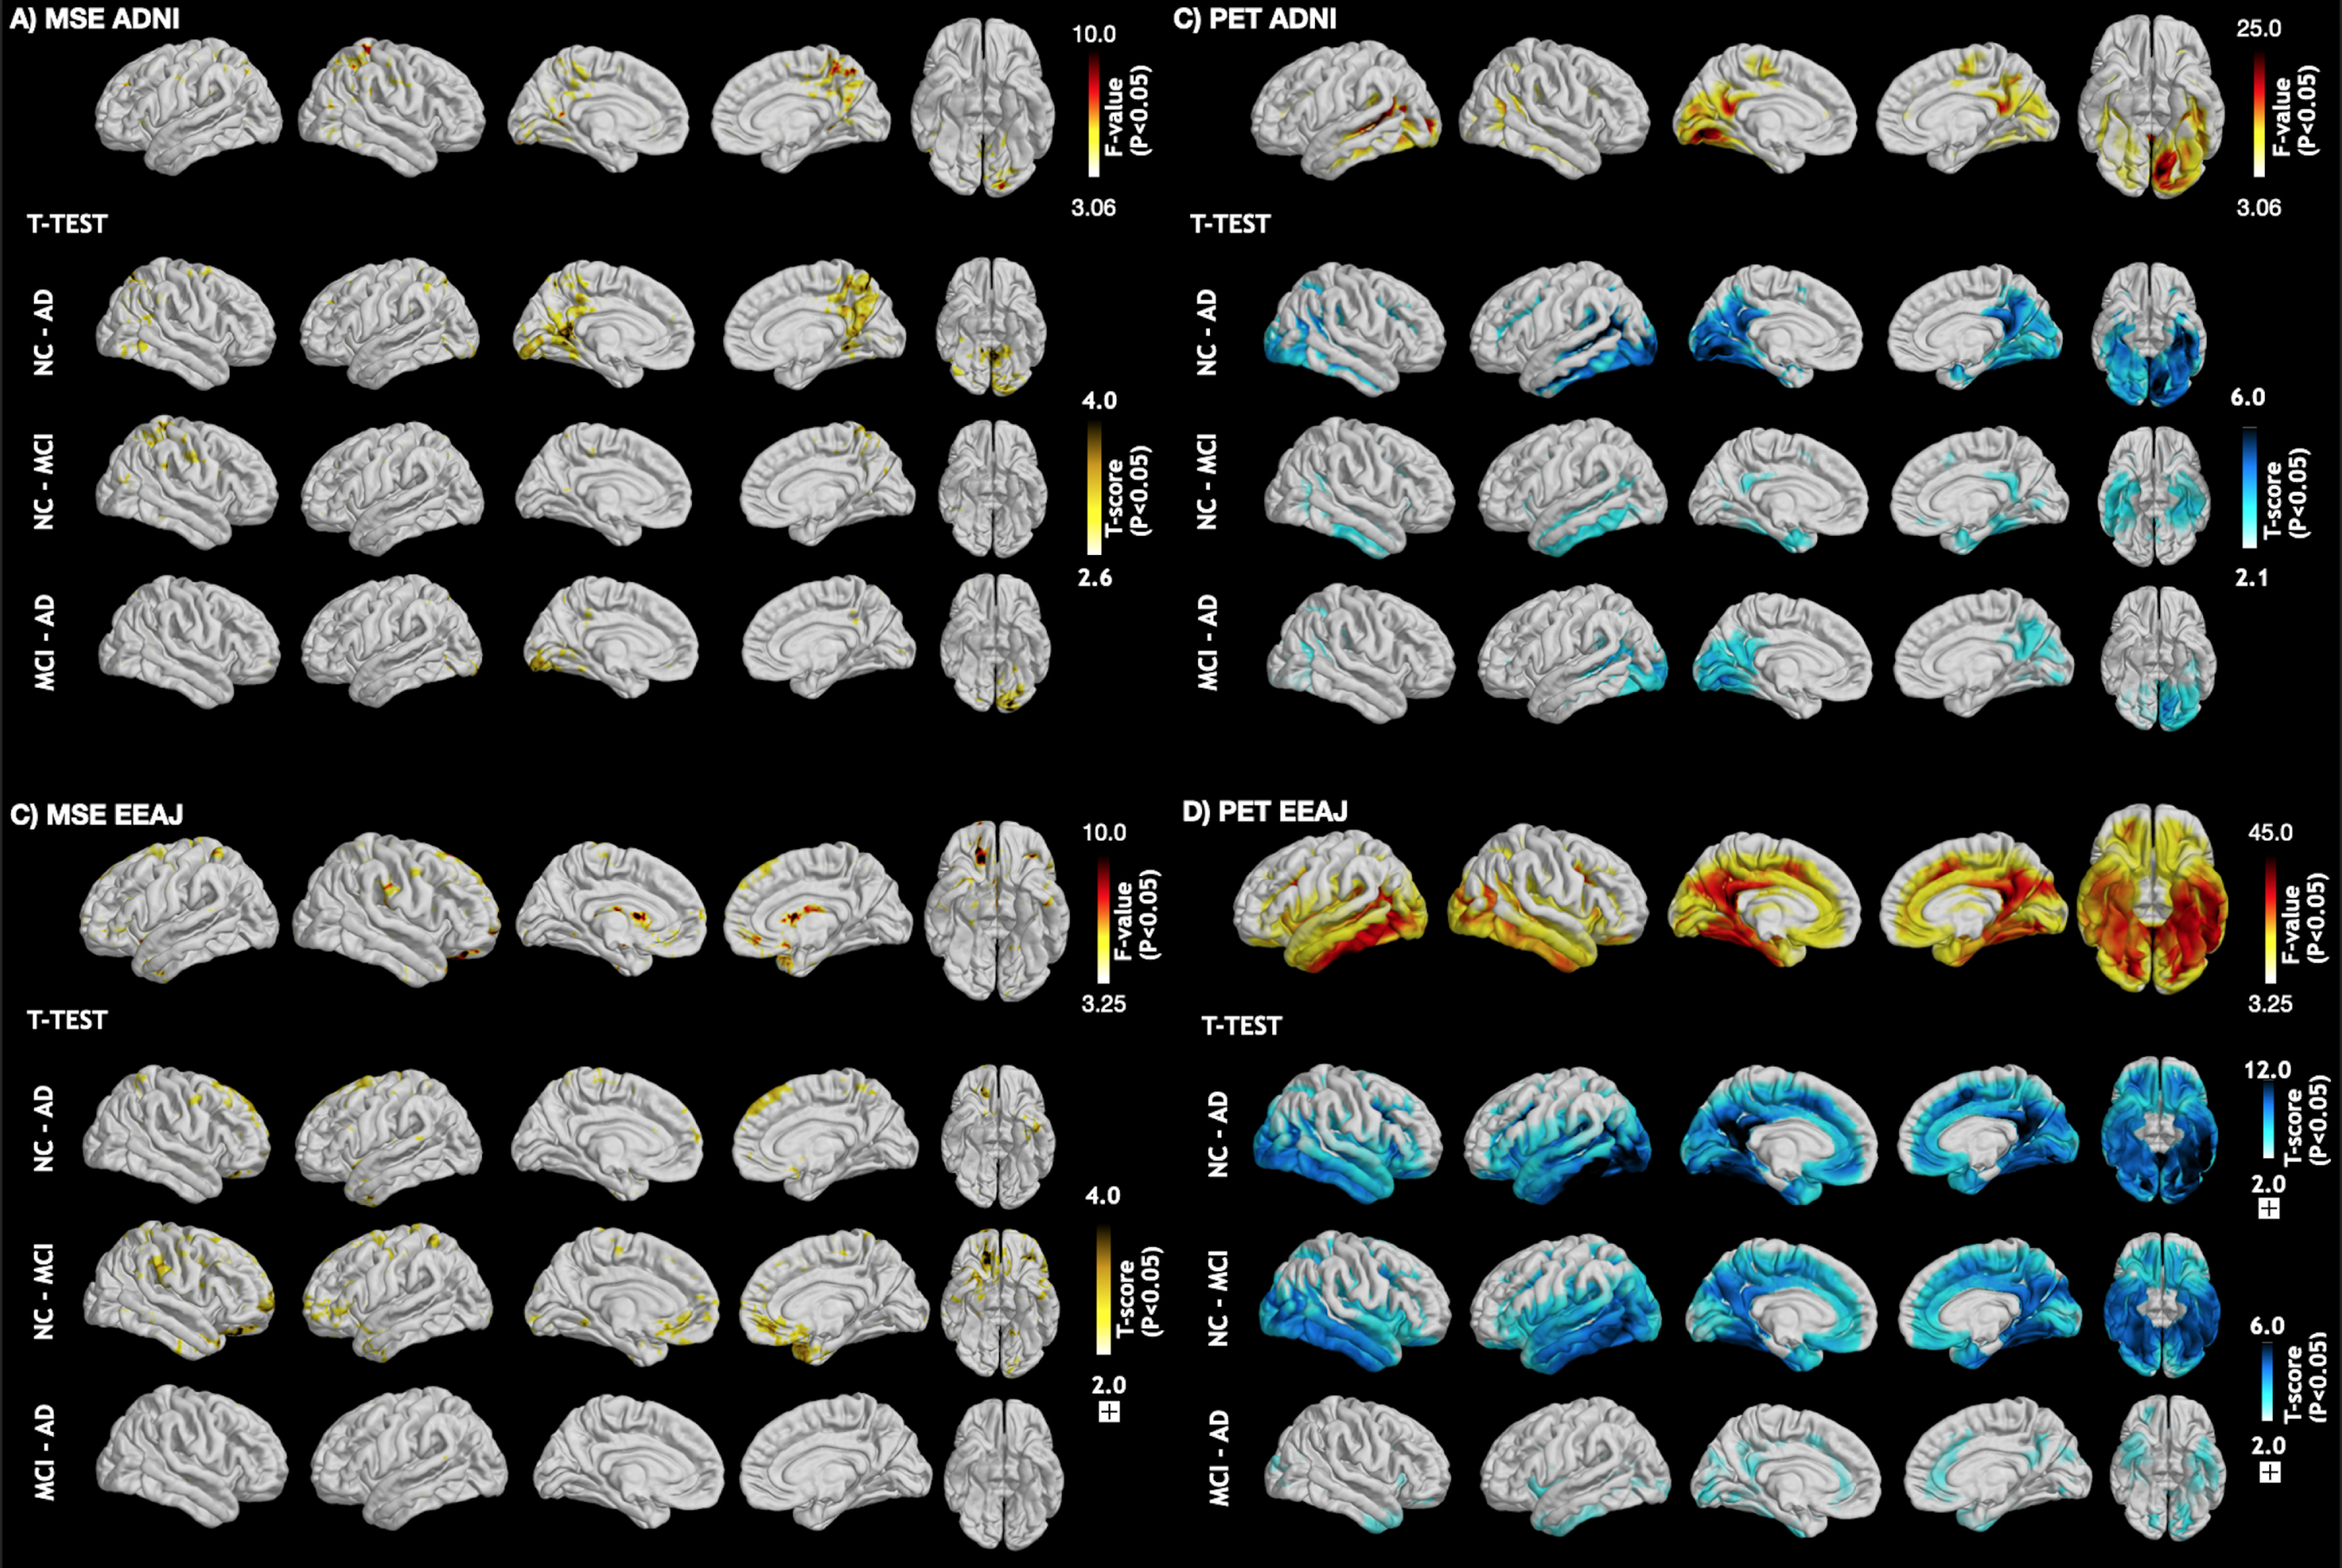
Figure 1 displays the average maps for MSE at the highest scale as well as tau-PET SUVR for each subgroup of the ADNI (Fig. 1A, C) and EEAJ (Fig. 1B, D) cohort, respectively. It can be seen that in both cohorts MSE is higher in the CN compared to MCI and then AD groups (Fig. 1A, B). Notably, prominent MSE reduction can be observed in temporal lobes of MCI and AD groups compared to CN. Similarly, a gradual reduction of MSE with increasing disease severity can be observed in parietal and frontal cortices. In contrast, tau-SUVR manifests an increase from CN, MCI to AD, notably in inferior temporal areas and PCC along with slower increases in the frontal cortex (Fig. 1C, D). Direct statistical analysis of differences across the three groups in each cohort by means of ANOVA confirmed a statistically significant difference in tau-PET SUVR in inferior temporal lobes, PCC, and also in areas of the dLPFC in both cohorts (Fig. 2C, D). For MSE, the effects were less widespread but significant differences were found in inferior temporal lobe, precuneus/PCC as well as in prefrontal cortex (Fig. 2A, B). These findings suggest an overall inverse association between MSE and tau-PET, which will be elaborated in the correlation analysis below.
Fig. 1
Mean maps for rs-fMRI complexity and tau-PET SUVR in subgroups of both cohorts. CN, cognitively normal; MCI, mild cognitive impairment; AD, Alzheimer’s disease; MSE, multi-scale entropy.
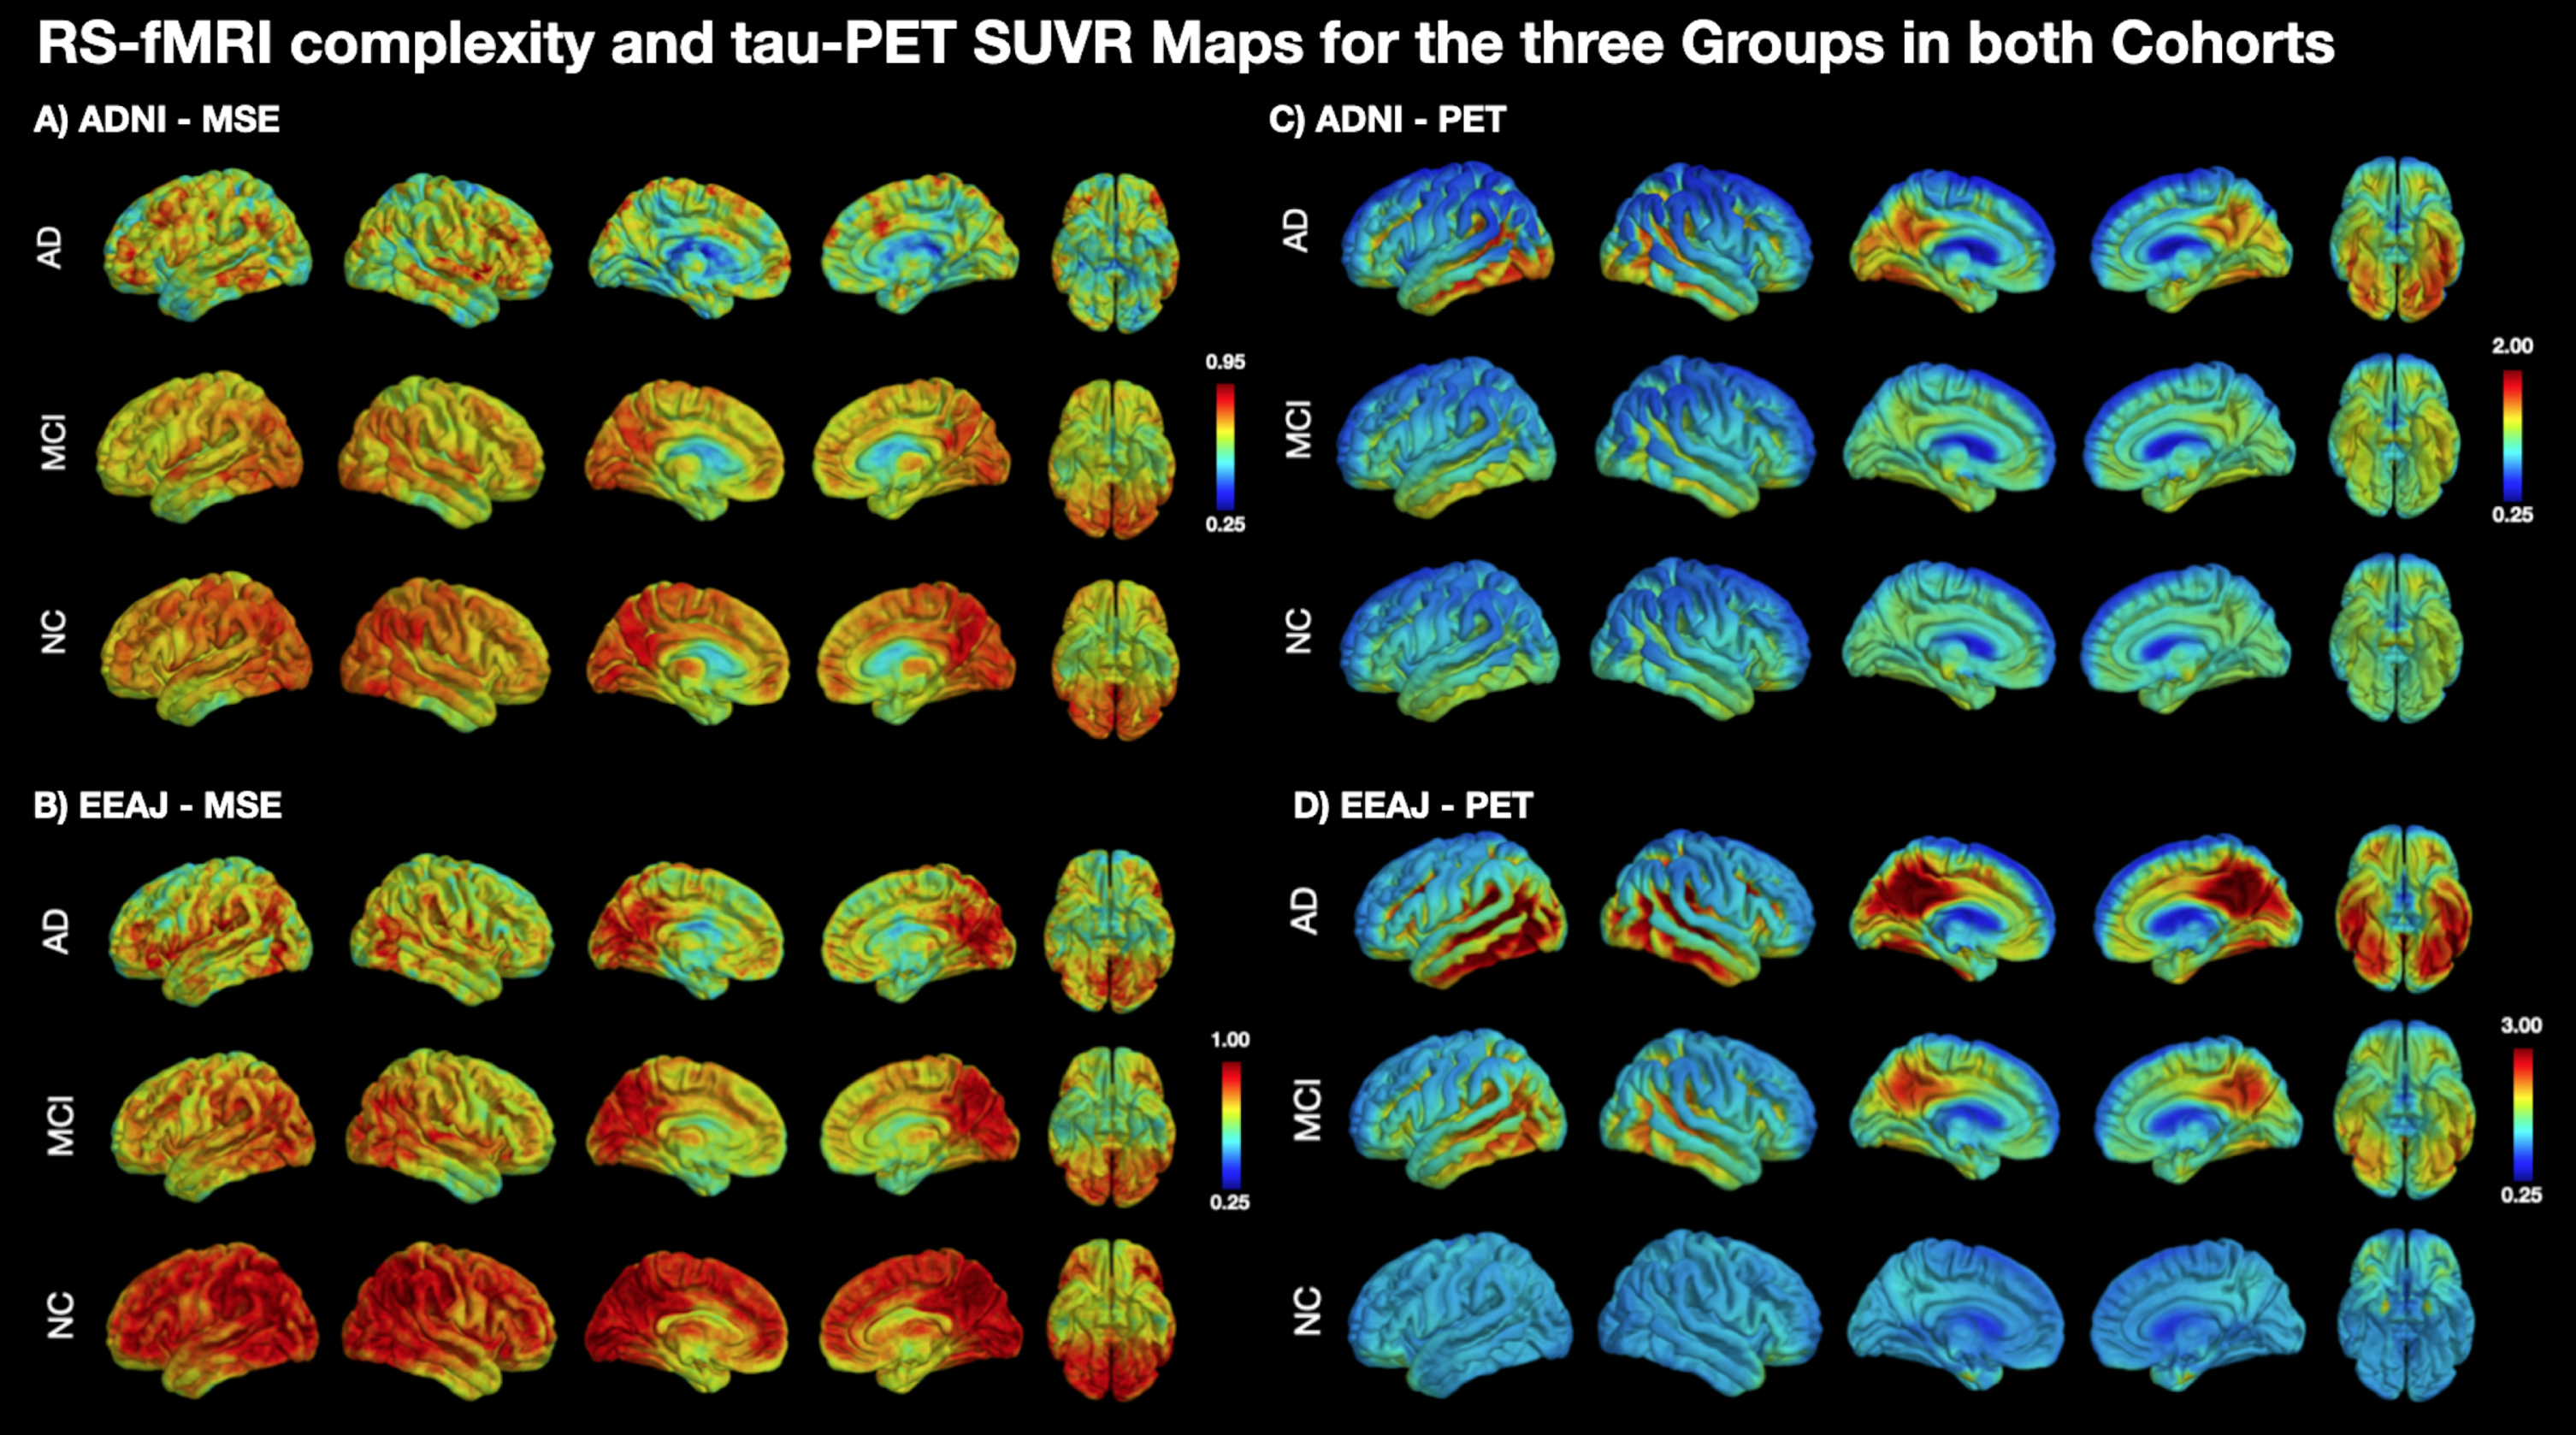
Fig. 2
ANOVA and post-hoc t-test maps comparing (A + B) MSE and (C + D) the tau-PET SUVR values across the three groups (CN, MCI, AD) in each cohort. CN, cognitively normal; MCI, mild cognitive impairment; AD, Alzheimer’s disease; MSE, multi-scale entropy.
Association between entropy and tau-PET
Associations between MSE and tau-PET SUVR, were estimated by Spearman correlations, including age, gender, and regional gray matter volume as covariates, both on a voxel-wise level as well as for larger ROIs based on the AAL atlas parcellation.
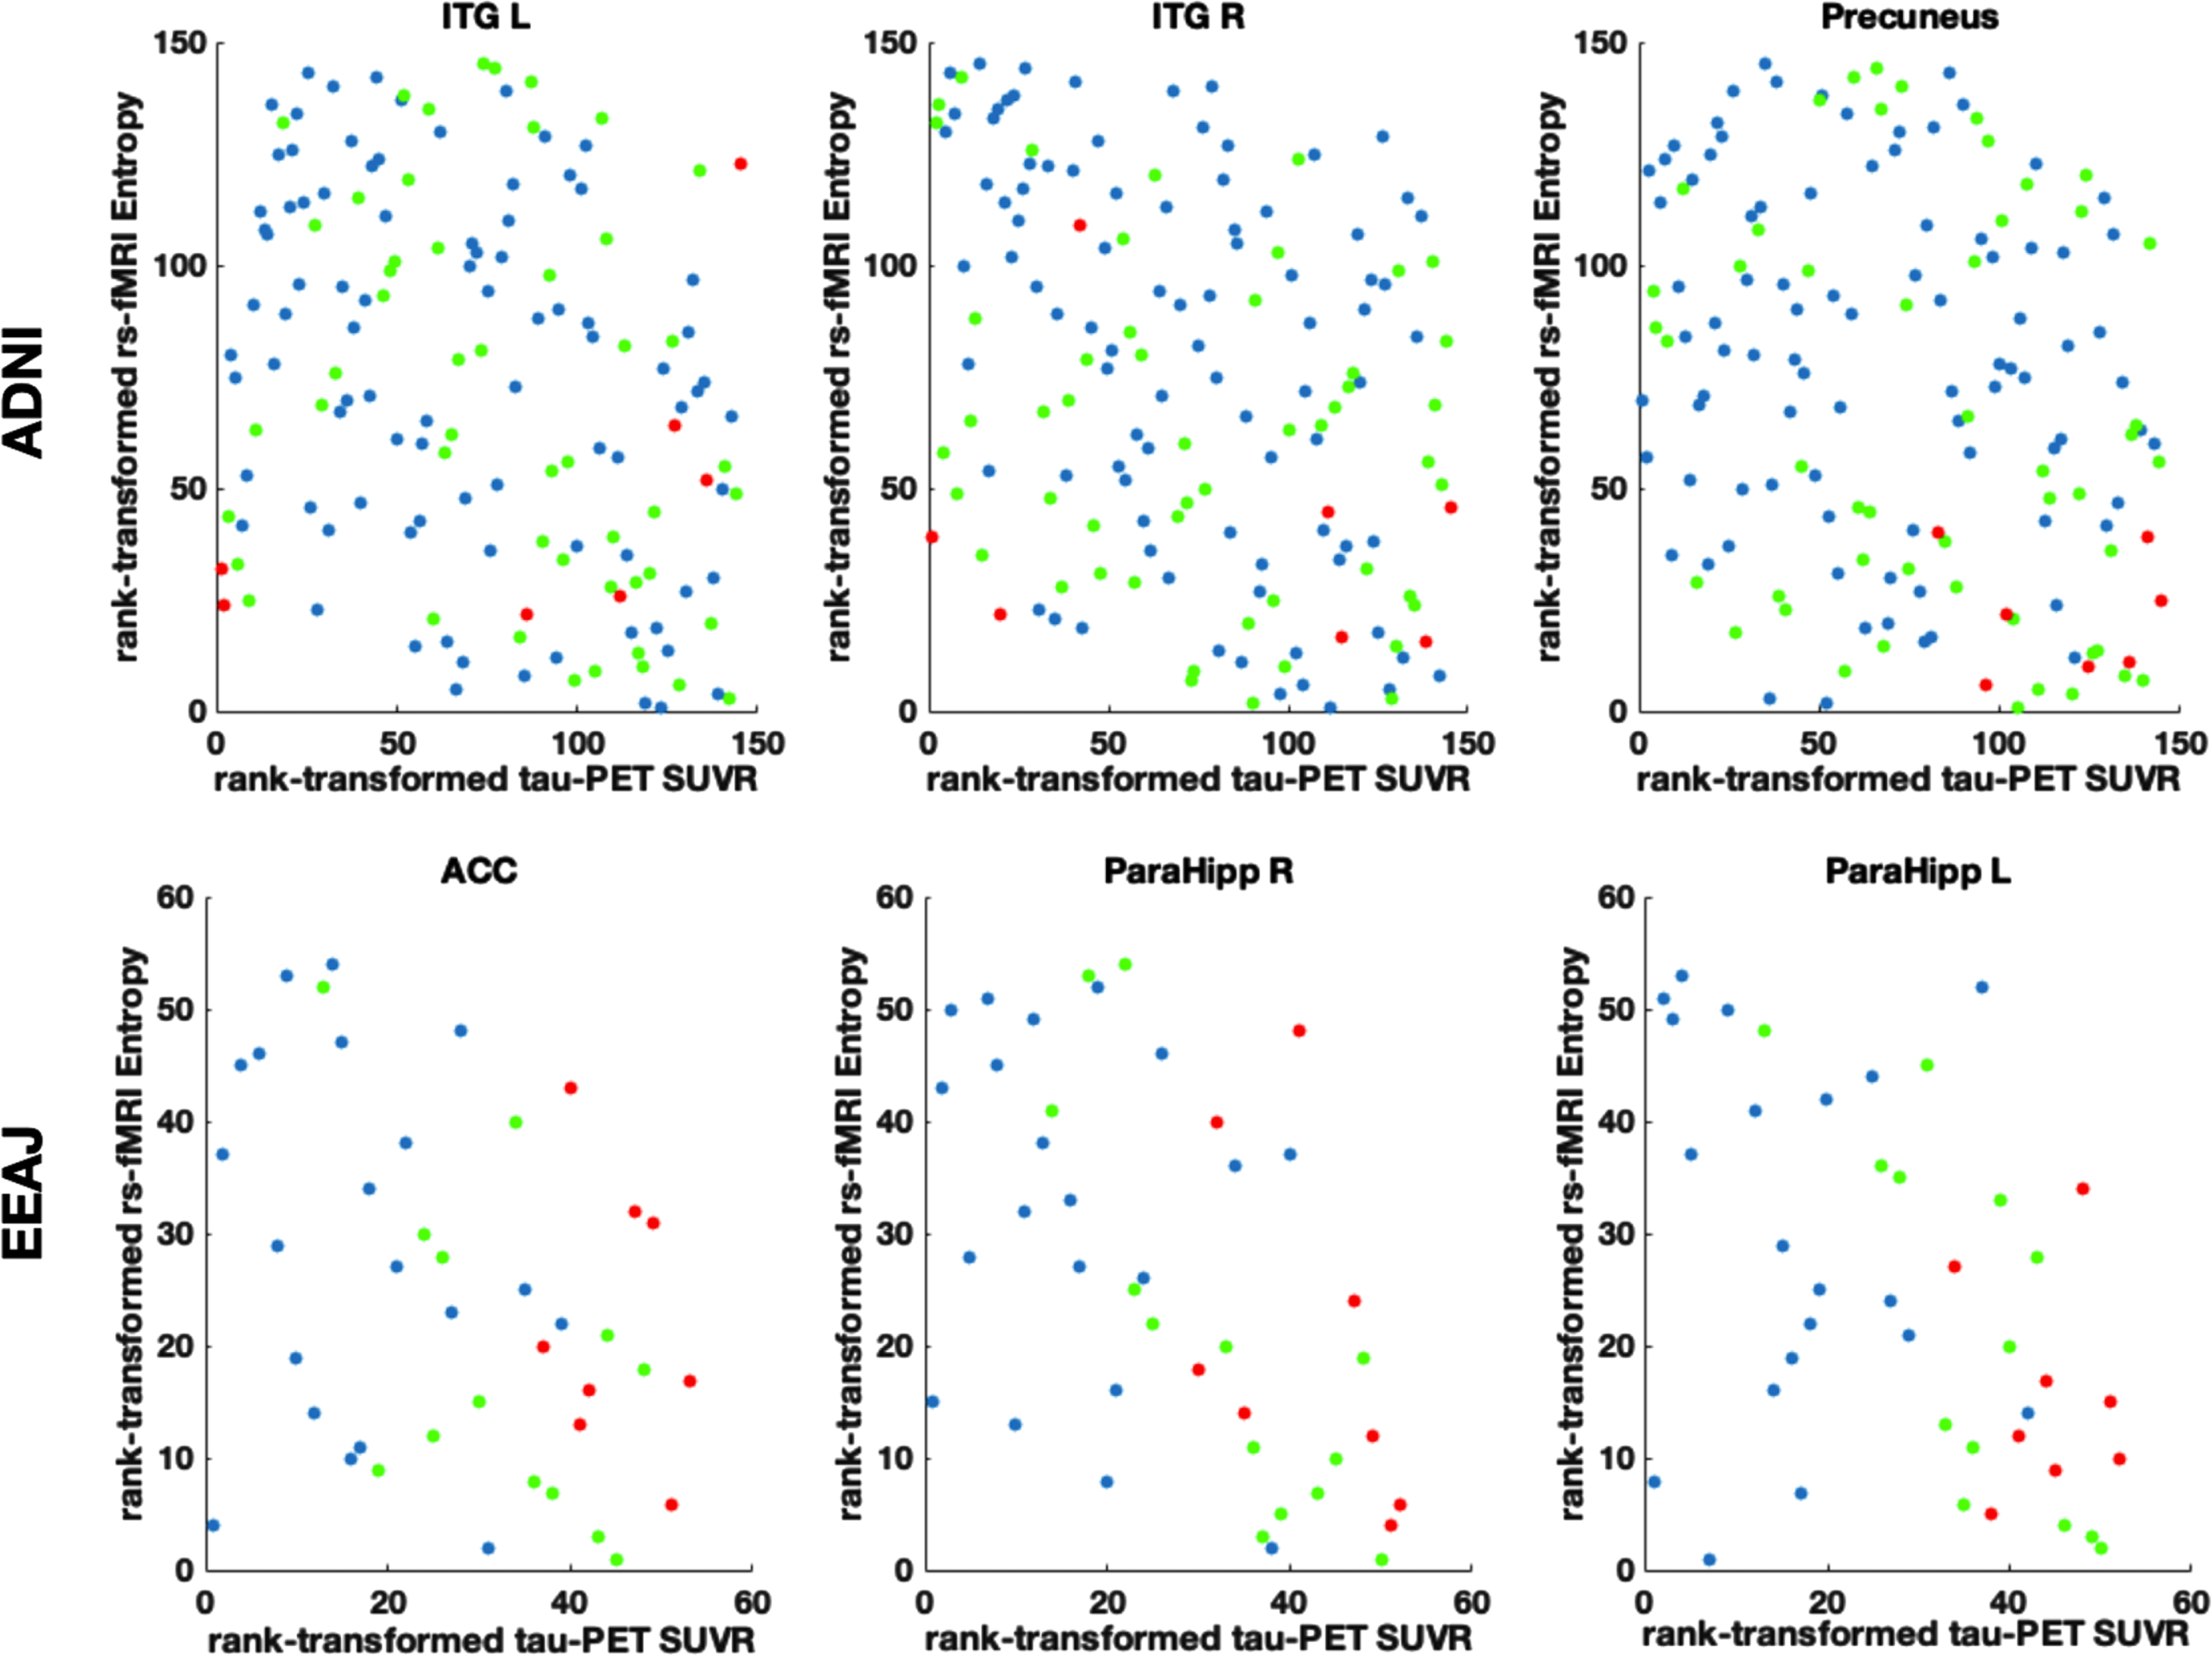
For the ADNI cohort, the voxel-wise analysis revealed a number of significant negative correlations between MSE and tau-PET. Notably, there were clusters in lateral and inferior temporal lobe, superior parietal lobe, and lateral frontal lobe (Fig. 3A). For the EEAJ cohort, we found significant negative correlations in bilateral parahippocampal gyri, lateral temporal lobe, anterior cingulate cortex (ACC), and lateral frontal lobe (Fig. 3C). The ROI-based analysis revealed significant negative correlations in left hippocampal gyrus, bilateral lingual gyrus, and occipital lobe for the ADNI cohort (Fig. 3B). The EEAJ cohort also showed strong significant negative correlations in bilateral parahippocampal, fusiform gyrus, as well as ACC, precuneus, and right lateral frontal lobe (Fig. 3D). There were no areas with positive correlation in either cohort or analysis. We further extracted the values from the clusters with significant results in the voxel-wise analysis and display the relationship between MSE and tau-PET in Fig. 4 (and Supplementary Figure 7). Overall, these results confirmed negative relationships between rs-fMRI MSE and tau-PET deposition in areas associated with AD progression. In the ADNI cohort, we observed statistically significant negative associations in the precuneus cluster (r=–0.25, p = 0.003) and two clusters in the inferior temporal lobe, left inferior temporal gyrus (ITG) (r=–0.31, p = 0.0002), and right ITG (r=–0.35, p = 0.00002). In the EEAJ cohort, all three ROIs also exhibited strong negative significant correlations: ACC (r=–0.45 p = 0.005), left parahippocampus (r=–0.50 p = 0.002), and right parahippocampus (r=–0.53 p = 0.0006).
Fig. 3
Left panel: Voxel-wise associations between rs-fMRI complexity and tau-PET SUVR in ADNI (A) and EEAJ (C) cohorts. Right panel: AAL atlas regional associations between rs-fMRI complexity and tau-PET SUVR in ADNI (B) and EEAJ (D) cohorts. AAL, automated anatomical labeling atlas. ScholAR QR code will enable augmented reality 3D visualization of the results displayed in the left panel using the Schol-AR app or opening manuscript pdf in https://www.schol-ar.io/reader. A citation for Schol-AR: Ard T, Bienkowski MS, Liew S-L, Sepehrband F, Yan L, Toga AW, Integrating Data Directly into Publications with Augmented Reality and Web-Based Technologies - Schol-AR (2022) Scientific Data 9: 298. https://www.nature.com/articles/s41597-022-01426-y
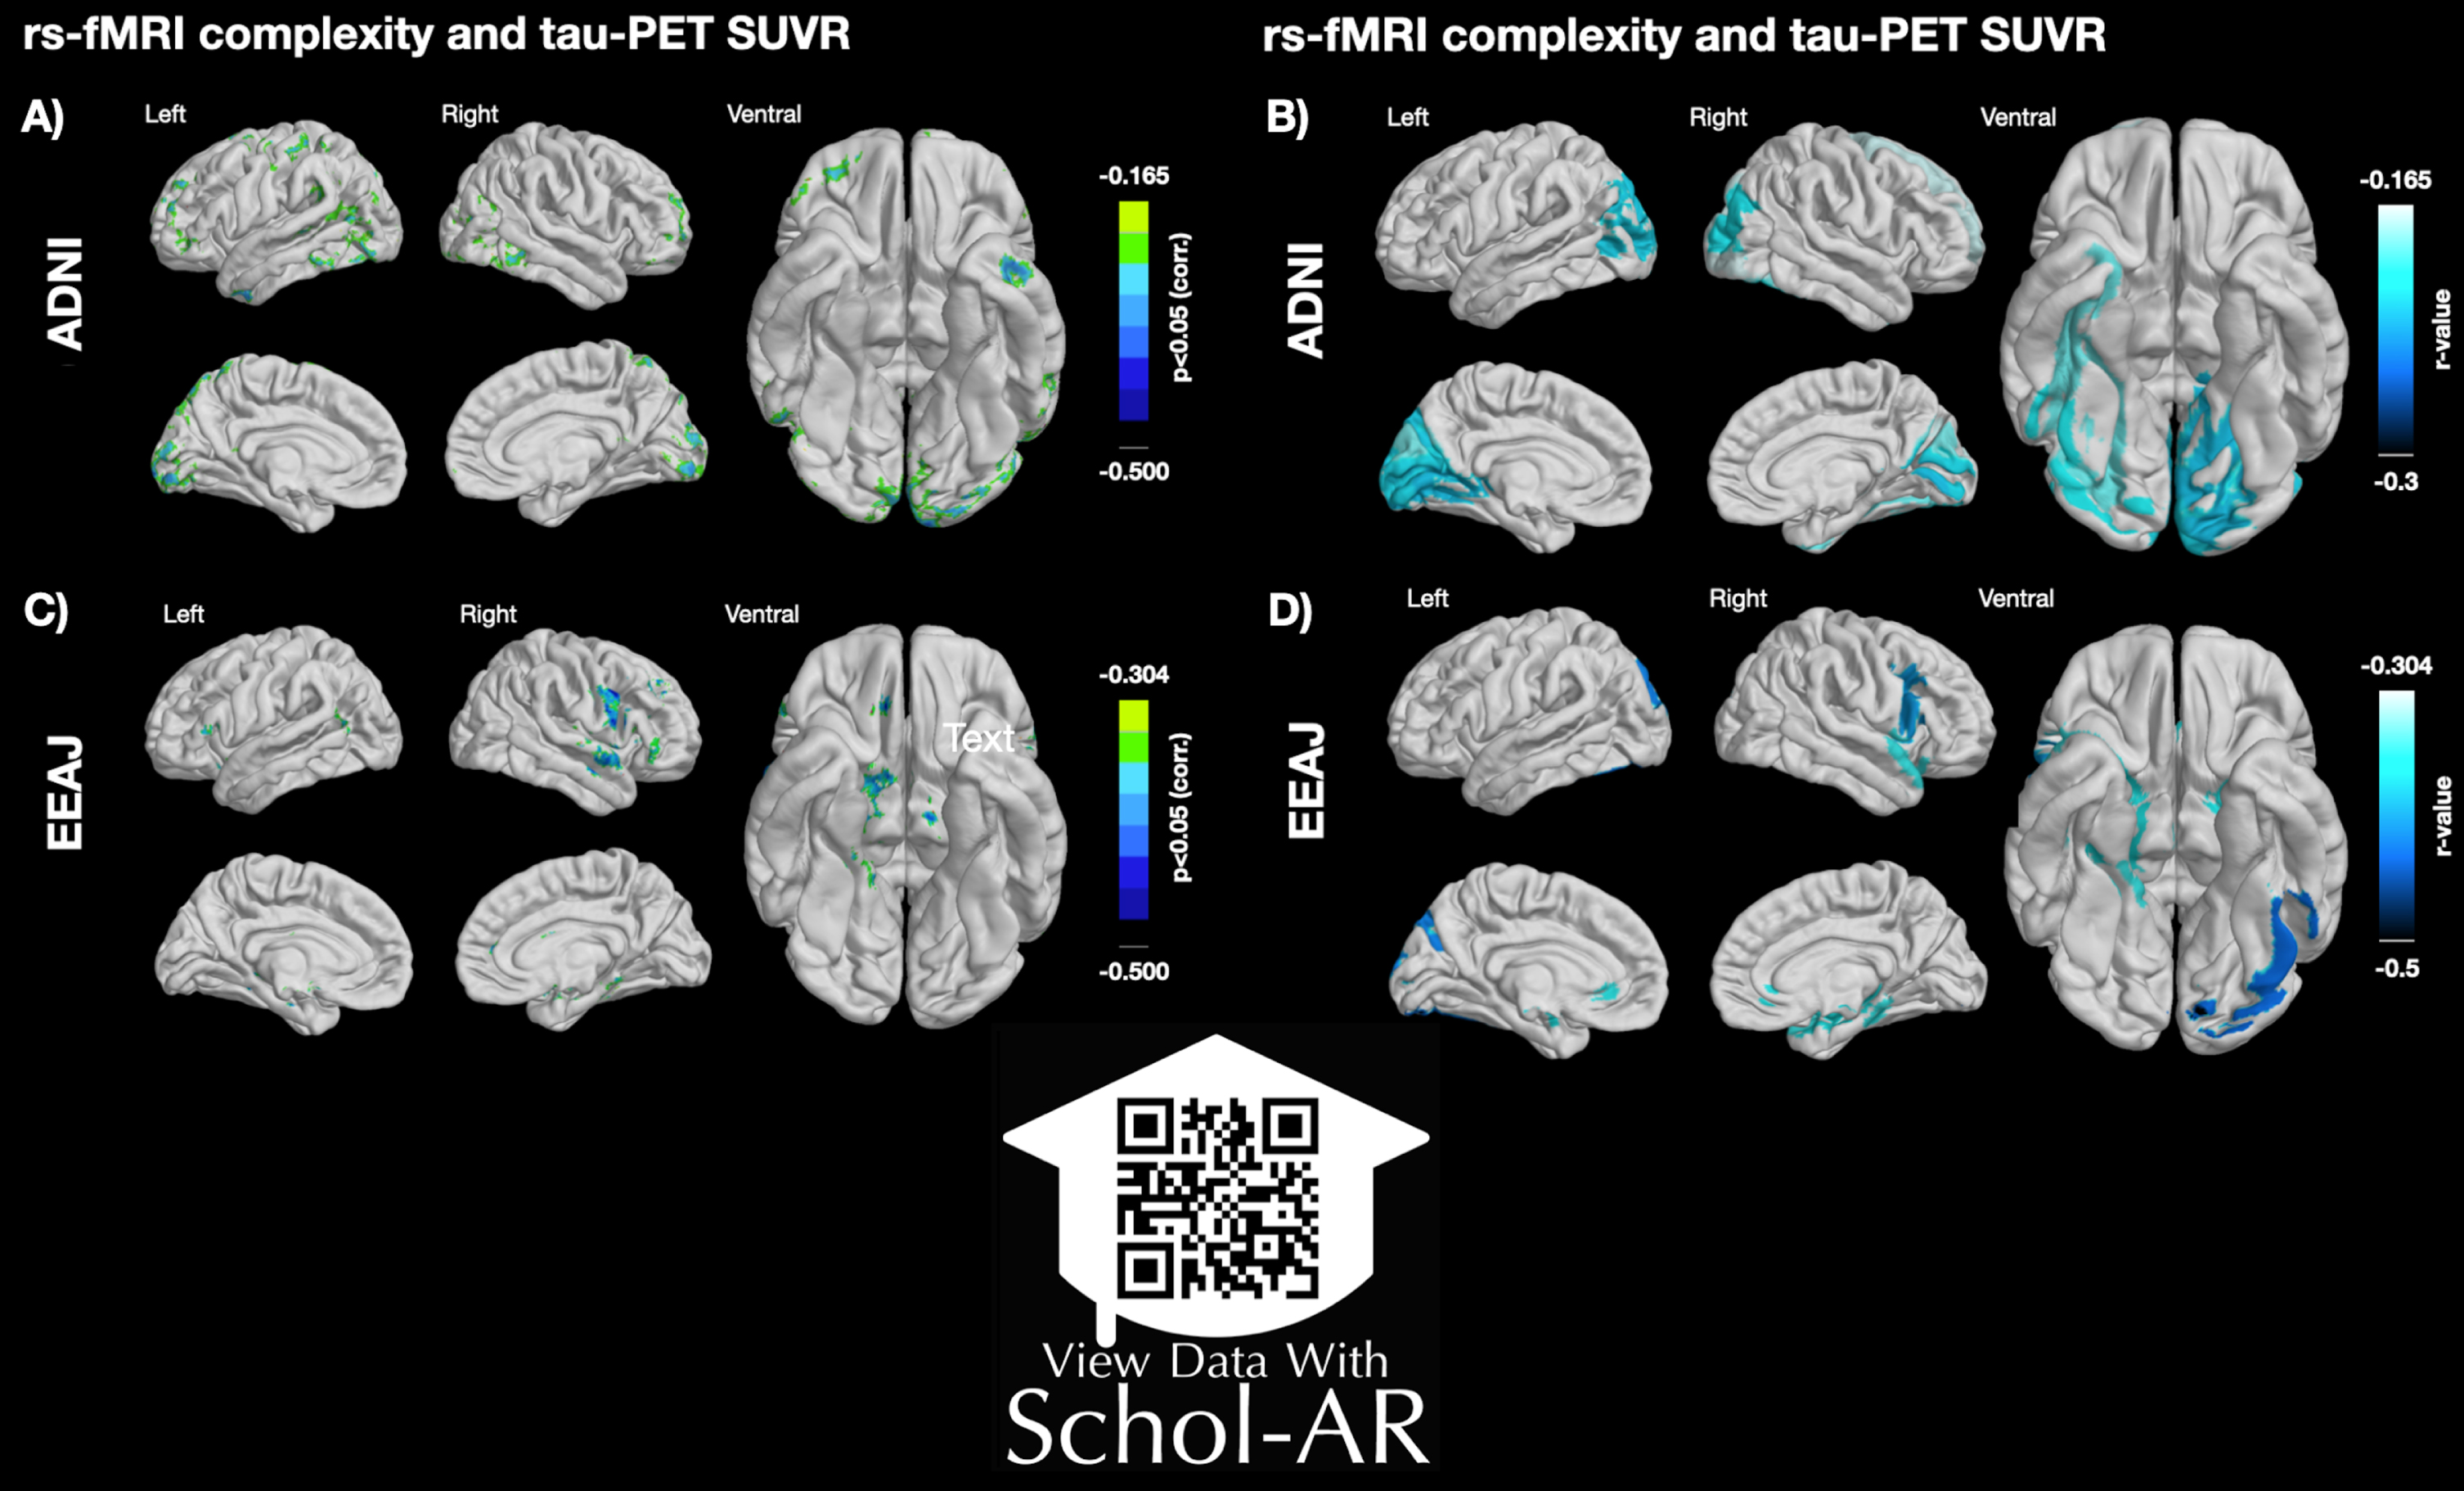
Fig. 4
Scatter plots in three selected regions of interest (ROIs) displaying the relation between rank transformed rs-fMRI complexity and tau-PET SUVR values. ACC, anterior cingulate cortex; ITG R/L, inferior temporal gyrus left/right; ParaHipp L/R, parahippocampal gyrus left/right. Partial regression plots for these data including adjustments for covariates of age and gender can be seen in Supplementary Figure 7.
Relation between entropy, tau-PET, and cognitive decline
The voxel-wise correlation maps for rank-transformed MMSE and CDR-SOB revealed exclusively positive and negative correlations with MSE, respectively. Most prominent were these associations within areas in the ACC, PCC, dlPFC as well as in parahippocampal gyrus for ADNI and in dlPFC, ventromedial PFC, and parahippocampal gurys in EEAJ cohorts (Fig. 5).
Fig. 5
Voxel-wise correlation maps visualizing the association between fMRI complexity and MMSE (A) and CDR-SOB (B) in each cohort. MMSE, Mini-Mental State Exam; CDR-SOB, Cognitive Dementia Rating Sums of Boxes.
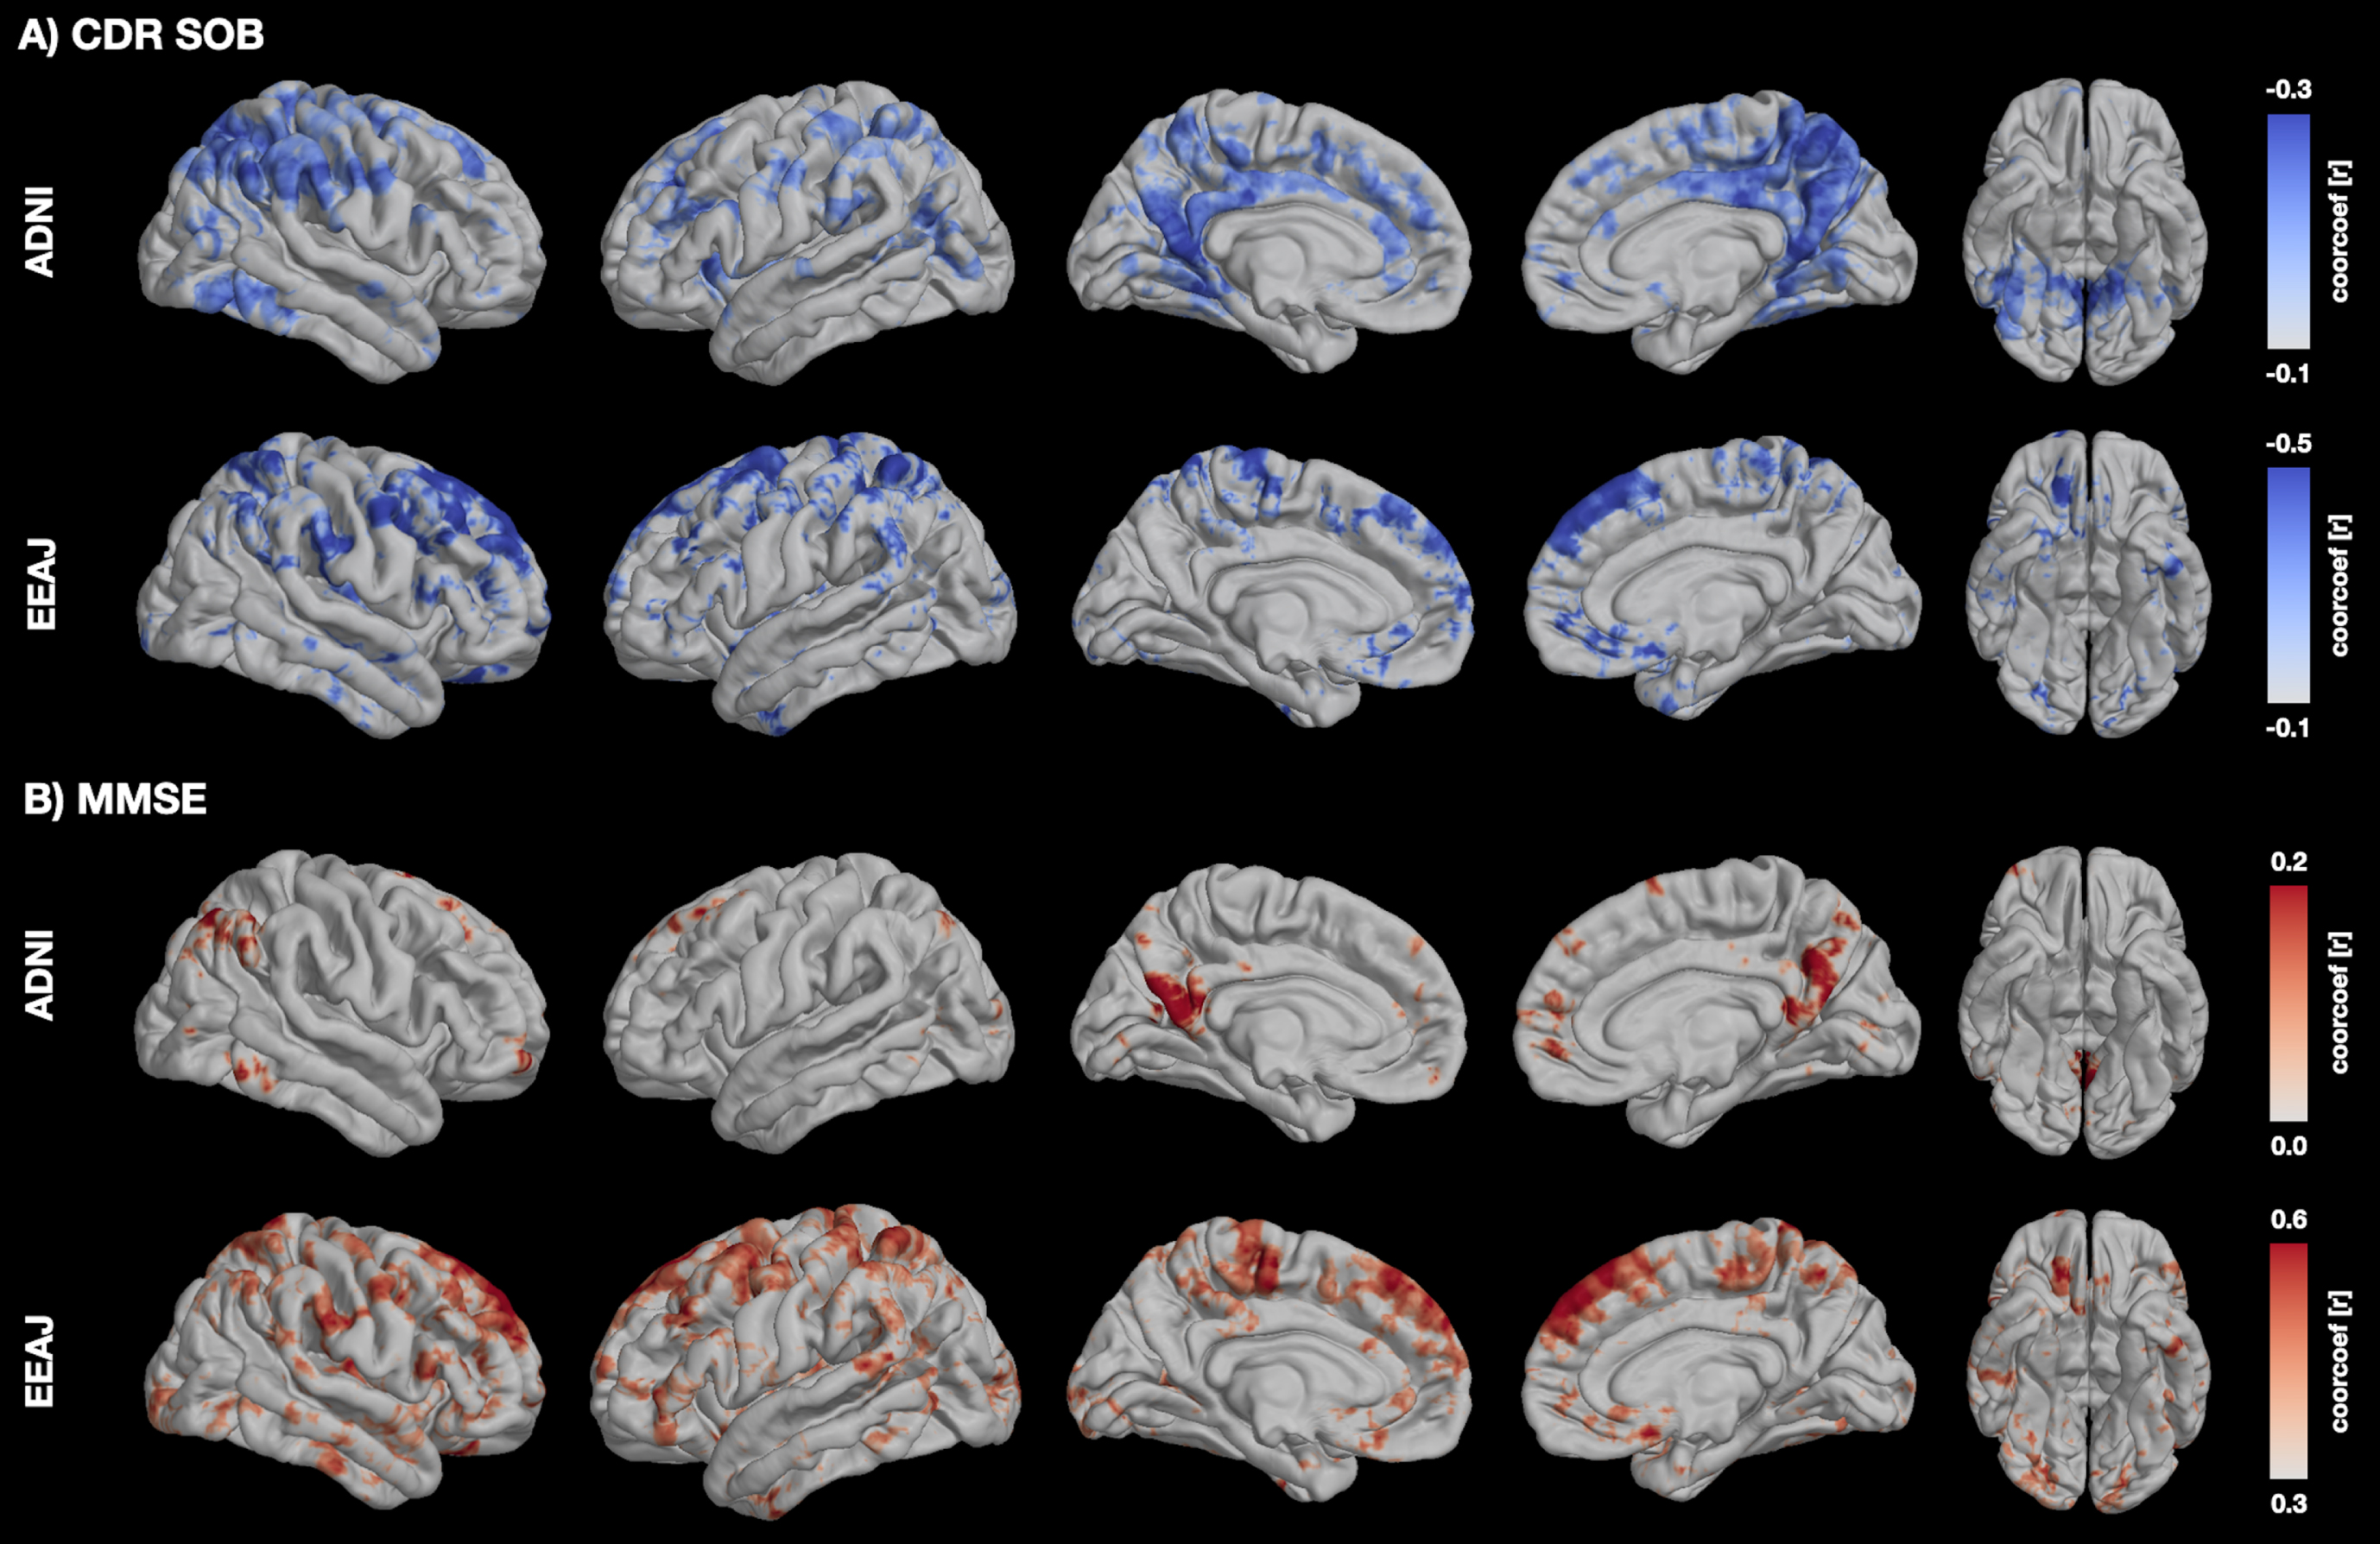
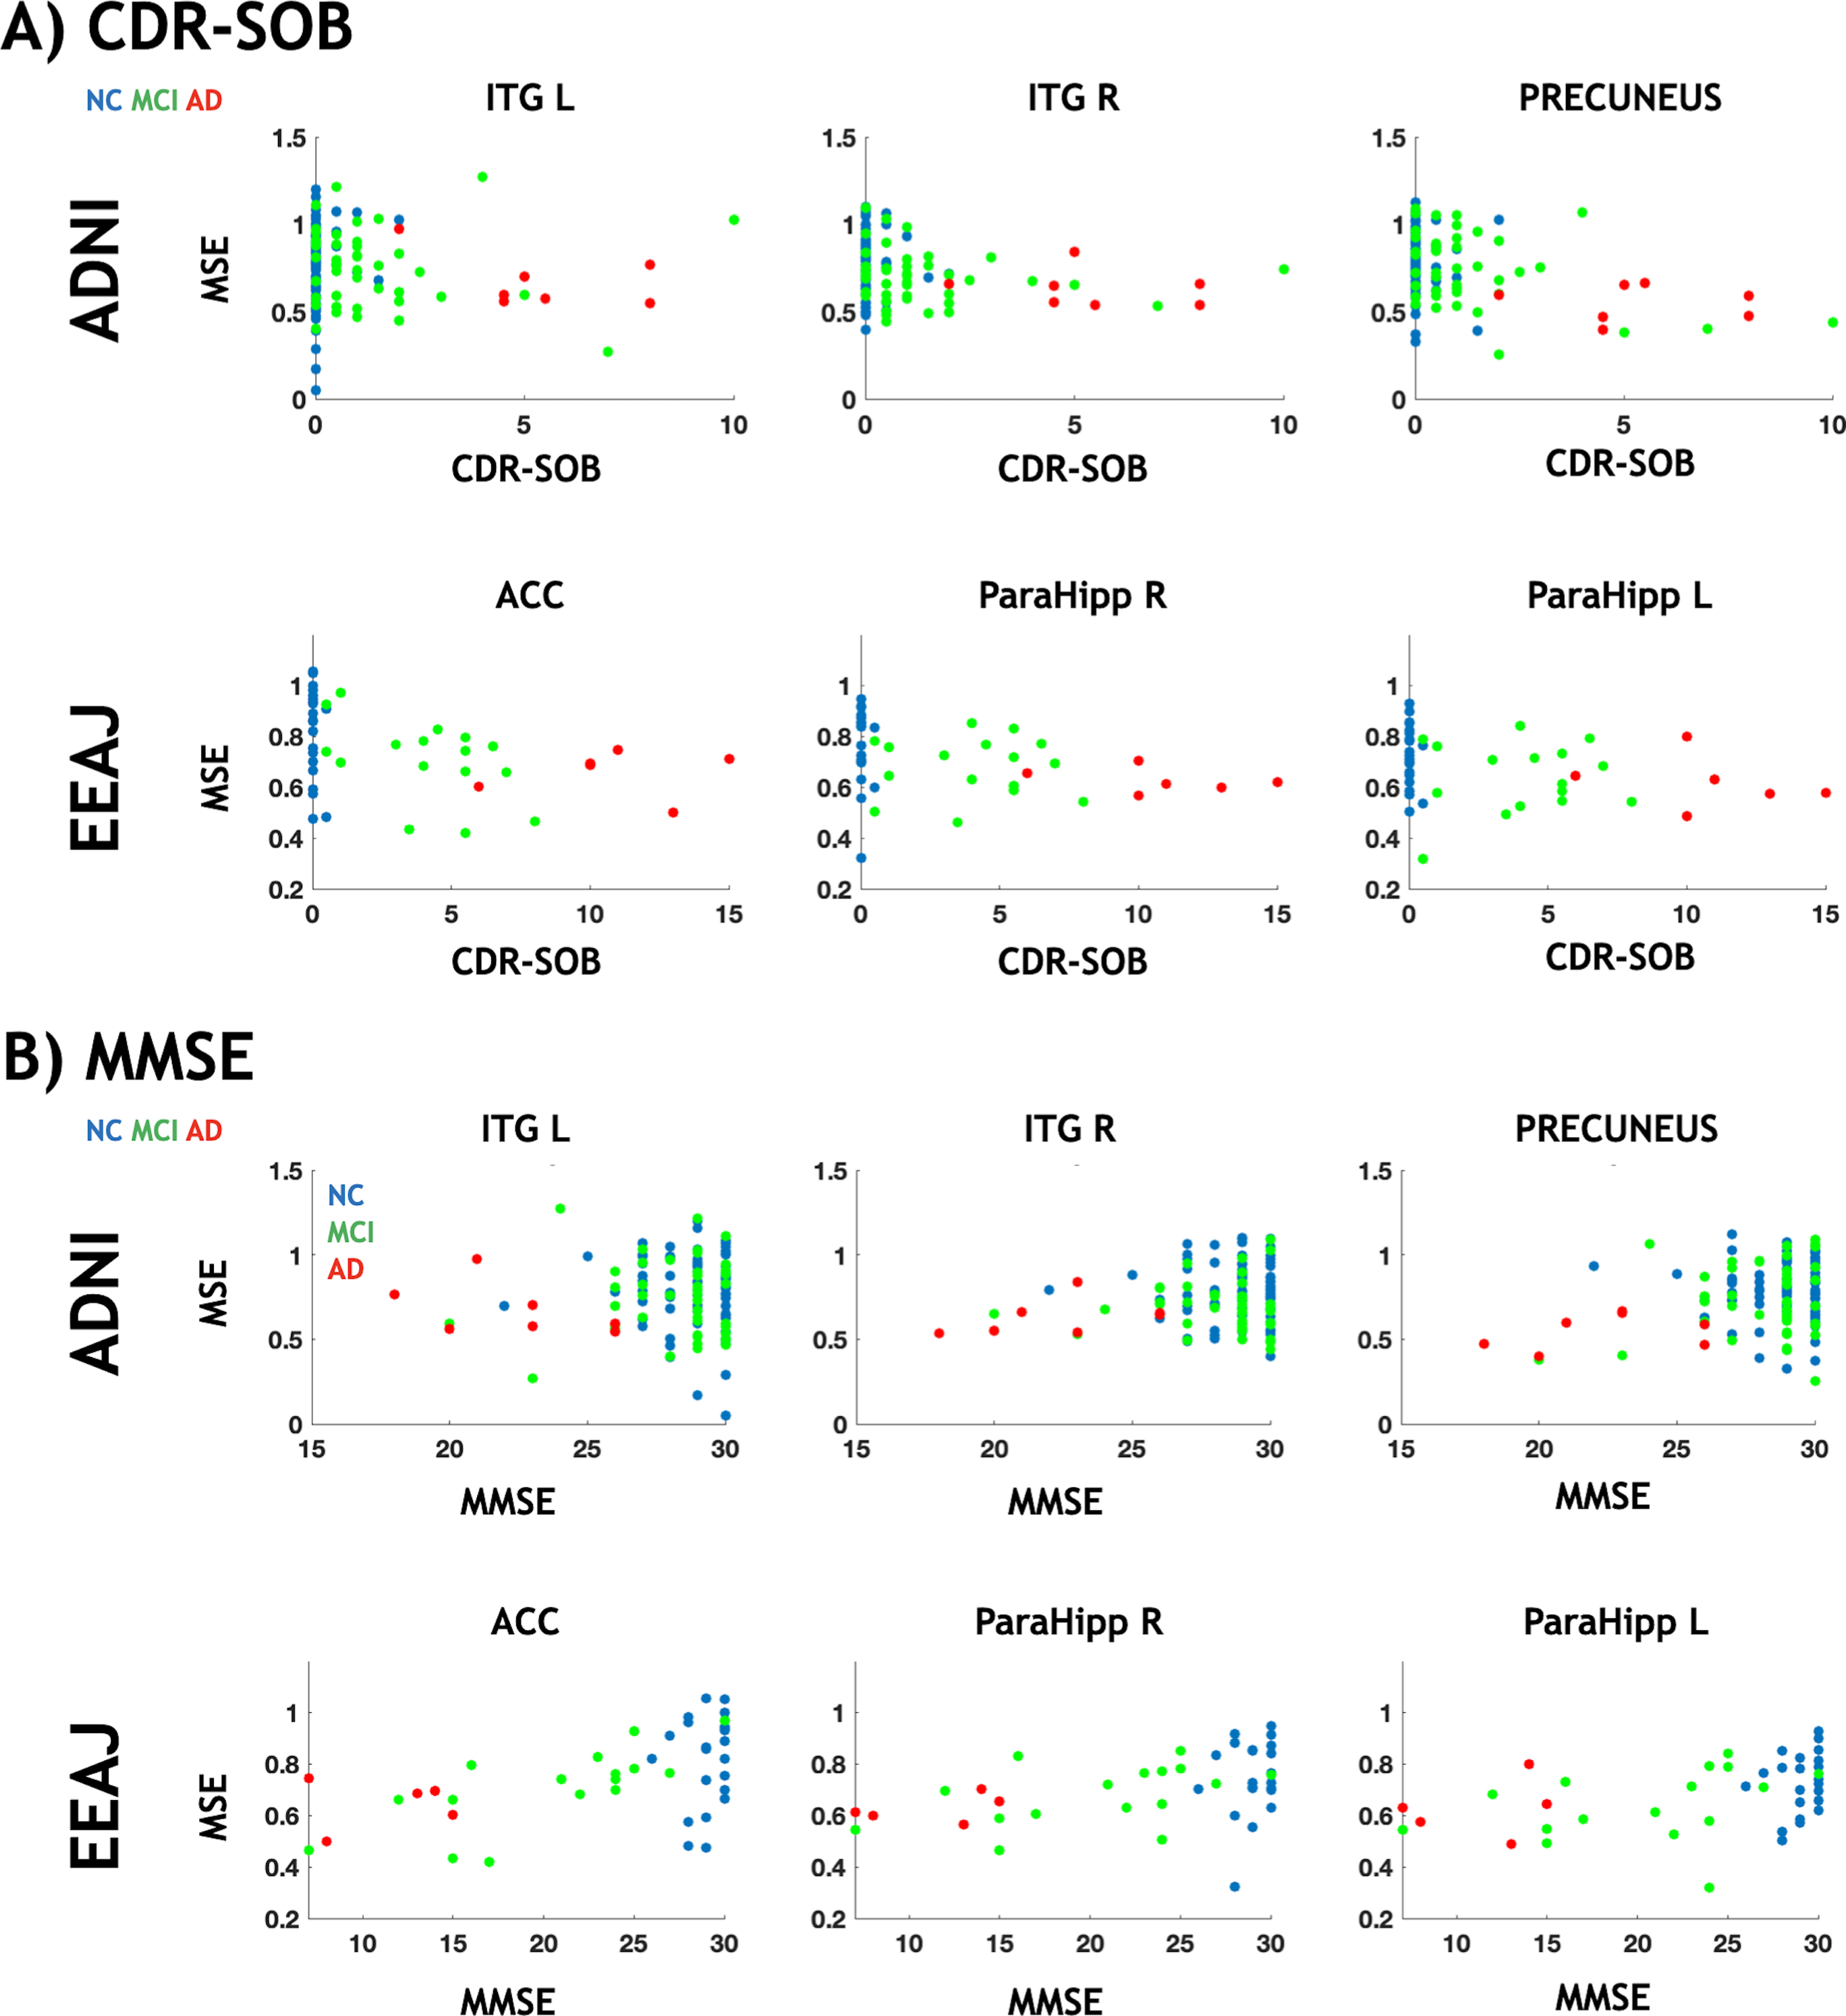
To confirm the link between alterations in MSE and cognitive decline in areas specifically associated with tau, we performed partial correlation analyses for CDR-SOB and MMSE against MSE, respectively, accounting for age, gender, and regional GM as covariates (Fig. 6 and Supplementary Figure 8). For this reason, we used the same clusters from the voxel-wise analysis that showed significant associations between MSE and tau-PET. For CDR-SOB (Fig. 6A), we found statistically significant negative correlations for two ROIs in ADNI (Precuneus r = -0.41, p < 0.0001 and right ITG r = -0.22, p = 0.008) and for left parahippocampus in EEAJ (r=–0.43, p = 0.007) (Fig. 4A). ACC (r=–0.35, p = 0.025) and right parahippocampus (r=–0.34, p = 0.031) did show negative correlation between MSE and CDR-SOB in EEAJ but did not reach significance. For MMSE (Fig. 6B), we observed weak positive correlations in the ADNI cohort only reaching significance in the precuneus cluster (r = 0.25, p = 0.002) but not in the two inferior temporal lobe areas (left ITG r = 0.03, p = 0.659; right ITG r = 0.14, p = 0.094). In contrast, the EEAJ cohort displayed highly significant positive correlations between MMSE and MSE in ACC (r = 0.52, p = 0.001), and bilateral parahippocampal clusters (left r = 0.55, p = 0.0004; right r = 0.39, p = 0.016). These findings indicate that with progressing cognitive decline there is a decreasing complexity of rs-fMRI BOLD signal.
Fig. 6
Scatter plots between rs-fMRI complexity and cognition. MMSE, Mini-Mental State Exam; CDR, Cognitive Dementia Rating; ACC, anterior cingulate cortex; ITG R/L, inferior temporal gyrus left/right; ParaHipp L/R, parahippocampal gyrus left/right. Partial regression plots for these data including adjustments for covariates of age and gender can be seen in Supplementary Figure 8.
The mediation analysis for ADNI data revealed statistically significant indirect (mediation) effects of tau-PET (14.85 95% confidence interval (CI) (0.5,30.67)) on the total association between MSE and rank-transformed MMSE (22.08 95% CI (-18.12,62.28)) in the right ITG ROI. The two other ROIs did not show statistically significant mediation effects for MMSE (Precuneus: total 37.95 95% CI (2.32,73.58)), indirect 6.88 95% CI (-1/17,16.51), left ITG: total -2.55 95% CI (-33.41,28.32)), indirect 7.52 95% CI (-0.69,21.02)). For rank-transformed CDR-SOB, we did not find significant mediation effects but significant total effects in right ITG (total -49.58 95% CI (-82.54,-16.62) indirect 1.23 95% CI (-12.42,12.75)) and Precuneus (total -56.07 95% CI (-84.26,-27.89) indirect -4.13 95% CI (-17.32,3.27)) while the left IGT did not show any significant effect (total -19.91 95% CI (-45.47,5.64)) indirect -2.6 95% CI (-16.10,2.5)).
In the EEAJ cohort, mediation analysis revealed statistically significant indirect (mediation) effects of tau-PET on the total association between MSE and MMSE (rank-transformed) in both parahippocampi: Left: total 32.01 95% CI (3.36,60.39), indirect 34.29 95% CI (12.53,60.73) and Right: total 35.73 95% CI (13.6,57.85), indirect 23.99 95% CI (5.16,61.75), as well as in ACC: total 28.51 95% CI (14.58,42.44), indirect 11.49 95% CI (3.05,23.58). Furthermore, CDR-SOB (rank-transformed) also showed statistically significant associations with MSE with mediation by tau-PET in left parahippocampus (total -17.34 95% CI (-47.11,12.43), indirect -32.15 95% CI (-58.5,-10.36)), right parahippocampus (total -28.79 95% CI (-52.23,-5.35), indirect -23.09 95% CI (-49.45,-6.07)) and ACC (total -20.53 95% CI (-37.47,-3.59), indirect -12.32 95% CI (-25.86,-3.66)). Figure 7 shows a conceptual model of mediation effect and summary of mediation analysis. Overall, with progressing cognitive decline there is decreasing complexity of rs-fMRI BOLD signal.
Fig. 7
Conceptual visualization of mediation effect modeling and summary table of mediation analysis. MMSE, Mini-Mental State Exam; CDR, Cognitive Dementia Rating; ACC, anterior cingulate cortex; ITG R/L, inferior temporal gyrus left/right; ParaHipp L/R, parahippocampal gyrus left/righ).
DISCUSSION
In this study we tested a hypothesis on the relationship between tau deposition and complexity of rs-fMRI BOLD signal fluctuations. This hypothesis was motivated by growing literature indicating that the accumulation of tau protein in specific brain areas is related to cognitive decline in AD [10, 11, 40] and emerging evidence suggesting that complexity of rs-fMRI signal decreases with aging, APOE genotype, and cognitive decline [25, 28, 35]. These data prompted our hypothesis that areas manifesting increases in tau deposition measured by tau-PET should exhibit reduced complexity of rs-fMRI measured by MSE. We focused on the entropy of low-frequency fluctuations which have been reported to be most sensitive to cognitive decline by filtering out noise-like high frequency fluctuations. Our main findings in the two independent cohorts revealed an exclusively negative correlation between tau-PET and MSE, and decreases in MSE with more severe cognitive impairment in AD-associated brain areas. Although the voxel-wise association analysis showed limited spatial overlap between the cohorts, our overall hypothesis of associations between MSE, ta-PET and cognition was confirmed.
For the ADNI and EEAJ cohorts, there was a visible increase in tau-PET SUVR in temporal, parietal, and frontal areas, consistent with the literature and AD disease progression models. For MSE, we report high overall complexity in the normal controls and continuously reduced complexity in the MCI to AD groups. This reduction was especially pronounced in the temporal lobe and areas of the frontal lobe. Correlational analysis between tau-PET and MSE at the voxel level revealed sparse but significant negative correlations in the temporal cortex in both cohorts and additionally in the ACC in the EEAJ cohort.
Temporal and parietal regions have been most consistently reported to show entropy reductions in ADAD and LOAD populations. In our recent study, using an independent sample of CN and mild AD, we also found that the earliest reduction of MSE in the hippocampus is associated with reduced connectivity within the default mode network and cognitive decline [29]. The spatial pattern of entropy reduction and correlation with tau-PET in the ROI analyses matches the characteristic pattern of temporoparietal hypometabolism in AD detected by FDG-PET as well as higher tau protein accumulation in the temporal cortices of MCI/AD subjects [10, 41, 42].
We found a stronger association between MSE and tau-PET in the ADAD EEAJ cohort, while differences in fMRI complexity with disease progression were similar but weaker in the LOAD ADNI cohort. In particular, ADAD can be viewed as a “pure” form of AD without the comorbidities of aging and declining vascular health present in LOAD [17, 24, 43]. The ADNI cohort had by design much lower severity of cognitive impairment and participants were of advanced age such that additional comorbid pathology independent from tauopathy could have effects on fMRI complexity estimates. Thus, the weaker association between fMRI complexity and tau deposition could have been expected. On the other hand, the autosomal dominant EEAJ cohort was younger in age and neurovascular factors less prevalent, and we observed a much closer association between complexity and tau deposition in AD associated brain areas, specifically the parahippocampal gyrus in the voxel wise comparison, but also in the ROI based results. Another possible contribution to the stronger association observed in the ADAD population is the wider range of AD disease severity in this group. Overall, the observed differences of weaker association between fMRI complexity and tau-PET in LOAD compared to ADAD populations could indicate that vascular or other factors associated with aging may contribute substantially to cognitive decline in LOAD in combination with tau burden [44].
To confirm the association of fMRI complexity and tau-PET to global cognitive decline in AD, we performed correlation and mediation analyses in select ROIs. We found that fMRI complexity as assessed by MSE is positively correlated with MMSE and negatively correlated with CDR-SOB. Notably, these associations were most striking in bilateral parahippocampus in the EEAJ cohort, corroborating our speculations on reduced bias of comorbid pathology in the ADAD as compared to LOAD. Furthermore, our findings are consistent with two recent studies that used rs-fMRI data from the ADNI study, employing MSE and permutation entropy (PE) analyses and reporting progressive reduction of entropy from normal controls (NC) and early MCI (EMCI), to late MCI (LMCI) and AD groups, with significant associations between complexity measures of rs-fMRI and cognitive decline in MCI/AD subjects [35, 45]. Together, our findings and previous studies strongly support the notion that with increasing cognitive decline, there is a reduction of fMRI complexity. Mediation analysis provided further insight into this relationship demonstrating that the association between MSE and cognition is mediated by underlying tau pathology, especially in the EEAJ cohort. Compared to previous studies that only looked at the association of complexity to cognitive decline, we provide the first evidence that tau accumulation is the mediating factor between these metrics. Tau is a known imaging marker that is associated with cognitive function. Through the mediation model, we demonstrate that the association between novel imaging marker (fMRI-MSE) to the clinical outcome can be partially explained by the known imaging marker (tau). Furthermore, tau related neurotoxic processes alter neuronal and neurovascular function, which ultimately lead to neurodegeneration. However, it has been reported that tau deposition and alterations in neuronal activity and blood flow precede neurodegeneration and patients display cognitive impairment before detectable structural changes in MRI. In our study we accounted for atrophy by including GM indices as covariates and performed supplementary analyses using partial volume correction (PVC) for PET images thus minimizing contributions of neurodegeneration on the association between tau and MSE. While the voxel-wise analyses showed significant but sparse associations, the ROI based approach showed more widespread associations arguably due to improved SNR when averaging across larger anatomical areas. Based on our findings, we propose that fMRI complexity bears the potential as a new means to assess neurofibrillary tangle induced dysfunction. While neurofibrillary tangle pathology can be seen as the underlying physiological mechanism causing alterations in neuronal function and ultimately cognitive decline, decreases in fMRI complexity represent an associated functional phenotype in the AD disease progression.
There are several limitations to this study. The two cohorts had unbalanced groups with regard to disease status with most participants being cognitively normal and only few subjects with diagnosed AD. However, despite most participants showing no or only mild cognitive decline, especially in the ADNI cohort, we found significant associations between complexity, tau-PET and cognitive function, demonstrating that fMRI complexity is sensitive to potentially small changes in the course of AD progression. Future studies incorporating longitudinal data are warranted to estimate the rate of change from cognitive normal to AD. Additionally, we only investigated global cognitive measures (MMSE and CDR-SOB) since most fMRI complexity literature to date only reported these associations. For future research, evaluating associations between fMRI complexity and specific cognitive domains are warranted to further understand decrease in cognitive function, accumulation of tau protein and alterations in fMRI complexity within distributed brain networks. Furthermore, the fMRI protocols were different for the two cohorts. While ADNI used a standard EPI with a longer TR, the EEAJ study used a multi-band EPI with a sub-second TR, which leads to different frequency scales in MSE. For ADNI the highest scale represents low-frequency signal at 0.056 Hz whereas for EEAJ the same scale has a frequency of 0.23 Hz. Finally, because our focus was on investigating the use of fMRI complexity as an approximation of tau-PET, we did not assess the effect of Aβ on the interaction or mediation. There are also several sources of biases that need to be addressed. First, head motion is known to induce signal variability in the fMRI timeseries and thus head motion could present a potential confound in MSE calculation. We preformed supplemental analyses to assess potential head motion related bias in our findings including comparison of framewise-displacement (FD) across groups, correlation of FD with global and voxel-wise MSE, including global signal regression (GSR) as additional preprocessing step and using FD as a covariate in correlation analyses. While there was no statistical difference between FD across groups, we found significant negative association between FD and MSE (Supplementary Figures 1 and 2). Analyses using GSR or FD-covariate (Supplementary Figure 3) however replicated the original results which suggests that head motion had a minor effect on our findings. For detailed results, please see the Supplementary Material. Nevertheless, the influence of motion on complexity estimates should be systematically investigated in future studies. Second, grey mater atrophy could bias PET quantification. While our analysis included GM indices as covariate, specific partial volume correction (PVC) methods have been developed for PET data. To evaluate this potential bias we repeated the correlation analysis between MSE and PVC tau-PET data using the region-based voxel-wise method (RBV) [46]. The resulting correlation map (Supplementary Figure 4) revealed a similar spatial pattern of negative associations in inferior temporal lobe, parietal cortex and areas in the lateral prefrontal cortex. Third, in the EEAJ cohort two fMRI sessions with opposite phase encoding (PE) direction were averaged. Assessment of a potential interaction effects of PE direction and diagnostic group using an ANOVA revealed significant effects in small clusters, that however are very unlikely to present a substantial bias (Supplementary Figures 6 and 7).
To conclude, our findings show that there is a statistically significant total effect between MSE and cognitive decline that is largely mediated by tau-PET, especially in temporal areas. These results support the relevance of temporal lobe tauopathy on cognitive decline [10]. Moreover, complexity of rs-fMRI is associated with both regional tau protein accumulation and cognitive decline, and thus could provide a safe and cost-effective alternative marker for regional neuropathology and prediction of cognitive decline in AD.
ACKNOWLEDGMENTS
Data collection and sharing for this project was funded by the Alzheimer’s Disease Neuroimaging Initiative (ADNI) (National Institutes of Health Grant U01 AG024904) and DOD ADNI (Department of Defense award number W81XWH-12-2-0012). ADNI is funded by the National Institute on Aging, the National Institute of Biomedical Imaging and Bioengineering, and through generous contributions from the following: AbbVie, Alzheimer’s Association; Alzheimer’s Drug Discovery Foundation; Araclon Biotech; BioClinica, Inc.; Biogen; Bristol-Myers Squibb Company; CereSpir, Inc.; Cogstate; Eisai Inc.; Elan Pharmaceuticals, Inc.; Eli Lilly and Company; EuroImmun; F. Hoffmann-La Roche Ltd and its affiliated company Genentech, Inc.; Fujirebio; GE Healthcare; IXICO Ltd.; Janssen Alzheimer Immunotherapy Research & Development, LLC.; Johnson & Johnson Pharmaceutical Research & Development LLC.; Lumosity; Lundbeck; Merck & Co., Inc.; Meso Scale Diagnostics, LLC.; NeuroRx Research; Neurotrack Technologies; Novartis Pharmaceuticals Corporation; Pfizer Inc.; Piramal Imaging; Servier; Takeda Pharmaceutical Company; and Transition Therapeutics. The Canadian Institutes of Health Research is providing funds to support ADNI clinical sites in Canada. Private sector contributions are facilitated by the Foundation for the National Institutes of Health (http://www.fnih.org). The grantee organization is the Northern California Institute for Research and Education, and the study is coordinated by the Alzheimer’s Therapeutic Research Institute at the University of Southern California. ADNI data are disseminated by the Laboratory for Neuro Imaging at the University of Southern California.
FUNDING
This project was funded by NIH 1R01AG066711 (Jann/Wang). Data for EEAJ cohort was acquired under NIH funds U01AG051218 and R01AG062007 (Ringman).
CONFLICT OF INTEREST
The authors have no conflict of interest to report.
DATA AVAILABILITY
The data supporting the findings of this study are publicly available through the Alzheimer’s Disease Neuroimaging Initiative (ADNI) at https://adni.loni.usc.edu and through the Alzheimer’s Disease Research Center at USC at https://adrc.usc.edu.
SUPPLEMENTARY MATERIAL
[1] The supplementary material is available in the electronic version of this article: https://dx.doi.org/10.3233/JAD-220851.
REFERENCES
[1] | Sperling RA , Aisen PS , Beckett LA , Bennet DA , Craft S , Fagan AM , Iwatsubo T , Jack CR Jr, Kaye J , Montine TJ , Park DC , Reiman EM , Rowe CC , Siemers E , Stern Y , Yaffe K , Carrillo MC , Thies B , Morrison-Bogorad M , Wagster MV , Phelps CH ((2011) ) Toward defining the preclinical stages of Alzheimer’s disease: Recommendations from the National Institute on Aging-Alzheimer’s Association workgroups on diagnostic guidelines for Alzheimer’s disease. Alzheimers Dement 7: , 280–292. |
[2] | Villemagne VL , Dore V , Burnham SC , Masters CL , Rowe CC ((2018) ) Imaging tau and amyloid-beta proteinopathies in Alzheimer disease and other conditions. Nat Rev Neurol 14: , 225–236. |
[3] | Ringman JM , Rao PN , Lu PH , Cederbaum S ((2008) ) Mosaicism for trisomy 21 in a patient with young-onset dementia: A case report and brief literature review. Arch Neurol 65: , 412–415. |
[4] | Rovelet-Lecrux A , Hannequin D , Raux G , Le Meur N , Laquerriere A , Vital A , Dumanchin C , Feuillette S , Brice A , Vercalletto M , Dubas F , Frebourg T , Campion D ((2006) ) APP locus duplication causes autosomal dominant early-onset Alzheimer disease with cerebral amyloid angiopathy. Nat Genet 38: , 24–26. |
[5] | Bateman RJ , Aisen PS , De Strooper B , Fox NC , Lemere CA , Ringman JM , Salloway S , Sperling RA , Windisch M , Xiong C ((2011) ) Autosomal-dominant Alzheimer’s disease: A review and proposal for the prevention of Alzheimer’s disease. Alzheimers Res Ther 3: , 1. |
[6] | Benzinger TL , Blazey T , Jack CR Jr, Koeppe RA , Su Y , Xiong C , Raichle ME , Snyder AZ , Ances BM , Bateman RJ , Cairns NJ , Fagan AM , Goate A , Marcus DS , Aisen PS , Christensen JJ , Ercole L , Hornbeck RC , Farrar AM , Aldea P , Jasielec MS , Owen CJ , Xie X , Mayeux R , Brickman A , McDade E , Klunk W , Mathis CA , Ringman J , Thompson PM , Ghetti B , Saykin AJ , Sperling RA , Johnson KA , Salloway S , Correia S , Schofield PR , Masters CL , Rowe C , Villemagne VL , Martins R , Ourselin S , Rossor MN , Fox NC , Cash DM , Weiner MW , Holtzman DM , Buckles VD , Moulder K , Morris JC ((2013) ) Regional variability of imaging biomarkers in autosomal dominant Alzheimer’s disease. Proc Natl Acad Sci U S A 110: , E4502–4509. |
[7] | Bateman RJ , Xiong C , Benzinger TL , Fagan AM , Goate A , Fox NC , Marcus DS , Cairns NJ , Xie X , Blazey TM , Holtzman DM , Santacruz A , Buckles V , Oliver A , Moulder K , Aisen PS , Ghetti B , Klunk WE , McDade E , Martins RN , Masters CL , Mayeux R , Ringman JM , Rossor MN , Schofield PR , Sperling RA , Salloway S , Morris JC ((2012) ) Clinical and biomarker changes in dominantly inherited Alzheimer’s disease. N Engl J Med 367: , 795–804. |
[8] | Yan L , Liu CY , Wong KP , Huang SC , Mack WJ , Jann K , Coppola G , Ringman JM , Wang DJJ ((2018) ) Regional association of pCASL-MRI with FDG-PET and PiB-PET in people at risk for autosomal dominant Alzheimer’s disease. Neuroimage Clin 17: , 751–760. |
[9] | Quiroz YT , Sperling RA , Norton DJ , Baena A , Arboleda-Velasquez JF , Cosio D , Schultz A , Lapoint M , Guzman-Velez E , Miller JB , Kim LA , Chen K , Tariot PN , Lopera F , Reiman EM , Johnson KA ((2019) ) Association between amyloid and tau accumulation in young adults with autosomal dominant Alzheimer disease. JAMA Neurol 75: , 548–556. |
[10] | Gordon BA , Blazey TM , Christensen J , Dincer A , Flores S , Keefe S , Chen C , Su Y , McDade EM , Wang G , Li Y , Hassenstab J , Aschenbrenner A , Hornbeck R , Jack CR , Ances BM , Berman SB , Brosch JR , Galasko D , Gauthier S , Lah JJ , Masellis M , van Dyck CH , Mintun MA , Klein G , Ristic S , Cairns NJ , Marcus DS , Xiong C , Holtzman DM , Raichle ME , Morris JC , Bateman RJ , Benzinger TLS ((2019) ) Tau PET in autosomal dominant Alzheimer’s disease: Relationship with cognition, dementia and other biomarkers. Brain 142: , 1063–1076. |
[11] | Weigand AJ , Bangen KJ , Thomas KR , Delano-Wood L , Gilbert PE , Brickman AM , Bondi MW , Alzheimer’s Disease Neuroimaging Initiative ((2020) ) Is tau in the absence of amyloid on the Alzheimer’s continuum?: A study of discordant PET positivity. Brain Commun 2: , fcz046. |
[12] | Hanseeuw BJ , Betensky RA , Jacobs HIL , Schultz AP , Sepulcre J , Becker JA , Cosio DMO , Farrell M , Quiroz YT , Mormino EC , Buckley RF , Papp KV , Amariglio RA , Dewachter I , Ivanoiu A , Huijbers W , Hedden T , Marshall GA , Chhatwal JP , Rentz DM , Sperling RA , Johnson K ((2019) ) Association of amyloid and tau with cognition in preclinical Alzheimer disease: A longitudinal study. JAMA Neurol 76: , 915–924. |
[13] | Scott MR , Hampton OL , Buckley RF , Chhatwal JP , Hanseeuw BJ , Jacobs HI , Properzi MJ , Sanchez JS , Johnson KA , Sperling RA , Schultz AR ((2020) ) Inferior temporal tau is associated with accelerated prospective cortical thinning in clinically normal older adults. Neuroimage 220: , 116991. |
[14] | Franzmeier N , Neitzel J , Rubinski A , Smith R , Strandberg O , Ossenkoppele R , Hansson O , Ewers M , Alzheimer’s Disease Neuroimaging Initiative ((2020) ) Functional brain architecture is associated with the rate of tau accumulation in Alzheimer’s disease. Nat Commun 11: , 347. |
[15] | Greicius MD , Srivastava G , Reiss AL , Menon V ((2004) ) Default-mode network activity distinguishes Alzheimer’s disease from healthy aging: Evidence from functional MRI. Proc Natl Acad Sci U S A 101: , 4637–4642. |
[16] | Thomas JB , Brier MR , Bateman RJ , Snyder AZ , Benzinger TL , Xiong C , Raichle M , Holtzman DM , Sperling RA , Mayeux R , Ghetti B , Ringman JM , Salloway S , McDade E , Rossor MN , Ourselin S , Schofield PR , Masters CL , Martins RN , Weiner MW , Thompson PM , Fox NC , Koeppe RA , Jack CR , Mathis CA , Oliver A , Blazey TM , Moulder K , Buckles V , Hornbeck R , Chhatwal J , Schultz AP , Goate AM , Fagan AM , Cairns NJ , Marcus DS , Morris JC , Ances BM ((2014) ) Functional connectivity in autosomal dominant and late-onset Alzheimer disease. JAMA Neurol 71: , 1111–1122. |
[17] | Chang C , Glover GH ((2010) ) Time-frequency dynamics of resting-state brain connectivity measured with fMRI. Neuroimage 50: , 81–98. |
[18] | Garrett DD , Samanez-Larkin GR , MacDonald SW , Lindenberger U , McIntosh AR , Grady CL ((2013) ) Moment-to-moment brain signal variability: A next frontier in human brain mapping? Neurosci Biobehav Rev 37: , 610–624. |
[19] | McDonough IM , Nashiro K ((2014) ) Network complexity as a measure of information processing across resting-state networks: Evidence from the Human Connectome Project. Front Hum Neurosci 8: , 409. |
[20] | Goldberger AL ((1996) ) Non-linear dynamics for clinicians: Chaos theory, fractals, and complexity at the bedside. Lancet 347: , 1312–1314. |
[21] | Pincus SM ((1991) ) Approximate entropy as a measure of system complexity. Proc Natl Acad Sci U S A 88: , 2297–2301. |
[22] | Richman JS , Moorman JR ((2000) ) Physiological time-series analysis using approximate entropy and sample entropy. Am J Physiol Heart Circ Physiol 278: , H2039–2049. |
[23] | Costa M , Goldberger AL , Peng CK ((2002) ) Multiscale entropy analysis of complex physiologic time series. Phys Rev Lett 89: , 068102. |
[24] | Liu CY , Krishnan AP , Yan L , Smith RX , Kilroy E , Alger JR , Ringman JM , Wang DJJ ((2013) ) Complexity and synchronicity of resting state blood oxygenation level-dependent (BOLD) functional MRI in normal aging and cognitive decline. J Magn Reson Imaging 38: , 36–45. |
[25] | Smith RX , Yan L , Wang DJ ((2014) ) Multiple time scale complexity analysis of resting state FMRI. Brain Imaging Behav 8: , 284–291. |
[26] | Yang AC , Huang CC , Yeh HL , Liu ME , Hong CJ , Tu PC , Chen JF , Huang NE , Peng CK , Lin CP , Tsai SJ ((2013) ) Complexity of spontaneous BOLD activity in default mode network is correlated with cognitive function in normal male elderly: A multiscale entropy analysis. Neurobiol Aging 34: , 428–438. |
[27] | Jia Y , Gu H , Luo Q ((2017) ) Sample entropy reveals an age-related reduction in the complexity of dynamic brain. Sci Rep 7: , 7990. |
[28] | Yang AC , Huang CC , Liu ME , Liou YJ , Hong CJ , Lo MT , Huang NE , Peng CK , Lin CP , Tsai SJ ((2014) ) The APOE varepsilon4 allele affects complexity and functional connectivity of resting brain activity in healthy adults. Hum Brain Mapp 35: , 3238–3248. |
[29] | Grieder M , Wang DJ , Dierks T , Wahlund L-O , Jann K ((2018) ) Local signal complexity and dynamic functional connectivity associated with Alzheimer’s severity. Front Neurosci 12: , 770. |
[30] | Petersen RC , Aisen PS , Beckett LA , Donohue MC , Gamst AC , Harvey DJ , Jack CR , Jagust WJ , Shaw LM , Toga AW , Trojanowski JQ , Weiner MW ((2010) ) Alzheimer’s Disease Neuroimaging Initiative (ADNI): Clinical characterization. Neurology 74: , 201–209. |
[31] | Beckett LA , Donohue MC , Wang C , Aisen P , Harvey DJ , Saito N , Alzheimer’s Disease Neuroimaging Initiative ((2015) ) The Alzheimer’s Disease Neuroimaging Initiative phase 2: Increasing the length, breadth, and depth of our understanding. Alzheimers Dement 11: , 823–831. |
[32] | Besser L , Kukull W , Knopman DS , Chui H , Galasko D , Weintraub S , Jicha G , Carlsson C , Burns J , Quinn J , Sweet RA , Rascovsky K , Teylan M , Beekly D , Thomas G , Bollenbeck M , Monsell S , Mock C , Zhou XH , Thomas N , Robichaud E , Dean M , Hubbard J , Jacka M , Schwabe-Fry K , Wu J , Phelps C , Morris JC , Neuropsychology Work Group Directors and Clinical Core leaders of the National Institute on Aging-funded US Alzheimer’s Disease Centers ((2018) ) Version 3 of the National Alzheimer’s Coordinating Center’s Uniform Data Set. Alzheimer Dis Assoc Disord 32: , 351–358. |
[33] | Albert MS , DeKosky ST , Dickson D , Dubois B , Feldman HH , Fox NC , Gamst A , Holtzman DM , Jagust WJ , Petersen RC , Snyder PJ , Carrillo MC , Thies B , Phelps CH ((2011) ) The diagnosis of mild cognitive impairment due to Alzheimer’s disease: Recommendations from the National Institute on Aging-Alzheimer’s Association workgroups on diagnostic guidelines for Alzheimer’s disease. Alzheimers Dement 7: , 270–279. |
[34] | Yang AC , Tsai SJ , Lin CP , Peng CK ((2018) ) A strategy to reduce bias of entropy estimates in resting-state fMRI signals. Front Neurosci 12: , 398. |
[35] | Niu Y , Wang B , Zhou M , Shapour H , Xue J , Hussain W , Cao R , Cui X , Wu J , Xiang J ((2018) ) Dynamic complexity of spontaneous BOLD activity in Alzheimer’s disease and mild cognitive impairment using multiscale entropy analysis. Front Neurosci 12: , 677. |
[36] | Wang DJJ , Jann K , Fan C , Qiao Y , Zang YF , Lu H , Yang Y ((2018) ) Neurophysiological basis of multi-scale entropy of brain complexity and its relationship with functional connectivity. Front Neurosci 12: , 352. |
[37] | Baker SL , Maass A , Jagust WJ ((2017) ) Considerations and code for partial volume correcting [18F]-AV-1451 tau PET data. Data Brief 15: , 648–657. |
[38] | Cabeen RP , Laidlaw DH , Toga AW (2018) Quantitative imaging toolkit: Software for interactive 3D visualization, data exploration, and computational analysis of neuroimaging datasets. ISMRM-ESMRMB, Paris, pp. 12-14. |
[39] | Hayes AF , Rockwood NJ ((2017) ) Regression-based statistical mediation and moderation analysis in clinical research: Observations, recommendations, and implementation. Behav Res Ther 98: , 39–57. |
[40] | Jack CR , Knopman DS , Jagust WJ , Petersen RC , Weiner MW , Aisen PS , Shaw LM , Vemuri P , Wiste HJ , Weigand SD , Lesnick TG , Pankratz VS , Donohue MC , Trojanowski JQ ((2013) ) Update on hypothetical model of Alzheimer’s disease biomarkers. Lancet Neurol 12: , 207–216. |
[41] | Pontecorvo MJ , Devous MD Sr, Navitsky M , Lu M , Salloway S , Schaerf FW , Jennings D , Arora AK , McGeehan A , Lim NC , Xiong H , Joshi AD , Siderowf A , Mintun MA ((2017) ) Relationships between flortaucipir PET tau binding and amyloid burden, clinical diagnosis, age and cognition. Brain 140: , 748–763. |
[42] | Brosch JR , Farlow MR , Risacher SL , Apostolova LG ((2017) ) Tau imaging in Alzheimer’s disease diagnosis and clinical trials. Neurotherapeutics 14: , 62–68. |
[43] | Badhwar A , Tam A , Dansereau C , Orban P , Hoffstaedter F , Bellec P ((2017) ) Resting-state network dysfunction in Alzheimer’s disease: A systematic review and meta-analysis. Alzheimers Dement (Amst) 8: , 73–85. |
[44] | Albrecht D , Isenberg AL , Stradford J , Monreal T , Sagare A , Pachicano M , Sweeney M , Toga A , Zlokovic B , Chui H , Schneider L , Conti P , Jann K , Pa J ((2020) ) Associations between vascular function and tau PET are associated with global cognition and amyloid. J Neurosci 40: , 8573–8586. |
[45] | Wang B , Niu Y , Miao L , Cao R , Yan P , Guo H , Li D , Guo Y , Yan T , Wu J , Xiang Zhang H ((2017) ) Decreased complexity in Alzheimer’s disease: Resting-state fMRI evidence of brain entropy mapping. Front Aging Neurosci 9: , 378. |
[46] | Thomas BA , Erlandsson K , Modat M , Thurfjell L , Vandenberghe R , Ourselin S , Hutton BF ((2011) ) The importance of appropriate partial volume correction for PET quantification in Alzheimer’s disease. Eur J Nucl Med Mol Imaging 38: , 1104–1119. |


