
Regional White Matter Hyperintensities and Alzheimer’s Disease Biomarkers Among Older Adults with Normal Cognition and Mild Cognitive Impairment
Abstract
Background:
Alzheimer’s disease (AD) frequently co-occurs with other brain pathologies. Recent studies suggest there may be a mechanistic link between AD and small vessel cerebrovascular disease (CVD), as opposed to simply the overlap of two disorders.
Objective:
We investigated the cross-sectional relationship between white matter hyperintensity (WMH) volumes (markers of CVD) and cerebrospinal fluid (CSF) biomarkers of AD.
Methods:
WMH volumes were assessed globally and regionally (i.e., frontal, parietal, temporal, occipital, and limbic). CSF AD biomarkers (i.e., Aβ 40, Aβ 42, Aβ 42/Aβ 40 ratio, phosphorylated tau-181 [p-tau181], and total tau [t-tau]) were measured among 152 non-demented individuals (134 cognitively unimpaired and 18 with mild cognitive impairment (MCI)).
Results:
Linear regression models showed that among all subjects, higher temporal WHM volumes were associated with AD biomarkers (higher levels of p-tau181, t-tau, and Aβ 40), particularly among APOE ɛ 4 carriers (independent of Aβ 42 levels). Higher vascular risk scores were associated with greater parietal and frontal WMH volumes (independent of CSF AD biomarker levels). Among subjects with MCI only, parietal WMH volumes were associated with a lower level of Aβ 42/Aβ 40. In addition, there was an association between higher global WMH volumes and higher CSF t-tau levels among younger participants versus older ones (∼<65 versus 65+ years), independent of Aβ 42/Aβ 40 and p-tau181.
Conclusion:
These findings suggest that although WMH are primarily related to systemic vascular risk and neurodegeneration (i.e., t-tau), AD-specific pathways may contribute to the formation of WMH in a regionally-specific manner, with neurofibrillary tangles (i.e., p-tau) playing a role in temporal WMHs and amyloid (i.e., Aβ 42/Aβ 40) in parietal WMHs.
INTRODUCTION
Alzheimer’s disease (AD) pathology is present in a subset of older individuals who are cognitively normal [1]. Older adults without cognitive impairment also commonly have evidence of small vessel cerebrovascular disease (CVD) [2]. Whereas the pathological hallmarks of AD are plaques and tangles (primarily consisting of the accumulation of amyloid-β 42 (Aβ 42) and phosphorylated tau, respectively), the most common manifestation of CVD are white matter hyperintensities (WMH) on magnetic resonance imaging (MRI) scans [2]. WMH appear as bright, hyperintense regions in white matter on T2-weighted MR images. WMH are commonly thought to reflect demyelination and axonal loss resulting from chronic ischemia (i.e., reduced blood supply) due to the narrowing or occlusion of small vessels in the white matter. WMHs increase in prevalence with age, are associated with vascular risk factors [3], and contribute to cognitive decline and impairment [4, 5].
Although WMHs most commonly have a vascular origin [4], some evidence suggests that there may also be an AD-specific pathway contributing to WMH [6], particularly to WMH in the parietal lobe [7]. For example, pre-symptomatic carriers of autosomal dominant AD genetic mutations without appreciable vascular risk have elevated WMH volumes, in addition to abnormal AD biomarkers, several years before expected symptom onset, particularly in parietal and occipital regions [8, 9]. Similarly, prior studies have reported greater posterior WMHs (adjusting for global WMH burden) among participants with AD-dementia compared to older controls (e.g., [10, 11]). Additional evidence linking AD to ischemic damage comes from recent genetic and molecular work demonstrating that expression of many of the top AD risk genes is enriched in human brain vascular and perivascular cell types and that these cell types are selectively vulnerable to AD [12].
Studies examining the relationship between WMH and Aβ 42 among individuals with normal cognition have, however, been mixed. Supporting the view that there may be an AD-specific pathway contributing to WMH, several cross-sectional studies have reported associations between lower (i.e., more abnormal) levels of Aβ 42 in cerebrospinal fluid (CSF) and higher WMH volumes among older individuals with normal cognition [13–17]. By contrast, other studies have failed to find cross-sectional associations between CSF Aβ 42 levels and global WMH burden among older individuals with normal cognition [18–20] or subjective cognitive impairment [21]. Likewise, studies using amyloid PET imaging have found mixed results, with some studies observing cross-sectional associations between WMH load and amyloid among cognitively normal participants [22] and other studies not finding such relationships [23–26].
The first goal of the current study was to examine factors that might contribute to the difference in prior findings regarding the relationship between CSF Aβ 42 and WMH volumes among cognitively normal older adults, including participant characteristics that may have differed across studies (e.g., age, level of vascular risk and genetic risk for AD). In particular, we aimed to test the hypothesis that associations between Aβ 42 and WMH (both globally and regionally) may be stronger among carriers of the APOE ɛ 4 allele, the major genetic risk factor for late-onset AD [27], than among ɛ 4-non-carriers, as has been suggested by a few prior studies [17, but see 20, 28]. We also tested whether associations between WMH and CSF Aβ 42 are greater among participants with higher levels of vascular risk, based on reports that higher vascular risk may promote brain amyloid accumulation [29].
The second goal of the study was to examine whether CSF Aβ 42 levels are more strongly associated with WMH in specific subregions of the brain, rather than the brain as a whole, as there is little prior work on this topic among individuals with normal cognition [13]. A third goal of our study was to investigate the relationship between WMH and other AD-related CSF biomarkers (in addition to Aβ 42) that have received much less attention, particularly among participants with normal cognition. These include: 1) phosphorylated tau-181 (p-tau181), a marker of neurofibrillary tangle pathology, 2) total tau (t-tau), a general marker of neurodegeneration, 3) Aβ 40, the most abundant Aβ species, and 4) the ratio of Aβ 42/Aβ 40, which may be more specific to amyloid plaques than Aβ 42 alone [30, 31]. The two prior studies to examine the association between WMH and p-tau181 or t-tau among cognitively normal individuals found no significant relationships [17, 19], but associations with regional WMH volumes were not investigated. Likewise, only one study examined how CSF Aβ 40 relates to global WMH volumes among participants without cognitive impairment, finding a negative relationship between the two, but regional associations were not examined among the cognitively normal group [20]. Lastly, to our knowledge, Aβ 42/Aβ 40 has not been examined with respect to WMH among participants with normal cognition.
In order to examine these relationships between WMH burden and CSF AD biomarkers among older adults without cognitive impairment, we quantified both global and regional WMH volumes (frontal, parietal, occipital, temporal, and limbic) among 134 cognitively normal participants in relationship and CSF levels of Aβ 40, Aβ 42, Aβ 42/Aβ 40 ratio, p-tau181, and t-tau. Differences in patterns of associations by age, APOE ɛ4 genotype, and level of vascular risk were systematically evaluated. Participants with mild cognitive impairment (MCI) (N = 18) were also included to investigate potential differences by diagnostic status.
MATERIALS AND METHODS
Study design and participant selection
This study makes use of data from participants in the ongoing Biomarkers for Older Controls at Risk for Dementia (BIOCARD) study. Established by the National Institute of Health (NIH) in 1995, the BIOCARD study is a longitudinal investigation of factors predicting the onset of symptoms of AD among individuals with normal cognition at baseline. Participants were recruited by staff members of Geriatric Psychiatry branch of the intramural program of the National Institute of Mental Health. By design, approximately 75% of the cohort has a first-degree relative with AD-dementia. Participants were excluded at baseline if they were cognitively impaired, had severe medical conditions, or reported substance abuse, resulting in a total enrollment of 349 cognitively normal and primarily middle-aged participants. Annual data collection consisted of a comprehensive battery of neuropsychological tests, clinical and neurological assessments, and blood draws; CSF samples and MRI scans were collected biennially. The study was halted in 2005 for administrative reasons and re-initiated at Johns Hopkins University (JHU) in 2009 to continue the annual clinical and cognitive evaluations, as well as blood draws. The biennial neuroimaging and CSF specimen collection resumed in 2015 at JHU. The neuroimaging protocol was expanded to include positron emission tomography (PET) scans using Pittsburgh Compound B (PiB PET) in 2015 and Tau PET in 2020. For additional information regarding participant recruitment and the clinical and cognitive assessments at baseline (see [32]).
The current study used cross-sectional data collected between 2015 and 2019 and included 152 non-demented older participants (mean age = 69.7) who provided both CSF and WMH MRI data at the same visit (i.e., within 2 days of one another). For participants with more than one set of matching CSF and MRI data during this 4-year time period (N = 110), the first available set of data was used. Among participants in the analysis, 134 were cognitively normal and 18 had a diagnosis of MCI. The study was approved by the JHU Institutional Review Board, and all participants provided written informed consent. Enrollment of additional participants was begun in 2020 and data collection for the entire cohort is ongoing.
Clinical and cognitive assessments
Clinical and cognitive assessments have been conducted annually since the study began. These assessments include a physical and neurological examination, record of medication use, mood and behavioral assessments, family history of dementia, history of symptom onset, a neuropsychological battery covering all major cognitive domains, and the Clinical Dementia Rating (CDR) based on a semi-structured interview [33].
Annual consensus diagnoses are conducted for each participant by the staff of the BIOCARD Clinical Core and follow the recommendations incorporated in the National Institute of Aging/Alzheimer’s Association report for the diagnosis of MCI [34] and dementia due to AD [35]. First, a syndromic diagnosis is made (i.e., cognitively normal, MCI, impaired not MCI, or dementia) using three types of information: 1) decline in cognitive performance based on longitudinal cognitive test scores and comparison to published norms; 2) reports of changes in cognition by the individual and by collateral sources based on the CDR; and 3) clinical data regarding the medical, neurological, and psychiatric status of the individual. Second, if an individual is judged to be impaired, a decision about the likely etiology(ies) of the syndrome is made, using the psychiatric, neurological, and medical information. Individuals with contrasting information from the CDR interview and cognitive testing received a diagnosis of Impaired not MCI (e.g., the subject and/or collateral source reported concerns about cognition in daily life, but the cognitive testing did not show changes or vice versa). As in prior publications, participants with a diagnosis of Impaired not MCI (n = 25) were included in the group of cognitively normal subjects and all main analyses were re-run excluding these participants. Further details regarding the diagnostic process or neuropsychological battery can be found in Albert et al. [32]. The consensus diagnostic procedures are conducted without knowledge of the CSF and MRI data.
Summary vascular risk score
Vascular risk was assessed using a previously-validated summary score [29] based on the presence or absence of five vascular risk factors: hypertension, hypercholesterolemia, diabetes, obesity (defined as a body mass index greater than 30 kg/m2), and smoking within the 30 days prior to data collection. This information was derived from participants’ medical history reports or medical records collected at the same visit as the CSF and MRI data. The risk factors were coded dichotomously (0 if absent and 1 if present or remote) and then summed to calculate each individual’s summary score (max = 5); for other studies using this score, see [29, 36–38].
APOE genotyping
APOE genotypes were determined by restriction endonuclease digestion of polymerase chain reaction amplified genomic DNA (performed by Athena Diagnostics, Worcester, MA). APOE ɛ 4 carrier status was dichotomized, with ɛ 4 carriers coded as 1 if they had at least one ɛ 4 allele and non-carriers coded as 0. Participants with ɛ 2/ ɛ 4 alleles (n = 2) were included in the ɛ 4-carrier group, given that their risk for AD is similar to that of ɛ 4 carriers, rather than ɛ 2 carriers [39].
White matter hyperintensity volumes
MRI scans were acquired on a 3T Phillips Achieva scanner (Eindhoven, The Netherlands). The multi-modal protocol included magnetization-prepared rapid gradient echo (MPRAGE) scans used for anatomical reference and image registration (TR = 6.8 ms, TE = 3.1 ms, shot interval 3000 ms, flip angle = 8°, FOV = 240×256 mm2, 170 slices with 1×1×1.2 mm3 voxels, and scan duration = 5 min 59 s). White matter hyperintensity volumes were obtained from axial fluid-attenuated inversion recovery (FLAIR) MRI scans, which were acquired using a multi-slice fast spin-echo sequence (TR/TE/TI = 11000/100/2800 ms with 1×1×2 mm3 resolution over an FOV of 256×256×138 mm3; number of slices = 69; SENSE acceleration factor = 2.0; scan time = 3 min 18 sec).
Global WMH volumes were quantified using an automated method, the details of which are described in earlier publications [19, 40]. First, the skull was removed using an automatic atlas-based method [41]. The images were then nonlinearly registered by a cubic B-spline deformation to a minimal deformation template (MDT) synthetic brain image [42], adapted for ages 60 years and older. Second, a template-based iterative method was used for correcting field inhomogeneity bias [43]. The bias field was modeled using a spatially smooth thin-plate spline interpolation based on ratios of local image patch intensity means between the deformed template and subject images. Third, to segment gray, white, and CSF tissues, we used an Expectation-Maximization algorithm, which generates segmentations that are most consistent with the input intensities from the native-space T1 images along with a model of image smoothness using an iterative process [44]. Fourth, WMH measures were calculated based on a combination of FLAIR and 3D T1 images using a modified Bayesian probability structure utilizing histogram fitting [45]. Initially, all segmentation was performed in standard space, which produced probability likelihood values of WMH at each voxel in the white matter. We then thresholded these probabilities using a cutoff of 3.5 SDs above the mean to create a binary WMH mask. Further segmentation involved a modified Bayesian approach, in which image likelihood estimates are combined with spatial priors and with constraints on tissue class. For the calculation of tissue volumes, the segmented WMH masks were back-transformed to native space. All images were visually inspected for gross motion artifacts prior to running the pipeline and none were detected.
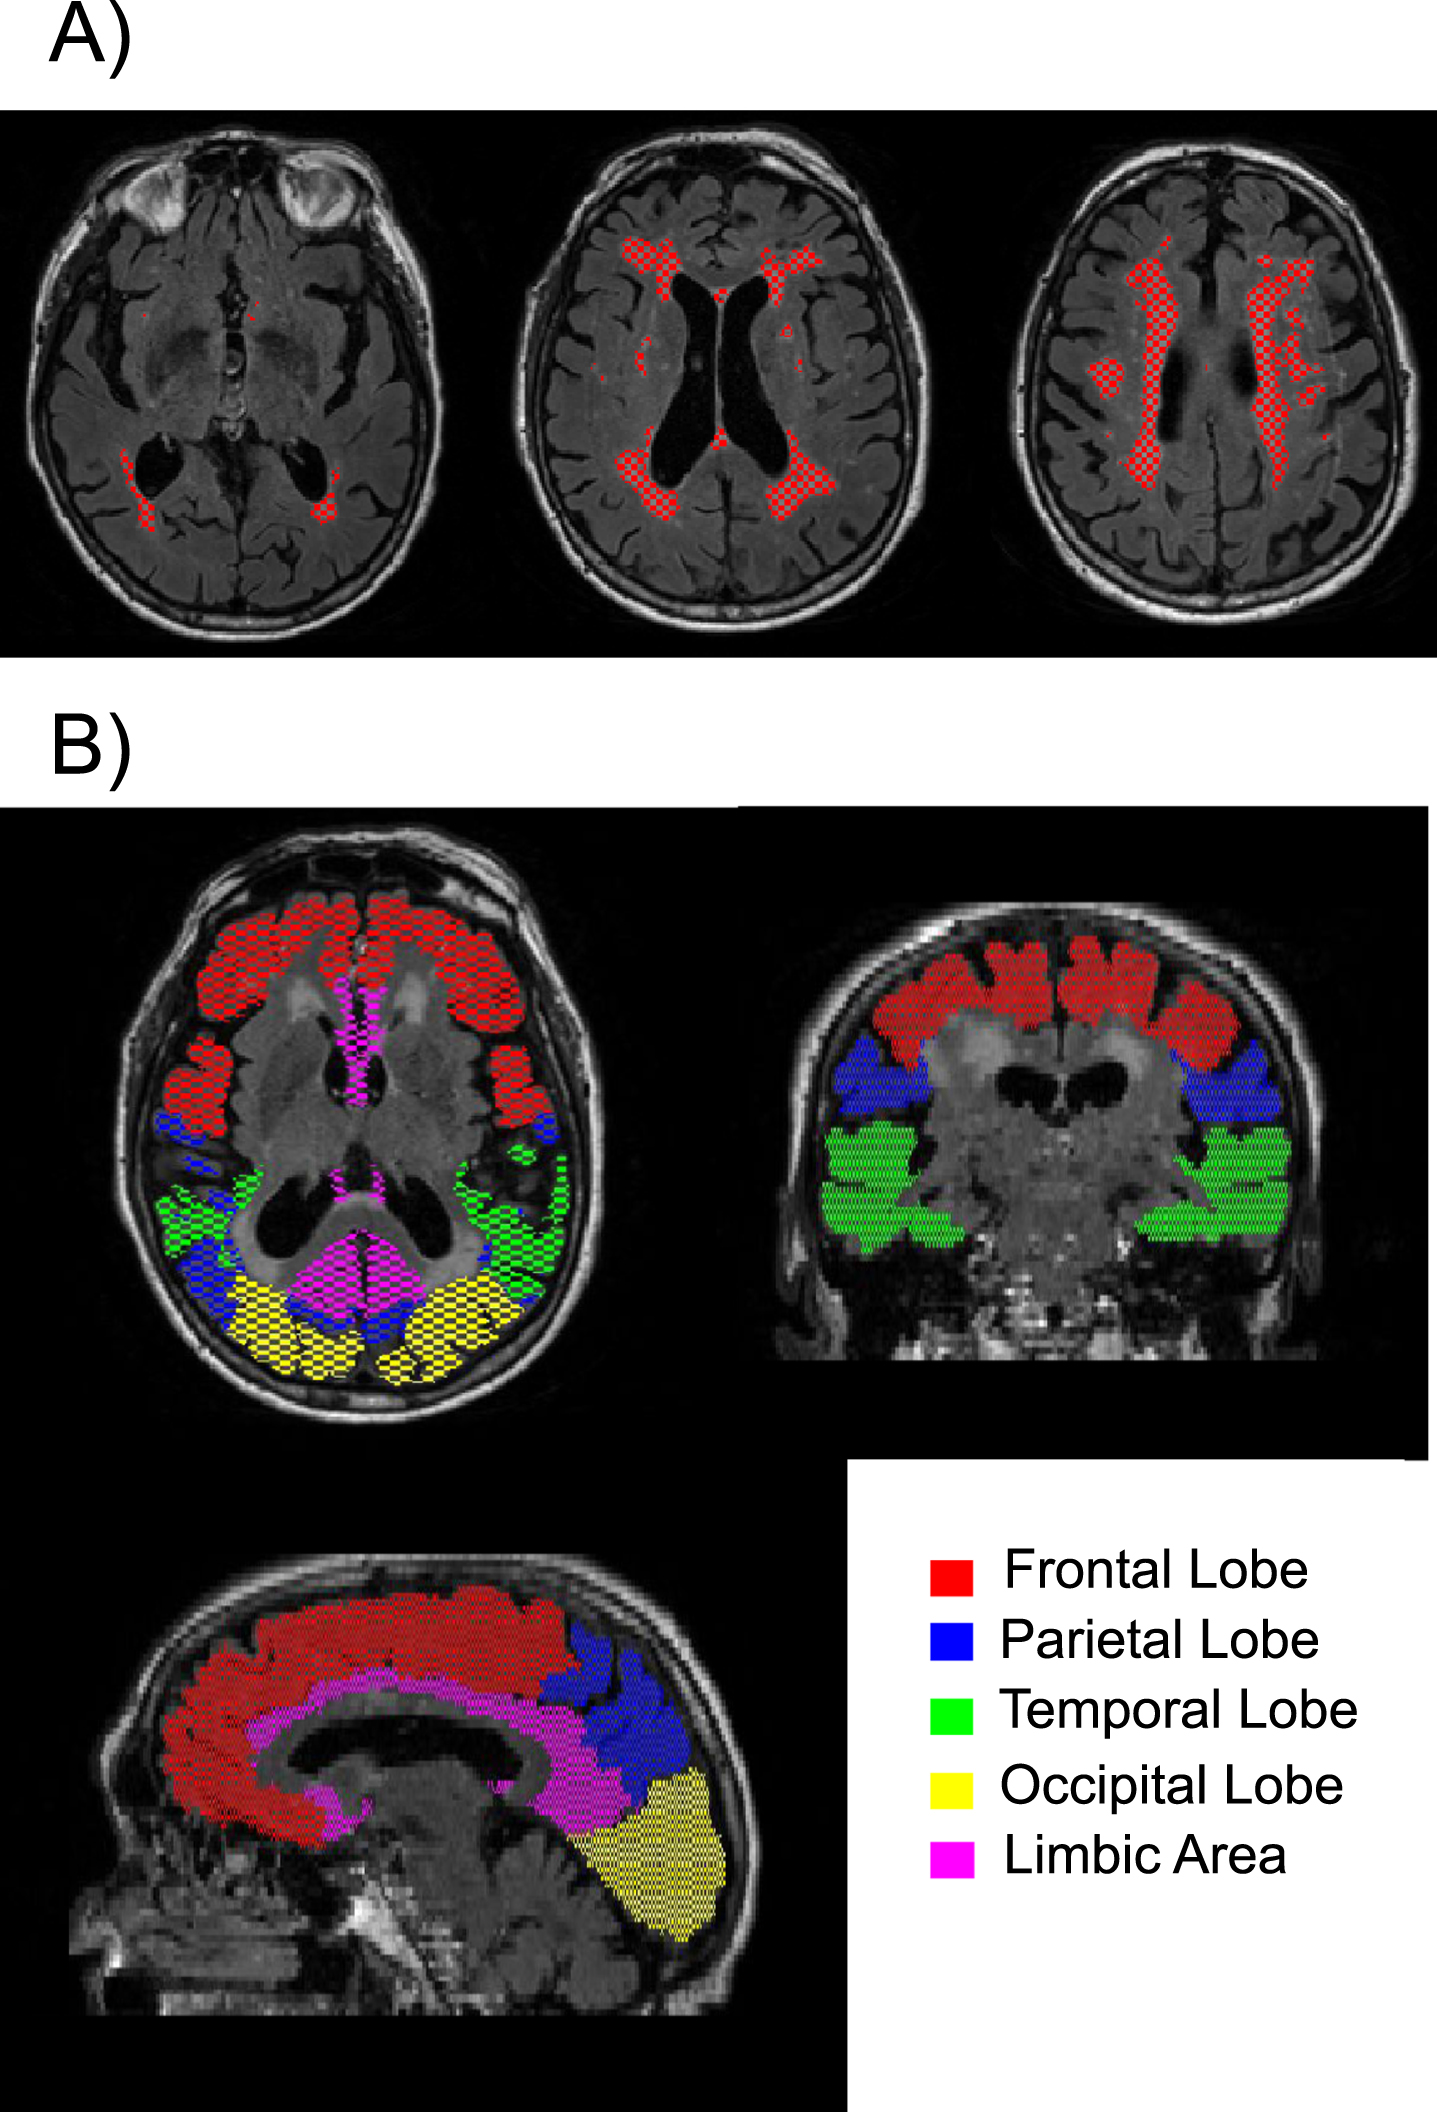
In addition, WMH volumes were quantified within the following regions: frontal, parietal, temporal, occipital, and limbic. To compute region-specific WMH volumes, the T1-MRPAGE image was first registered to FLAIR space and segmented with MRICloud to obtain individual masks for each of the 5 regions. MRICloud is a public web-based service for multi-contrast image segmentation and quantification (https://www.MRICloud.org, Johns Hopkins University, MD). Then the regional masks were combined with the global WMH mask to quantify the regional WMH volumes. See Fig. 1 for an example of the segmented WMHs and the 5 regions examined. Global and regional WMH volumes were log-transformed for all regression analyses to correct for skewness. WMH volumes were not adjusted for total intracranial volume (TICV) because TICV was not correlated with global WMH volume (r = 0.02 using the raw global WMH volumes and r = 0.08 using the log-transformed global WMH volumes).
Fig. 1
Example of A) segmented white matter hyperintensities are shown in red on three different axial slices; and B) the five regions of interest examined are shown in different colors.
CSF assessments
CSF (20 ml) was collected via lumbar puncture into 50 ml polypropylene tubes in the morning after overnight fasting. After mixing and centrifugation at 2000 rpm for 15 min, 500μ l aliquots of CSF were frozen at –80°C within 60 min of collection. The CSF samples were analyzed using the fully automated electrochemiluminescence enzyme immunosassays (Lumipulse G1200) for Aβ 40, Aβ 42, pTau181, and total Tau (tTau). Assays were run in duplicate, and all samples were run in a single batch. The coefficients of variation (CV) of an internal CSF standard run every day over the 10 days the assays were performed were: Aβ 1 - 42, 3.4%; Aβ 1 - 40, 2.7%; ptau181, 1.8% and t-tau, 8.0%. In addition, the ratio of Aβ 42/Aβ 40 was calculated because previous reports indicate that it accounts for inter-individual differences in total CSF Aβ levels and may mitigate against pre-analytic variability [30, 31]. The CSF measures were log-transformed for all analyses to correct for skewness.
Statistical analysis
We compared group differences in descriptive statistics using two-tailed t-tests for continuous variables and with chi-square tests for categorical variables. The first set of analyses examined the relationship between the 5 CSF biomarkers (i.e., Aβ 40, Aβ 42, pTau181, and tTau, and Aβ 42/Aβ 40) and global WMH volume, using linear regression models, uncorrected for multiple comparisons. All analyses used separate linear regression models for each CSF measure, with WMH volumes as dependent variables and the CSF biomarkers as independent variables, including age, sex, years of education, and diagnostic status (coded dichotomously: cognitively normal = 0 versus MCI = 1) as covariates. Follow-up linear regression models then explored whether the relationship between the 5 CSF measures and global WMH volume differed by age, diagnostic status, APOE ɛ 4 status, or vascular risk score by including these variables and their interactions (i.e., cross-products) with the CSF measure as predictors (covarying sex and education). All interaction terms were included in the same model (i.e., age x CSF; diagnostic status x CSF, APOE ɛ 4×CSF, and vascular risk score x CSF) to reduce the number of models run.
The second set of analyses investigated the associations between each CSF biomarker and the 5 regional WMH volumes, also in separate linear regressions, using a Bonferroni correction for multiple comparison (i.e., 5 tests, with p values <0.01 considered significant). For the regional WMH analyses, significant p-values using a Bonferroni correction for 25 tests (i.e., 5 CSF×5 WMH variables) are also reported. As for the analyses examining global WMH volume, follow-up exploratory linear regression analyses were conducted to determine whether age, diagnostic status, APOE ɛ 4 genetic status, or the summary vascular risk score modified the associations between the CSF and WMH variables by including interaction terms of CSF x age/ diagnostic status/ APOE ɛ 4/ vascular risk score in the same model. When significant interaction terms were present, stratified follow-up models were run to examine associations separately in relevant subgroups.
Two sets of sensitivity analyses were conducted. First, we tested whether the main results remained the same in the subgroup of participants with normal cognition and when participants with a diagnosis of Impaired-not-MCI were excluded. Second, given the potential importance of hypertension in WMH development, we re-ran the analyses using the vascular risk summary score, instead using 1) an indicator for hypertension (present versus absent) and 2) a modified vascular risk score based only on obesity, smoking, hypercholesterolemia, and diabetes (min = 0, max = 4). In these sensitivity analyses, both the hypertension indicator and the modified vascular summary score were simultaneously included as predictors. All analyses were run in R (version 1.4.1106) and SAS 9.4.
RESULTS
Table 1 details the characteristics of participants stratified by diagnosis. Participants diagnosed with MCI had higher vascular risk scores, on average (t(151) = 2.02, p = 0.046), as well as greater limbic WMH volumes (t(151) = 2.59, p = 0.01) than the cognitively normal group. The difference in limbic WMH burden between the MCI and cognitively normal group remained significant when adjusting for age, sex, and education and when using the log-transformed WMH instead of the raw values (t = 2.55, p = 0.012), while the group difference in vascular risk scores was no longer significant after covariate adjustment (t = 1.75, p = 0.082). The correlations among the 5 regional log-transformed WMH volumes ranged from r = 0.27 to 0.66, all p < 0.001, indicating moderate correlations.
Table 1
Participant characteristics for total sample and stratified by diagnosis
| Variable | Total Sample | Cognitively Normal | MCI |
| (N = 152) | (N = 134) | (N = 18) | |
| Age, y, mean (SD) | 69.3 (8.5) | 69.1 (8.6) | 69.1 (7.9) |
| Sex, number of females (%) | 97 (63.8%) | 87 (64.9%) | 10 (55.6%) |
| Education, y, mean (SD) | 17.1 (2.4) | 17.3 (2.3) | 16.4 (2.7)* |
| MMSE score, mean (SD) | 28.9 (1.5) | 29.2 (1.0) | 27.4 (1.6)*** |
| APOE ɛ 4 carriers, number (%) | 52 (34.2%) | 46 (34.3%) | 6 (33.3) |
| Vascular Risk Score, mean (SD) | 1.4 (1.0) | 1.3 (1.0) | 1.8 (1.1)* |
| Vascular Risk Score ≥1, number (%) | 115 (75.7%) | 101 (75.4%) | 13 (72.2%) |
| Vascular Risk Score ≥2, number (%) | 63 (41.5%) | 53 (39.6%) | 9 (50%.0) |
| Global WMH volume (mm3), mean (SD) | 4281 (6931) | 4302 (7290) | 4214 (3292) |
| Frontal WMH volume (mm3), mean (SD) | 118 (426) | 127 (453) | 45 (97) |
| Parietal WMH volume (mm3), mean (SD) | 70(19) | 74 (200) | 35 (109) |
| Temporal WMH volume (mm3), mean (SD) | 21 (68) | 23 (72) | 10 (12) |
| Occipital WMH volume (mm3), mean (SD) | 267 (462) | 260 (478) | 320 (321) |
| Limbic WMH volume (mm3), mean (SD) | 177 (258) | 151 (207) | 369 (462)* |
| CSF Aβ 40 (pg/ml), mean (SD) | 11968 (4142) | 12099 (4180) | 10995 (3819) |
| CSF Aβ 42 (pg/ml), mean (SD) | 961 (464) | 966 (463) | 924 (486) |
| CSF Aβ 42/Aβ 40, mean (SD) | 0.08 (0.02) | 0.08 (0.02) | 0.08 (0.03) |
| CSF p-tau181 (pg/ml), mean (SD) | 42 (21) | 42 (21) | 38 (19) |
| CSF t-tau (pg/ml), mean (SD) | 301 (149) | 305 (152) | 273 (124) |
*p < 0.05; **p < 0.005; ***p < 0.0005 indicate significant differences between the groups of cognitively normal and MCI participants.
Associations between CSF measures and global WMH volume
Results from the linear regression analyses examining global WMH volumes among all non-demented participants indicated no significant associations with any of the CSF measures (all p > 0.12 uncorrected). However, there was a strong association between older age and higher global WMH volumes (p < 0.0001 in all models), while sex (all p > 0.49) and years of education (all p > 0.67) were unrelated to global WMH volume in all models. Results were the same in the subgroup of individuals with normal cognition, demonstrating no significant associations between the CSF measures and global WMH volume.
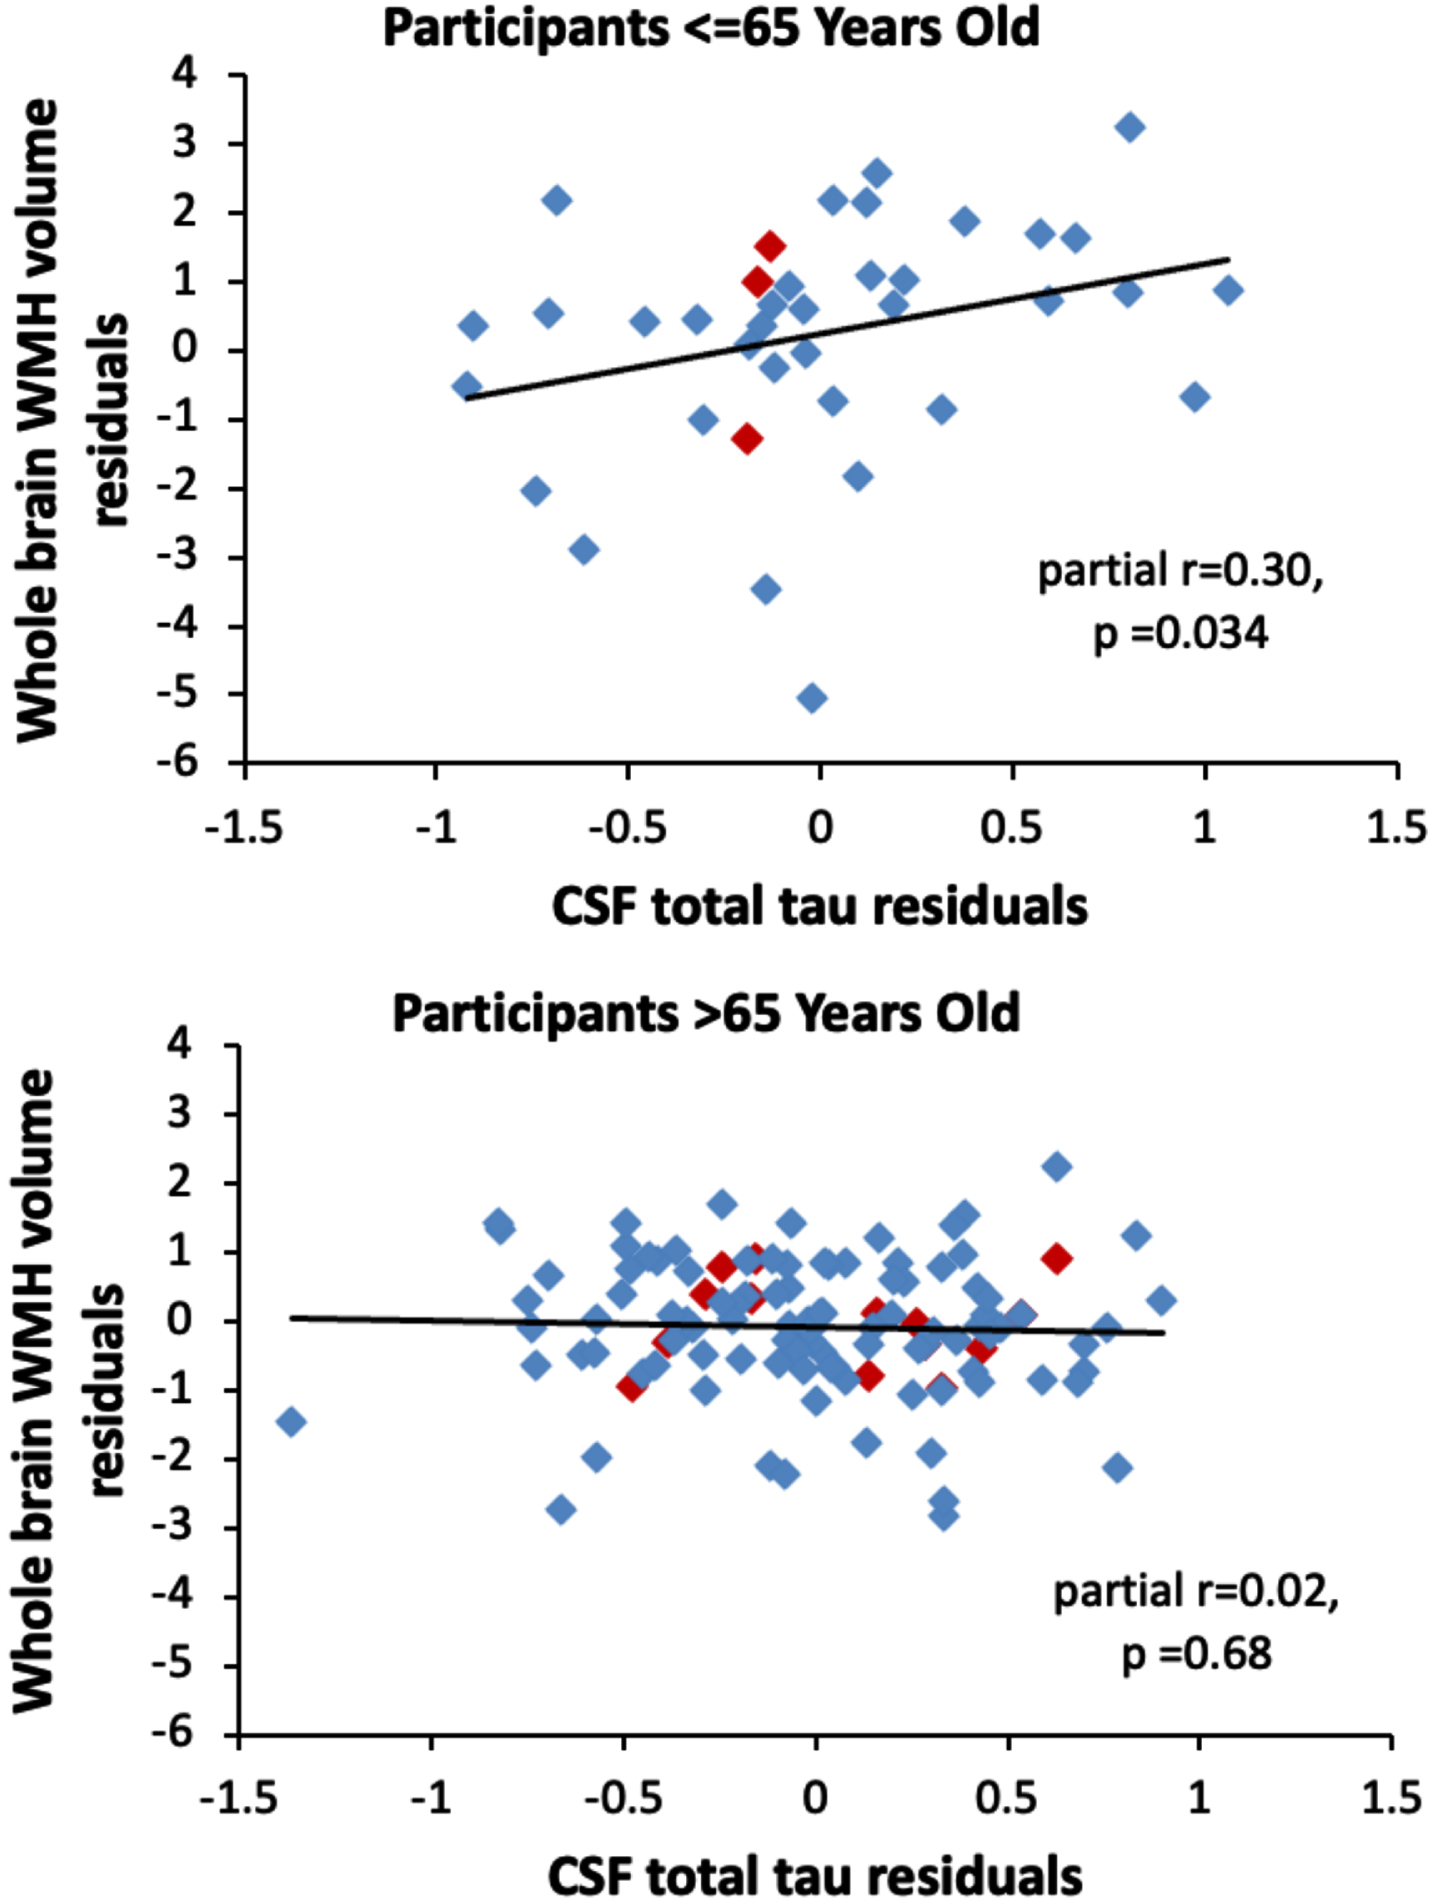
Analyses examining potential modifiers of the relationship between the CSF measures and global WMH volumes found no interactions between the CSF measures and diagnostic status (all p > 0.54), APOE ɛ 4 status (all p > 0.48), and the vascular risk score (all p > 0.53) in relationship to global WMH volume. Additionally, the vascular risk score and APOE ɛ 4 genetic status were not associated with global WMH volume (both p > 0.26). However, there was a significant interaction between age and t-tau (estimate = –0.06, SE = 0.03, p = 0.024) in relationship to global WMH volume, such that as participants’ age decreased, the association between t-tau and global WMH volume increased. For example, among participants aged 65 years and under, higher CSF t-tau was associated with greater global WMH volumes (n = 38, estimate = 1.24, SE = 0.56, p = 0.034), whereas this association was not significant among participants over age 65 (n = 115, estimate = –0.09, SE = 0.22, p = 0.68). This is illustrated in Fig. 2. The interaction between age and t-tau was significant in the cognitively normal subgroup (estimate = –0.08, SE = 0.03, p = 0.006). It remained significant when additionally adjusting for Aβ 42/Aβ 40 and p-tau181 in the same model (total sample estimate = –0.06, SE = 0.02, p = 0.014; cognitively normal sample estimate = –0.08, SE = 0.03, p = 0.006). The pattern of results was the same when using total subcortical WMH volumes, as when using total WMH volumes (data not shown).
Fig. 2
Scatterplots showing the partial correlations between global white matter hyperintensity volumes (y-axis) and CSF total tau levels (x-axis) for participants aged 65 years or younger (top panel) and participants older than 65 years (bottom panel). Correlations are adjusted for age, sex, years of education, diagnostic status, APOE ɛ 4 genetic status, and summary vascular risk scores. Participants with a diagnosis of MCI are shown red (◊); participants with normal cognition are shown in blue (◊).
Although interactions between the CSF measures and APOE ɛ 4 genetic status were not significant in relationship to global WMH volumes, stratified analyses were run by APOE ɛ 4 genetic status, given prior reports of differences [17, 28]. These showed that lower levels of Aβ 42/Aβ 40 were associated with higher global WMH volumes among APOE ɛ 4 carriers (total sample p = 0.036; cognitively normal sample p = 0.051) but not non-carriers (p > 0.4).
Associations between CSF measures and regional WMH volumes
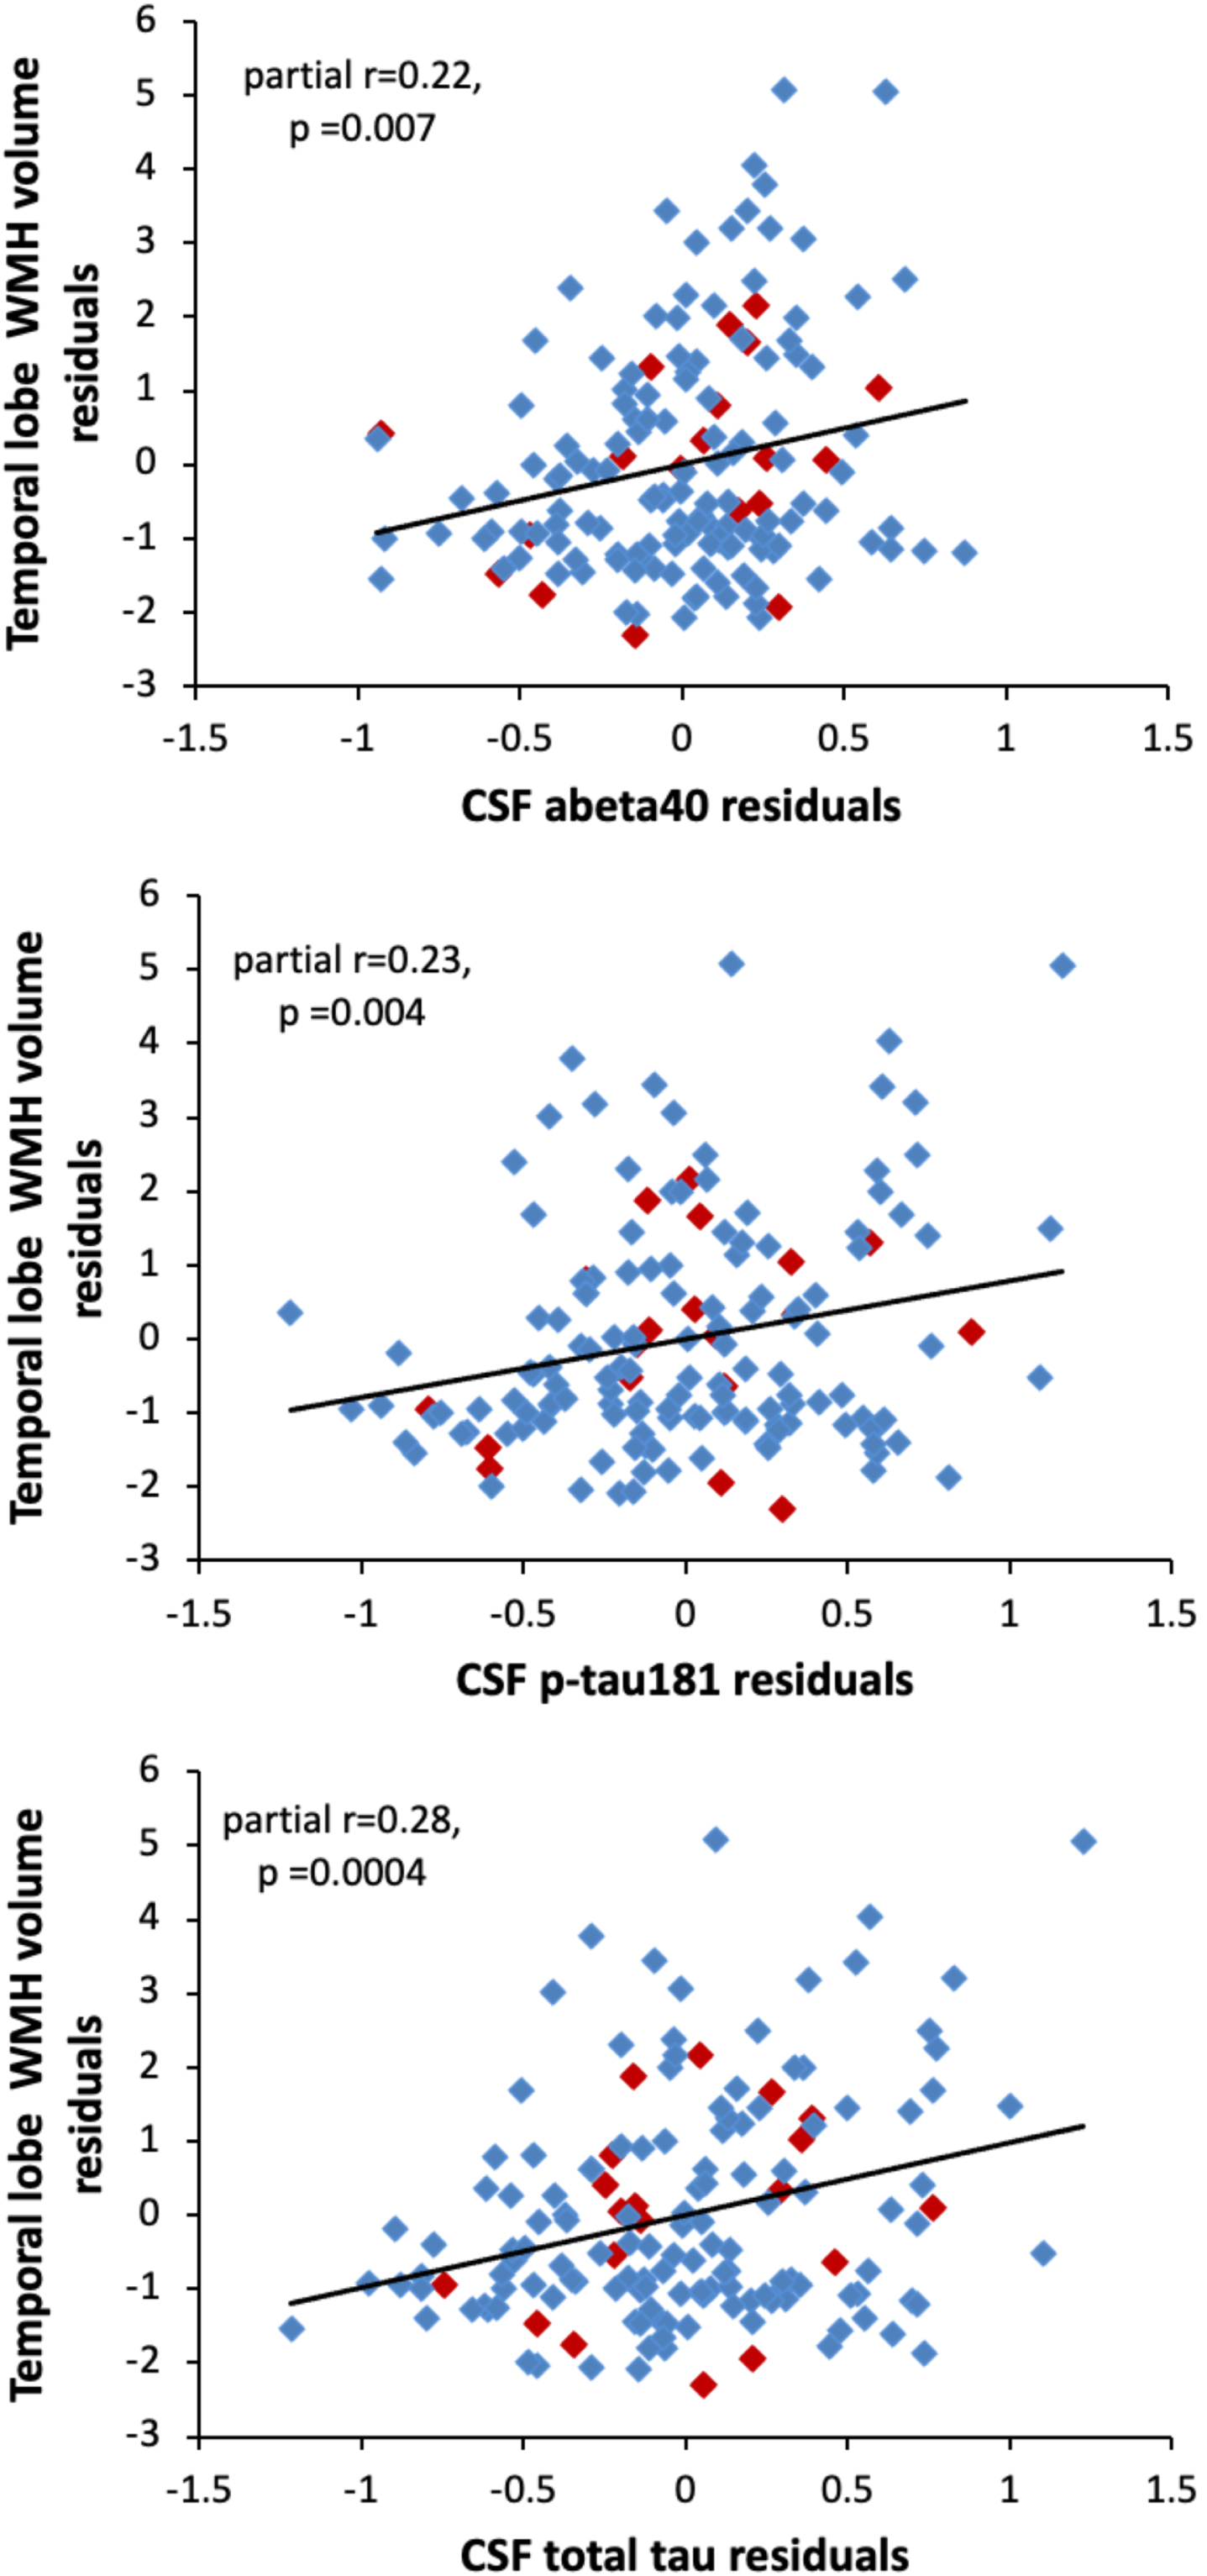
The regional analyses revealed that among all participants, higher temporal WMH volumes were associated with significantly higher levels of Aβ 40, p-tau181, and t-tau (all p < 0.007, see Table 2 for full model results). Scatterplots illustrating these relationships are shown in Fig. 3. There were no significant associations between the CSF measures and WMH volumes in any of the other regions (see Table 2). Results were the same in the cognitively normal subgroup (see Table 2 for model results). Results also remained the same when additionally adjusting for APOE ɛ 4 genotype and the summary vascular risk score, with higher temporal WMH volumes being associated with higher p-tau181 (estimate = 0.92, SE = 0.28, p = 0.0014) and t-tau (estimate = 1.03, SE = 0.27, p = 0.0002), and Aβ 40 (estimate = 0.95, SE = 0.36, p = 0.0086). In this fully-adjusted model, the associations of temporal WMH with p-tau181 and t-tau were significant at the more stringent correction for multiple comparisons (p < 0.002), while the association with Aβ 40 was not significant at this threshold. The association between temporal WMH volume and t-tau or p-tau also remained significant when additionally adjusting for CSF Aβ 42 or Aβ 42/Aβ 40 (all p≤0.004). All results were unchanged in the cognitively normal subgroup (adjusting for APOE ɛ 4, vascular risk score, and Aβ 42/Aβ 40, tau estimate = 1.06, SE = 0.30, p = 0.0005; p-tau estimate = 0.93, SE = 0.32, p = 0.0038).
Table 2
Linear regression results for associations between regional WMH burden and CSF AD biomarker levels
| All Non-Demented Participants (N = 152) | ||||||||||
| WMH Region | Aβ 40 | Aβ 42 | Aβ 42/40 | pTau181 | tTau | |||||
| estimate (SE) | p | estimate (SE) | p | estimate (SE) | p | estimate (SE) | p | estimate (SE) | p | |
| Frontal | –0.05 (0.52) | n.s. | –0.01 (0.37) | n.s. | –0.14 (4.78) | n.s | 0.30 (0.40) | n.s. | 0.21 (0.40) | n.s. |
| Parietal | 0.33 (0.50) | n.s. | –0.01 (0.36) | n.s. | –2.28 (4.61) | n.s. | 0.49 (0.38) | n.s. | 0.36 (0.38) | n.s. |
| Temporal | 0.98 (0.36) | 0.0066 | 0.44 (0.26) | n.s. | 1.28 (3.36) | n.s. | 0.79 (0.27) | 0.004 | 0.97 (0.27) | 0.0004* |
| Occipital | 0.58 (0.40) | n.s. | –0.20 (0.29) | n.s. | –7.33 (3.64) | n.s. | 0.63 (0.30) | n.s. | 0.47 (0.31) | n.s. |
| Limbic | –0.58 (0.36) | n.s. | –0.54 (0.26) | n.s. | –5.78 (3.33) | n.s. | –0.13 (0.28) | n.s. | –0.20 (0.28) | n.s. |
| Cognitively Normal Participants (N = 134) | ||||||||||
| Frontal | –0.07 (0.57) | n.s. | 0.16 (0.41) | n.s. | 3.17 (5.19) | n.s | 0.03 (0.43) | n.s. | 0.05 (0.42) | n.s. |
| Parietal | 0.41 (0.54) | n.s. | 0.29 (0.39) | n.s. | 2.23 (4.94) | n.s. | 0.21 (0.40) | n.s. | 0.14 (0.40) | n.s. |
| Temporal | 0.96 (0.39) | 0.0066 | 0.41 (0.29) | n.s. | 0.94 (3.68) | n.s. | 0.78 (0.29) | 0.0080 | 0.98 (0.29) | 0.0008* |
| Occipital | 0.84 (0.42) | n.s. | 0.01 (0.31) | n.s. | –5.29 (3.88) | n.s. | 0.68 (0.31) | n.s. | 0.57 (0.31) | n.s. |
| Limbic | –0.49 (0.39) | n.s. | –0.47 (0.28) | n.s. | –4.87 (3.59) | n.s. | –0.15 (0.30) | n.s. | –0.01 (0.29) | n.s. |
| MCI (N = 18) | ||||||||||
| Parietal | –0.40 (1.32) | n.s. | –1.83 (0.79) | 0.037 | –36.15 (8.87) | 0.0013 | 3.00 (1.08) | 0.015 | 2.69 (1.34) | n.s. |
The table shows p-values significant after Bonferroni adjustment for 5 comparisons (i.e., p < 0.01). p-values >0.01 are reported as not significant (n.s.). *indicates p-values significant after Bonferroni adjustment for 25 comparisons (i.e., p < 0.002).
Fig. 3
Scatterplots showing the partial correlations between white matter hyperintensity volumes in the temporal lobe (y-axis) and CSF levels of Aβ 40 (top panel), p-tau181 (middle panel), and t-tau (bottom panel). Correlations are adjusted for age, sex, years of education, and diagnostic status. Participants with a diagnosis of MCI are shown red (◊); participants with normal cognition are shown in blue (◊).
A few recent studies have suggested that among participants with normal cognition, it may be helpful to correct measures of t-tau and p-tau for individual differences in CSF production and drainage rates by using the ratios of t-tau/Aβ 40 or p-tau/Aβ 40 [46, 47]. In a post-hoc analysis including only individuals with normal cognition, adjusting for age, sex, education, APOE ɛ 4 genotype, vascular risk score, and Aβ 42, higher ratios of t-tau/Aβ 40 (estimate = 1.68, SE = 0.50, p = 0.0011) and p-tau181/Aβ 40 (estimate = 1.35, SE = 0.54, p = 0.014) were associated with higher temporal WMH volumes.
CSF measures and regional WMH volumes: The role of diagnostic status
For parietal WMH volumes only, there was an interaction between diagnostic status and Aβ 42/Aβ 40 (estimate = –33.87, SE = 12.66, p = 0.009). Follow-up models, stratified by diagnostic status, revealed that among participants with MCI, lower Aβ 42/Aβ 40 (estimate = –31.48, SE = 12.01, p = 0.02) was associated with greater parietal WMH volumes, but this association was not significant among those with normal cognition (p > 0.4; see Table 2). The interaction between diagnostic status and Aβ 42 only approached significance (p = 0.08).
CSF measures and regional WMH volumes: The role of vascular risk
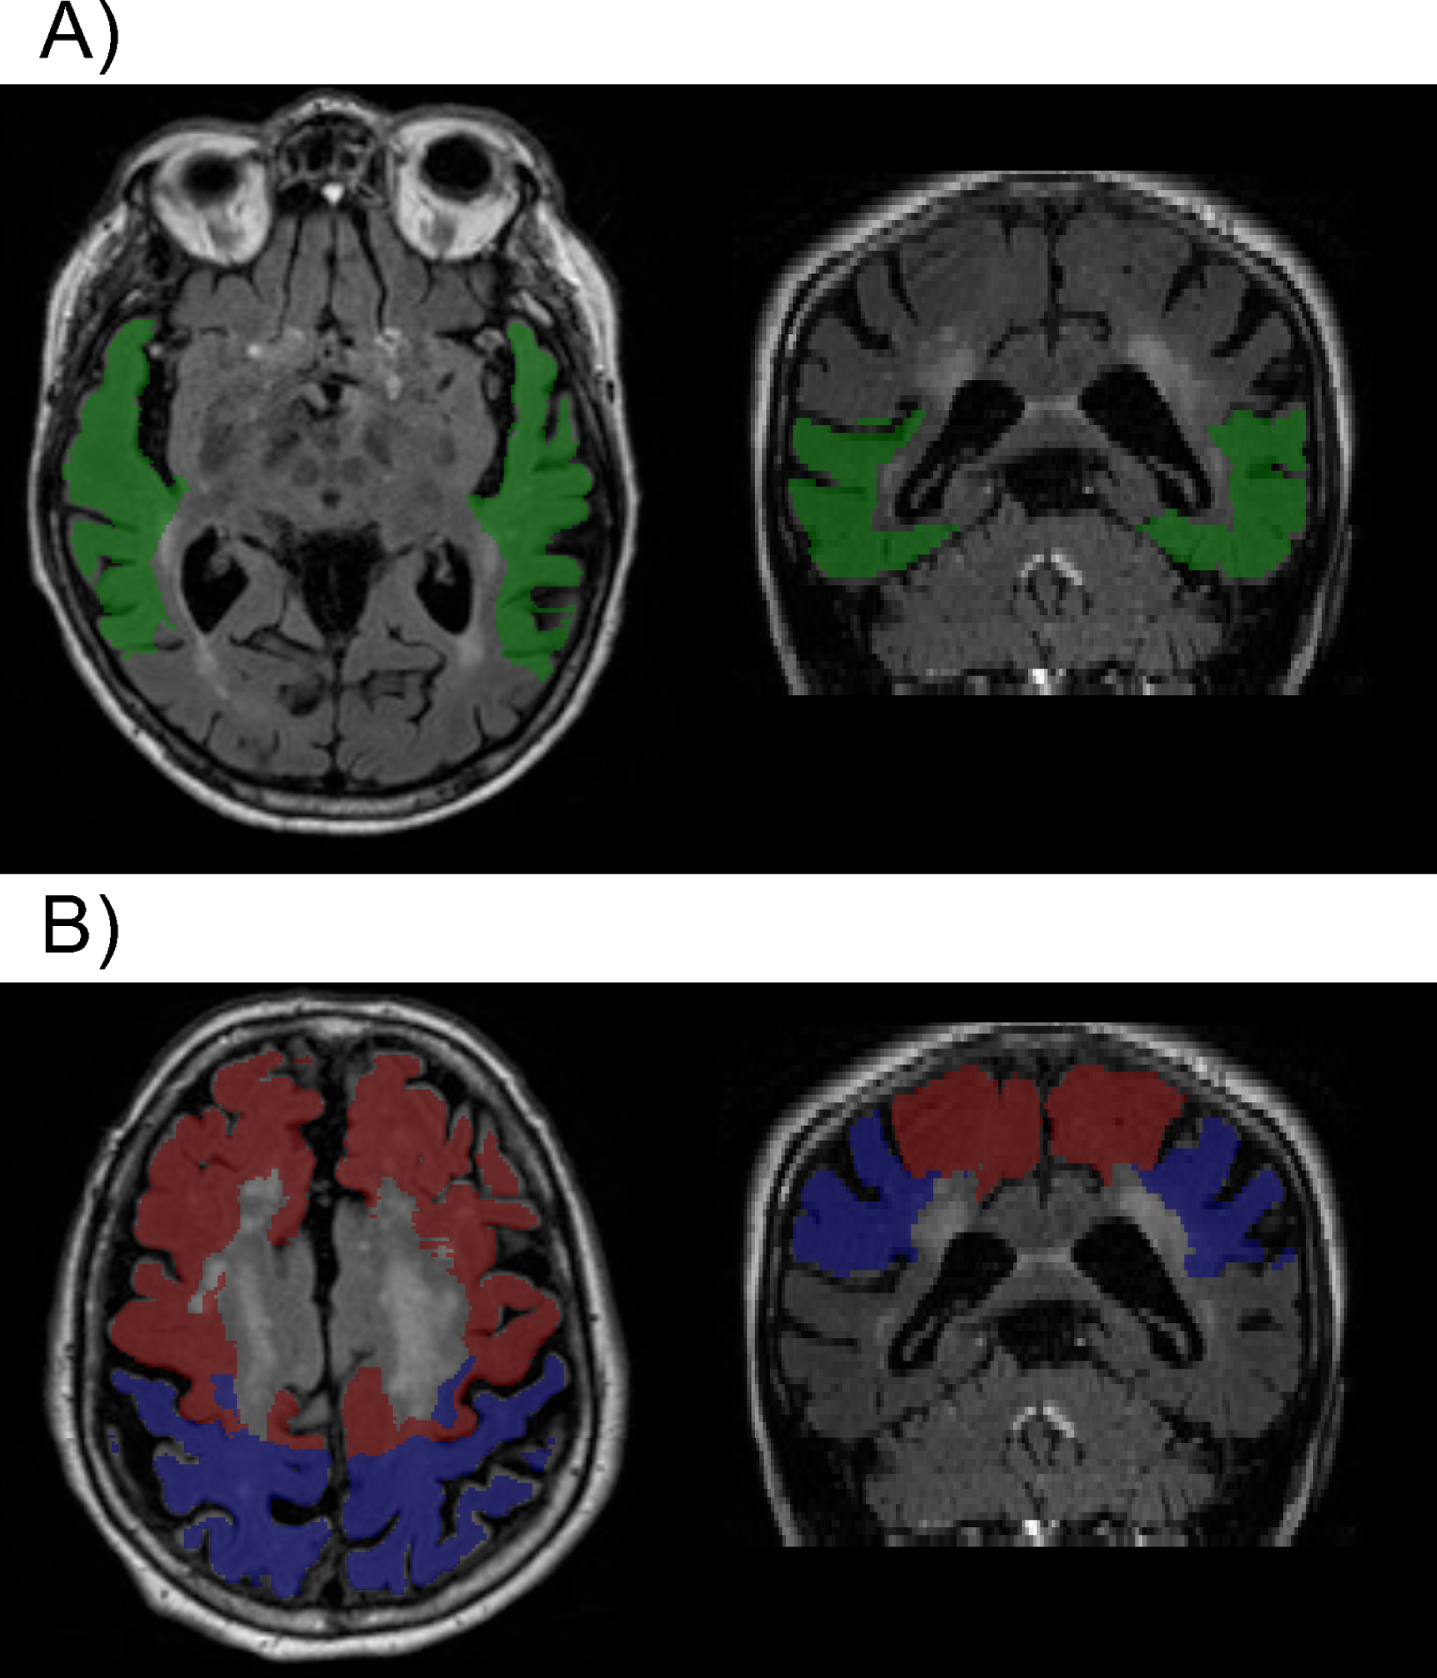
There were no significant interactions between the summary vascular risk score and any of the CSF measures with respect to the regional WMH variables in the full sample (all p > 0.07) or in the cognitively normal subgroup (all p > 0.07), suggesting that the relationship between the CSF measures and regional WMH volumes do not differ by level of vascular risk. However, higher vascular risk summary scores were associated with higher parietal WMH volumes (estimate = 0.37, SE = 0.17, p = 0.028) and marginally higher frontal WMH volumes (estimate = 0.33, SE = 0.17, p = 0.056), while associations with other WMH regions were not significant (all p > 0.2) (covarying age, sex, education, and diagnostic status). These results were the same in the cognitively normal subgroup (parietal estimate = 0.39, SE = 0.18, p = 0.03; frontal estimate = 0.37, SE = 0.19, p = 0.054). Higher vascular risk summary scores remained associated with higher parietal WMH volumes when also adjusting for APOE ɛ 4 genetic status, as well as for CSF Aβ 42/Aβ 40, p-tau181, and t-tau (total sample estimate = 0.36, SE = 0.17, p = 0.03; cognitively normal sample estimate = 0.37, SE = 0.18, p = 0.04). This suggests that the relationship between the vascular risk score and parietal WMH volumes is independent of AD-biomarker levels (Fig. 4 portrays visually the brain regions where there was an association between WMH and vascular risk compared to the regional association of WMH and biomarkers of tau and p-tau, mentioned above).
Fig. 4
Example of segmentation showing A) the temporal region (green) where higher WMH volumes were associated with higher levels of p-tau and t-tau; and B) parietal (blue) and frontal (red) regions, where greater WMH volumes where associated with higher summary vascular risk scores (see text for details).
CSF measures and regional WMH volumes: The role of APOE ɛ 4 genetic status
There were no significant interactions between APOE ɛ 4 status or age and any of the CSF measures with respect to the regional WMH measures in the full non-demented sample (all p > 0.07) or in the cognitively normal subgroup (all p > 0.12). However, because some previous studies suggest that associations between global WMH volume and AD biomarker levels may be greater among APOE ɛ 4 carriers than non-carriers [17, 28], post-hoc analyses stratified by ɛ 4 carrier status were also run for temporal WMH volumes, for which there were robust associations with CSF p-tau, t-tau, and Aβ 40 (see above). This revealed that the relationship between temporal WMH volumes and CSF Aβ 40, p-tau181, and t-tau measures were significant among APOE ɛ 4 allele carriers (n = 52, all p < 0.013, see Table 3 for full model results), but not in non-carriers (n = 100, all p > 0.09).
Table 3
Linear regression results for associations between temporal WMH and CSF AD biomarker levels for APOE ɛ 4 carriers and non-carriers
| APOE ɛ 4 carriers | ||||||
| colrule Diagnostic Group | Aβ 40 | pTau181 | tTau | |||
| Estimate (SE) | p | Estimate (SE) | p | Estimate (SE) | p | |
| Non-demented (n = 52) | 1.47 (0.56) | 0.0125 | 1.33 (0.37) | 0.0009* | 1.42 (0.37) | 0.0003* |
| Cognitively normal (n = 46) | 1.42 (0.60) | 0.0234 | 1.33 (0.41) | 0.0022 | 1.42 (0.39) | 0.0008* |
| APOE ɛ 4 non-carriers | ||||||
| Non-demented (n = 100) | 0.66 (0.47) | n.s. | 0.52 (0.41) | n.s. | 0.69 (0.39) | n.s. |
| Cognitively normal (n = 88) | 0.61 (0.53) | n.s. | 0.45 (0.44) | n.s. | 0.69 (0.42) | n.s. |
Additional analyses showed that the vascular risk score did not differ between APOE ɛ 4 carriers and non-carriers (adjusting for age, sex, and education, and diagnostic status, estimate = –0.15, SE = 0.18, p = 0.41). This suggests that differential associations between WMH and CSF biomarkers by APOE ɛ 4 genetic status does not reflect differences in levels of vascular risk between ɛ 4 carriers and non-carriers. APOE ɛ 4 carriers and non-carriers did not differ in terms of global or regional WMH volumes (all p > 0.23). The differences between APOE ɛ 4 carriers and non-carriers were the same in the cognitively normal subgroup (data not shown). However, as would be expected, APOE ɛ 4 carriers had lower levels of CSF Aβ 42 (estimate = –0.47, SE = 0.07, p < 0.0001) and Aβ 42/Aβ 40 (estimate = –0.04, SE = 0.005, p < 0.0001), and higher levels of p-tau181 (estimate = 0.29, SE = 0.08, p = 0.0002) and t-tau (estimate = 0.20, SE = 0.08, p = 0.012).
CSF measures and regional WMH volumes: The role of participant age
Associations between the CSF measures and regional WMH volumes did not differ by participant age (all p > 0.07).
Sensitivity analyses
The pattern of results was the same when participants with a diagnosis of Impaired not MCI were excluded from the analysis (data not shown). In addition, consistent with the results using the vascular risk summary score, neither the indicator for hypertension, nor the modified vascular risk score, altered the associations between the CSF measures and the global or regional WMH volumes in the total sample or in the cognitively normal subgroup (for all interactions, p > 0.09). However, higher parietal (estimate = 0.78, SE = 0.38, p = 0.037) and frontal (estimate = 0.76, SE = 0.39, p = 0.055) WMH volumes were associated with hypertension, but not with the modified vascular risk score (both p > 0.4), underscoring the importance of hypertension for the development of region-specific WMH.
DISCUSSION
This study examined the cross-sectional association between global and regional WMH volumes and CSF biomarkers of amyloid, total tau, and phosphorylated tau among participants with normal cognition and MCI. There are several notable findings. First, there was an association between higher global WMH volumes and higher CSF t-tau levels among participants with lower baseline ages (∼<65 years), but not those with higher baseline ages. This association was independent of AD CSF biomarker levels (i.e., Aβ 42/40 and p-tau181), suggesting the link between global WMH burden and levels of neuronal injury may be unrelated to amyloid and neurofibrillary tangle pathology. A second major finding was that higher temporal WMH volumes were related to higher CSF levels of Aβ 40, p-tau181, and t-tau in the total sample and in the cognitively normal subgroup, and that this relationship was particularly evident among APOE ɛ 4 carriers. These associations were also independent of CSF Aβ 42 levels, suggesting they may also be unrelated to plaque deposition. Lastly, higher parietal WMH volumes were associated with lower (i.e., more abnormal) levels of Aβ 42/40 among participants with MCI only, and with higher vascular risk scores (particularly hypertension) among all participants. Taken together, these results support the view that among participants with normal cognition, WMH are primarily associated with vascular and tau-related neurodegenerative factors, while among participants with MCI, WMH may also be related to amyloidosis. Our results also suggest that among individuals with normal cognition (and relatively low levels of AD pathology) vascular risk promotes WMH accumulation independently of AD pathology levels, whereas among cognitively impaired individuals (with higher levels of AD pathology), both vascular risk and amyloidosis contribute to greater WMH burden.
Temporal WMH volumes and CSF AD biomarkers
The finding that higher temporal WMH volumes are related to higher p-tau181 and t-tau levels in CSF, independent of Aβ 42 or Aβ 42/Aβ 40 levels, may indicate that WMH are associated with neurodegeneration resulting from both neurofibrillary-tangle related pathology as well as neuronal damage from other causes [48]. This interpretation would be consistent with the finding that neurofibrillary tangles first accumulate in the medial temporal lobe before spreading to other cortical regions [49]. Among older individuals with normal cognition, neurofibrillary tangle load and related axonal damage would therefore be expected to be highest in temporal regions. This would explain why the association of p-tau and t-tau was significant for temporal WMH volumes, but not other brain regions, nor with global WMH burden.
Importantly, these associations appear to be stronger among APOE ɛ 4 carriers than non-carriers, suggestive of an AD-specific pathway. It has also been suggested that APOE ɛ 4 may have effects on tau via Aβ -independent mechanisms [50]. Another possibility is that small cerebral vessels in the temporal lobe are particularly sensitive to the effects of systemic vascular risk factors or to other APOE ɛ 4 related mechanisms. In this view, chronic hypoperfusion and resulting ischemia of temporal white matter regions would result in the demyelination of axons, axonal degeneration, and ultimately tangle formation [51]. This would be consistent with recent neuropathological findings that higher tangle pathology is associated with both greater small-vessel disease burden in posterior brain regions (measured by arteriosclerosis [52]) and with higher global WMH among older adults across the clinical spectrum of AD [52, 53]. Further supporting this view, a mouse model of ischemia demonstrated that hypoperfusion can promote higher phosphorylated and total tau accumulation [53].
Our findings are in line with, and extend, prior studies among participants with MCI and across the spectrum of AD showing that higher global WMH load is associated with higher levels of CSF t-tau [21], greater increases in t-tau over time [54], higher p-tau181/Aβ 40 ratios [46], as well as with higher plasma tau levels [53]. Our results are also consistent with the finding that higher Braak scores, which are indicative of higher tangle-related pathology, are associated with higher levels of WMH [53, 55] among individuals across the AD-spectrum. Of note, several prior studies did not find associations between global WMH volumes and CSF levels of p-tau or t-tau among cognitively normal [17, 19] and non-demented samples [8, 13, 16, 56], but temporal lobe WMH were not investigated in these studies. The current results emphasize the importance of investigating regional WMH, as relationships with AD biomarkers may vary across the brain and over the course of the disease.
Notably, in the current study, higher Aβ 40 levels were also associated with higher temporal WMH volumes among all subjects and the cognitively normal subgroup, though this association was less robust than for p-tau and t-tau. Although altered levels of Aβ 40 are not typically observed in AD, including the preclinical phase (e.g., [57]), a recent multicenter study reported slightly, but significantly higher levels of Aβ 40 among patients with AD-dementia compared to controls [58]. Within this context, it has been suggested that increased Aβ 40 may be a marker of elevated overall amyloid production [46, 58], overall CSF production [59], or of reduced clearance of peptides from the brain into the CSF [47]. For these reasons, Aβ 40 is often used to correct for pre-analytic variables that affect Aβ 42 [60]. The current results therefore suggest that higher total amyloid production or higher overall CSF production or reduced CSF drainage among cognitively normal older adults is associated with greater temporal WMH volumes.
Global WMH volumes and CSF total tau
We also observed an age-dependent relationship between higher global WMH and higher t-tau levels that was significant for participants with lower baseline ages (∼<65 years) but not those with higher baseline ages. This association remained when adjusting for Aβ 42/Aβ 40 and p-tau181, suggesting a relationship between WMH volumes and neuronal injury that may be due to small vessel CVD. The reason that this relationship was not evident among participants with older ages could be that older age is associated with increased neurodegeneration due to many other processes besides CVD, thus t-tau levels become less reflective of (and less correlated with) neurodegeneration due to small vessel WMH. However, since this analysis was exploratory and the age range of participants was limited, this finding needs to be re-examined in future studies.
WMH volumes and CSF Aβ 42 and Aβ 42/40
In the current study, CSF levels of Aβ 42 and Aβ 42/40 were not associated with global or regional WMH volumes among individuals with normal cognition, consistent with several prior reports [18–21]. By comparison, other studies found that lower Aβ 42 was related to higher global WMH burden among cognitively normal older adults [13–17], and to higher regional WMH in the parietal lobe and to a smaller degree in the frontal lobe [13]. The results from the current study suggest that the reason for the discrepancy across studies is likely unrelated to participant age, vascular risk levels, presence of hypertension, or APOE ɛ 4 genetic status, as we found no interactions between these variables and Aβ 42 or Aβ 42/Aβ 40 with respect to global or regional WMH values. However, analyses stratified by APOE ɛ 4 genetic status provided some evidence that Aβ 42/Aβ 40 may be more strongly associated with WMH volumes among ɛ 4 carriers than non-carriers, in line with two prior reports [17, 28]. Given that older APOE ɛ 4 carriers have more abnormal levels of Aβ 42 and Aβ 42/Aβ 40 than ɛ 4 non-carriers, this may suggest that levels of Aβ 42 have to be sufficiently abnormal (indicating higher amyloid plaque burden) before associations with WMH become evident.
It is important to note that almost two-thirds of participants in the current study were female, whereas participants in all five prior studies reporting significant association between CSF Aβ 42 and WMH among cognitively normal participants had a higher proportion of male than female participants (range = 51% to 71% male). It is possible therefore, that the relationship between Aβ 42 and WMH is stronger among males than females. Consistent with this possibility, a post-hoc analysis of the current data among participants with normal cognition revealed a significant association between higher global WMH volumes and lower Aβ 42/Aβ 40 among males (n = 46, estimate = –10.1, SE = 4.6, p = 0.035), but not females (n = 87, estimate = –3.4, SE = 4.8, p = 0.49; for Aβ 42, p = 0.089 for males and p = 0.79 for females, covarying age, education, APOE ɛ 4, and vascular risk score). Future studies are needed to further investigate this potential sex difference in the relationship between amyloid and WMH, as well as possible underlying mechanisms.
Our results further suggest that associations between WMH and Aβ 42 or Aβ 42/Aβ 40 may be more evident among individuals with cognitive impairment than those with normal cognition, as lower Aβ 42/Aβ 40 was related to higher parietal WMH volumes only among participants with MCI. Few prior studies have directly examined whether associations of amyloid and WMH differ as a function of diagnostic status and results have been mixed. Consistent with our results, two studies found that lower Aβ 42 was associated with higher global WMH burden among participants with AD dementia, but not those with normal cognition or subjective cognitive impairment [20, 21]. By contrast, other studies observed significant relationships between lower Aβ 42 and WMH burden among both cognitively normal and MCI participants [13], among neither cognitively unimpaired or impaired participants [18], or a stronger association among those without cognitive impairment than those among impaired individuals [16, 17]. The reasons for these discrepancies across studies are unclear and but may be related to the fact that most prior studies examined global WMH levels, whereas amyloid levels may be primarily associated with WMH in the parietal lobe [7].
The mechanistic links between amyloid and WMH are not yet well understood, but may result from the accumulation of Aβ in small cerebral arteries, leading to the narrowing or occlusion of the vessels and vessel wall damage, which can cause ischemia and result in WMH, similar to the process seen in cerebral amyloid angiopathy [61]. Additionally, animal models suggest that vessel-wall damage may hinder amyloid clearance via perivascular spaces [62, 63], leading to a self-reinforcing cycle of Aβ deposition, vessel damage and consequent ischemia. It is also possible that brain amyloid accumulation directly damages white matter, leading to WMH [56]. Interestingly, APOE ɛ 4 carriers are not only at increased risk for AD but are also predisposed to cerebral amyloid angiopathy. This could explain the potentially stronger association between WMH and Aβ 42/Aβ 40 among ɛ 4 carriers than non-carriers [17, 28].
WMH volumes and vascular risk
The finding that higher vascular risk scores, and in particular hypertension, were associated with higher parietal WMH volumes (and to a lesser extent with frontal WMH volumes) among all non-demented participants and the cognitively normal subgroup, independent of AD-biomarker levels, supports the view that WMH are a marker of cerebrovascular disease. For example, many prior studies have shown that individuals with greater vascular risk, including hypertension and diabetes, have higher WMH volumes [64–66].
However, our results showed that neither levels of vascular risk, nor the presence of hypertension, modified the relationships between regional or global WMH volumes and CSF Aβ, tau, and p-tau among individuals with normal cognition. This is consistent with prior studies among non-demented participants [56, 67]). It is possible that results may differ when using quantitative measures of hypertension or other vascular risk factors, with dichotomous vascular risk indicators lacking sensitivity (e.g., [14]). Additionally, vascular risk burden was relatively low in the current sample and results may differ in populations with higher vascular risk levels.
Regional WMH: Distinct etiologies and risk factor associations
The present results support the view that WMH in different regions of the brain may have at least partially distinct etiologies and risk factor associations. For example, consistent with the present findings, cortical amyloid appears to have the greatest impact on parietal and posterior WMH [7–11]. The parietal cortex is one of the earliest regions to accumulate amyloid in AD [68] and it has been suggested that cortical Aβ may trigger axonal damage in underlying white matter due to Wallerian degeneration, giving rise to WMH [69]. Also in line with our findings, frontal WMH may be particularly associated with vascular risk factors, including hypertension, and reflective of CVD [7, 70–72], possibly because the frontal lobes are more vulnerable to arteriosclerosis due characteristics of the regional blood supply [70]. Lastly, as discussed above, the association of temporal WMH with p-tau and t-tau may reflect the fact that AD-related tau tangle pathology begins in the temporal lobe, when participants are still cognitively normal.
Discrepancies across prior studies in the relationship between WMH volumes and CSF AD biomarkers
The current study, together with results from prior studies, suggests that inconsistencies regarding associations between CSF AD biomarkers and WMH volumes may be attributed to several factors. First, associations appear to vary by participant age and disease stage, with t-tau showing stronger associations with global WMH burden among younger than older participants, and Aβ 42 and Aβ 42/40 being more strongly related to WMH in later disease stages. Second, the strength of these associations may differ across brain regions, with p-tau and t-tau primarily related to WMH in temporal lobe regions and Aβ 42/Aβ 40 more strongly related to parietal areas. Third, associations between CSF AD biomarkers and WMH appear to be somewhat stronger among APOE ɛ 4 carriers than non-carriers, though large samples may be needed to detect this difference in the preclinical stage of disease. Fourth, there may be subtle sex differences in the relationship between amyloid and WMH burden that require further investigation. Large studies that are able to stratify analyses by these multiple factors are needed to examine these hypotheses.
Study limitations
These findings should be interpreted within the context of the study’s limitations. The majority of participants were White, well-educated, and had a first-degree relative with AD-dementia. Results, therefore, may not generalize to the general population. The cross-sectional nature of the analyses precludes any inferences regarding causality. Additionally, the MCI group was small, limiting our power to detect differences by diagnostic status. Also, the study did not differentiate between periventricular and deep subcortical WMH, which have been suggested to reflect distinct etiologies and risk factor associations [7, 73]. Longitudinal studies in more diverse cohorts will be valuable in further characterizing how changes in AD biomarkers over time relate to white matter changes and WMH across the AD spectrum.
Future directions
More broadly, future studies investigating mechanistic links between AD and WMH should consider including markers of cerebral blood flow (CBF) and blood-brain barrier dysfunction. Many studies have documented decreases in CBF among individuals with AD-dementia and MCI relative to those with normal cognition, with some evidence for greater reductions among APOE ɛ 4 carriers than noncarriers (reviewed in [74]). Moreover, some recent work suggests that AD-related reductions in CBF may be linked to the degeneration of pericytes [75], the cells that line the walls of blood vessels and are important for regulating cerebral blood flow and maintaining the blood-brain barrier. For example, CSF markers of pericyte degeneration have been associated with breakdown of the blood-brain barrier [76] and with cognitive decline, particularly among APOE ɛ 4 carriers [77]. Other evidence from mouse models and human postmortem tissue suggests that Aβ 40 and Aβ 42 cause the constriction of pericytes, reducing their diameter and thus reducing blood flow [78]. Although the timing of events related to pericyte degeneration, blood-brain barrier breakdown, and amyloid accumulation remains unclear, breakdown of the blood-brain barriers appears to be associated with both AD biomarkers and vascular risk factors, though on different molecular scales [79]. This underscores the need for jointly investigating markers of AD and vascular function in the same study.
Summary and conclusions
In summary, our results support the view that among cognitively normal middle-aged and older individuals, WMH volumes are primarily associated with markers of neurofibrillary tau pathology (as measured by p-tau181) and neurodegeneration (as measured by t-tau), as well as with systemic vascular risk factors. Our findings suggest that once individuals develop MCI, WMH may also be associated with amyloidosis. Importantly, AD-specific pathways may contribute to the formation of WMH in a regionally-specific manner, with neurofibrillary tau pathology playing a role in temporal WMH and amyloid pathology in parietal WMH volumes.
ACKNOWLEDGMENTS
The BIOCARD Study consists of 7 Cores and two Projects with the following members: (1) the Administrative Core (Marilyn Albert, Rostislav Brichko); (2) the Clinical Core (Marilyn Albert, Anja Soldan, Corinne Pettigrew, Greg Pontone, Leonie Farrington, Jules Gilles, Nicole Johnson, Maura Grega, Gay Rudow, Scott Rudow); (3) the Imaging Core (Michael Miller, Susumu Mori, Tilak Ratnanather, Andrea Faria, Anthony Kolasny, Kenichi Oishi, Laurent Younes, Hanzhang Lu, Peter vanZijl); (4) the Biospecimen Core (Abhay Moghekar, Jacqueline Darrow, Alexandria Lewis); (5) the Informatics Core (Ann Ervin, David Shade, Jennifer Jones, Hamadou Coulibaly, Kathy Moser); (6) the Biostatistics Core (Mei-Cheng Wang, Yuxin (Daisy) Zhu, Jiangxia Wang); (7) the Neuropathology Core (Juan Troncoso, Javier Redding, Roberta Knox); (8) Project 1 (Paul Worley, Jeremy Walston), and (9) Project 2 (Mei-Cheng Wang, Sufei Sun). The authors are grateful to the members of the BIOCARD Scientific Advisory Board who provide continued oversight and guidance regarding the conduct of the study including: Drs. David Holtzman, William Jagust, David Knopman, Walter Kukull, and Kevin Grimm, and Drs. John Hsiao and Laurie Ryan, who provide oversight on behalf of the National Institute on Aging. The authors thank the members of the BIOCARD Resource Allocation Committee who provide ongoing guidance regarding the use of the biospecimens collected as part of the study, including: Drs. Constantine Lyketsos, Carlos Pardo, Gerard Schellenberg, Leslie Shaw, Madhav Thambisetty, and John Trojanowski. The authors acknowledge the contributions of the Geriatric Psychiatry Branch of the intramural program of NIMH who initiated the study (Principal investigator: Dr. Trey Sunderland). The authors are indebted to Dr. Karen Putnam, who provided documentation of the Geriatric Psychiatry Branch study procedures and the data files received from NIMH.
FUNDING
This work was supported by the National Institutes of Health [grant numbers U19-AG033655, P30-AG005146, P41 EB031771].
CONFLICT OF INTEREST
Marilyn Albert is an advi01/01/2013sor to Eli Lilly.
All other authors have no conflict of interest to report.
DATA AVAILABILITY
Anonymized data used in the analyses presented in this report are available on request from qualified investigators (https://www.biocard-se.org).
REFERENCES
[1] | Sperling RA , Aisen PS , Beckett LA , Bennett DA , Craft S , Fagan AM , Iwatsubo T , Jack CR Jr , Kaye J , Montine TJ , Park DC , Reiman EM , Rowe CC , Siemers E , Stern Y , Yaffe K , Carrillo MC , Thies B , Morrison-Bogorad M , Wagster MV , Phelps CH ((2011) ) Toward defining the preclinical stages of Alzheimer’s disease: Recommendations from the National Institute on Aging-Alzheimer’s Association workgroups on diagnostic guidelines for Alzheimer’s disease. Alzheimers Dement 7: , 280–292. |
[2] | Attems J , Jellinger KA ((2014) ) The overlap between vascular disease and Alzheimer’s disease–lessons from pathology. BMC Med 12: , 206. |
[3] | Brown R , Low A , Markus HS ((2021) ) Rate of, and risk factors for, white matter hyperintensity growth: A systematic review and meta-analysis with implications for clinical trial design. J Neurol Neurosurg Psychiatry 92: , 1271–1277. |
[4] | Wardlaw JM , Smith EE , Biessels GJ , Cordonnier C , Fazekas F , Frayne R , Lindley RI , O’Brien JT , Barkhof F , Benavente OR , Black SE , Brayne C , Breteler M , Chabriat H , Decarli C , de Leeuw FE , Doubal F , Duering M , Fox NC , Greenberg S , Hachinski V , Kilimann I , Mok V , Oostenbrugge R , Pantoni L , Speck O , Stephan BC , Teipel S , Viswanathan A , Werring D , Chen C , Smith C , van Buchem M , Norrving B , Gorelick PB , Dichgans M , nEuroimaging STfRVco ((2013) ) Neuroimaging standards for research into small vessel disease and its contribution to ageing and neurodegeneration. Lancet Neurol 12: , 822–838. |
[5] | Gorelick PB , Scuteri A , Black SE , Decarli C , Greenberg SM , Iadecola C , Launer LJ , Laurent S , Lopez OL , Nyenhuis D , Petersen RC , Schneider JA , Tzourio C , Arnett DK , Bennett DA , Chui HC , Higashida RT , Lindquist R , Nilsson PM , Roman GC , Sellke FW , Seshadri S , American Heart Association Stroke Council Council on Epidemiology and Prevention Council on Cardiovascular Nursing Council on Cardiovascular Radiology and Intervention and Council on Cardiovascular Surgery and Anesthesia ((2011) ) Vascular contributions to cognitive impairment and dementia: A statement for healthcare professionals from the American Heart Association/American Stroke Association. Stroke 42: , 2672–2713. |
[6] | Moghekar A , Kraut M , Elkins W , Troncoso J , Zonderman AB , Resnick SM , O’Brien RJ ((2012) ) Cerebral white matter disease is associated withAlzheimer pathology in a prospective cohort. AlzheimersDement 8: , S71–77. |
[7] | Phuah CL , Chen Y , Strain JF , Yechoor N , Laurido-Soto OJ , Ances BM , Lee JM for the Alzheimer’s Disease Neuroimaging Initiative ((2022) ) Association of data-driven white matter hyperintensity spatial signatures with distinct cerebral small vessel disease etiologies. Neurology 99: , e2535–e2547. |
[8] | Lee S , Viqar F , Zimmerman ME , Narkhede A , Tosto G , Benzinger TL , Marcus DS , Fagan AM , Goate A , Fox NC , Cairns NJ , Holtzman DM , Buckles V , Ghetti B , McDade E , Martins RN , Saykin AJ , Masters CL , Ringman JM , Ryan NS , Forster S , Laske C , Schofield PR , Sperling RA , Salloway S , Correia S , Jack C Jr , Weiner M , Bateman RJ , Morris JC , Mayeux R , Brickman AM Dominantly Inherited Alzheimer Network ((2016) ) White matter hyperintensities are a core feature of Alzheimer’s disease: Evidence from the dominantly inherited Alzheimer network. Ann Neurol 79: , 929–939. |
[9] | Lee S , Zimmerman ME , Narkhede A , Nasrabady SE , Tosto G , Meier IB , Benzinger TLS , Marcus DS , Fagan AM , Fox NC , Cairns NJ , Holtzman DM , Buckles V , Ghetti B , McDade E , Martins RN , Saykin AJ , Masters CL , Ringman JM , Frster S , Schofield PR , Sperling RA , Johnson KA , Chhatwal JP , Salloway S , Correia S , Jack CR Jr , Weiner M , Bateman RJ , Morris JC , Mayeux R , Brickman AM Dominantly Inherited Alzheimer Network ((2018) ) White matter hyperintensities and the mediating role of cerebral amyloid angiopathy in dominantly-inherited Alzheimer’s disease. PLoS One 13: , e0195838. |
[10] | Lindemer ER , Greve DN , Fischl B , Augustinack JC , Salat DH Alzheimer’s Disease Neuroimaging Initiative ((2017) ) Differential regional distribution of juxtacortical white matter signal abnormalities in aging and Alzheimer’s disease. J Alzheimers Dis 57: , 293–303. |
[11] | Yoshita M , Fletcher E , Harvey D , Ortega M , Martinez O , Mungas DM , Reed BR , DeCarli CS ((2006) ) Extent and distribution of white matter hyperintensities in normal aging, MCI, and AD. Neurology 67: , 2192–2198. |
[12] | Yang AC , Vest RT , Kern F , Lee DP , Agam M , Maat CA , Losada PM , Chen MB , Schaum N , Khoury N , Toland A , Calcuttawala K , Shin H , Palovics R , Shin A , Wang EY , Luo J , Gate D , Schulz-Schaeffer WJ , Chu P , Siegenthaler JA , McNerney MW , Keller A , Wyss-Coray T ((2022) ) A human brain vascular atlas reveals diverse mediators of Alzheimer’s risk. Nature 603: , 885–892. |
[13] | Marnane M , Al-Jawadi OO , Mortazavi S , Pogorzelec KJ , Wang BW , Feldman HH , Hsiung GY Alzheimer’s Disease Neuroimaging Initiative ((2016) ) Periventricular hyperintensities are associated with elevated cerebral amyloid. Neurology 86: , 535–543. |
[14] | Scott JA , Braskie MN , Tosun D , Maillard P , Thompson PM , Weiner M , DeCarli C , Carmichael OT ADNI ((2016) ) Cerebral amyloid is associated with greater white-matter hyperintensity accrual in cognitively normal older adults. Neurobiol Aging 48: , 48–52. |
[15] | Kandel BM , Avants BB , Gee JC , McMillan CT , Erus G , Doshi J , Davatzikos C , Wolk DA ((2016) ) White matter hyperintensities are more highly associated with preclinical Alzheimer’s disease than imaging and cognitive markers of neurodegeneration. Alzheimers Dement (Amst) 4: , 18–27. |
[16] | Osborn KE , Liu D , Samuels LR , Moore EE , Cambronero FE , Acosta LMY , Bell SP , Babicz MA , Gordon EA , Pechman KR , Davis LT , Gifford KA , Hohman TJ , Blennow K , Zetterberg H , Jefferson AL ((2018) ) Cerebrospinal fluid beta-amyloid42 and neurofilament light relate to white matter hyperintensities. Neurobiol Aging 68: , 18–25. |
[17] | Kester MI , Goos JD , Teunissen CE , Benedictus MR , Bouwman FH , Wattjes MP , Barkhof F , Scheltens P , van der Flier WM ((2014) ) Associations between cerebral small-vessel disease and Alzheimer disease pathology as measured by cerebrospinal fluid biomarkers. JAMA Neurol 71: , 855–862. |
[18] | Lo RY , Jagust WJ Alzheimer’s Disease Neuroimaging Initiative ((2012) ) Vascular burden and Alzheimer disease pathologic progression. Neurology 79: , 1349–1355. |
[19] | Soldan A , Pettigrew C , Zhu Y , Wang MC , Moghekar A , Gottesman RF , Singh B , Martinez O , Fletcher E , DeCarli C , Albert M BIOCARD Research Team ((2020) ) White matter hyperintensities and CSF Alzheimer disease biomarkers in preclinical Alzheimer disease. Neurology 94: , e950–e960. |
[20] | van Westen D , Lindqvist D , Blennow K , Minthon L , Nagga K , Stomrud E , Zetterberg H , Hansson O ((2016) ) Cerebral white matter lesions - associations with Abeta isoforms and amyloid PET. Sci Rep 6: , 20709. |
[21] | Shams S , Granberg T , Martola J , Li X , Shams M , Fereshtehnejad SM , Cavallin L , Aspelin P , Kristoffersen-Wiberg M , Wahlund LO ((2016) ) Cerebrospinal fluid profiles with increasing number of cerebral microbleeds in a continuum of cognitive impairment. J Cereb Blood Flow Metab 36: , 621–628. |
[22] | Han JW , Maillard P , Harvey D , Fletcher E , Martinez O , Johnson DK , Olichney JM , Farias ST , Villeneuve S , Jagust W , Mungas D , DeCarli C ((2020) ) Association of vascular brain injury, neurodegeneration, amyloid, and cognitive trajectory. Neurology 95: , e2622–e2634. |
[23] | Dupont PS , Bocti C , Joannette M , Lavallee MM , Nikelski J , Vallet GT , Chertkow H , Joubert S ((2020) ) Amyloid burden and white matter hyperintensities mediate age-related cognitive differences. Neurobiol Aging 86: , 16–26. |
[24] | Hedden T , Mormino EC , Amariglio RE , Younger AP , Schultz AP , Becker JA , Buckner RL , Johnson KA , Sperling RA , Rentz DM ((2012) ) Cognitive profile of amyloid burden and white matter hyperintensities in cognitively normal older adults. J Neurosci 32: , 16233–16242. |
[25] | Hedden T , Van Dijk KR , Shire EH , Sperling RA , Johnson KA , Buckner RL ((2012) ) Failure to modulate attentional control in advanced aging linked to white matter pathology. Cereb Cortex 22: , 1038–1051. |
[26] | Marchant NL , Reed BR , Sanossian N , Madison CM , Kriger S , Dhada R , Mack WJ , DeCarli C , Weiner MW , Mungas DM , Chui HC , Jagust WJ ((2013) ) The aging brain and cognition: Contribution of vascular injury andabeta to mild cognitive dysfunction. JAMA Neurol 70: , 488–495. |
[27] | Corder EH , Saunders AM , Strittmatter WJ , Schmechel DE , Gaskell PC , Small GW , Roses AD , Haines JL , Pericak-Vance MA ((1993) ) Gene dose of apolipoprotein E type 4 allele and the risk of Alzheimer’s disease in late onset families. Science 261: , 921–923. |
[28] | Stenset V , Hofoss D , Johnsen L , Berstad AE , Negaard A , Skinningsrud A , Gjerstad L , Fladby T ((2011) ) White matter lesion load increases the risk of low CSF Abeta42 in apolipoprotein E-varepsilon4 carriers attending a memory clinic. J Neuroimaging 21: , e78–82. |
[29] | Gottesman RF , Schneider AL , Zhou Y , Coresh J , Green E , Gupta N , Knopman DS , Mintz A , Rahmim A , Sharrett AR , Wagenknecht LE , Wong DF , Mosley TH ((2017) ) Association between midlife vascular risk factorsand estimated brain amyloid deposition. JAMA 317: , 1443–1450. |
[30] | Dumurgier J , Schraen S , Gabelle A , Vercruysse O , Bombois S , Laplanche JL , Peoc’h K , Sablonniere B , Kastanenka KV , Delaby C , Pasquier F , Touchon J , Hugon J , Paquet C , Lehmann S ((2015) ) Cerebrospinal fluid amyloid-beta 42/40 ratio in clinical setting of memory centers: A multicentric study. Alzheimers Res Ther 7: , 30. |
[31] | Willemse EAJ , Tijms BM , van Berckel BNM , Le Bastard N , van der Flier WM , Scheltens P , Teunissen CE ((2021) ) Comparing CSF amyloid-beta biomarker ratios for two automated immunoassays, Elecsys and Lumipulse, with amyloid PET status. Alzheimers Dement (Amst) 13: , e12182. |
[32] | Albert M , Soldan A , Gottesman R , McKhann G , Sacktor N , Farrington L , Grega M , Turner R , Lu Y , Li S , Wang MC , Selnes O ((2014) ) Cognitivechanges preceding clinical symptom onset of mild cognitiveimpairment and relationship togenotype. CurrAlzheimer Res 11: , 773–784. |
[33] | Morris JC ((1993) ) The Clinical Dementia Rating (CDR): Current version and scoring rules. Neurology 43: , 2412–2414. |
[34] | Albert M , DeKosky ST , Dickson D , Dubois B , Feldman HH , Fox NC , Gamst A , Holtzman DM , Jagust WJ , Petersen RC , Snyder PJ , Carrillo MC , Thies B , Phelps CH ((2011) ) The diagnosis of mild cognitive impairment due to Alzheimer’s disease: Recommendations from the National Institute on Aging-Alzheimer’s Association workgroups on diagnostic guidelines for Alzheimer’s disease. Alzheimers Dement 7: , 270–279. |
[35] | McKhann GM , Knopman DS , Chertkow H , Hyman BT , Jack CR Jr , Kawas CH , Klunk WE , Koroshetz WJ , Manly JJ , Mayeux R , Mohs RC , Morris JC , Rossor MN , Scheltens P , Carrillo MC , Thies B , Weintraub S , Phelps CH ((2011) ) The diagnosis of dementia due to Alzheimer’s disease: Recommendations from the National Institute on Aging-Alzheimer’s Association workgroups on diagnostic guidelines for Alzheimer’s disease. Alzheimers Dement 7: , 263–269. |
[36] | Lin Z , Lim C , Jiang D , Soldan A , Pettigrew C , Oishi K , Zhu Y , Moghekar A , Liu P , Albert M , Lu H ((2022) ) Longitudinal changes in brain oxygen extraction fraction (OEF) in older adults: Relationship to markers of vascular and Alzheimer’s pathology. Alzheimers Dement–10.1002/alz.12727. |
[37] | Soldan A , Pettigrew C , Zhu Y , Wang MC , Gottesman RF , DeCarli C , Albert M BIOCARD Research Team ((2020) ) Cognitive reserve and midlifevascular risk: Cognitive and clinical outcomes. Ann Clin TranslNeurol 7: , 1307–1317. |
[38] | Pettigrew C , Soldan A , Wang J , Wang MC , Arthur K , Moghekar A , Gottesman RF , Albert M ((2020) ) Association of midlife vascular risk and AD biomarkers with subsequent cognitive decline. Neurology 95: , e3093–e3103. |
[39] | Goldberg TE , Huey ED , Devanand DP ((2020) ) Association of APOE e2 genotype with Alzheimer’s and non-Alzheimer’s neurodegenerative pathologies. Nat Commun 11: , 4727. |
[40] | DeCarli C , Maillard P , Fletcher E Four tissue segmentation in ADNIII. https://www.alz.washington.edu/WEB/adni_proto.pdf2013. |
[41] | Aljabar P , Heckemann RA , Hammers A , Hajnal JV , Rueckert D ((2009) ) Multi-atlas based segmentation of brain images: Atlas selection and its effect on accuracy. Neuroimage 46: , 726–738. |
[42] | Kochunov P , Lancaster JL , Thompson P , Woods R , Mazziotta J , Hardies J , Fox P ((2001) ) Regional spatial normalization: Toward an optimal target. J Comput Assist Tomogr 25: , 805–816. |
[43] | Fletcher E , Carmichael O , Decarli C ((2012) ) MRI non-uniformity correction through interleaved bias estimation and B-spline deformation with a template. Conf Proc IEEE Eng Med Biol Soc 2012: , 106–109. |
[44] | Fletcher E , Singh B , Harvey D , Carmichael O , DeCarli C ((2012) ) Adaptive image segmentation for robust measurement of longitudinal brain tissue change. Conf Proc IEEE Eng Med Biol Soc 2012: , 5319–5322. |
[45] | DeCarli C , Miller BL , Swan GE , Reed T , Wolf PA , Garner J , Jack L , Carmelli D ((1999) ) Predictors of brain morphology for the men of the NHLBI twin study. Stroke 30: , 529–536. |
[46] | Guo T , Landau SM , Jagust WJ Alzheimer’s Disease Neuroimaging Initiative ((2021) ) Age, vascular disease, and Alzheimer’s disease pathologies in amyloid negative elderly adults. Alzheimers Res Ther 13: , 174. |
[47] | Zebhauser PT , Berthele A , Franz MS , Goldhardt O , Diehl-Schmid J , Priller J , Ortner M , Grimmer T ((2021) ) Age-dependency of total tau in the cerebrospinal fluid is corrected by amyloid-beta 1-40: A correlational study in healthy adults. J Alzheimers Dis 83: , 155–162. |
[48] | Bozzali M , Falini A , Franceschi M , Cercignani M , Zuffi M , Scotti G , Comi G , Filippi M ((2002) ) White matter damage in Alzheimer’s disease assessed using diffusion tensor magnetic resonance imaging. J Neurol Neurosurg Psychiatry 72: , 742–746. |
[49] | Braak H , Alafuzoff I , Arzberger T , Kretzschmar H , Del Tredici K ((2006) ) Staging of Alzheimer disease-associated neurofibrillary pathology using paraffin sections and immunocytochemistry. Acta Neuropathol 112: , 389–404. |
[50] | van der Kant R , Goldstein LSB , Ossenkoppele R ((2020) ) Amyloid-beta-independent regulators of tau pathology in Alzheimer disease. Nat Rev Neurosci 21: , 21–35. |
[51] | Zlokovic BV ((2011) ) Neurovascular pathways to neurodegeneration in Alzheimer’s disease and other disorders. Nat Rev Neurosci 12: , 723–738. |
[52] | Kapasi A , Yu L , Petyuk V , Arfanakis K , Bennett DA , Schneider JA ((2022) ) Association of small vessel disease with tau pathology. Acta Neuropathol 143: , 349–362. |
[53] | Laing KK , Simoes S , Baena-Caldas GP , Lao PJ , Kothiya M , Igwe KC , Chesebro AG , Houck AL , Pedraza L , Hernandez AI , Li J , Zimmerman ME , Luchsinger JA , Barone FC , Moreno H , Brickman AM Alzheimer’s Disease Neuroimaging Initiative ((2020) ) Cerebrovascular disease promotes tau pathology in Alzheimer’s disease. Brain Commun 2: , fcaa132. |
[54] | Tosto G , Zimmerman ME , Hamilton JL , Carmichael OT , Brickman AM Alzheimer’s Disease Neuroimaging Initiative ((2015) ) The effect of white matter hyperintensities on neurodegeneration in mild cognitive impairment. Alzheimers Dement 11: , 1510–1519. |
[55] | Erten-Lyons D , Woltjer R , Kaye J , Mattek N , Dodge HH , Green S , Tran H , Howieson DB , Wild K , Silbert LC ((2013) ) Neuropathologic basis of white matter hyperintensity accumulation with advanced age. Neurology 81: , 977–983. |
[56] | Weaver NA , Doeven T , Barkhof F , Biesbroek JM , Groeneveld ON , Kuijf HJ , Prins ND , Scheltens P , Teunissen CE , van der Flier WM , Biessels GJ TRACE-VCI study group ((2019) ) Cerebral amyloid burden is associated with white matter hyperintensity location in specific posterior white matter regions. Neurobiol Aging 84: , 225–234. |
[57] | Greenberg BD , Pettigrew C , Soldan A , Wang J , Wang MC , Darrow J , Albert M , Moghekar A ((2022) ) CSF Alzheimer’s disease biomarkers: Time-varying relationships with MCI symptom onset, and associations with age, sex, and ApoE4. Neurology 99: , e1640–e1650. |
[58] | Lehmann S , Dumurgier J , Ayrignac X , Marelli C , Alcolea D , Ormaechea JF , Thouvenot E , Delaby C , Hirtz C , Vialaret J , Ginestet N , Bouaziz-Amar E , Laplanche JL , Labauge P , Paquet C , Lleo A , Gabelle A Alzheimer’s Disease Neuroimaging Initiative ((2020) ) Cerebrospinal fluid A beta 1-40 peptides increase in Alzheimer’s disease and are highly correlated with phospho-tau in control individuals. Alzheimers Res Ther 12: , 123. |
[59] | Guo T , Korman D , La Joie R , Shaw LM , Trojanowski JQ , Jagust WJ , Landau SM Alzheimer’s Disease Neuroimaging Initiative ((2020) ) Normalization of CSF pTau measurement by Abeta40 improves its performance as a biomarker of Alzheimer’s disease. Alzheimers Res Ther 12: , 97. |
[60] | Willemse E , van Uffelen K , Brix B , Engelborghs S , Vanderstichele H , Teunissen C ((2017) ) How to handle adsorption of cerebrospinal fluid amyloid beta (1-42) in laboratory practice? Identifying problematic handlings and resolving the issue by use of the Abeta42/Abeta40 ratio. Alzheimers Dement 13: , 885–892. |
[61] | Greenberg SM , Bacskai BJ , Hernandez-Guillamon M , Pruzin J , Sperling R , van Veluw SJ ((2020) ) Cerebral amyloid angiopathy and Alzheimer disease - one peptide, two pathways. Nat Rev Neurol 16: , 30–42. |
[62] | Iliff JJ , Wang M , Liao Y , Plogg BA , Peng W , Gundersen GA , Benveniste H , Vates GE , Deane R , Goldman SA , Nagelhus EA , Nedergaard M ((2012) ) A paravascular pathway facilitates CSF flow through the brain parenchyma and the clearance of interstitial solutes, including amyloid beta. Sci Transl Med 4: , 147ra111. |
[63] | Kress BT , Iliff JJ , Xia M , Wang M , Wei HS , Zeppenfeld D , Xie L , Kang H , Xu Q , Liew JA , Plog BA , Ding F , Deane R , Nedergaard M ((2014) ) Impairment of paravascular clearance pathways in the aging brain. Ann Neurol 76: , 845–861. |
[64] | Hajjar I , Quach L , Yang F , Chaves PH , Newman AB , Mukamal K , Longstreth W Jr , Inzitari M , Lipsitz LA ((2011) ) Hypertension, white matter hyperintensities, and concurrent impairments in mobility, cognition, and mood: The Cardiovascular Health Study. Circulation 123: , 858–865. |
[65] | Moroni F , Ammirati E , Rocca MA , Filippi M , Magnoni M , Camici PG ((2018) ) Cardiovascular disease and brain health: Focus on white matter hyperintensities. Int J Cardiol Heart Vasc 19: , 63–69. |
[66] | Raz N , Yang Y , Dahle CL , Land S ((2012) ) Volume of white matter hyperintensities in healthy adults: Contribution of age, vascular risk factors, and inflammation-related genetic variants. Biochim Biophys Acta 1822: , 361–369. |
[67] | Al-Janabi OM , Brown CA , Bahrani AA , Abner EL , Barber JM , Gold BT , Goldstein LB , Murphy RR , Nelson PT , Johnson NF , Shaw LM , Smith CD , Trojanowski JQ , Wilcock DM , Jicha GA ((2018) ) Distinct white matter changes associated with cerebrospinal fluid amyloid-beta1-42 and hypertension. J Alzheimers Dis 66: , 1095–1104. |
[68] | Bilgel M , Prince JL , Wong DF , Resnick SM , Jedynak BM ((2016) ) A multivariate nonlinear mixed effects model for longitudinal image analysis: Application to amyloid imaging. Neuroimage 134: , 658–670. |
[69] | McAleese KE , Walker L , Graham S , Moya ELJ , Johnson M , Erskine D , Colloby SJ , Dey M , Martin-Ruiz C , Taylor JP , Thomas AJ , McKeith IG , De Carli C , Attems J ((2017) ) Parietal white matter lesions in Alzheimer’s disease are associated with cortical neurodegenerative pathology, but not with small vessel disease. Acta Neuropathol 134: , 459–473. |
[70] | McAleese KE , Miah M , Graham S , Hadfield GM , Walker L , Johnson M , Colloby SJ , Thomas AJ , DeCarli C , Koss D , Attems J ((2021) ) Frontal white matter lesions in Alzheimer’s disease are associated with both small vessel disease and AD-associated cortical pathology. Acta Neuropathol 142: , 937–950. |
[71] | Habes M , Sotiras A , Erus G , Toledo JB , Janowitz D , Wolk DA , Shou H , Bryan NR , Doshi J , Volzke H , Schminke U , Hoffmann W , Resnick SM , Grabe HJ , Davatzikos C ((2018) ) White matter lesions: Spatial heterogeneity, links to risk factors, cognition, genetics, and atrophy. Neurology 91: , e975–e964. |
[72] | Palhaugen L , Sudre CH , Tecelao S , Nakling A , Almdahl IS , Kalheim LF , Cardoso MJ , Johnsen SH , Rongve A , Aarsland D , Bjornerud A , Selnes P , Fladby T ((2021) ) Brain amyloid and vascular risk are related to distinct white matter hyperintensity patterns. J Cereb Blood Flow Metab 41: , 1162–1174. |
[73] | Griffanti L , Jenkinson M , Suri S , Zsoldos E , Mahmood A , Filippini N , Sexton CE , Topiwala A , Allan C , Kivimaki M , Singh-Manoux A , Ebmeier KP , Mackay CE , Zamboni G ((2018) ) Classification and characterization of periventricular and deep white matter hyperintensities on MRI: A study in older adults. Neuroimage 170: , 174–181. |
[74] | Kisler K , Nelson AR , Montagne A , Zlokovic BV ((2017) ) Cerebral blood flow regulation and neurovascular dysfunction in Alzheimer disease. Nat Rev Neurosci 18: , 419–434. |
[75] | Miners JS , Schulz I , Love S ((2018) ) Differing associations between Abeta accumulation, hypoperfusion, blood-brain barrier dysfunction and loss of PDGFRB pericyte marker in the precuneus and parietal white matter in Alzheimer’s disease. J Cereb Blood Flow Metab 38: , 103–115. |
[76] | Miners JS , Kehoe PG , Love S , Zetterberg H , Blennow K ((2019) ) CSF evidence of pericyte damage in Alzheimer’s disease is associated with markers of blood-brain barrier dysfunction and disease pathology. Alzheimers Res Ther 11: , 81. |
[77] | Montagne A , Nation DA , Sagare AP , Barisano G , Sweeney MD , Chakhoyan A , Pachicano M , Joe E , Nelson AR , D’Orazio LM , Buennagel DP , Harrington MG , Benzinger TLS , Fagan AM , Ringman JM , Schneider LS , Morris JC , Reiman EM , Caselli RJ , Chui HC , Tcw J , Chen Y , Pa J , Conti PS , Law M , Toga AW , Zlokovic BV ((2020) ) APOE4 leads to blood-brain barrier dysfunction predicting cognitive decline. Nature 581: , 71–76. |
[78] | Nortley R , Korte N , Izquierdo P , Hirunpattarasilp C , Mishra A , Jaunmuktane Z , Kyrargyri V , Pfeiffer T , Khennouf L , Madry C , Gong H , Richard-Loendt A , Huang W , Saito T , Saido TC , Brandner S , Sethi H , Attwell D ((2019) ) Amyloid beta oligomers constrict human capillaries in Alzheimer’s disease via signaling to pericytes. Science 365: . |
[79] | Lin Z , Sur S , Liu P , Li Y , Jiang D , Hou X , Darrow J , Pillai JJ , Yasar S , Rosenberg P , Albert M , Moghekar A , Lu H ((2021) ) Blood-brain barrier breakdown in relationship to Alzheimer and vascular disease. Ann Neurol 90: , 227–238. |


