
Pathogenomic Signature and Aberrant Neurogenic Events in Experimental Cerebral Ischemic Stroke: A Neurotranscriptomic-Based Implication for Dementia
Abstract
Background:
Cerebral ischemic stroke is caused due to neurovascular damage or thrombosis, leading to neuronal dysfunction, neuroinflammation, neurodegeneration, and regenerative failure responsible for neurological deficits and dementia. The valid therapeutic targets against cerebral stroke remain obscure. Thus, insight into neuropathomechanisms resulting from the aberrant expression of genes appears to be crucial.
Objective:
In this study, we have elucidated how neurogenesis-related genes are altered in experimental stroke brains from the available transcriptome profiles in correlation with transcriptome profiles of human postmortem stroke brain tissues.
Methods:
The transcriptome datasets available on the middle cerebral artery occlusion (MCAo) rat brains were obtained from the Gene Expression Omnibus, National Center for Biotechnology Information. Of the available datasets, 97 samples were subjected to the meta-analysis using the network analyst tool followed by Cytoscape-based enrichment mapping analysis. The key differentially expressed genes (DEGs) were validated and compared with transcriptome profiling of human stroke brains.
Results:
Results revealed 939 genes are differently expressed in the brains of the MCAo rat model of stroke, in which 30 genes are key markers of neural stem cells, and regulators of neurogenic processes. Its convergence with DEGs from human stroke brains has revealed common targets.
Conclusion:
This study has established a panel of highly important DEGs to signify the potential therapeutic targets for neuroregenerative strategy against pathogenic events associated with cerebral stroke. The outcome of the findings can be translated to mitigate neuroregeneration failure seen in various neurological and metabolic disease manifestations with neurocognitive impairments.
INTRODUCTION
Cerebral stroke is an abrupt neuropathogenic complication, associated with disruption of the neurovascular compartments, abnormal cranial blood flow, or thrombosis in the brain [1]. Cerebral stroke represents the second leading cause of death and induces neurological disability in a significant number of individuals worldwide [2, 3]. Clinically, cerebral stroke has been characterized by altered neurotransmission, neuroinflammation, and neuronal oxidative damage in the functional areas of the brain. The grey matter of the brain tissue is highly vulnerable to the ischaemic lesion, and the resulting neuropathogenic changes vary among different areas of the brain, depending upon the neural density and neurovascularization [2]. The pathogenic events of cerebral stroke lead to comorbid neurological motor deficits, paralysis, and neurocognitive impairments including dementia [4]. The onset of ischemic stroke causes various neuropathogenic changes, particularly necrosis, apoptosis, and reactive fibrosis in the infarct zones of the brain [5]. The basal ganglia of the brain, particularly the striatum appears to be highly vulnerable to stroke-mediated neuronal damage [6, 7]. Hence, the prominent neuronal loss noticed in the striatum has been linked to paralytic attacks and motor deficits in stroke patients [8]. The recombinant tissue plasminogen activator has been considered as a possible management therapy for ischemic stroke with a therapeutic window of less than 4.5 h from the onset of the clinical symptoms [9]. However, no definite medical cure has been available for cerebral stroke. Therefore, the establishment of valid remedial measures and neural regenerative attempts for the clinical management of ischemic stroke is crucial. Adult neurogenesis is an innate ability of the brain that continuously produces new neurons throughout life to maintain and support various forms of neuroplasticity including cognition [10]. Adult neurogenesis occurs predominantly in two major stem cell niches of the brain, namely the subgranular zone in the dentate gyrus of the hippocampus and the subventricular zone (SVZ) located along the lateral ventricle walls of the brain [11, 12]. The regulation of neurogenesis in the adult brain has been linked to various neurocognitive functions including movement and memory [13]. Notably, the neural stem cell-derived neuroblasts in the SVZ appears to migrate to the infarct zone of the stroke brains [14]. Thus, these migratory events of neuroblasts to the infarct zone in the stroke brains have been considered as the regenerative and endogenous repair mechanisms as it can support the functional recovery in post-stroke conditions [15]. However, the fate of the migrated neuroblasts in the ischemic striatum and other vulnerable brain regions remains unknown. Considering facts, the underlying pathomechanisms resulting from the abnormal expression of genes related to aberrant neurogenic events in stroke brains remain to be fully determined.
Recent scientific advancements in omics-based strategies, microarray, RNA-seq, and other transcriptome technologies have become highly instrumental in recognizing the druggable targets in many diseases [16]. However, transcriptional approaches and integrated genomics analysis determining pathogenic changes in cerebral stroke appear to be highly limited. A meta-analysis of available transcriptome data in identifying the differentially expressed genes (DEGs) in the stroke brain appears to be crucial for the moment. However, the availability of cerebral stroke-related transcriptome data in humans appears to be highly limited. Thus, differential gene expression datasets established from the experimental middle cerebral artery occlusion (MCAo) models of stroke in Rattus norvegicus have been considered as a potential alternative in this study. Eventually, a cascade of integrated in-silico meta-analysis revealed a panel of abnormal expression of neurogenic markers and dysregulated signaling pathways of neurogenic processes in the brains of subjects with cerebral stroke. This study has established a panel of highly relevant DEGs to signify the potential therapeutic targets for neuroregenerative strategy against pathogenic events associated with cerebral stroke. The result obtained from this study can be translated to mitigate neurocognitive impairments seen in various neuropathogenic conditions including dementia.
MATERIALS AND METHODS
Collection of microarray data
An online search was carried out in the Gene Expression Omnibus, National Center for Biotechnology Information (GEO-NCBI) using the keywords “MCAo” and “stroke” in Rattus norvegicus. Ten microarray datasets of experimental cerebral stroke generated from Agilent, Affymetrix, and Illumina platforms were scrutinized. From which, 97 samples (43 sham control brains versus 54 MCAo brains) were included in this study. Throughout the study, only the ipsilateral cortex of the rat brain was considered. The inclusion criteria considered for the study have been supplied in Table 1. Details about the collected datasets are listed in Table 2. An overview of the meta-analysis conducted in this study has been illustrated in Fig. 1.
Table 1
Inclusion criteria considered for the study
| Species | Rattus norvegicus |
| Strain | Sprague-Dawley, Wistar |
| Sex | Male |
| Age | 3–20 months (majority of the sample was in the adult age group, i.e., above 6 months) |
| MCAo Occlusion period | 60 min, 90 min, 120 min, permanent |
| Sample collection period after MCAo | 3 h to 7 days (majority of the sample was collected within the first 3 days) |
| Any model comprising pre-treatment before MCAo was not considered for the study. | |
Table 2
Summary of transcriptome data used in this study
| Datasets | No. of Samples | Platform | References | |
| Sham | MCAo | |||
| GSE97537 | 5 | 7 | GPL1355 Rat230_2 Affymetrix Rat Genome 230 2.0 Array | Unpublished Submission |
| GSE78731 | 5 | 5 | GPL15084 Agilent-028279 SurePrint G3 Rat GE 8x60K Microarray (Probe Name version) | [61] |
| GSE52001 | 3 | 3 | GPL14746 Agilent-028282 Whole Rat Genome Microarray 4×44K v3 (Probe Name version) | [62] |
| GSE61616 | 5 | 5 | GPL1355 Rat230_2 Affymetrix Rat Genome 230 2.0 Array | [63] |
| GSE33725 | 6 | 6 | GPL7294 Agilent-014879 Whole Rat Genome Microarray 4x44K G4131F (Probe Name version) | [64] |
| GSE17929 | 2 | 4 | GPL85 RG_U34A Affymetrix Rat Genome U34 Array /// GPL341 RAE230A Affymetrix Rat Expression 230A Array | [65] |
| GSE36010 | 8 | 8 | GPL7294 Agilent-014879 Whole Rat Genome Microarray 4x44K G4131F (Probe Name version) | [66] |
| GSE23651 | 8 | 8 | GPL6101 Illumina ratRef-12 v1.0 expression beadchip | Unpublished Submission |
| GSE46267 | 1 | 8 | GPL6101 Illumina ratRef-12 v1.0 expression beadchip | [67] |
| Total Samples | 43 | 54 | ||
Fig. 1
Overview of the enrichment analysis process. Synopsis of a meta-analysis conducted in this study. 10 microarray datasets comprising a total of 97 samples were chosen from the NCBI GEO webpage. Datasets were annotated with Entrez id to facilitate compatibility in network analyst 3.0 software. After validation, the data were uploaded to Network analyst software, where the samples were normalized and subjected to meta-analysis, thus obtaining the resulting ranked differentially expressed gene list comprising 939 genes. The differentially expressed genes between sham and MCAo stroke-affected animals were subjected to enrichment analysis through Cytoscape, WebGestalt and string analysis.
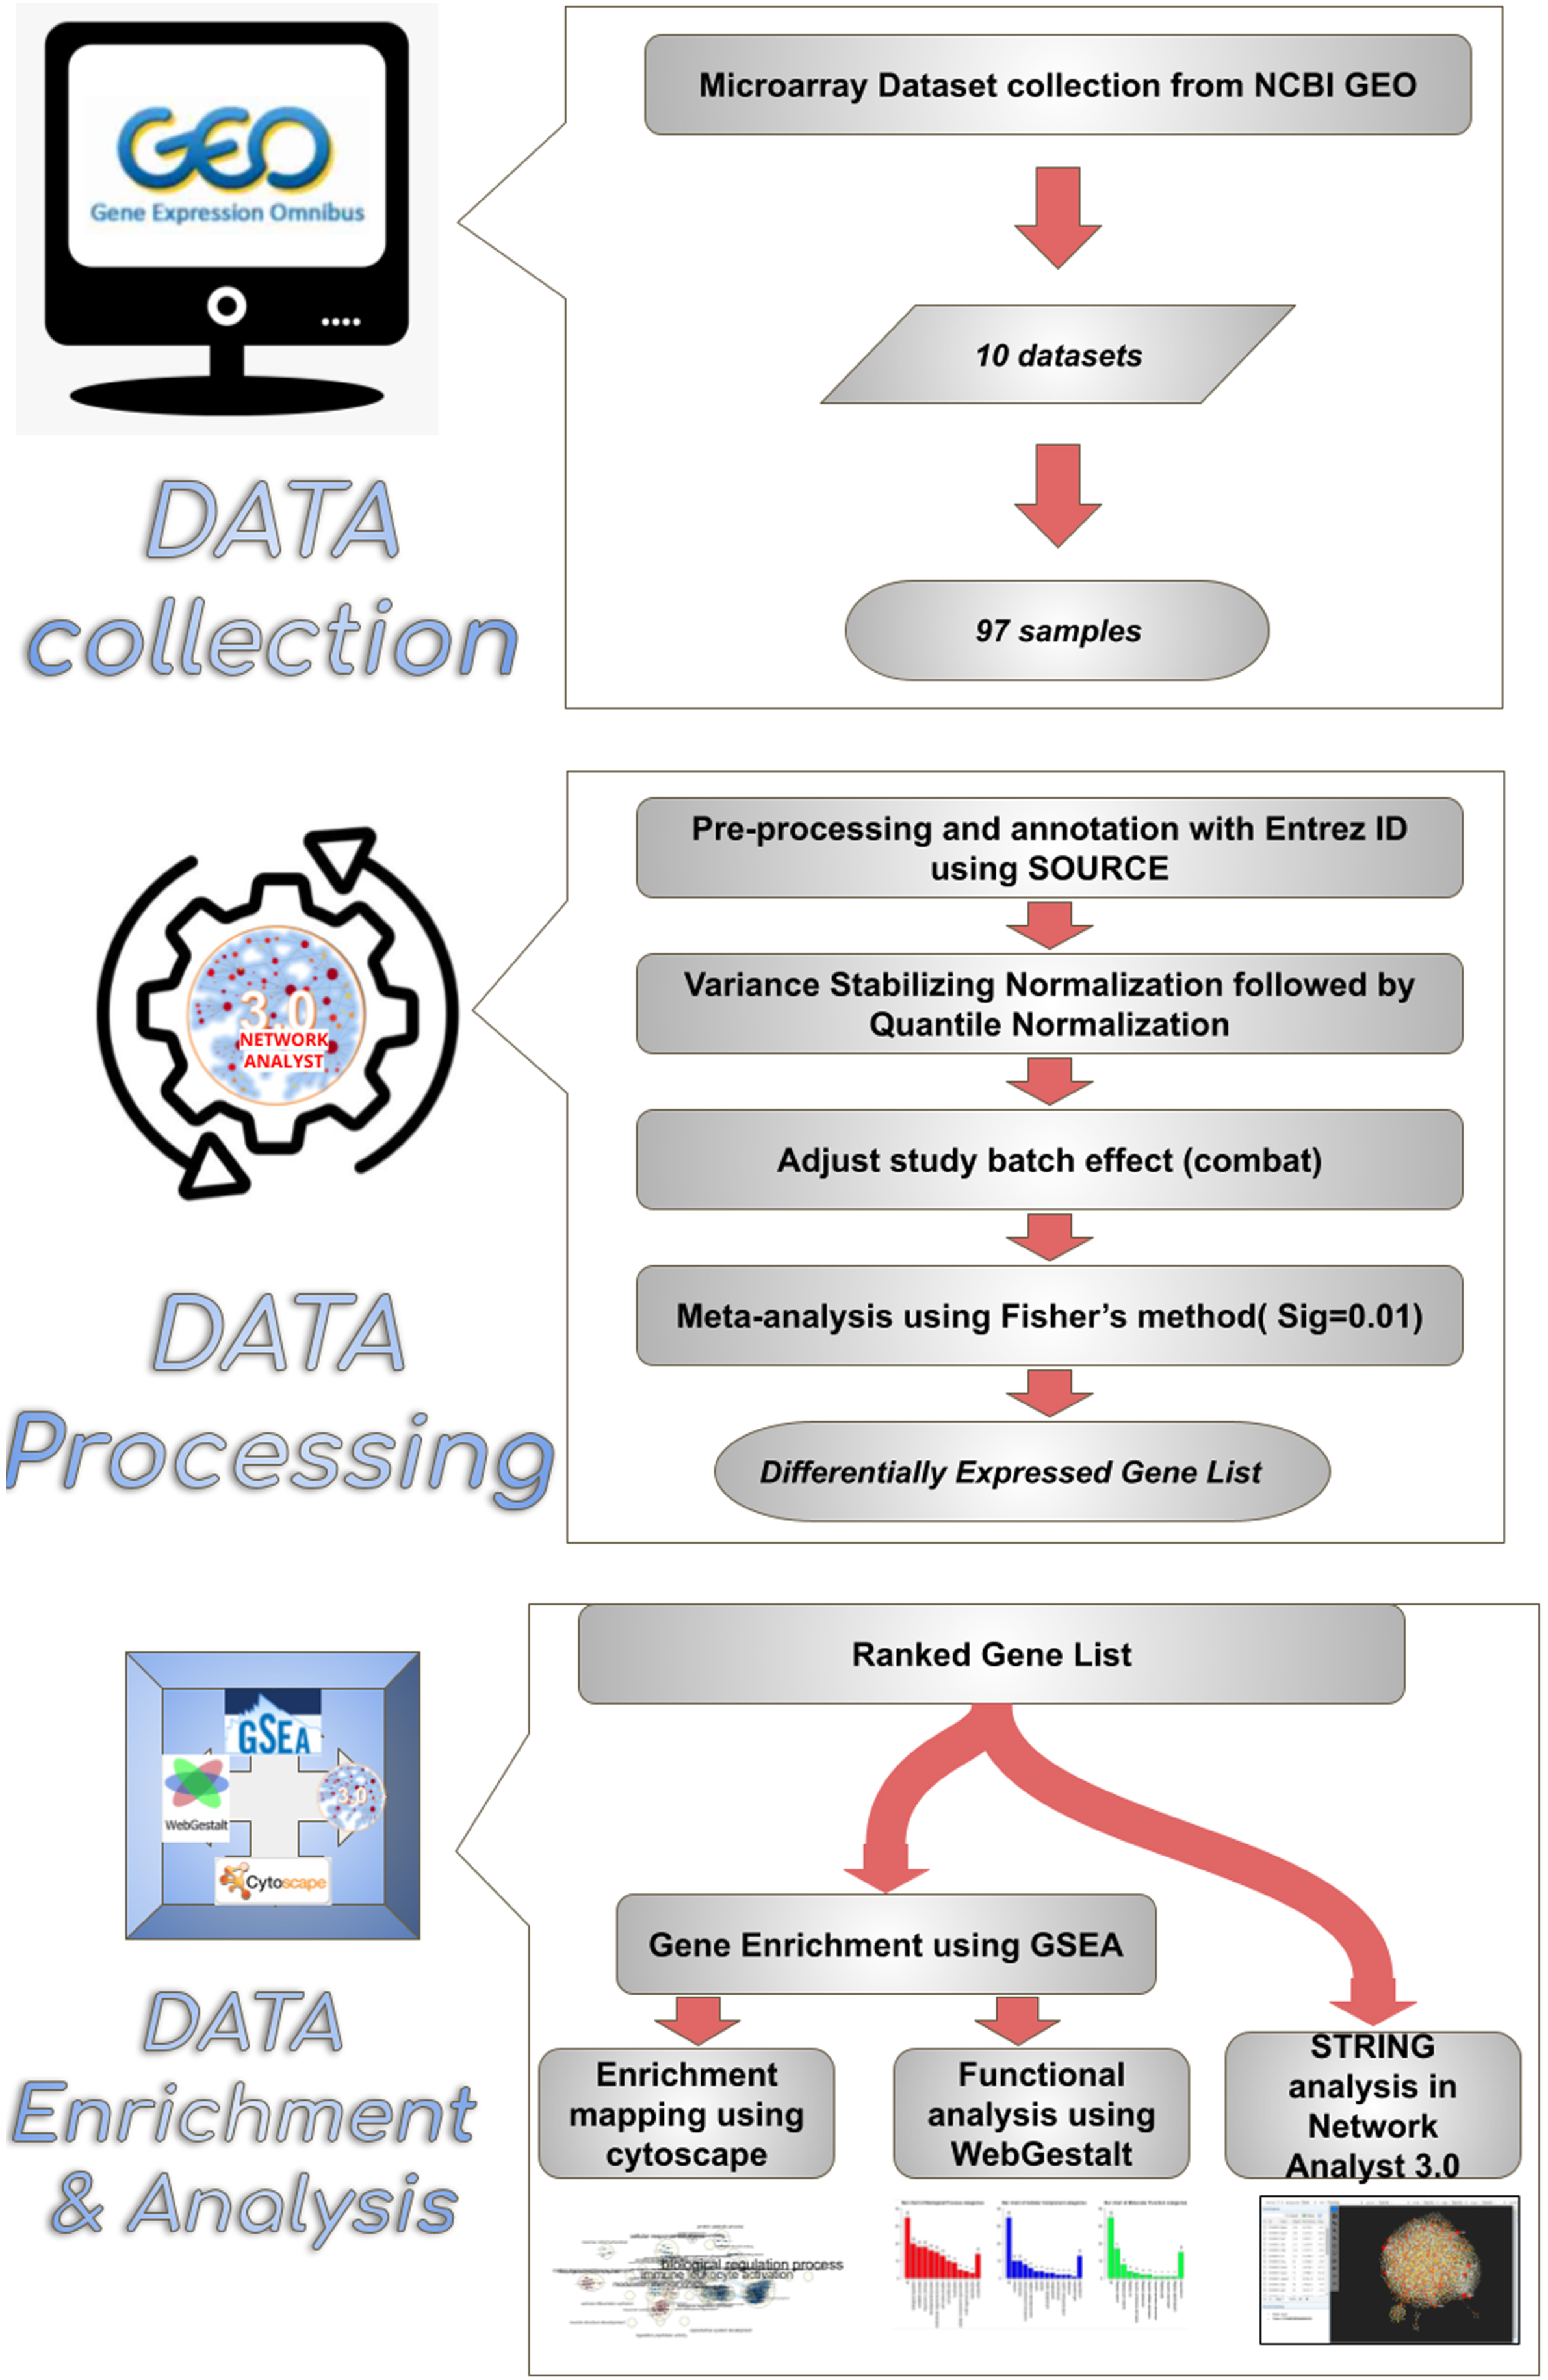
Data processing
Series matrix files were downloaded from the appropriate datasets listed in NCBI, and the well-matched data sets were processed for the multiple gene expression table analysis using Network analyst 3.0. (https://www.networkanalyst.ca/) [17, 18], while the non-compatible datasets were processed using SOURCE batch search [19] and mapped with the appropriate ENTREZ gene ID. The probes that did not match with an ENTREZ ID were independently aligned after careful verifications and uploaded along with previously mapped ENTREZ genes to network analyst software to obtain the profile of DEGs. The study batch effect among different datasets was adjusted using the combat option [20].
Preparation of differentially expressed genes list
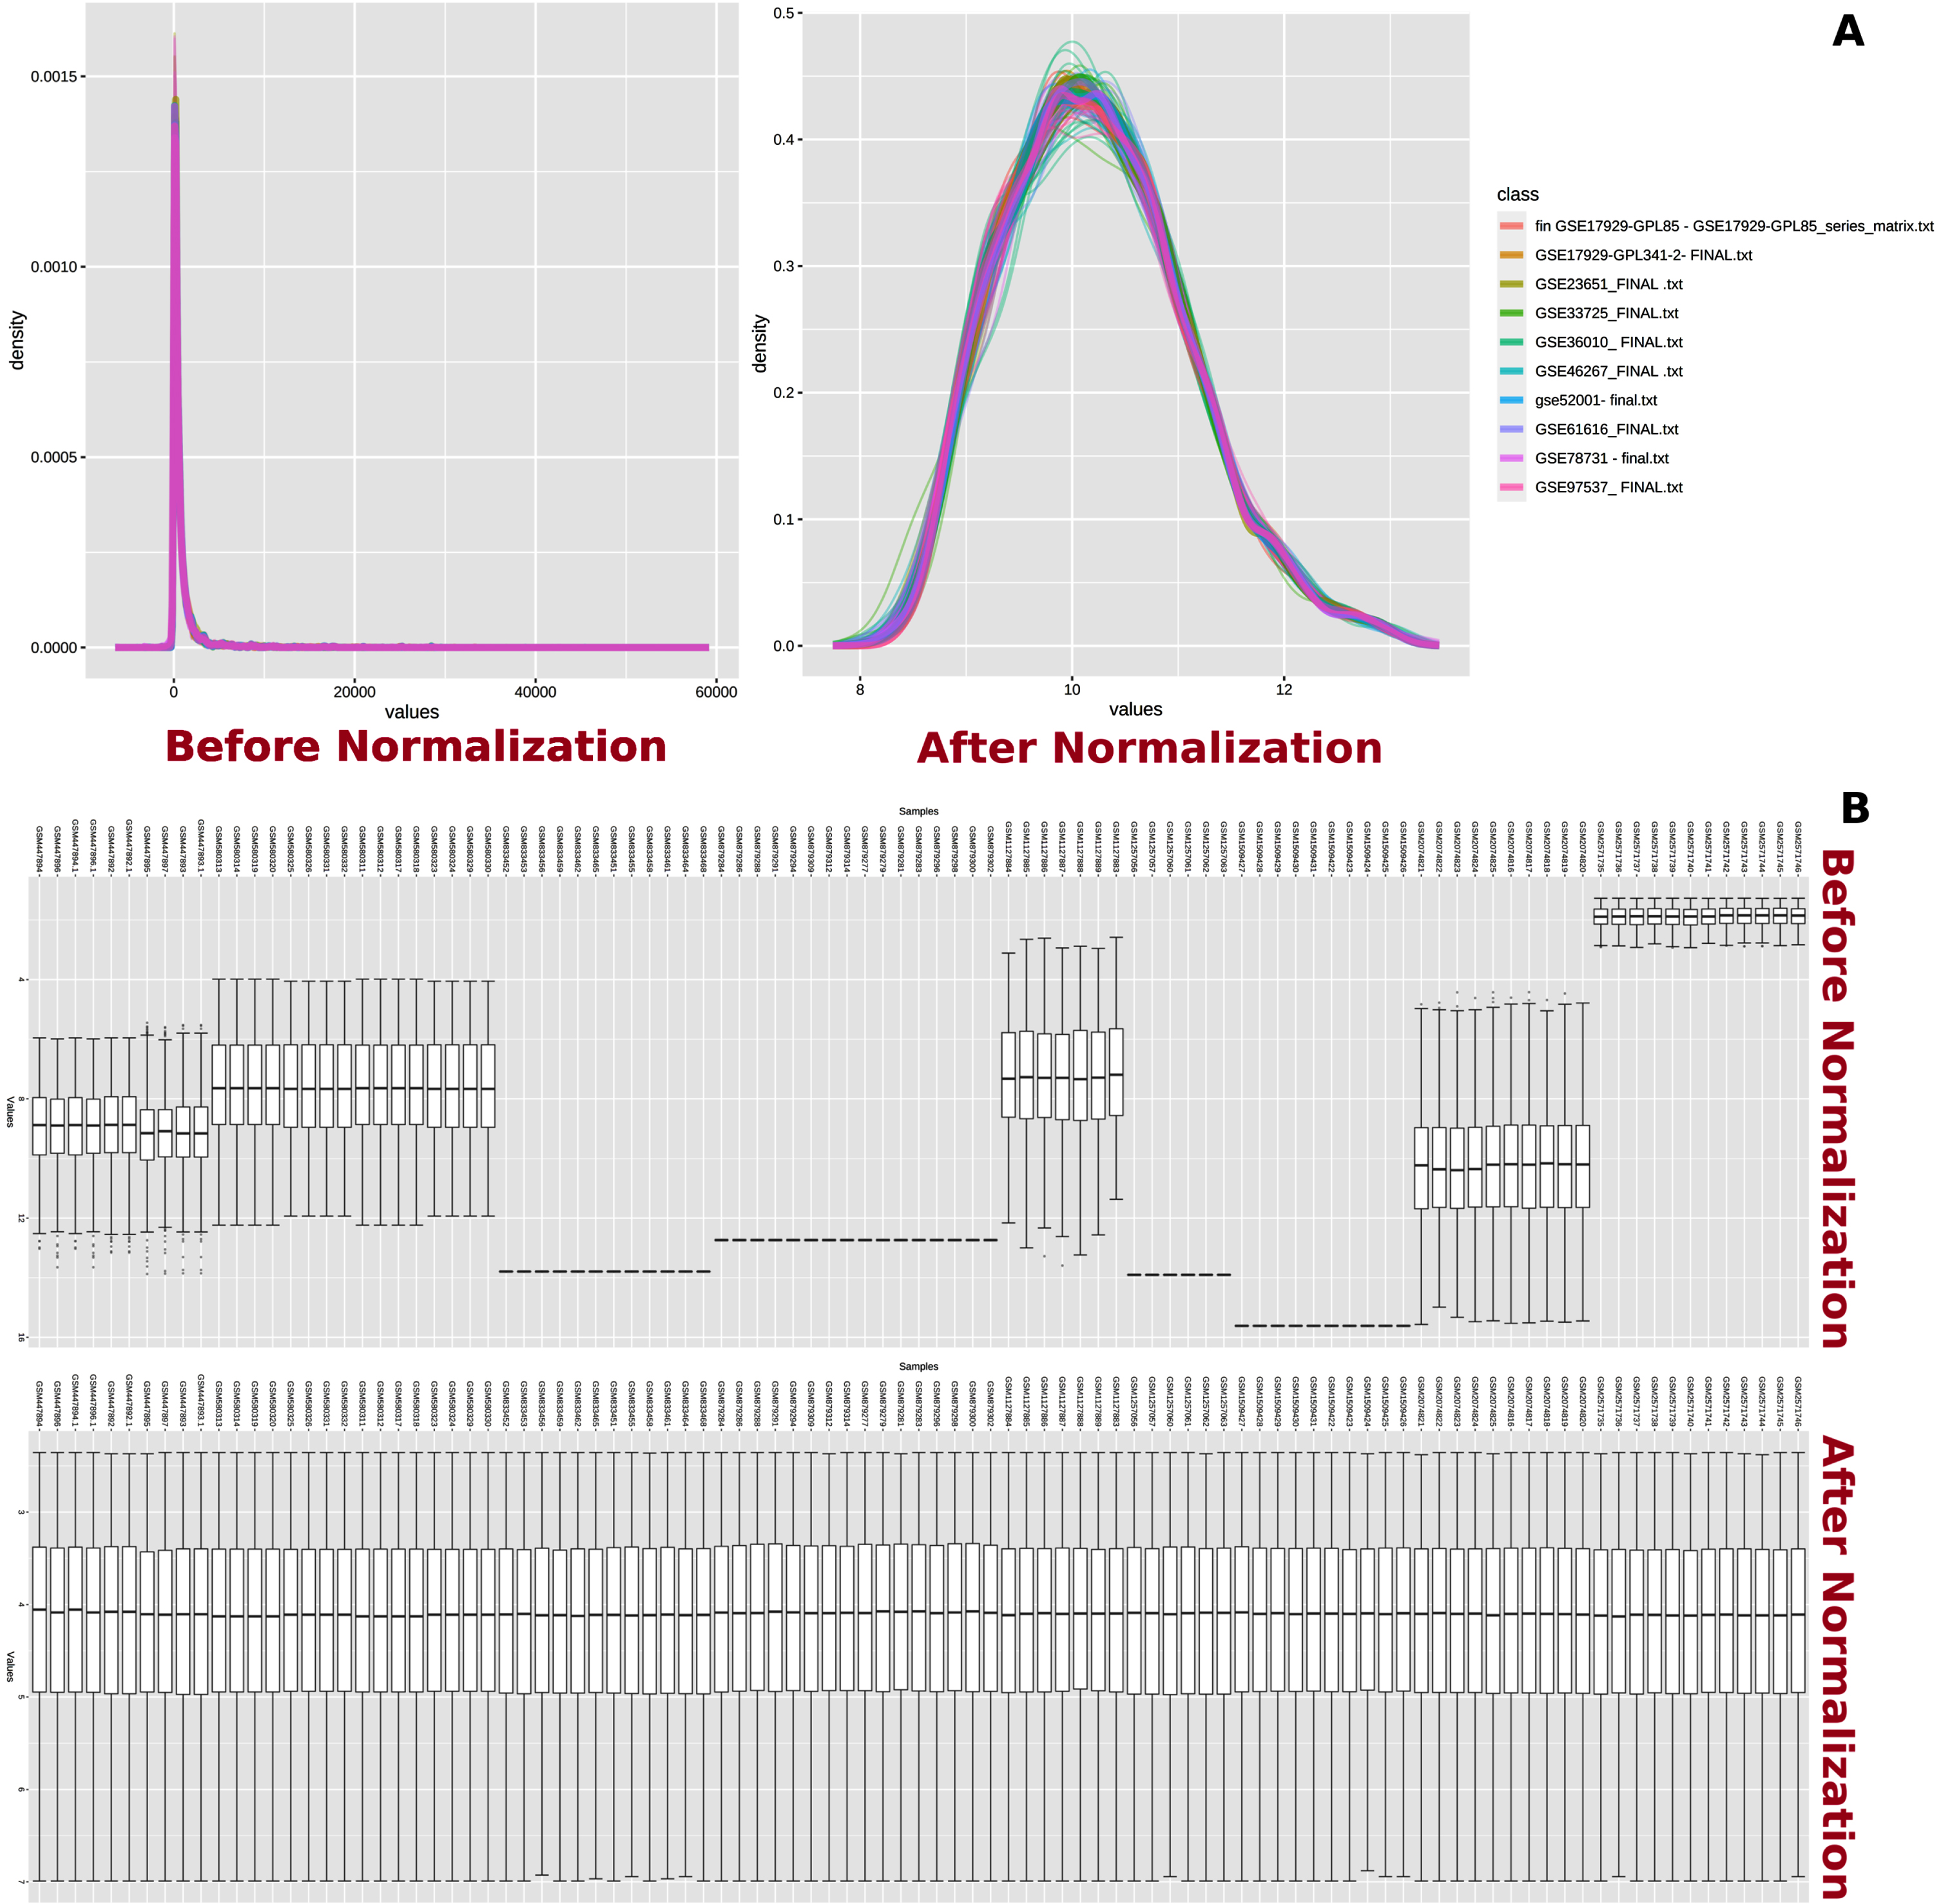
In network analysis, the experimental datasets were normalized by variance stabilizing normalization followed by quantile normalization to minimize the variations (Fig. 2) [21]. The normalized datasets were subjected to meta-analysis in order to identify the DEGs among MCAo and sham rat brain samples. The meta-analysis was carried out using Fisher’s method with a significance set at the p-value of 0.01 [22, 23]. The resulting output produced a ranked list of DEGs. This ranked gene list was further used for pathway enrichment analysis.
Fig. 2
Normalization of datasets. Normalization of transcriptome data. A) Total intensity distribution among microarray datasets before and after normalization is shown. B) Variation in intensity values from each sample before and after normalization is shown.
Pathway enrichment analysis of differentially expressed genes list
The ranked gene list containing DEGs, and the Gene Ontology (GO): BioProcess (BP) rat GMT file were uploaded to gene set enrichment analysis (GSEA) [24]. Further, the resulting GSEA ranked file was uploaded to the following software modules for various data analyses.
WebGestalt-based establishment of differentially expressed gene clusters
WEB-based GEne SeT AnaLysis Toolkit (WebGestalt) is an online-based enrichment analysis software, useful in analyzing clusters of hits in enriched metabolic and signaling pathways similar to the Kyoto Encyclopedia of Genes and Genomes (KEGG) [25]. The ranked file containing DEGs was uploaded to the WebGestalt software and multiple highly significant clusters of DEGs were generated to reveal their involvement in biological process related to neurogenesis.
Enrichment map in Cytoscape
Next, to explore the interactomics of DEGs among sham and MCAo groups, the GSEA ranked file was uploaded to the enrichment map application in Cytoscape. The resulting Q-value was adjusted to 0.01 and the edge cut-off was increased to 0.75. Further, the layout was adjusted to defined data and the resulting pathways were annotated. Nodes of interest were selected to observe the list of altered gene lists under the specific GO node.
Gene Ontology comparison analysis
The list of DEGs and the highest interacting proteins obtained from the Cytoscape analyses were then subjected to functional relationship parameters and Venn diagram assessments with previously available GO. The ontology libraries chosen for analyses were i) neurogenesis (GO:0022008), ii) neuroblast proliferation (GO:0007405), iii) neuronal migration (GO:0001764), iv) neuronal differentiation (GO:0030182), v) regulation of cell cycle (GO:0051726), and vi) neuroinflammatory response (GO:0150076).
Network analyst-based studies
For the interaction between DEGs and miRNAs, two kinds of analyses were carried out using the list of DEGs in the network analyst’s visual module. The transcription factor (TF)-miRNA interactome analysis revealed non-coding miRNA interaction with the important DEGs uploaded. Uploading the data to protein-protein interaction analysis helped in obtaining a string database-based interactome map [26].
Comparison assessment with human stroke data
For a brief comparison of DEGs in MCAo condition with the human situation with stroke, the GSE162955 dataset from NCBI Geo was considered, as the dataset contained ischemic stroke microarray data among 6 samples. Since, the dataset used Affymetrix Human Transcriptome Array 2.0, for efficient analysis, Transcriptome Analysis Console (TAC)-4.0 software was used to plot infarct hemisphere samples against healthy hemisphere samples with filtration criteria set at fold change value of 2, and p < 0.05 [27].
RESULTS
Alteration in the gene expression profiling in stroke brains
An overview of the meta-analysis from 97 samples from microarray datasets revealed that 939 genes were differentially expressed in the MCAo group compared to that of the sham control. The list of DEGs with their Combined Tstat scores are given in the Supplementary Material, where the lower CombinedTstat score corresponds to upregulation of the gene expression, and higher score corresponds to downregulated gene expression in MCAo animals. The study revealed that the expressions of 369 genes were found to be upregulated, while the downregulation of 570 genes was evident in the MCAo group with a minimum combined p-value of 5.1732E-6 (Fisher’s test, with p set at 1%). The genes like galectin 3 (LGALS3), translocator protein (TSPO), TIMP metallopeptidase inhibitor 1 (TIMP1), cluster of differentiation 14 (CD14), and heat shock protein family B (small) member 1 (HSPB1) were found to be significantly upregulated in the MCAo group than the sham group. In contrast, the phosphoinositide-3-kinase regulatory subunit 2 (PIK3R2) was identified as the most significantly downregulated gene followed by proprotein convertase subtilisin/kexin type 2 (PCSK2), beta-1,4-N-acetyl-galactosaminyl transferase 1 (B4GALNT1), C-X3-C motif chemokine ligand 1 (CX3CL1), and solute carrier family 6 member 1 (SLC6A1) in the MCAo group. The top 50 upregulated and top 50 downregulated genes in the MCAo group are listed in Tables 3 and 4 respectively. Further, subcellular localizations of DEGs responsible for the cell cycle parameters and various pathogenic events in MCAo condition have been identified using WebGestalt-basedanalyses.
Table 3
List of top 50 upregulated genes in MCAo brain identified through transcriptome meta-analysis
| Gene | Name | Entrez id | CombinedTstat |
| LGALS3 | galectin 3 | 83781 | –217.89 |
| TSPO | translocator protein | 24230 | –206.96 |
| TIMP1 | TIMP metallopeptidase inhibitor 1 | 116510 | –196.16 |
| CD14 | CD14 molecule Source:RGD Symbol;Acc:620588 | 60350 | –194.96 |
| HSPB1 | heat shock protein family B (small) member 1 | 24471 | –191.16 |
| GFAP | glial fibrillary acidic protein | In multiple Geneids | –187.73 |
| CD63 | Cd63 molecule | 29186 | –186.66 |
| C1QC | complement C1q C chain | 362634 | –181.31 |
| HMOX1 | heme oxygenase 1 | 24451 | –180.39 |
| RIPK3 | receptor-interacting serine-threonine kinase 3 | 246240 | –178.3 |
| CCL2 | C-C motif chemokine ligand 2 | 24770 | –172.5 |
| ARPC1B | actin related protein 2/3 complex, subunit 1B | 54227 | –168.72 |
| ATF3 | activating transcription factor 3 | 25389 | –168.66 |
| S100A4 | S100 calcium-binding protein A4 | In multiple Geneids | –168.12 |
| LITAF | lipopolysaccharide-induced TNF factor | In multiple Geneids | –165.64 |
| ANXA1 | annexin A1 | In multiple Geneids | –164.9 |
| HCK | HCK proto-oncogene, Src family tyrosine kinase | 25734 | –164.47 |
| TNFRSF1A | TNF receptor superfamily member 1A | 25625 | –163.26 |
| IFITM3 | interferon induced transmembrane protein 3 | 361673 | –162.77 |
| ICAM1 | intercellular adhesion molecule 1 | 25464 | –160.78 |
| PTPN6 | protein tyrosine phosphatase, non-receptor type 6 | 116689 | –160.7 |
| C1S | complement C1s | 192262 | –159.03 |
| VIM | vimentin | 81818 | –158.62 |
| TBXAS1 | thromboxane A synthase 1 | 24886 | –157.81 |
| GADD45A | growth arrest and DNA-damage-inducible, alpha | 25112 | –157.48 |
| TGFB1 | transforming growth factor, beta 1 | 59086 | –155.89 |
| PSMB9 | proteasome 20S subunit beta 9 | 24967 | –153.44 |
| CAPG | capping actin protein, gelsolin like | 297339 | –153.19 |
| PLA2G4A | phospholipase A2 group IVA | In multiple Geneids | –152.19 |
| IER3 | immediate early response 3 | 294235 | –149.84 |
| CD48 | Cd48 molecule | 245962 | –149.09 |
| GRN | granulin precursor | 29143 | –148.19 |
| CASP1 | caspase 1 | 25166 | –147.52 |
| LY86 | lymphocyte antigen 86 | 291359 | –146.6 |
| CTSL | cathepsin L | 25697 | –146.41 |
| MYC | MYC proto-oncogene, bHLH transcription factor | 24577 | –146.14 |
| STAT3 | signal transducer and activator of transcription 3 | 25125 | –144.69 |
| PSME2 | proteasome activator subunit 2 | 29614 | –144.02 |
| ANXA3 | annexin A3 | 25291 | –140.37 |
| MGP | matrix Gla protein | 25333 | –140.35 |
| PCNA | proliferating cell nuclear antigen | 25737 | –138.9 |
| DYNLT1 | dynein light chain Tctex-type 1 | 83462 | –137.9 |
| IL18 | interleukin 18 | 29197 | –137.5 |
| P2RY6 | pyrimidinergic receptor P2Y6 | 117264 | –136.78 |
| CTSC | cathepsin C | 25423 | –136.49 |
| LGALS3BP | galectin 3 binding protein | 245955 | –132.14 |
| FGR | FGR proto-oncogene, Src family tyrosine kinase | 79113 | –130.06 |
| P4HB | prolyl 4-hydroxylase subunit beta | 25506 | –129.66 |
| RBP1 | retinol binding protein 1 | 25056 | –129.14 |
| CTSB | cathepsin B | 64529 | –128.67 |
Table 4
List of top 50 downregulated genes in MCAo brain identified through transcriptome meta-analysis
| Gene | Name | Entrez id | CombinedTstat |
| PIK3R2 | phosphoinositide-3-kinase regulatory subunit 2 | 29741 | 127.2 |
| PCSK2 | proprotein convertase subtilisin/kexin type 2 | 25121 | 121.37 |
| B4GALNT1 | beta-1,4-N-acetyl-galactosaminyl transferase 1 | 64828 | 121.04 |
| CX3CL1 | C-X3-C motif chemokine ligand 1 | 89808 | 120.76 |
| SLC6A1 | solute carrier family 6 member 1 | 79212 | 118.59 |
| ATP2B2 | ATPase plasma membrane Ca2+ transporting 2 | 24215 | 118.25 |
| GRIN1 | glutamate ionotropic receptor NMDA type subunit 1 | 24408 | 117.46 |
| THY1 | Thy-1 cell surface antigen | 24832 | 117.15 |
| KCNV1 | potassium voltage-gated channel modifier subfamily V member 1 | 60326 | 116.7 |
| SCN1B | sodium voltage-gated channel beta subunit 1 | 29686 | 115.96 |
| NEU2 | neuraminidase 2 | 29204 | 115.39 |
| LIN7B | lin-7 homolog B, crumbs cell polarity complex component | 60377 | 114.26 |
| NPY5R | neuropeptide Y receptor Y5 | 25340 | 113.95 |
| ST3GAL2 | ST3 beta-galactoside alpha-2,3-sialyltransferase 2 | 64442 | 113.65 |
| VSNL1 | visinin-like 1 | 24877 | 113.4 |
| ATP1A1 | ATPase Na+/K+ transporting subunit alpha 1 | 24211 | 112.52 |
| CAMK2N1 | calcium/calmodulin-dependent protein kinase II inhibitor 1 | 287005 | 111.85 |
| CLEC11A | C-type lectin domain containing 11A | 29313 | 111.07 |
| PTK2B | protein tyrosine kinase 2 beta | 50646 | 111.03 |
| PDE1B | phosphodiesterase 1B | 29691 | 110.69 |
| DLX5 | distal-less homeobox 5 | 25431 | 110.59 |
| B3GAT1 | beta-1,3-glucuronyltransferase 1 | 117108 | 110.16 |
| PLCB1 | phospholipase C beta 1 | 24654 | 108.99 |
| VAMP1 | vesicle-associated membrane protein 1 | 25624 | 108.88 |
| CHRM4 | cholinergic receptor, muscarinic 4 | 25111 | 108.53 |
| DHCR7 | 7-dehydrocholesterol reductase | 64191 | 107.78 |
| GRIA3 | glutamate ionotropic receptor AMPA type subunit 3 | 29628 | 106.39 |
| SHISA4 | shisa family member 4 | 360848 | 106.14 |
| PDE2A | phosphodiesterase 2A | 81743 | 105.91 |
| PRKAR2B | protein kinase cAMP-dependent type II regulatory subunit beta | 24679 | 105.86 |
| SLC4A3 | solute carrier family 4 member 3 | 24781 | 105.47 |
| NRGN | neurogranin | 64356 | 105.07 |
| DBN1 | drebrin 1 | 81653 | 104.96 |
| NPTN | neuroplastin | 56064 | 104.93 |
| MCF2L | MCF.2 cell line derived transforming sequence-like | 117020 | 104.78 |
| GRIN2A | glutamate ionotropic receptor NMDA type subunit 2A | 24409 | 103.02 |
| KCNJ4 | potassium inwardly-rectifying channel, subfamily J, member 4 | 116649 | 102.97 |
| KALRN | kalirin, RhoGEF kinase | 84009 | 102.46 |
| SYT2 | synaptotagmin 2 | 24805 | 102.26 |
| GFRA2 | GDNF family receptor alpha 2 | In multiple Geneids | 102.18 |
| OPCML | opioid binding protein/cell adhesion molecule-like | 116597 | 101.75 |
| KCNAB2 | potassium voltage-gated channel subfamily A regulatory beta subunit 2 | 29738 | 101.74 |
| FGF14 | fibroblast growth factor 14 | 63851 | 100.31 |
| NEFM | neurofilament medium | 24588 | 99.746 |
| TRIM54 | tripartite motif-containing 54 | 362708 | 99.65 |
| STXBP1 | syntaxin binding protein 1 | 25558 | 99.618 |
| AKAP5 | A-kinase anchoring protein 5 | 171026 | 98.686 |
| ATP2A2 | ATPase sarcoplasmic/endoplasmic reticulum Ca2+ transporting 2 | 29693 | 98.431 |
| NR4A1 | nuclear receptor subfamily 4, group A, member 1 | 79240 | 97.132 |
| RAB3A | RAB3A, member RAS oncogene family | 25531 | 96.975 |
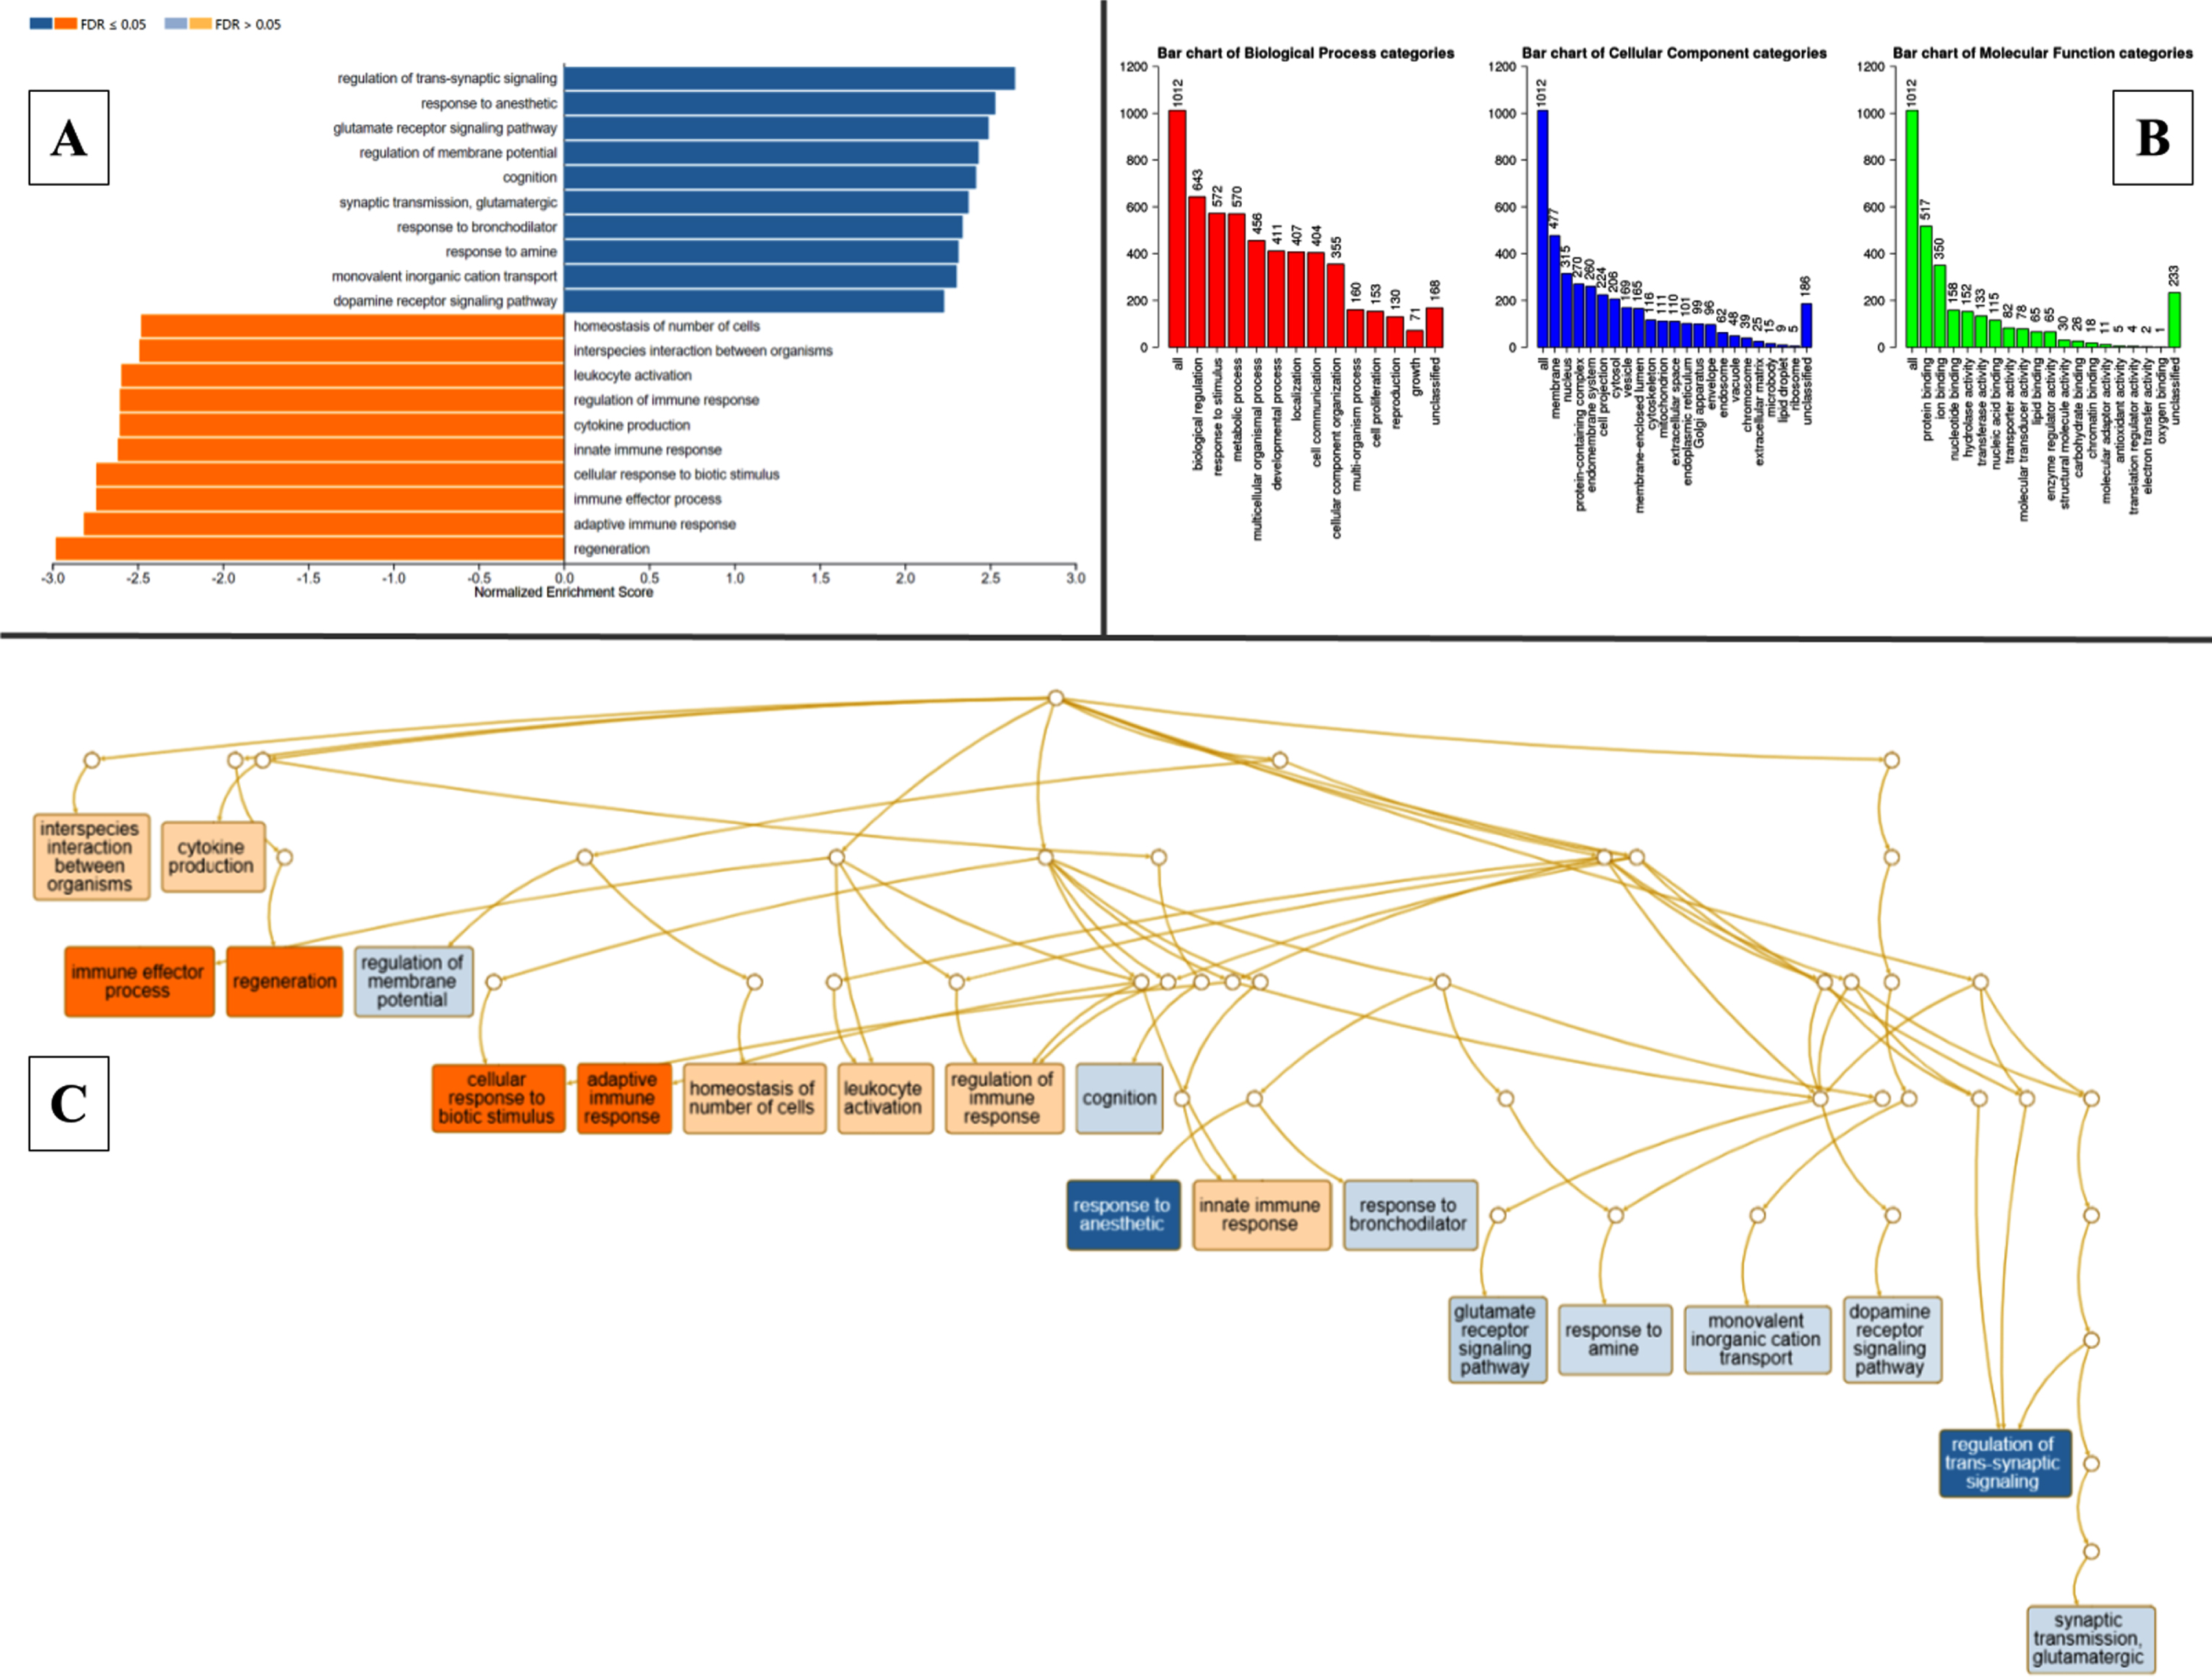
WebGestalt-based analysis revealed dysregulations in regeneration nodes in MCAo condition
The DEGs were classified into specific readable clusters based on their biological processes, cellular components, and molecular functions in pathogenic MCAo conditions using WebGestalt based on GO and enrichment analysis. The normalized enrichment scores against each bioprocess were denoted in Fig. 3A. GO revealed that 50% of the DEGs were involved in various biological regulations, while less than 15% of the DEGs were specifically identified to be involved in cell proliferation. Most of these DEGs were found to be predominantly localized in the membrane, and nucleus, and fewer in extracellular matrix, and ribosomes. In the MCAo group, the clusters of DEG with molecular functions related to protein binding were more enriched when compared to oxygen binding and other interactions were least enriched (Fig. 3B). The directed acyclic graph was also constructed to visualize the interaction of enriched gene ontology as schematically depicted in Fig. 3C. The KEGG-based molecular function analysis indicated significant upregulation in nodes related to regeneration, and the immune effector process, while genes involved in the regulation of trans-synaptic signaling and glutamate receptor signaling pathway among others were altered in MCAo stroke brain (Fig. 3B). Elucidation of the node with genes with reference to regeneration revealed that genes that are involved in intrinsic and extrinsic regulation of neurogenesis such as glial fibrillary acidic protein (GFAP), transforming growth factor-beta 1 (TGF-B1), proliferating cell nuclear antigen (PCNA), and jagged1 (JAG1) were significantly upregulated in the brains of experimental subjects with MCAo stroke.
Fig. 3
Gene ontology classification, pathway enrichment analysis- clusters of highly significant pathways based on KEGG database, acyclic graph of enriched processes based on GO biological processes. WebGestalt outputs. A) Pathway enrichment analysis of DEGs between MCAo and Sham animals, resulting in multiple clusters of significantly altered pathways based on KEGG database. B) Gene ontology classification. Each bar represents an ontology category and the heigh signifies the number of DEGs observed under each category. C) Branching graph depicts functional interaction between various GO categories, where the steel blue colored categories are positively related while the deep orange-colored categories are negatively related.
Cytoscape-based enrichment mapping and GO comparison revealed prominent dysregulation in the expression of neurogenic makers and regulators in MCAo condition
Cytoscape enrichment map analysis of the GSEA enriched gene list revealed abnormalities in various signal transduction pathways, in which prominent dysregulation of molecular pathways of the neurogenic process has been highly evident as it passed a q value of 0.01 (Fig. 4). The data indicated the elevated expressions of the genes that are detrimental to the regulation of neurogenesis in the MCAo group. The DEGs under the regeneration node are displayed in Table 5 along with the fold-change score (CombinedTstat), where lower the value corresponds to higher the expression in the MCAo group. The majority of the shortlisted DEGs are found to play a significant role in the regulation of adult neurogenesis.
Fig. 4
Cytoscape enrichment data analysis. Enrichment map from Cytoscape. The graphic depicts interaction between various enriched nodes (dots). Lines connecting the nodes are called edges. Blue nodes depict more enrichment in the MCAo group while the red nodes depict more enrichment in the Sham group.
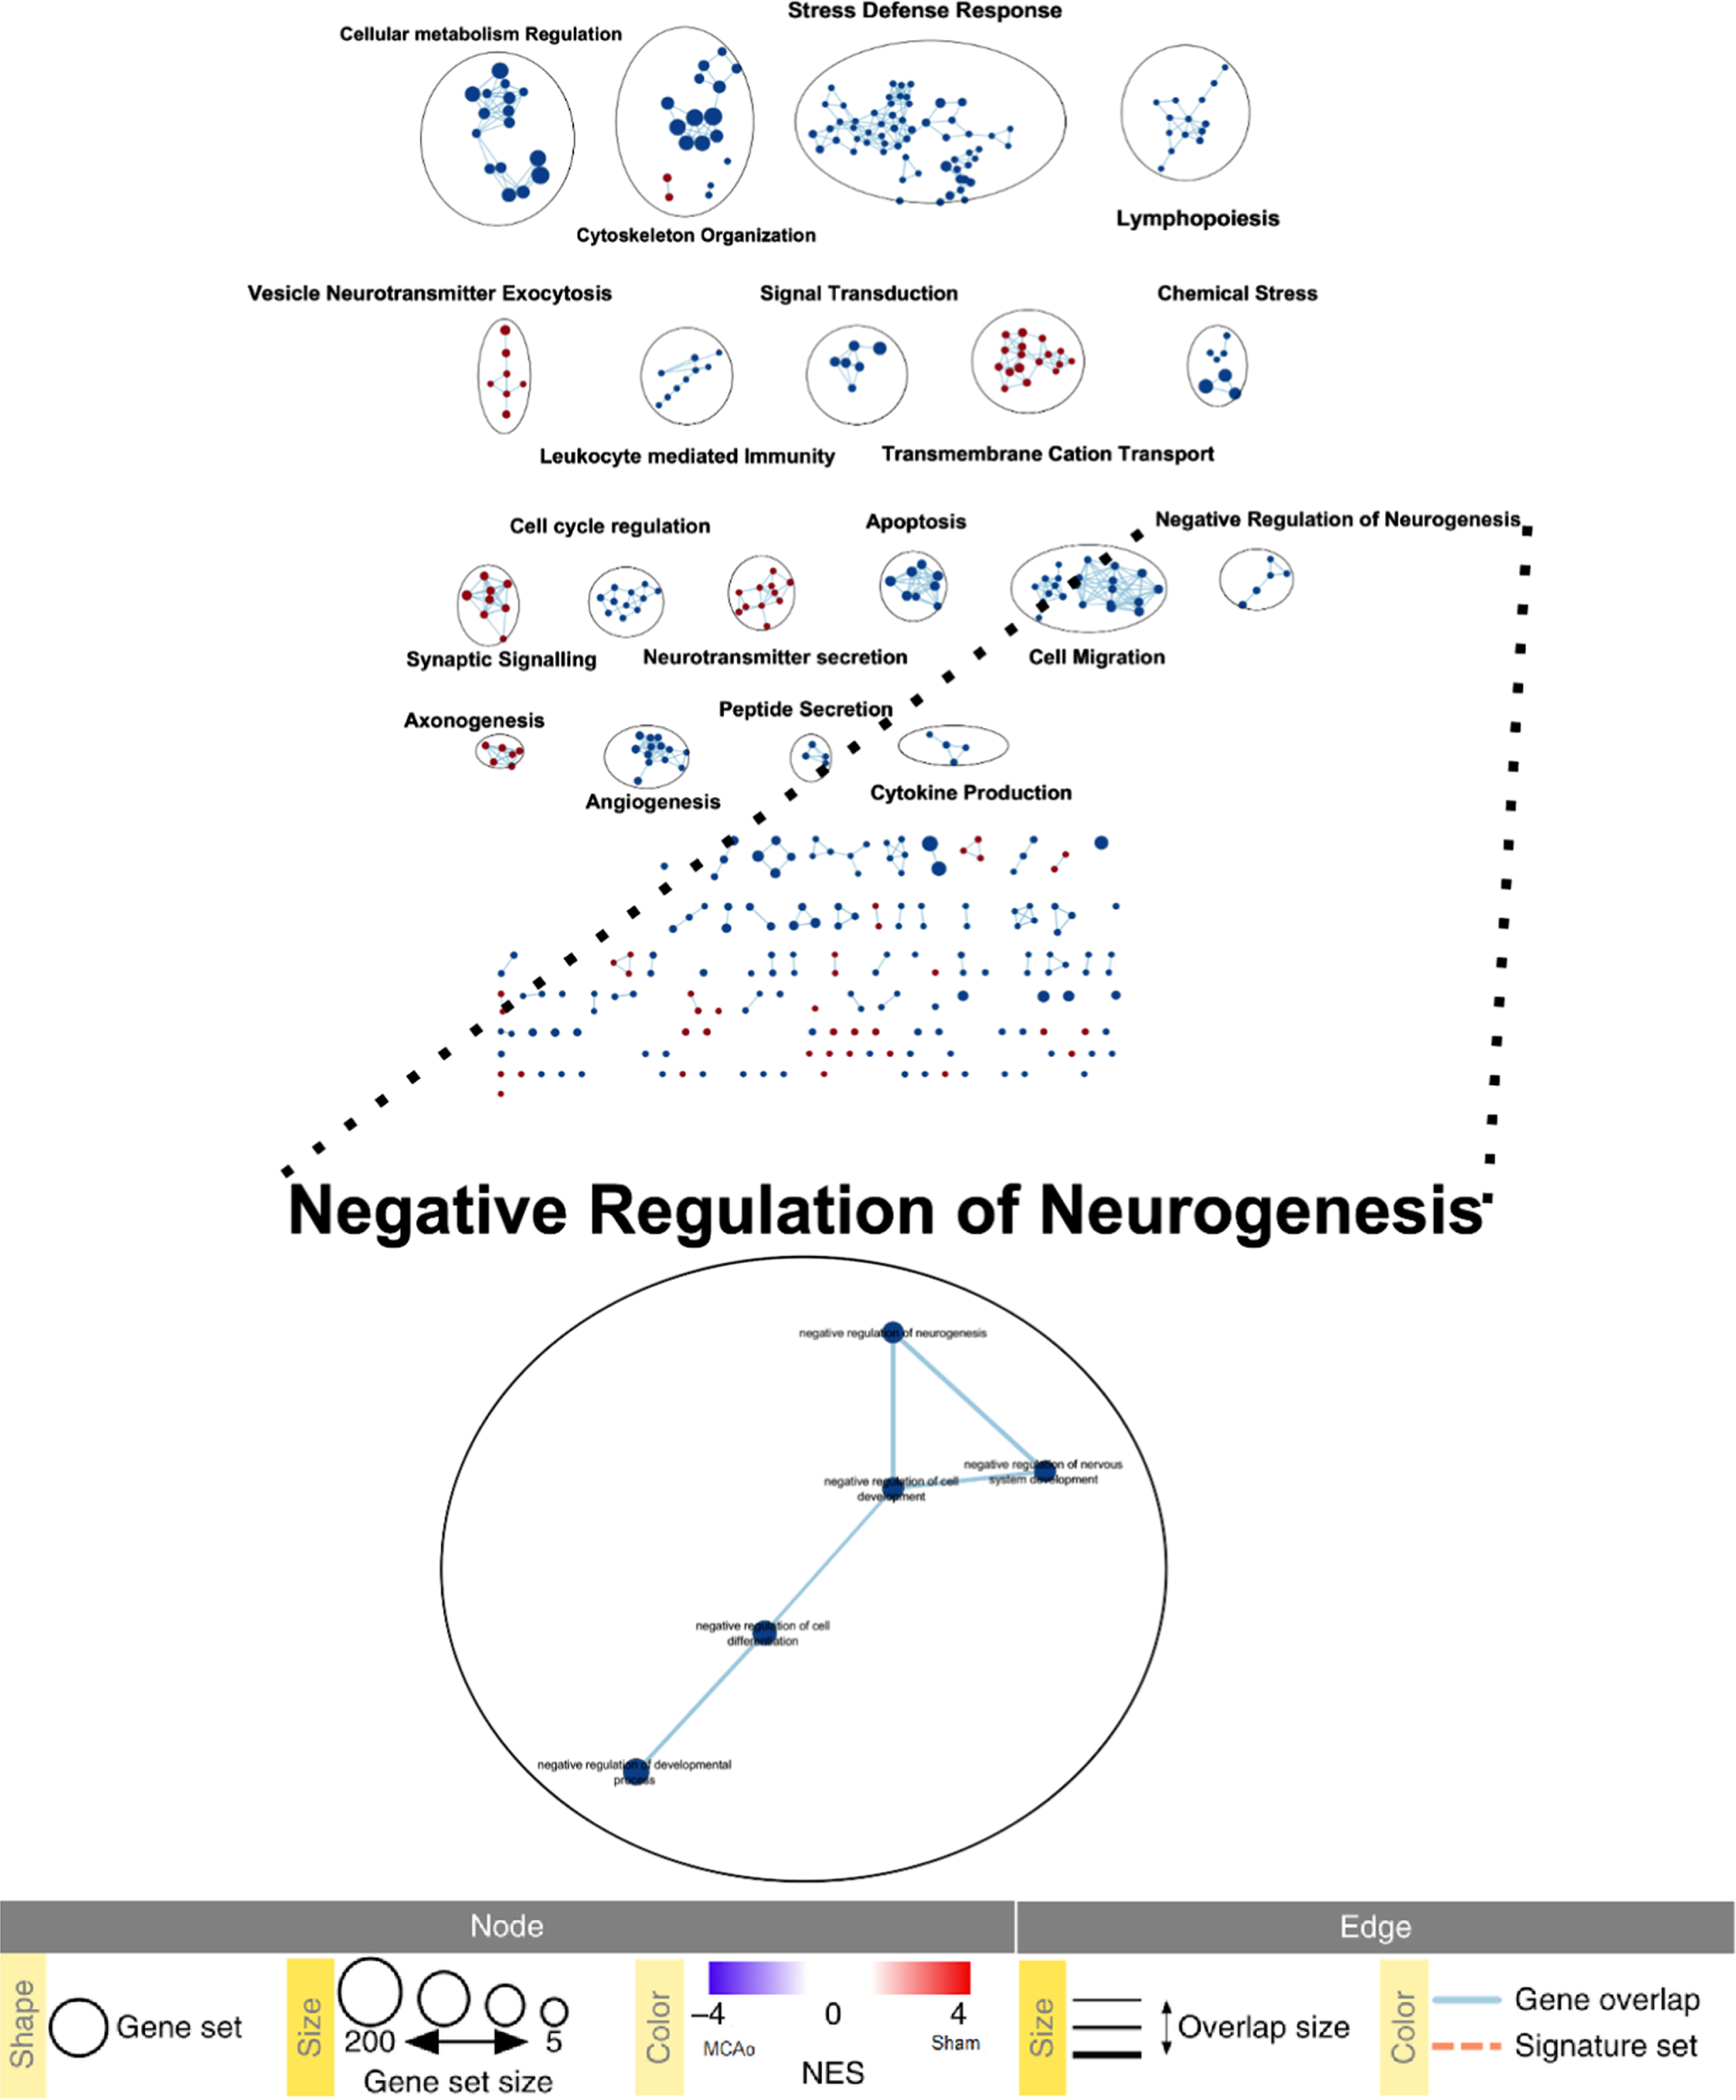
Table 5
Majorly altered genes related to neurogenesis obtained from Cytoscape enrichment map
| Gene | Combined Tstat |
| THY1 | 117.15 |
| NR1D1 | 95.17 |
| CDK5 | 82.8 |
| STX1B | 76.62 |
| NOG | 74.74 |
| CNTN4 | 70.94 |
| PTN | 65.16 |
| EPHA7 | 63.97 |
| CNTN2 | 60.96 |
| GDF11 | 57.76 |
| GNRH1 | 39.72 |
| PAFAH1B1 | –38.55 |
| SYT4 | –39.08 |
| FKBP4 | –44.99 |
| CALR | –63.3 |
| IDH2 | –67.54 |
| CD24 | –81.23 |
| JAG1 | –82.33 |
| PMP22 | –83.38 |
| ID1 | –86.77 |
| ARF6 | –87.13 |
| CD38 | –95.75 |
| COL3A1 | –102.35 |
| LGALS1 | –120.2 |
| DYNLT1 | –137.9 |
| STAT3 | –144.69 |
| TGFB1 | –155.89 |
| VIM | –158.62 |
| GFAP | –187.73 |
| TSPO | –206.96 |
Validation of alteration in the expression of genes related to neurogenesis in MCAo condition by GO comparison
Venn diagram analysis of 939 DEG with appropriate GO was carried out and the outcome the results were denoted in Table 6. The DEG list overlapping with GO: Neurogenesis revealed 166 altered expressions of genes related to neurogenic processes. With reference to GO: neuroblast proliferation, 6 genes such as CX3CL1, TGFB1, and pleiotrophin (PTN) were found to be significantly altered in the MCAo condition. To note, the expression of TGF-B1 (CombinedTstat = –155.89) is significantly upregulated, while the expression of PTN (CombinedTstat = 65.16) appears to be significantly downregulated in the MCAo condition. Further, 17 DEGs were found to be associated with the migration of neuroblasts (GO: Neuron migration) that includes phospholipase A2 activating protein (PLAA), gonadotropin-releasing hormone 1 (GNRH1), and signal transducer and activator of transcription-3 (STAT3). Meta-analysis revealed significant downregulation of GNRH1 (CombinedTstat = 39.72) and a significant upregulation of STAT3 (CombinedTstat = –144.69), both attributed to improvement in the chances of neuroblast migration in MCAo condition. Next, expressions of 130 genes related to GO: neuron differentiation were also found to be altered in the MCAo condition. The expression of Neuronal differentiation-1 (Neurod1) (CombinedTstat = 78.801), Fasciculation and elongation protein zeta-1 (FEZ1) (CombinedTstat = 78.226), suppressor of cytokine signaling-2 (SOCS2) (CombinedTstat = 75.286), Contactin-4 (CNTN4) (CombinedTstat = 58.293), Growth differentiation factor-11 (GDF11) (CombinedTstat = 57.759), Contactin-2 (CNTN2) (CombinedTstat = 53.043), Mechanistic target of rapamycin Kinase (mTOR) (CombinedTstat = 43.593), SH3 Domain Containing GRB2 Like 3, Endophilin A3 (SH3GL3) (CombinedTstat = 43.274), Microtubule Associated Protein-1B (MAP1B) (CombinedTstat = 37.003) are downregulated in MCAo condition. In contrast, the expressions of Calreticulin (CALR) (CombinedTstat = –71.614), Jagged-1 (JAG1) (CombinedTstat = –68.159), Bone morphogenetic protein-2 (BMP2) (CombinedTstat = –57.386) and Nerve growth factor receptor (NGFR) (CombinedTstat = –49.317) were noticed to be increased (Table 6).
Table 6
Gene ontology comparison analysis
| Gene Ontology compared with DEGs List | No. of. Overlapping genes | Overlapping Gene List | |
| Downregulated Genes | Upregulated Genes | ||
| GO:Neurogenesis | 166 | EDN1 PAK1 NR4A2 ACSL3 KCNA1 HTR7 ALCAM RAB3A PTPN5 CNTN2 LEMD2 RGS14 NGFR ATP2B2 GNRH1 THY1 EPHA7 KALRN NEFL AGER MAP6 MME GRIN2A EEF2K MAPK8IP2 WEE1 PRKCZ PLD2 NTRK2 TBCE PPP3R1 CNTN1 TTC8 FEZ1 SCN1B STAR AFDN GRID2 UNC13A GDF11 BHLHE40 PLPP3 GABRA5 STXBP1 DCHS1 ADNP SH3GL2 APC GAS6 CTTN NR1D1 ACSL4 UGCG PTN PTK2B CAMK1 COQ7 SYT2 CNTN4 YWHAE DCLK1 NEFM ADORA2A EHMT2 MAL NLGN2 CNR1 MTOR EGR2 SH3GL3 VLDLR LZTS1 B4GALT6 GRK2 VTN NEUROD1 PER2 NAPA PEX2 MGLL SERPINE2 SYT3 GRIN1 MYCBP2 ADGRL3 CX3CL1 DLX5 NEXN DBN1 ARL3 SLC12A5 SOCS | MMP2 HSPB1 CSPG4 ARF6 SERPINF1 EED CD38 ID1 PICALM FN1 KLF4 PRRX1 ECE1 ITGB1 SGK1 BMP2 TGFB1 MYC NR2F2 NAP1L1 ADM PLP1 PMP22 SYT4 PDLIM5 TGFB2 RAC1 ANXA1 FABP7 PAFAH1B1 LGALS1 CSF1 TWF1 ARF4 IDH2 JAG1 RUNX1 SDC4 VIM CALR STAT3 P2RY2 MAN2A1 CDC20 PLAA CCL2 LAMC1 CASP3 COL3A1 DAB2 UGDH TSPO GRN RAB13 GFAP IFNGR1 IL33 RAB11A ENPP1 FZD1 RAB8A |
| GO:Neuroblast Proliferation | 6 | PTN KCNA1 CX3CL1 | ITGB1 PAFAH1B1 TGFB1 |
| GO: Neuron Migration | 17 | PEX2 NR4A2 NTRK2 YWHAE DCLK1 ADGRL3 CNTN2 GNRH1 CDK5 GAS6 NDN | COL3A1 RAC1 PAFAH1B1 STAT3 PLAA NR2F2 |
| GO: Neuron differentiation | 130 | EDN1 PAK1 NR4A2 ACSL3 HTR7 ALCAM RAB3A PTPN5 CNTN2 NGFR ATP2B2 THY1 EPHA7 KALRN NEFL AGER MAP6 EEF2K MAPK8IP2 WEE1 PRKCZ PLD2 NTRK2 TBCE CNTN1 TTC8 FEZ1 SCN1B AFDN GRID2 UNC13A GDF11 GABRA5 STXBP1 ADNP SH3GL2 APC CTTN ACSL4 UGCG PTN PTK2B CAMK1 SYT2 CNTN4 DCLK1 NEFM ADORA2A EHMT2 NLGN2 CNR1 MTOR EGR2 SH3GL3 VLDLR LZTS1 B4GALT6 NEUROD1 NAPA MGLL SERPINE2 SYT3 GRIN1 MYCBP2 CX3CL1 DLX5 NEXN DBN1 ARL3 SLC12A5 SOCS2 MAP1B AKAP5 ARC CDK5 NOG AKT1 NPTN CNP KIF3C DHX36 PRKCA NPTXR NDN | MMP2 HSPB1 CSPG4 TGFB2 RAC1 ARF6 SERPINF1 CD38 PAFAH1B1 LGALS1 TWF1 ID1 ARF4 JAG1 PICALM RUNX1 FN1 KLF4 PRRX1 ECE1 ITGB1 SGK1 SDC4 CALR VIM STAT3 P2RY2 BMP2 CDC20 PLAA LAMC1 CASP3 DAB2 UGDH GRN RAB13 GFAP RAB11A ENPP1 ADM FZD1 PLP1 PMP22 SYT4 PDLIM5 RAB8A |
| GO: Cell Cycle Regulation | 76 | EDN1 CCNE1 YWHAE INO80E INS1 FNTB CCNDBP1 RBL2 PLPP2 PER2 HPGD CALM2 PLCB1 IGF2 APBB3 NR4A1 PPP2R1A BCL2L1 DPF1 BMYC TGFA NPR2 CHMP1A NPPC PPP2CA KIF13A CDK5 NCAPH2 AKT1 CIRBP INHA APC PEBP1 PRKCA | TGFB2 ANXA1 GRK5 PLK1 BTG1 PAFAH1B1 FOXM1 CDK1 RPA2 SND1 SMC4 STAT5A KLF4 NME6 IER3 ITGB1 SGK1 CALR STAT3 BMP2 CDK4 PIM3 CDC20 TGFB1 MYC NR2F2 CASP3 GADD45A SMARCD2 MSX1 FEN1 H2AX EIF4EBP1 PTPN6 RPA3 DLGAP5 CDKN1A RAB11A PSME2 CAST DDX3X MYBBP1A |
| GO: Neuroinflammatory response | 11 | CX3CL1 ADORA2A AGER ADCY8 NR1D1 | IFNGR1 IL33 ITGB1 CASP1 GRN CTSC |
Interaction among neurogenic regulators and with miRNAs in MCAo condition
TF-miRNA interactome analysis revealed that TFs like Neurod1, Vimentin (Vim), and Aquaporin-4 were found to be interacting with different miRNAs (Fig. 5). These TFs have been known to be the crucial regulators of adult neurogenesis [28–30]. TF-miRNA interactome analysis revealed that transgelin (Tagln) (Expression: –91.4), Vim (Expression: –158.62), Visinin-like protein-1 (Vsnl1) (Expression: 113.4), Integrin subunit beta-1 (Itgb1) (Expression: –109.38), Neurod1 (Expression: 86.53) were highest interacting transcription factors. Besides, rno-mir-124–3p, rno-mir-290, and rno-mir-29b-3p were found to be the highest interacting miRNAs in the MCAo condition. PPI analysis was also carried out to establish the relationship among the DEGs. The “zero-order” PPI network contained 163 nodes with 255 interacting edges among them. AKT serine/threonine kinase-1 (Akt1) with betweenness centrality = 5808.71, degree = 22, and Protein Tyrosine Kinase 2 Beta (Ptk2b) with betweenness centrality = 3865.3, degree = 3, were found to be the most highly interacting node in the MCAo stroke brain. The top 10 interacting nodes are shown in Table 7. Around 35 interacting genes related to neurogenesis were identified by comparing the nodes with GO: Neurogenesis (GO:0022008)(Table 8).
Fig. 5
TF-miRNA interactome graph. The diagram represents the interaction between miRNA and transcription factors of DEGs where the nearest represent those with higher interaction score.
Table 7
Top 10 interacting nodes in PPI analysis
| Label | Degree | Betweenness | Expression (Combined Tstat) |
| Akt1 | 22 | 5808.71 | 54.118 |
| Cdk1 | 11 | 1780.5 | –106.67 |
| Pcna | 10 | 896.87 | –138.9 |
| Nfkb1 | 9 | 1095.09 | –111.02 |
| Pik3r2 | 8 | 2668.38 | 127.2 |
| Gna11 | 8 | 1679.93 | 92.205 |
| Stat3 | 8 | 1270.92 | –144.69 |
| Syk | 8 | 504.98 | –83.095 |
| Actn2 | 7 | 3294 | 84.253 |
| Hck | 7 | 3016.68 | –164.47 |
Table 8
Interacting proteins related to GO: Neurogenesis
| S.No | Label | Degree | Betweenness | Expression (Combined Tstat) |
| 1 | Akt1 | 22 | 5808.71 | 54.118 |
| 2 | Stat3 | 8 | 1270.92 | –144.69 |
| 3 | Mtor | 7 | 1183.27 | 49.327 |
| 4 | Casp3 | 6 | 1507.09 | –83.013 |
| 5 | Myc | 6 | 1086.18 | –146.14 |
| 6 | Grin2a | 5 | 3768 | 103.02 |
| 7 | Itgb1 | 5 | 2510 | –109.38 |
| 8 | Calr | 5 | 1398.5 | –63.295 |
| 9 | Tgfb1 | 5 | 502.61 | –155.89 |
| 10 | Ywhae | 4 | 1146.1 | 43.157 |
| 11 | Ngfr | 4 | 448.79 | 42.502 |
| 12 | Klf4 | 4 | 444.21 | –58.029 |
| 13 | Grin1 | 4 | 16 | 117.46 |
| 14 | Ptk2b | 3 | 3865.3 | 111.03 |
| 15 | Kalrn | 3 | 593.51 | 102.46 |
| 16 | Rab11a | 3 | 237.59 | –70.132 |
| 17 | Egr2 | 3 | 236.47 | 69.087 |
| 18 | Arf6 | 3 | 155.84 | –87.126 |
| 19 | Col3a1 | 2 | 819.5 | –102.35 |
| 20 | Rab8a | 2 | 799.01 | –54.952 |
| 21 | Lamc1 | 2 | 161 | –102.14 |
| 22 | Adm | 2 | 161 | –116.72 |
| 23 | Hspb1 | 2 | 161 | –191.16 |
| 24 | Pak1 | 2 | 29.21 | 94.689 |
| 25 | Tgfb2 | 2 | 0.5 | –41.91 |
| 26 | Pld2 | 2 | 0 | 42.035 |
| 27 | Cttn | 1 | 0 | 42.753 |
| 28 | Ifngr1 | 1 | 0 | –119.15 |
| 29 | Nr4a2 | 1 | 0 | 50.835 |
| 30 | Rab3a | 1 | 0 | 96.975 |
| 31 | Prkcz | 1 | 0 | 59.732 |
| 32 | Nr1d1 | 1 | 0 | 95.173 |
| 33 | Csf1 | 1 | 0 | –71.804 |
| 34 | Vim | 1 | 0 | –158.62 |
| 35 | Wee1 | 1 | 0 | 58.245 |
The expression pattern of the key genes involved in the neurogenic process in MCAo are nearly similar to human stroke situations
TAC 4.0 based analysis of the GSE162955 data revealed that a significant number of genes were differentially expressed in the brain samples containing infarct zones. The resulting DEGs list was used to compare with the list of the Neurogenic genes obtained from the MCAo-based study. Overlapping genes along with their altered expressions in humans were reported in Table 9. The key DEGs responsible for the aberrant neurogenic process in MCAo were found to be similar to the human stroke situation. For example; the expression pattern of GFAP. TGFB1, STAT3, and JAG1 which are crucial for adult neurogenesis appear to be similarly altered among MCAo models and human situations with cerebral stroke (Table 9).
Table 9
Comparison of MCAo rat DEG list with Human stroke DEG list
| Gene | Status in MCAo Rats | Status in Stroke affected Human |
| THY1 | Downregulated | Downregulated |
| NR1D1 | Downregulated | Downregulated |
| CDK5 | Downregulated | Downregulated |
| STX1B | Downregulated | Downregulated |
| NOG | Downregulated | Not DEG |
| CNTN4 | Downregulated | Downregulated |
| PTN | Downregulated | Not DEG |
| EPHA7 | Downregulated | Not DEG |
| CNTN2 | Downregulated | Not DEG |
| GDF11 | Downregulated | Not DEG |
| GNRH1 | Downregulated | Not DEG |
| PAFAH1B1 | Upregulated | Downregulated |
| SYT4 | Upregulated | Downregulated |
| FKBP4 | Upregulated | Not DEG |
| CALR | Upregulated | Not DEG |
| IDH2 | Upregulated | Not DEG |
| CD24 | Upregulated | Not DEG |
| JAG1 | Upregulated | Not DEG |
| PMP22 | Upregulated | Not DEG |
| ID1 | Upregulated | Not DEG |
| ARF6 | Upregulated | Not DEG |
| CD38 | Upregulated | Not DEG |
| COL3A1 | Upregulated | Upregulated |
| LGALS1 | Upregulated | Upregulated |
| DYNLT1 | Upregulated | Upregulated |
| STAT3 | Upregulated | Downregulated |
| TGFB1 | Upregulated | Upregulated |
| VIM | Upregulated | Upregulated |
| GFAP | Upregulated | Not DEG |
| TSPO | Upregulated | Not DEG |
DISCUSSION
The MCAo-affected rat brain has an infarct region that encompasses dead cells as a result of the occlusion and the subsequent pathological effects [31]. Despite several attempts at the development of a treatment strategy to restore neuronal loss after cerebral stroke, no preventive measures and complete cure have been established for stroke. Among various strategies, stimulation of neurogenesis to compensate for the neuronal dysfunctions and degeneration in the brain during and after the stroke represents a considerable doable treatment strategy [32]. The process of adult neurogenesis generally comprises the different stages of proliferation, migration, and differentiation of neural stem cells (NSCs). In the normal forebrain, proliferating NSCs in the SVZ give rise to neuroblasts which migrate into the olfactory bulb via the rostral migratory stream [33]. However, in neuropathogenic conditions like stroke, epilepsy, and other early stages of neurodegenerative diseases like Alzheimer’s disease (AD), Parkinson’s disease (PD), and Huntington’s disease (HD), neuroblasts in the SVZ have been reported to be reactively activated, and invade the sites of neuronal damage and around striatal regions [32]. This ectopic migration of neuroblasts to the injured site has been believed as an endogenous regenerative attempt to replenish the degenerating neurons or compensate for the abnormal neuroplasticity resulting from the pathogenic events of the stroke. However, this abnormal migration of the neuroblasts to the infarct area appears to be transient [34]. Also, post-migration, the neuroblasts mostly end up with apoptosis, before undergoing differentiation, thus actually failing to supplement functional recovery. However, unknown pathogenic molecular signatures detrimental to the successful neuroregeneration in the infarct zone remain the major obstacle in developing valid therapeutic targets against cerebral stroke. Thus, insight into neuropathomechanisms resulting from the aberrant expressions of genes appears to be crucial.
Reports on the identification and compilation of DEGs responsible for mechanisms disrupting neural regeneration after cerebral ischemia appear to be limited. Hence in this article, we carried out the identification of dysregulated neurogenic pathways in post-stroke conditions, as this will help in gaining clinically useful insights into a potential therapeutic or diagnostic application. The workflow comprised computation analysis to identify the DEGs list followed by enrichment analysis and subsequent efficient graphical summary for exploratory visualization (Fig. 6). Through WebGestalt-based enrichment analysis, the expression of the neurogenic genes like GFAP, TGFB1, PCNA, and JAG1 was identified to be upregulated in the experimental MCAo models. From these candidate genes, we could realize a trend that the majority of these genes have a role in the process of neurogenesis as cross-verified using the Mammalian Adult Neurogenesis Gene Ontology (MANGO) [35].
Fig. 6
Graphical representation of the altered neurogenic genes in post-stroke environment. Coronal section of the adult rat brain is shown in the upper left. SVZ region comprises Ependymal cells (Pink) lining along the ventricles, with Type B1 stem cells (green) adhering to them. Type B1 cells give rise to Type-C Transit amplifying Cells (yellow). During proliferation Type-C cells rapidly divide to form Type-A neuroblasts (light orange). These neuroblasts migrate along the blood vessels (red) to reach the striatum after stroke. Once reaching the site, the neuroblasts differentiate into immature neurons (light brown) and give rise to arborizations. They turn into functional neurons (dark brown) after maturation. The table depicts the genes that upregulate or downregulate the different phases of neurogenesis. The green upward arrows represent genes found to be upregulated in MCAo animals in the meta-analysis study, while the red downward arrow represents genes found to be downregulated in MCAo animals in the meta-analysis study.
Notably, reactive astrogliosis refers to an abnormal increase in the number of astroglia cells in response to pathogenic events observed in many brain diseases including stroke [36]. While GFAP has been established as a marker for the astroglial cells, reactive astrogliosis has been identified as the prominent pathological hallmark in focal ischemic stroke as it can result in glial scar leading to dementia in the pathogenic brains [37]. Glial cells are known to be the major source of TGFB1 in the brain [38]. In the physiological state, TGFB1 plays a key role in neuronal differentiation, migration, survival of new neurons, and synaptic plasticity. In contrast, elevated levels of TGFB1 and its downstream components have been identified as a key player in neuroinflammation and reduced neurogenesis in various neuropathogenic conditions including stroke. Eventually, experimental models and human subjects with neurodegenerative conditions like AD, PD, and HD have been characterized by aberrant astrogliosis, enhanced TGFB1, and impaired neurogenesis [38]. While induced gliogenic events accounting for neuroinflammation play a key role in non-autonomous mechanisms of neurodegeneration, elevated levels of TGFB1 signaling appear to induce cell cycle inactivation and impaired neuronal differentiation of NSC [39, 40]. Notably, increased level of TGFB1 has been negatively correlated with the regulation of neurogenesis in different types of dementia including vascular dementia (VaD) [41]. Knockout of TGFB1 has resulted in increased microgliosis, while the deletion of TGF-β receptor, activin receptor-like kinase 5 (ALK5) has been reported to be associated with decreased neurogenesis, thereby indicating an important role of TGFB1 in the regulation of neurogenic process [42, 43]. Kandasamy et al. and others have demonstrated that TGFB1-mediated signaling is crucial for cell cycle events of NSCs, neuronal differentiation, and survival of newborn neurons in the brain, while overexpression of TGFB1 inactivates the proliferative potentials of NSCs during neurological illnesses [44, 45]. Thus, TGFB1 could be considered as an extrinsic regulator of neurogenesis and a potential pathogenic determinant of neurogenic alteration. As PCNA is the marker for proliferating cells, the increased expression of PCNA noticed in this study represents the increased proliferation of astrocytes, NSCs and microglia in stroke brains, supported by a study of Curtis et al. indicating PCNA as the prominent proliferation marker in the brain, particularly the SVZ [46]. Moreover, Jag1 plays a key role in the modulation of Notch signaling, while recent findings indicate that an increased number of astrocytes negatively regulate neurogenesis and the regulation of the Notch pathway [47]. Notch/Jag1 activity is important for hippocampal neurogenesis, and subsequent NSCs maintenance [48]. In addition, conditional knockout of Jag1 disturbs the maintenance of radial glia in SVZ, causing defects in the cortical proliferation zone, and affecting the self-renewal capacity of NSCs [49].
Among 30 differentially downregulated genes of the neurogenic process, significantly downregulated genes were found to be Thy-1 cell surface antigen (THY1), Nuclear Receptor Subfamily 1 Group D Member 1 (NR1D1), Cyclin-dependent kinase 5 (CDK5), Syntaxin-1B (STX1B), and Noggin (NOG) in the stroke brains. In the meta-analysis, significantly altered genes related to neuroblast migration have all cumulatively resulted in the promotion of the neuronal migration process [50]. Regarding neuronal differentiation, Neurod1 has been regarded as one of the markers as it is expressed by neuronally committed neuroblasts in the brain [51]. Therefore, prominent downregulation of positive regulators of neural differentiation like Neurod1, FEZ1, and other genes as mentioned in the results, will severely affect the chances of neuronal differentiation of migrating neuroblasts in stroke conditions.
PPI analysis identified certain neurogenesis-related proteins, among them, the highest interacting is found to be AKT serine/threonine kinase (Akt) 1, a known promoter of neurogenesis [52]; Stat3, a known promoter of neuroblast migration [53]; mTOR, a known regulator of neurogenesis [54]; Casp3; and Myc, a known promoter of neural differentiation [55, 56]. The disturbances in various aspects of neurogenesis can be attributed to the dysregulations of neuroinflammatory processes, as evidenced by dysregulations in 11 key genes. Upregulation of ITGB1, interferon-gamma receptor 1 (IFNGR1), and caspase 1 (CASP1) among others particularly attributes for the above-mentioned changes in neuroinflammation and subsequently coupled with oxidative stress, and mitochondrial damage, to make the environment unsupportive.
Recently, neurogenic failure has been recognized as a prominent pathogenic feature of neurocognitive impairments and dementia in HD, PD, and various forms of AD. Considering the fact, the dysregulation of genes responsible for the aberrant neurogenic process noticed in MCAo conditions and post-mortem human stroke brains might be linked with the possible occurrence of dementia. The DEGs related to the abnormal neurogenic process in MCAo have also been shown to be also altered in other neurodegenerative subjects with dementias.
Venn diagram based analysis of candidate DEGs among MCAo and neurodegenerative diseases like AD [57], HD [58], PD [59], and VaD [60], respectively revealed a significant number of overlapping genes across the gene ontologies (Table 10). The most commonly altered genes across the panel were identified to be Pleiotrophin (PTN), Heat Shock Protein Family B (Small) Member 1 (HSPB1), Necdin (NDN), and Cold-inducible RNA-binding protein (CIRBP). Thus, this study suggests, there exists a considerable overlap in DEGs between the diseased brains of subjects with stroke and neurodegenerative disorders that display memory loss. Hence, identifying common pathogenic signatures, and targeting the same could be a treatment strategy applicable across the entire dementia spectrum. This possibility of multi-comparability of the data among the dementia types, is not only limited to neurogenic processes, thus providing multiple interestingopportunities.
Table 10
Comparison of MCAo DEG list with other neurodegenerative disorder DEG lists, and their implications with gene ontologies
| Comparison of MCAo DEG list with other neurodegenerative disorder DEG lists | MCAo ∩ AD [57] | MCAo ∩ HD [58] | MCAo ∩ PD [59] | MCAo ∩ VaD [60] |
| No. of. Overlapping genes | 141 | 46 | 101 | 31 |
| GO: Neurogenesis | PTN HSPB1 NR4A2 SERPINF1 CAMK1 LGALS1 RAB3A MTOR EGR2 SH3GL3 SGK1SDC4 NEUROD1 PRKCZ SERPINE2 TTC8 SCN1B GFAP MAP1B IFNGR1 CDK5 RAB11ADCHS1 SH3GL2 PLP1 PMP22 NPTXR NDN RAB8A | PAK1 ARF4 NLGN2 EGR2 RAB11A GABRA5 AKT1 GAS6 | PTN HSPB1 TGFB2 FABP7 NR4A2 PAFAH1B1 ARF4 RAB3A DCLK1 NEFM CNR1ATP2B2 THY1 B4GALT6 NEFL MAN2A1 NTRK2 UGDH TBCE TSPO MYCBP2 AFDNSLC12A5 ARL3 MAP1B RAB11A STXBP1 NPTN SH3GL2 APC KIF3C NDN | HSPB1 HTR7 CCL2 |
| GO: Neuroblast Proliferation | PTN | – | PTN PAFAH1B1 | – |
| GO: Neuron Migration | CDK5 NR4A2 NDN | GAS6 | NR4A2 NTRK2 PAFAH1B1 DCLK1 NDN | – |
| GO: Neuron differentiation | PTN HSPB1 NR4A2 SERPINF1 CAMK1 LGALS1 RAB3A MTOR EGR2 SH3GL3 SGK1 SDC4 NEUROD1 PRKCZ SERPINE2 TTC8 SCN1B GFAP MAP1B CDK5 RAB11A SH3GL2 PLP1 PMP22 NPTXR NDN RAB8A | PAK1 ARF4 NLGN2 EGR2 RAB11A GABRA5 AKT1 | PTN HSPB1 TGFB2 NR4A2 PAFAH1B1 ARF4 RAB3A DCLK1 NEFM CNR1 ATP2B2 THY1 B4GALT6 NEFL NTRK2 UGDH TBCE MYCBP2 AFDN SLC12A5 ARL3 MAP1B RAB11A NPTN STXBP1 SH3GL2 APC KIF3C NDN | HSPB1 HTR7 RUNX1 |
| GO: Cell Cycle Regulation | RPA2 SGK1 CCNDBP1 PPP2R1A MSX1 CDK5 RAB11A CIRBP PEBP1 | PLK1 APBB3 PPP2CA RPA3 RAB11A AKT1 MYBBP1A | TGFB2 PAFAH1B1 RBL2 PLCB1 MSX1 PPP2CA RAB11A CIRBP APC | NPPC CIRBP |
| GO: Neuroinflammatory response | IFNGR1 ADCY8 | – | CASP1 | – |
Conclusion
Stroke has been known to be a very debilitating neuropathogenic condition leading to the cause of neurological problems, memory loss, and death. While the neuropathogenic alterations appear to differ from case to case, revisiting a common concomitant neuropathological hallmark has become important for establishing a potential disease-modifying therapy for stroke. Notably, stroke brains have been characterized by reactive but incomplete neurogenesis in the infarct zone. Thus, boosting and sustaining neurogenic processes has been considered to provide defense against stroke-induced neurological deficits. Despite the generation of the redundant experimental data sets, reprocessing of already available transcriptome profiles has been essential for identifying DEGs that are involved in neuroregeneration during the stroke. This stringently concorded meta-analysis of differential transcriptomes between sham and MCAo rats revealed many dysregulated genes and pathways in stroke conditions. The DEGs identified in MCAo conditions overlap in part with that of postmortem human stroke brains. Various key genes are associated with gliogenic events, neuroinflammation, and proliferation, differentiation of NSCs. Thus, the aberrant expression of DEGs needs to be rectified to overcome the drawback present in the available management therapies. The overexpression of genes that are involved in oxidative stress, reactive gliogenesis, and neuroinflammation needs to be suppressed in order to facilitate neurogenesis in stroke brains. For example, resveratrol, a natural polyphenol has been identified to possess anti-oxidant, anti-inflammatory, and neuroprotective properties with no obvious side effects. Thus, the supplement of candidate drugs like resveratrol can be expected to reduce the expression of genes involved in the stroke condition. From another perspective, physical exercise, an enriched environment, and physiological regimens have been proven to positively regulate neurogenesis-related changes and promote neuroregeneration in the brain. Besides, intermittent hypoxic therapy represents a potential alternative to physical exercise as it can promote the expression of trophic factors and neurogenic genes in the brain. Thus, implementing intermittent hypoxic-like strategies to the treatment regime of stroke can be expected to boost neuronal regeneration and functional recovery in stroke as it can upregulate the genes responsible for the neurogenic process. However, validation of the final projected DEGs for potentiality for disease treatment in human or clinical trials is always necessary. Thus, future studies that target the expression and functions of DEGs are required to validate the present results to translate the findings for the preventive measures and resolve prospective therapeutics for functional recovery in human stroke survivors.
DATA AVAILABILITY
The data supporting the findings of this study are available within the article and its supplementary material.
ACKNOWLEDGMENTS
The authors would like to thank Mercy Priyadharshini. B for proofreading the manuscript and for helpful suggestions.
FUNDING
This work has been supported by ICMR, New Delhi, India (2019-2605/CMB/Adhoc/BMS), DST, New Delhi, India (DST/CSRI/2018/343 (G)), and MHRD, New Delhi, India, (311/RUSA 2.0/2018/BDU). SAR has been supported as SRF (DBT/2018/BDU/1112) from the Department of Biotechnology (DBT), New Delhi, India. DG has been supported as JRF from Ad Hoc extramural Grant from ICMR, New Delhi, India (2019- 2605/CMB/Adhoc/BMS). M.A, M.K and SKJ would like to acknowledge the research grant from the RUSA 2.0, Biological Sciences, Bharathidasan University for their financial support (TN RUSA: 311/RUSA (2.0)/2018 dt. 02/12/2020). GE is the recipient of theRUSA2.0 project fellowship (Ref No: BDU/RUSA 2.0/TRP/BS, dated 22.04.2021). MK has been supported by University Grants Commission -Faculty Recharge Programme, (UGC-FRP), New Delhi, India. The authors acknowledge UGC-SAP, and DST-FIST for the infrastructure of the Department of Biochemistry, Department of Bioinformatics, and Department of Animal Science, Bharathidasan University.
CONFLICT OF INTEREST
The authors declare that they have no conflict of interest.
SUPPLEMENTARY MATERIAL
[1] The supplementary material is available in the electronic version of this article: https://dx.doi.org/10.3233/JAD-220831
REFERENCES
[1] | El Amki M , Wegener S ((2017) ) Improving cerebral blood flow after arterial recanalization: A novel therapeutic strategy in stroke. Int J Mol Sci 18: , 2669. |
[2] | Woodruff TM , Thundyil J , Tang SC , Sobey CG , Taylor SM , Arumugam TV ((2011) ) Pathophysiology, treatment, and animal and cellular models of human ischemic stroke. Mol Neurodegener 6: , 11. |
[3] | Seshadri S , Beiser A , Kelly-Hayes M , Kase CS , Au R , Kannel WB , Wolf PA ((2006) ) The lifetime risk of stroke: Estimates from the Framingham Study. Stroke 37: , 345–350. |
[4] | Kalaria RN , Akinyemi R , Ihara M ((2016) ) Stroke injury, cognitive impairment and vascular dementia. Biochim Biophys Acta 1862: , 915–925. |
[5] | Radak D , Katsiki N , Resanovic I , Jovanovic A , Sudar-Milovanovic E , Zafirovic S , Mousad SA , Isenovic ER ((2017) ) Apoptosis and acute brain ischemia in ischemic stroke. Curr Vasc Pharmacol 15: , 115–122. |
[6] | Chung CP ((2017) ) Types of stroke and their differential diagnosis. Primer on Cerebrovascular Diseases (Second Edition), Caplan LR, Biller J, Leary MC, Lo EH, Thomas AJ, Yenari M, Zhang JH, eds. Academic Press, San Diego, pp.372–376 |
[7] | Piccardi B , Arba F , Nesi M , Palumbo V , Nencini P , Giusti B , Sereni A , Gadda D , Moretti M , Fainardi E , Mangiafico S , Pracucci G , Nannoni S , Galmozzi F , Fanelli A , Pezzati P , Vanni S , Grifoni S , Sarti C , Lamassa M , Poggesi A , Pescini F , Pantoni L , Gori AM , Inzitari D ((2018) ) Reperfusion Injury after ischemic Stroke Study (RISKS): Single-centre (Florence, Italy), prospective observational protocol study. BMJ Open 8: , e021183. |
[8] | Liang S , Lin Y , Lin B , Li J , Liu W , Chen L , Zhao S , Tao J ((2017) ) Resting-state functional magnetic resonance imaging analysis of brain functional activity in rats with ischemic stroke treated by electro-acupuncture. J Stroke Cerebrovasc Dis 26: , 1953–1959. |
[9] | Roth JM ((2011) ) Recombinant tissue plasminogen activator for the treatment of acute ischemic stroke. Proc (Bayl Univ Med Cent) 24: , 257–259. |
[10] | Ernst A , Frisén J ((2015) ) Adult neurogenesis in humans- common and unique traits in mammals. PLoS Biol 13: , e1002045. |
[11] | Dayer AG , Ford AA , Cleaver KM , Yassaee M , Cameron HA ((2003) ) Short-term and long-term survival of new neurons in the rat dentate gyrus. J Comp Neurol 460: , 563–572. |
[12] | Fiorelli R , Azim K , Fischer B , Raineteau O ((2015) ) Adding a spatial dimension to postnatal ventricular-subventricular zone neurogenesis. Development 142: , 2109–2120. |
[13] | Toda T , Parylak S , Linker SB , Gage FH ((2019) ) The role of adult hippocampal neurogenesis in brain health and disease. Mol Psychiatry 24: , 67–87. |
[14] | Cramer SC ((2018) ) Treatments to promote neural repair after stroke. J Stroke 20: , 57–70. |
[15] | Jiao Y , Liu YW , Chen WG , Liu J ((2021) ) Neuroregeneration and functional recovery after stroke: Advancing neural stem cell therapy toward clinical application. Neural Regen Res 16: , 80–92. |
[16] | Lowe R , Shirley N , Bleackley M , Dolan S , Shafee T ((2017) ) Transcriptomics technologies. PLoS Comput Biol 13: , e1005457. |
[17] | Xia J , Gill EE , Hancock REW ((2015) ) NetworkAnalyst for statistical, visual and network-based meta-analysis of gene expression data. Nat Protoc 10: , 823–844. |
[18] | Zhou G , Soufan O , Ewald J , Hancock REW , Basu N , Xia J ((2019) ) NetworkAnalyst 3.0: A visual analytics platform for comprehensive gene expression profiling and meta-analysis. Nucleic Acids Res 47: , W234–W241. |
[19] | Diehn M , Sherlock G , Binkley G , Jin H , Matese JC , Hernandez-Boussard T , Rees CA , Cherry JM , Botstein D , Brown PO , Alizadeh AA ((2003) ) SOURCE: A unified genomic resource of functional annotations, ontologies, and gene expression data. Nucleic Acids Res 31: , 219–223. |
[20] | Johnson WE , Li C , Rabinovic A ((2007) ) Adjusting batch effects in microarray expression data using empirical Bayes methods. Biostatistics 8: , 118–127. |
[21] | Liu X , Li N , Liu S , Wang J , Zhang N , Zheng X , Leung KS , Cheng L ((2019) ) Normalization methods for the analysis of unbalanced transcriptome data: A review. Front Bioeng Biotechnol 7: , 358. |
[22] | Xia J , Fjell CD , Mayer ML , Pena OM , Wishart DS , Hancock REW ((2013) ) INMEX— a web-based tool for integrative meta-analysis of expression data. Nucleic Acids Res 41: , W63–W70. |
[23] | Huo Z , Tang S , Park Y , Tseng G ((2020) ) -value evaluation, variability index and biomarker categorization for adaptively weighted Fisher’s meta-analysis method in omics applications. Bioinformatics 36: , 524–532. |
[24] | Reimand J , Isser R , Voisin V , Kucera M , Tannus-Lopes C , Rostamianfar A , Wadi L , Meyer M , Wong J , Xu C , Merico D , Bader GD ((2019) ) Pathway enrichment analysis and visualization of omics data using g:Profiler, GSEA, Cytoscape and EnrichmentMap. Nat Protoc 14: , 482–517. |
[25] | Tulalamba W , Larbcharoensub N , Sirachainan E , Tantiwetrueangdet A , Janvilisri T ((2015) ) Transcriptome meta-analysis reveals dysregulated pathways in nasopharyngeal carcinoma. Tumour Biol 36: , 5931–5942. |
[26] | Xia J , Benner MJ , Hancock REW ((2014) ) NetworkAnalyst - integrative approaches for protein– protein interaction network analysis and visual exploration. Nucleic Acids Res 42: , W167–W174. |
[27] | Yang L , Wang X , Guo H , Zhang W , Wang W , Ma H ((2019) ) Whole transcriptome analysis of obese adipose tissue suggests u001kfc.1 as a potential regulator to glucose homeostasis. Front Genet 10: , 1133. |
[28] | Brulet R , Zhu J , Aktar M , Hsieh J , Cho KO ((2017) ) Mice with conditional NeuroD1 knockout display reduced aberrant hippocampal neurogenesis but no change in epileptic seizures. Exp Neurol 293: , 190–198. |
[29] | Morrow CS , Porter TJ , Xu N , Arndt ZP , Ako-Asare K , Heo HJ , Thompson EAN , Moore DL ((2020) ) Vimentin coordinates protein turnover at the aggresome during neural stem cell quiescence exit. Cell Stem Cell 26: , 558–568.e9. |
[30] | Liang R , Yong S , Huang X , Kong H , Hu G , Fan Y ((2016) ) Aquaporin-4 mediates the suppressive effect of lipopolysaccharide on hippocampal neurogenesis. Neuroimmunomodulation 23: , 309–317. |
[31] | Fluri F , Schuhmann MK , Kleinschnitz C ((2015) ) Animal models of ischemic stroke and their application in clinical research. Drug Des Devel Ther 9: , 3445–3454. |
[32] | Lindvall O , Kokaia Z ((2015) ) Neurogenesis following stroke affecting the adult brain. Cold Spring Harb Perspect Biol 7: , a019034. |
[33] | Alvarez-Buylla A , Garcıa-Verdugo JM ((2002) ) Neurogenesis in adult subventricular zone. J Neurosci 22: , 629–634. |
[34] | Thored P , Wood J , Arvidsson A , Cammenga J , Kokaia Z , Lindvall O ((2007) ) Long-term neuroblast migration along blood vessels in an area with transient angiogenesis and increased vascularization after stroke. Stroke 38: , 3032–3039. |
[35] | Overall RW , Paszkowski-Rogacz M , Kempermann G ((2012) ) The Mammalian Adult Neurogenesis Gene Ontology (MANGO) provides a structural framework for published information on genes regulating adult hippocampal neurogenesis. PLoS One 7: , e48527. |
[36] | Siracusa R , Fusco R , Cuzzocrea S ((2019) ) Astrocytes: Role and functions in brain pathologies. Front Pharmacol 10: , 1114. |
[37] | Sofroniew MV , Vinters HV ((2010) ) Astrocytes: Biology and pathology. Acta Neuropathol 119: , 7–35. |
[38] | Welser-Alves JV , Milner R ((2013) ) Microglia are the major source of TNF-α and TGF-β in postnatal glial cultures; regulation by cytokines, lipopolysaccharide, and vitronectin. Neurochem Int 63: , 47–53. |
[39] | Kandasamy M , Lehner B , Kraus S , Sander PR , Marschallinger J , Rivera FJ , Trümbach D , Ueberham U , Reitsamer HA , Strauss O , Bogdahn U , Couillard-Despres S , Aigner L ((2014) ) TGF-beta signalling in the adult neurogenic niche promotes stem cell quiescence as well as generation of new neurons. J Cell Mol Med 18: , 1444–1459. |
[40] | Manickam N , Radhakrishnan RK , Vergil Andrews JF , Selvaraj DB , Kandasamy M ((2020) ) Cell cycle re-entry of neurons and reactive neuroblastosis in Huntington’s disease: Possibilities for neural-glial transition in the brain. Life Sci 263: , 118569. |
[41] | Kandasamy M , Anusuyadevi M , Aigner KM , Unger MS , Kniewallner KM , de Sousa DMB , Altendorfer B , Mrowetz H , Bogdahn U , Aigner L ((2020) ) TGF-β signaling: A therapeutic target to reinstate regenerative plasticity in vascular dementia? Aging Dis 11: , 828–850. |
[42] | Brionne TC , Tesseur I , Masliah E , Wyss-Coray T ((2003) ) Loss of TGF-beta 1 leads to increased neuronal cell death and microgliosis in mouse brain. Neuron 40: , 1133–1145. |
[43] | He Y , Zhang H , Yung A , Villeda SA , Jaeger PA , Olayiwola O , Fainberg N , Wyss-Coray T ((2014) ) ALK5-dependent TGF-β signaling is a major determinant of late stage adult neurogenesis. Nat Neurosci 17: , 943–952. |
[44] | Kandasamy M , Couillard-Despres S , Raber KA , Stephan M , Lehner B , Winner B , Kohl Z , Rivera FJ , Nguyen HP , Riess O , Bogdahn U , Winkler J , von Hörsten S , Aigner L ((2010) ) Stem cell quiescence in the hippocampal neurogenic niche is associated with elevated transforming growth factor-β signaling in an animal model of Huntington disease. J Neuropathol Exp Neurol 69: , 717–728. |
[45] | Kandasamy M , Reilmann R , Winkler J , Bogdahn U , Aigner L ((2011) ) Transforming growth factor-beta signaling in the neural stem cell niche: A therapeutic target for Huntington’s disease. Neurol Res Int 2011: , e124256. |
[46] | Curtis MA , Penney EB , Pearson AG , van Roon-Mom WMC , Butterworth NJ , Dragunow M , Connor B , Faull RLM ((2003) ) Increased cell proliferation and neurogenesis in the adult human Huntington’s disease brain. Proc Natl Acad Sci U S A 100: , 9023–9027. |
[47] | Wilhelmsson U , Faiz M , de Pablo Y , Sjöqvist M , Andersson D , Widestrand A , Potokar M , Stenovec M , Smith PLP , Shinjyo N , Pekny T , Zorec R , Ståhlberg A , Pekna M , Sahlgren C , Pekny M ((2012) ) Astrocytes negatively regulate neurogenesis through the Jagged1-mediated Notch pathway. Stem Cells 30: , 2320–2329. |
[48] | Lavado A , Oliver G ((2014) ) Jagged1 is necessary for postnatal and adult neurogenesis in the dentate gyrus. Dev Biol 388: , 11–21. |
[49] | Blackwood CA ((2019) ) Jagged1 is essential for radial glial maintenance in the cortical proliferative zone. Neuroscience 413: , 230–238. |
[50] | Naoko K , Herranz-Pérez V , Otsuka T , Sano H , Ohno N , Omata T , Huybang N , Thai Q , Nambu A , Kawaguchi Y , Garcia-Verdugo J , Sawamoto K ((2018) ) New neurons use Slit-Robo signaling to migrate through the glial meshwork and approach a lesion for functional regeneration. Sci Adv 4: , eaav0618. |
[51] | D’Amico LA , Boujard D , Coumailleau P ((2013) ) The neurogenic factor NeuroD1 is expressed in post-mitotic cells during juvenile and adult xenopus neurogenesis and not in progenitor or radial glial cells. PLoS One 8: , e66487. |
[52] | Shioda N , Han F , Fukunaga K ((2009) ) Role of Akt and ERK signaling in the neurogenesis following brain ischemia. Int Rev Neurobiol 85: , 375–387. |
[53] | Okada S , Nakamura M , Katoh H , Miyao T , Shimazaki T , Ishii K , Yamane J , Yoshimura A , Iwamoto Y , Toyama Y , Okano H ((2006) ) Conditional ablation of Stat3 or Socs3 discloses a dual role for reactive astrocytes after spinal cord injury. Nat Med 12: , 829–834. |
[54] | LiCausi F , Hartman NW ((2018) ) Role of mTOR complexes in neurogenesis. Int J Mol Sci 19: , 1544. |
[55] | Fernando P , Brunette S , Megeney LA ((2005) ) Neural stem cell differentiation is dependent upon endogenous caspase 3 activity. FASEB J 19: , 1671–1673. |
[56] | Zinin N , Adameyko I , Wilhelm M , Fritz N , Uhlén P , Ernfors P , Henriksson MA ((2014) ) MYC proteins promote neuronal differentiation by controlling the mode of progenitor cell division. EMBO Rep 15: , 383–391. |
[57] | Potashkin JA , Bottero V , Santiago JA , Quinn JP ((2019) ) Computational identification of key genes that may regulate gene expression reprogramming in Alzheimer’s patients. PLoS One 14: , e0222921. |
[58] | Seefelder M , Kochanek S ((2021) ) A meta-analysis of transcriptomic profiles of Huntington’s disease patients. PLoS One 16: , e0253037. |
[59] | Kelly J , Moyeed R , Carroll C , Albani D , Li X ((2019) ) Gene expression meta-analysis of Parkinson’s disease and its relationship with Alzheimer’s disease. Mol Brain 12: , 16. |
[60] | Shu J , Wei W , Zhang L ((2022) ) Identification of molecular signatures and candidate drugs in vascular dementia by bioinformatics analyses. Front Mol Neurosci 15: , 751044. |
[61] | Oh SH , Choi C , Noh JE , Lee N , Jeong YW , Jeon I , Shin JM , Kim JH , Kim HJ , Lee JM , Kim HS , Kim OJ , Song J ((2018) ) Interleukin-1 receptor antagonist-mediated neuroprotection by umbilical cord-derived mesenchymal stromal cells following transplantation into a rodent stroke model. Exp Mol Med 50: , 1–12. |
[62] | Lai W , Zheng Z , Zhang X , Wei Y , Chu K , Brown J , Hong G , Chen L ((2015) ) Salidroside-mediated neuroprotection is associated with induction of Early Growth Response Genes (EGRS) across a wide therapeutic window. Neurotox Res 28: , 108–121. |
[63] | Wang L , Yu Y , Yang J , Zhao X , Li Z ((2015) ) Dissecting Xuesaitong’s mechanisms on preventing stroke based on the microarray and connectivity map. Mol Biosyst 11: , 3033–3039. |
[64] | Mengozzi M , Cervellini I , Villa P , Erbayraktar Z , Gökmen N , Yilmaz O , Erbayraktar S , Manohasandra M , Van Hummelen P , Vandenabeele P , Chernajovsky Y , Annenkov A , Ghezzi P ((2012) ) Erythropoietin-induced changes in brain gene expression reveal induction of synaptic plasticity genes in experimental stroke. Proc Natl Acad Sci U S A 109: , 9617–9622. |
[65] | Armugam A , Cher CD , Lim K , Koh DC , Howells DW , Jeyaseelan K ((2009) ) A secretory phospholipase A2-mediated neuroprotection and anti-apoptosis. BMC Neurosci 10: , 120. |
[66] | Ramos-Cejudo J , Gutiérrez-Fernández M , Rodríguez-Frutos B , Expósito Alcaide M , Sánchez-Cabo F , Dopazo A , Díez-Tejedor E ((2012) ) Spatial and temporal gene expression differences in core and periinfarct areas in experimental stroke: A microarray analysis. PLoS One 7: , e52121. |
[67] | Liu FJ , Lim KY , Kaur P , Sepramaniam S , Armugam A , Wong PTH , Jeyaseelan K ((2013) ) microRNAs involved in regulating spontaneous recovery in embolic stroke model. PLoS One 8: , e66393. |


