
Age-Related Oxidative Redox and Metabolic Changes Precede Intraneuronal Amyloid-β Accumulation and Plaque Deposition in a Transgenic Alzheimer’s Disease Mouse Model
Abstract
Background:
Many identified mechanisms could be upstream of the prominent amyloid-β (Aβ) plaques in Alzheimer’s disease (AD).
Objective:
To profile the progression of pathology in AD.
Methods:
We monitored metabolic signaling, redox stress, intraneuronal amyloid-β (iAβ) accumulation, and extracellular plaque deposition in the brains of 3xTg-AD mice across the lifespan.
Results:
Intracellular accumulation of aggregated Aβ in the CA1 pyramidal cells at 9 months preceded extracellular plaques that first presented in the CA1 at 16 months of age. In biochemical assays, brain glutathione (GSH) declined with age in both 3xTg-AD and non-transgenic controls, but the decline was accelerated in 3xTg-AD brains from 2 to 4 months. The decline in GSH correlated exponentially with the rise in iAβ. Integrated metabolic signaling as the ratio of phospho-Akt (pAkt) to total Akt (tAkt) in the PI3kinase and mTOR pathway declined at 6, 9, and 12 months, before rising at 16 and 20 months. These pAkt/tAkt ratios correlated with both iAβ and GSH levels in a U-shaped relationship. Selective vulnerability of age-related AD-genotype-specific pAkt changes was greatest in the CA1 pyramidal cell layer. To demonstrate redox causation, iAβ accumulation was lowered in cultured middle-age adult 3xTg-AD neurons by treatment of the oxidized redox state in the neurons with exogenous cysteine.
Conclusion:
The order of pathologic progression in the 3xTg-AD mouse was loss of GSH (oxidative redox shift) followed by a pAkt/tAkt metabolic shift in CA1, iAβ accumulation in CA1, and extracellular Aβ deposition. Upstream targets may prove strategically more effective for therapy before irreversible changes.
INTRODUCTION
Alzheimer’s disease (AD), the leading cause of dementia, is a devastating illness most common in adults aged 65 and older that results in impaired memory and executive function. The disease has historically been characterized by the accumulation of extracellular amyloid-β (Aβ) plaques and intracellular tau (tangles). However, plaque pathology found during autopsy often does not correlate with severity of cognitive dysfunction in later stages of the patient’s life. Clinical trials to treat AD have failed to meet primary endpoints for over 20 years. Despite the FDA approval of Aducanumab based on its ability to clear plaque deposits, no drug has yet succeeded in trials to reverse memory impairment for AD patients. This has led some researchers to consider other mechanistic targets. Since over 5,000 articles in PubMed cite AD and mechanism (over 3,000 include amyloid), we are exploring upstream regulation of disease pathogenesis that could explain multiple mechanisms as noted by Coleman [1]. Here we investigate early events such as metabolic signaling and redox shift that may contribute to early intracellular Aβ accumulation and late AD pathology.
In the first immunohistochemical staining with antibodies for both Aβ and amyloid-β protein precursor (AβPP) in the late 1980s, a subset of neurons displayed elevated staining for both precursor and product [2–6]. More recent studies have shown that neuritic plaques arise from neurons that have accumulated intraneuronal (iAβ), nuclear, and perinuclear Aβ in aggregated and fibrillar forms, based on its reaction with aggregation-specific monoclonal antibodies like mOC78 and electron microscopy [7, 8]. iAβ is associated with early plaque stage A and B AD pathology in human brains that are often derived from mild cognitively impaired (MCI) or cognitively normal individuals, suggesting that may be an early event in AD pathogenesis [7]. Several transgenic mouse models, including the 3xTg-AD and 5xFAD mouse, also display prominent iAβ that stains with mOC78 and in the 5xFAD mouse stains with thioflavin S, which stains the cores of amyloid plaques [7–9]. The iAβ may be a precursor to the amyloid deposited as neuritic plaques because treatment of 5xFAD mice with the CSF1-R inhibitor PLX 3397, prior to iAβ accumulation, blocks the accumulation and the subsequent deposition of neuritic plaques [10]. The question remains why the accumulation of intracellular and extracellular Aβ takes months to develop in these mouse models and decades in familial AD when the transgenes are present from conception. What is it about aging that causes fragments of AβPP, a protein essential to normal synapses [11–13], to aggregate and become pathogenic? Could there be metabolic precursors that promote Aβpathogenesis?
Metabolic dysfunction is known to accompany both normal and pathological aging, but it is unclear whether this precedes or follows the accumulation of iAβ, tau tangles, and plaques that are found in AD. Here we measure the reduced form of glutathione (GSH) in brains from non-transgenic (nTg) and an AD mouse model (3xTg-AD) as a readout of oxidative stress and cell health. In addition, we correlate the reduction in GSH with a reduction in Akt activity and the accumulation of iAβ and plaques in order to construct a timeline of pathological events in AD. GSH is a tripeptide of glutamate, cysteine, and glycine that serves as the most abundant antioxidant capable of neutralizing intracellular free radicals. Metabolic sensors like GSH are difficult to measure because they change rapidly postmortem. Yet even postmortem, Ansari and Scheff [14] found that AD brains exhibited a 50% decline in synaptosomal GSH compared to age and postmortem-interval matched non-demented individuals, and an overall decline in GSH levels. These changes were already evident in MCI cases, suggesting an early event in pathogenesis, like iAβ. These declines were accompanied by an increase in the oxidized GSSG, resulting in an 80% decline in the redox ratio GSH/GSSG. They also measured protein and lipid oxidation levels in synaptosomes to find correlations of 0.5–0.8 with subject Mini-Mental State Examination scores. In living subjects with AD, GSH levels assessed by MRI spectroscopy were 50% lower than control subjects and 25% lower in MCI subjects [15]. We measured levels of GSH in flash frozen brains to determine whether decreases in GSH precede or coincide with iAβ and plaques. We also added the reducing amino acid cysteine, a precursor to GSH, externally to adult neuronal cultures to determine whether changing the redox state [16] would cause a decline in iAβ levels.
Another key metabolic regulator that might function upstream of pathological intracellular Aβ accumulation in aging and AD is the serine/threonine kinase Akt (Protein Kinase B). As Akt is an important promotor of cell survival [17] and cell death [18], it is possible that the cascade of cell death initiated by Akt dysfunction lies upstream of plaque pathology and further cell death in AD. Through inhibition of GSK-3β, the Akt pathway is implicated in reducing production of hyperphosphorylated tau in neurofibrillary tangles [19, 20]. Akt is a PI3K-dependent kinase involved in regulating a variety of cellular processes including protein synthesis, apoptosis, autophagy, glucose metabolism, cell adhesion, migration, synaptic signaling, and tumorigenesis in response to growth factors and insulin [21–23]. Akt activation enables the hypermetabolic state of cancer cells [24] and resistance to hypoxia [25], indicating that Akt can both drive and be modified by metabolic changes. Ghosh and Brewer [16] demonstrated that a reductive redox shift in primary neuronal culture of old neurons resulted in increased phospho-Akt (pAkt) levels and reduced neuronal death, while opposite effects were induced with oxidative redox shifts. Akt is activated by insulin, growth factors and other transmembrane receptors through phosphorylation of Thr308 and Ser473 by 3-phosphoinositide-dependent protein kinase-1 (PDK1) [26] and mTORC2 [27], respectively. pAkt in turn phosphorylates many other proteins including mTORC1 [28], MDM2 [29], FoxO [30, 31], and GSK-3 [32], thereby promoting or inactivating a wide variety of cellular pathways. Numerous studies have demonstrated the beneficial effects of increased Akt activity on cell survival, especially in the context of apoptosis or necroptosis [18, 33–36]. Additionally, an age-related decrease in Akt accompanies an increase in several neuroinflammation factors and GSK-3β activity in aged mice at 12 and 24 months old [37].
In human late-stage AD brain samples, pAkt levels were found to be decreased in cytosolic fractions relative to controls but increased in particulate fractions [38]. In cultured cells induced to express Aβ monomer and oligomers, Aβ expression inhibited insulin-induced Akt phosphorylation and activity [39]. Additionally, nuclear Akt was found to be significantly reduced across the lifespan in CA1 compared to CA3 in rats, an area that is known to have a selective vulnerability to pathology in AD [40]. This evidence points to a pathological decrease in pAkt in aging and AD that could lead to dysfunction in a myriad of cell signaling pathways, while also indicating pAkt as a potential upstream target for intervention in AD.
We sought to determine the timeline of pAkt decrease in relation to declining GSH and accumulating intraneuronal Aβ and plaques in AD, so we immunostained the same mouse brains that were used for GSH measurements to correlate pAkt/Akt ratios in CA1 of the hippocampus with GSH levels, as well as iAβ and plaques in the same individuals. We hypothesized that an age-related change in metabolic signaling through pAkt, or a decline in GSH redox state, precedes and possibly promotes the accumulation of 6E10- and mOC78-positive forms of iAβ in mouse brains, which could be exacerbated at certain times in the circadian cycle [41–43] and sex differences [44, 45]. Across seven points in the age-span of 3xTg-AD and nTg mice, we found a distinct hierarchy of large changes in hippocampal extracellular and intracellular Aβ forms, pAkt signaling and GSH shift to more oxidized redox levels. Surprisingly, the Aβ changes could be lowered by a simple overnight treatment of middle-age primary neurons with cysteine, the reduced form of cystine. These results suggest that an oxidative redox state is upstream of Aβ biogenesis and disposal, and strategic interventions in redox state control may prove to be protective against development of pathology in AD.
MATERIALS AND METHODS
Mice
We used the triple-transgenic AD mouse model from the LaFerla Lab (3xTg-AD) containing PS1M146V, AβPPSwe, and tauP301L transgenes [46, 47]. Non-transgenic (nTg) control mice were C57BL/6 from Charles River or a mixed background C57BL/6/129. All animals were genotyped from tail snips before use (Transnetyx, Cordova, TN). Animals were housed 1–5 per cage at controlled temperature and humidity under a 12-h light/dark cycle and provided with food and water ad libitum (2020X diet from Envigo, Teklad, Indianapolis, IN). The two genotype cohorts of 84 mice were divided into 12 mice in each of 7 age groups: 2, 4, 6, 9, 12, 16, 20–24 months. The 20–24-month group is called “20 month” for convenience throughout the paper. Half of these 12 mice per age were male and half were female. Three of these 6 mice were sacrificed in the AM and 3 in the PM to test for circadian rhythms. All experiments were conducted in accordance with National Institutes of Health guidelines, with approval from the University of California, Irvine, Institutional Animal Care and Use Committee which follow the guidelines for the Care and Use of Laboratory Animals.
Brain extraction and sectioning
Dissections were performed during 1-h sessions just after lights-on (6:45–7:45) (AM) or just before lights-off (16:30–17:30) (PM). Mice were anesthetized with a brief exposure (5–10 s) to isoflurane and quickly decapitated. The right half of the brain was weighed, placed into Safe-Lock tubes (Eppendorf), and snap-frozen in liquid nitrogen, and then stored at –80°C until use in the glutathione assay. The left half of the brain was fixed in 4% paraformaldehyde/PBS at 4°C for 4–5 days, and then stored at 4°C in PBS with 0.02% sodium azide. They were sectioned into 50 μm thick slices using a vibratome, and sections were stored in PBS/0.02% sodium azide at 4°C until immunofluorescence staining.
Immunofluorescence staining
One 50 μm section was placed into each well of a 24-well plate for staining. For the mOC78 and 6E10 staining, sections were treated with 70% formic acid in water for 4 min at room temperature, then rinsed twice with TBS (20 mM Tris, 137 mM NaCl, pH 7.5 adjusted with HCl). After permeabilization for 20 min with 0.1% Triton X-100 in TBS, sections were rinsed with TBS and then incubated overnight at room temperature in 3.6% Mouse-on-Mouse IgG blocking reagent (ThermoFisher, R37621 1:30) in TBS. The next day, sections were washed twice with TBS for 2 min each, then blocked for 1 h at room temperature (2% BSA, 0.1% Triton X-100, TBS). Antibodies were added to the block solution, and sections incubated overnight at room temperature (rabbit mOC78, IgG purified from hybridoma media, Glabe Lab, 1 μg/ml; mouse Ultra-LEAF Purified anti-β-Amyloid 1–16 (6E10), Biolegend #803024, 5 μg/ml). The following day, sections were washed 3 times in 0.1% Triton X-100 in TBS, then blocked for 15 min in 2% BSA and 0.1% Triton X-100 in TBS. Secondary antibodies were added at 1:350 to the block for 2 h at room temperature (Alexa Fluor goat anti-rabbit 488 and Alexa Fluor goat anti-mouse 647, Invitrogen). After 3 more TBS washes, sections were stained for 10 min with 14 μg/ml DAPI in TBS, washed again with TBS, and mounted onto glass slides using Molecular Probes ProLong Diamond Antifade Mountant. Slides were stored at 4°C until imaging.
For the pAkt and total Akt (tAkt) staining, sections were permeabilized for 20 min with 0.02% Triton X-100 in PHEM (60 mM Pipes (CAS 5625-37-6); 25 mM Hepes (CAS 7365-45-9); 10 mM EGTA (CAS 67-42-5); 4 mM magnesium sulfate (CAS 10034-99-8); pH 7.0 adjusted with KOH) [48]. After 1 h blocking at room temperature (2% bovine serum albumin, 1.3% normal goat serum, 0.4% Mouse-on-Mouse IgG blocking reagent (#MKB-2213 VectorLabs) in PHEM), sections incubated overnight at 4°C in block with 1:200 of each primary antibody (mouse Akt (pan) (40D4), Cell signaling 2920, and rabbit phospho-Akt (Thr308) (C31E5E), Cell signaling 2965). The next day, sections were washed 3x in PHEM and then incubated for 2 h at room temperature in secondary block (2% bovine serum albumin in PHEM) with 1:350 each secondary antibodies (Alexa Fluor goat anti-rabbit 488 and Alexa Fluor goat anti-mouse 647, Invitrogen). After 3 more PHEM washes, sections were stained for 10 min with 14 μg/ml DAPI in PHEM, washed again with PHEM, and mounted onto glass slides using Molecular Probes ProLong Diamond Antifade Mountant. Slides were stored at 4°C until imaging.
Image capture, processing, and statistical analysis
For the mOC78 and 6E10 staining (with DAPI), 8-bit images were captured using a 20x air objective on a Leica DMi8 widefield fluorescent microscope with the following settings: intensity 10%, exposure 4.5 ms (405 nm), 55%, 25 ms (488 nm), 17%, 4 ms (647 nm). Approximately 12–20 tiles were imaged in the xy-axis, and Leica LASx software was used to stitch together (“merge”) the tiles for a complete image. Twenty sections, each 2 μm thick, were captured in the z-axis for each section. The middle 3 z-sections that showed the best focus were selected. A Maximum Projection was performed on the 3 sections to select and compile the brightest pixel at each x-y location using LASx. In post-processing, contrast was adjusted to 35–255 for the 488 channel and 25–255 in the 647 channel in order to decrease background levels. Fluorescence intensity levels were quantified using FIJI (NIH ImageJ). A free-hand region of interest (ROI) was drawn manually to include the CA1 subregion or the CA1 pyramidal layer, the dentate granule cells, hilus and CA3 pyramidal cells, for each individual section, avoiding any areas with fluorescent artifacts. ROIs ranged from 180 K–800 K μm2, with overall nTg versus 3xTg-AD ROI sizes within 9.6% of each other. For detection of extracellular plaques and large amyloid aggregates, images were thresholded to 27 (of 255), and the integrated density of large objects from 80–8,100 μm2 was quantified. Objects below a circularity of 0.05 (large, irregular perimeters) were redacted as artifacts. The sum of the integrated density (Int dens) of all objects was divided by the CA1 regional ROI area to adjust for variability in ROIs to yield the sum Int dens/CA1 area. For intracellular Aβ detection, the CA1 pyramidal cell layer was outlined by hand with Fiji’s drawing ellipse followed by direct determination of the mean density of the region. Images shown were acquired at a fixed exposure and excitation and analyzed and presented at a fixed brightness and contrast.
For the pAkt and tAkt staining (with DAPI), images were captured using a 20x oil objective on a Leica SP8 fluorescent confocal microscope (University of California, Irvine, Optical Biology Core). Settings were as follows: 8-bit; 1024×1024 resolution; laser 2.3% intensity (405), 7.01% (488), 10.5% (647); gain 175.2 (405), 95.6 (488), 800.5 (647). Approximately 12–20 tiles were imaged in the xy-axis, and Leica LASx software was used to merge the tiles. Approximately 10–13 sections 2 μm thick were captured in the z-axis for each section. The middle 3 z-sections that showed the best focus were cropped out, and an Average Projection of these sections was performed using LASx. The integrated density was measured in each channel, and the ratio of pAkt (488) to tAkt (647) was obtained. The background intensity in the CA1 pyramidal layer of sections stained without primary antibody was determined by creating an ROI outline by hand with Fiji’s drawing ellipse. The average density of this entire layer of cells was determined for multiple brains of each age and averaged by age. A background of 7 was determined for ages 2 and 4 months, and 11 for the other months in both the red and the green channels. For sections stained with both primary and secondary antibodies, these values of 7 and 11 were subtracted from the entire image. The same ROI created for the red tAkt image was applied to the green pAkt image and the mean density determined for each epitope. The ratio of the pAkt density over the tAkt density was calculated. This procedure was used for CA1 pyramidal neurons, dentate granule neurons, hilus and CA3 pyramidalneurons.
Tissue homogenization and glutathione measurement
The right half of each brain was thawed on wet ice. An equal amount of two different types of homogenization beads from NextAdvance was then added to the tubes using the scooper provided (approximately 100 μl volume of each bead type): 0.5 mm Zirconium Oxide Beads (ZROB05) and 1.0 mm diameter Zirconium Oxide Beads (ZROC10). Ice-cold buffer was added to each sample (800 μl 50 mM MES, pH 7.0/1 mM EDTA, pH 8.0). Tissue was homogenized by placing the tubes into the Buller Blender (NextAdvance) for the following cycles: Speed 7, 5 min; Ice, 5 min, Speed 10, 5 min; Ice, 5 min; Speed 10, 5 min; Ice, 5 min. Samples were then centrifuged for 15 min at 10,000 g, 4°C. The supernatant was transferred to a fresh tube to be processed for glutathione measurements.
Instructions were followed from the Glutathione Assay Kit (Cayman Chemical, #703002, Ann Arbor, MI). Briefly, an equal volume of 10% meta-phosphoric acid w/v (CAS 37267-86-0, Fisher AA33267-22) was added to the supernatants to deproteinate the samples, followed by a 5 min incubation at room temperature, then centrifugation at 5,000 g for 3 min at 4°C. Supernatant was removed to a fresh tube, and 4 M Triethanolamine (CAS 102-71-6; Sigma T58300) was added to raise the pH. For total glutathione measurements, samples were diluted between 1:10 and 1:100. For oxidized GSSG measurements, samples were derivatized by adding 2-vinylpyridine (CAS 100-69-6, Sigma 132292), then diluted between 1:10 and 1:100. All samples were loaded in triplicate into a 96-well plate, along with triplicates of the appropriate standards from the kit. A cocktail of enzyme (glutathione reductase and glucose-6-phosphate dehydrogenase), cofactor (NADP+ and glucose-6-phosphate), and DTNB (Ellman’s reagent) was added, and the samples incubated at room temperature for 25 min. The plates were then read using a SpectraMax plate reader with SoftMaxPro software at absorbance 405 nm. Total glutathione and GSSG levels were calculated by plotting absorbance readings on the average standard curves, and reduced GSH levels were obtained by subtracting GSSG from total glutathionelevels.
Cysteine addition to adult cultured neurons and intracellular Aβ
Adult primary hippocampal neurons were cultured from 3xTg-AD and nTg mice of indicated ages [49]. Briefly, hippocampi plus overlying entorhinal cortex were dissected, sliced, cells loosened in papain and neurons isolated on a Nycoprep gradient in Hibernate A/B27 (270 mOsm, BrainBits, Springfield, IL). Neurons were plated at 35,000 cells/cm2 on 12 mm Assistent brand glass coverslips (Carolina Biological Supply, Burlington, NC) precoated with 100 μg/mL poly-D-lysine in water (Sigma-Aldrich, St. Louis, MO #P6407). Plating and culture medium was BrainPhys plus SM1 (Stem Cell Technologies, Seattle, WA), Glutamax (Fisher Scienfitic, Carlsbad, CA), 10 ng/mL each FGF2 (#450-33) and PDGFbb (315-18) (recombinant murine Peprotech, Cranbury, NJ). Neurons were cultured to develop axons, dendrites, and synapses over 2 weeks in physiological 9% O2, 5% CO2, humidified 37°C. One half the medium was changed twice a week, without growth factors after the first week.
To shift the redox state of cells from oxidized to a healthy reductive balance [50], 2-week-old neurons were treated for 24 h with 100 μM cysteine from a 10 mM fresh stock made in Hibernate A/B27, pH 7.3. Controls received on Hibernate. Cells were fixed for 10 min at 22°C in 4% paraformaldehyde in PHEM buffer to preserve microtubules (as above). Fix was removed by one rinse in PHEM, followed by antigen retrieval for 5 min at 95°C in 0.1 M sodium citrate, pH 6. Non-specific sites were blocked and cells permeabilized for 60 min in 2% bovine serum albumin, 0.1% Triton X-100 in PHEM. Primary antibodies of mouse anti-β-Amyloid 1–16 (6E10) and rabbit mOC78 as above were incubated overnight at 4°C. Controls received no primary antibodies. Unbound antibodies were removed by rinsing three times in PHEM. Secondar antibodies of goat anti-mouse Alexafluor 647 (1:350) and goat anti-rabbit Alexafluor 488 (1:350; Fisher Scientific) were incubated with cells for 1 h at room temperature. Unbound secondary antibodies were removed by washing the cells twice with PHEM, followed by staining nuclei for 2 min in 10 μg/mL bisbenzimide (Sigma-Aldrich). After rinsing twice more, slips were mounted and imaged with an Olympus 60x oil immersion objective.
Statistical analysis
GraphPad Prism (San Diego, CA) was used to identify statistical differences for all experiments using a 2-way ANOVA followed by Sidak’s or Tukey’s multiple-comparison post-test, in addition to regression analyses. Groups were first analyzed separately (Female, AM; Female, PM; Male, AM; Male, PM), and combined for further analysis if no significant age-related difference was found between them. Outliers above four S.D. from the mean were redacted.
RESULTS
Large extracellular Aβ in the CA1 subregion of the 3xTg-AD mouse hippocampus detected by 6E10 and mOC78 antibodies at 16 months of age
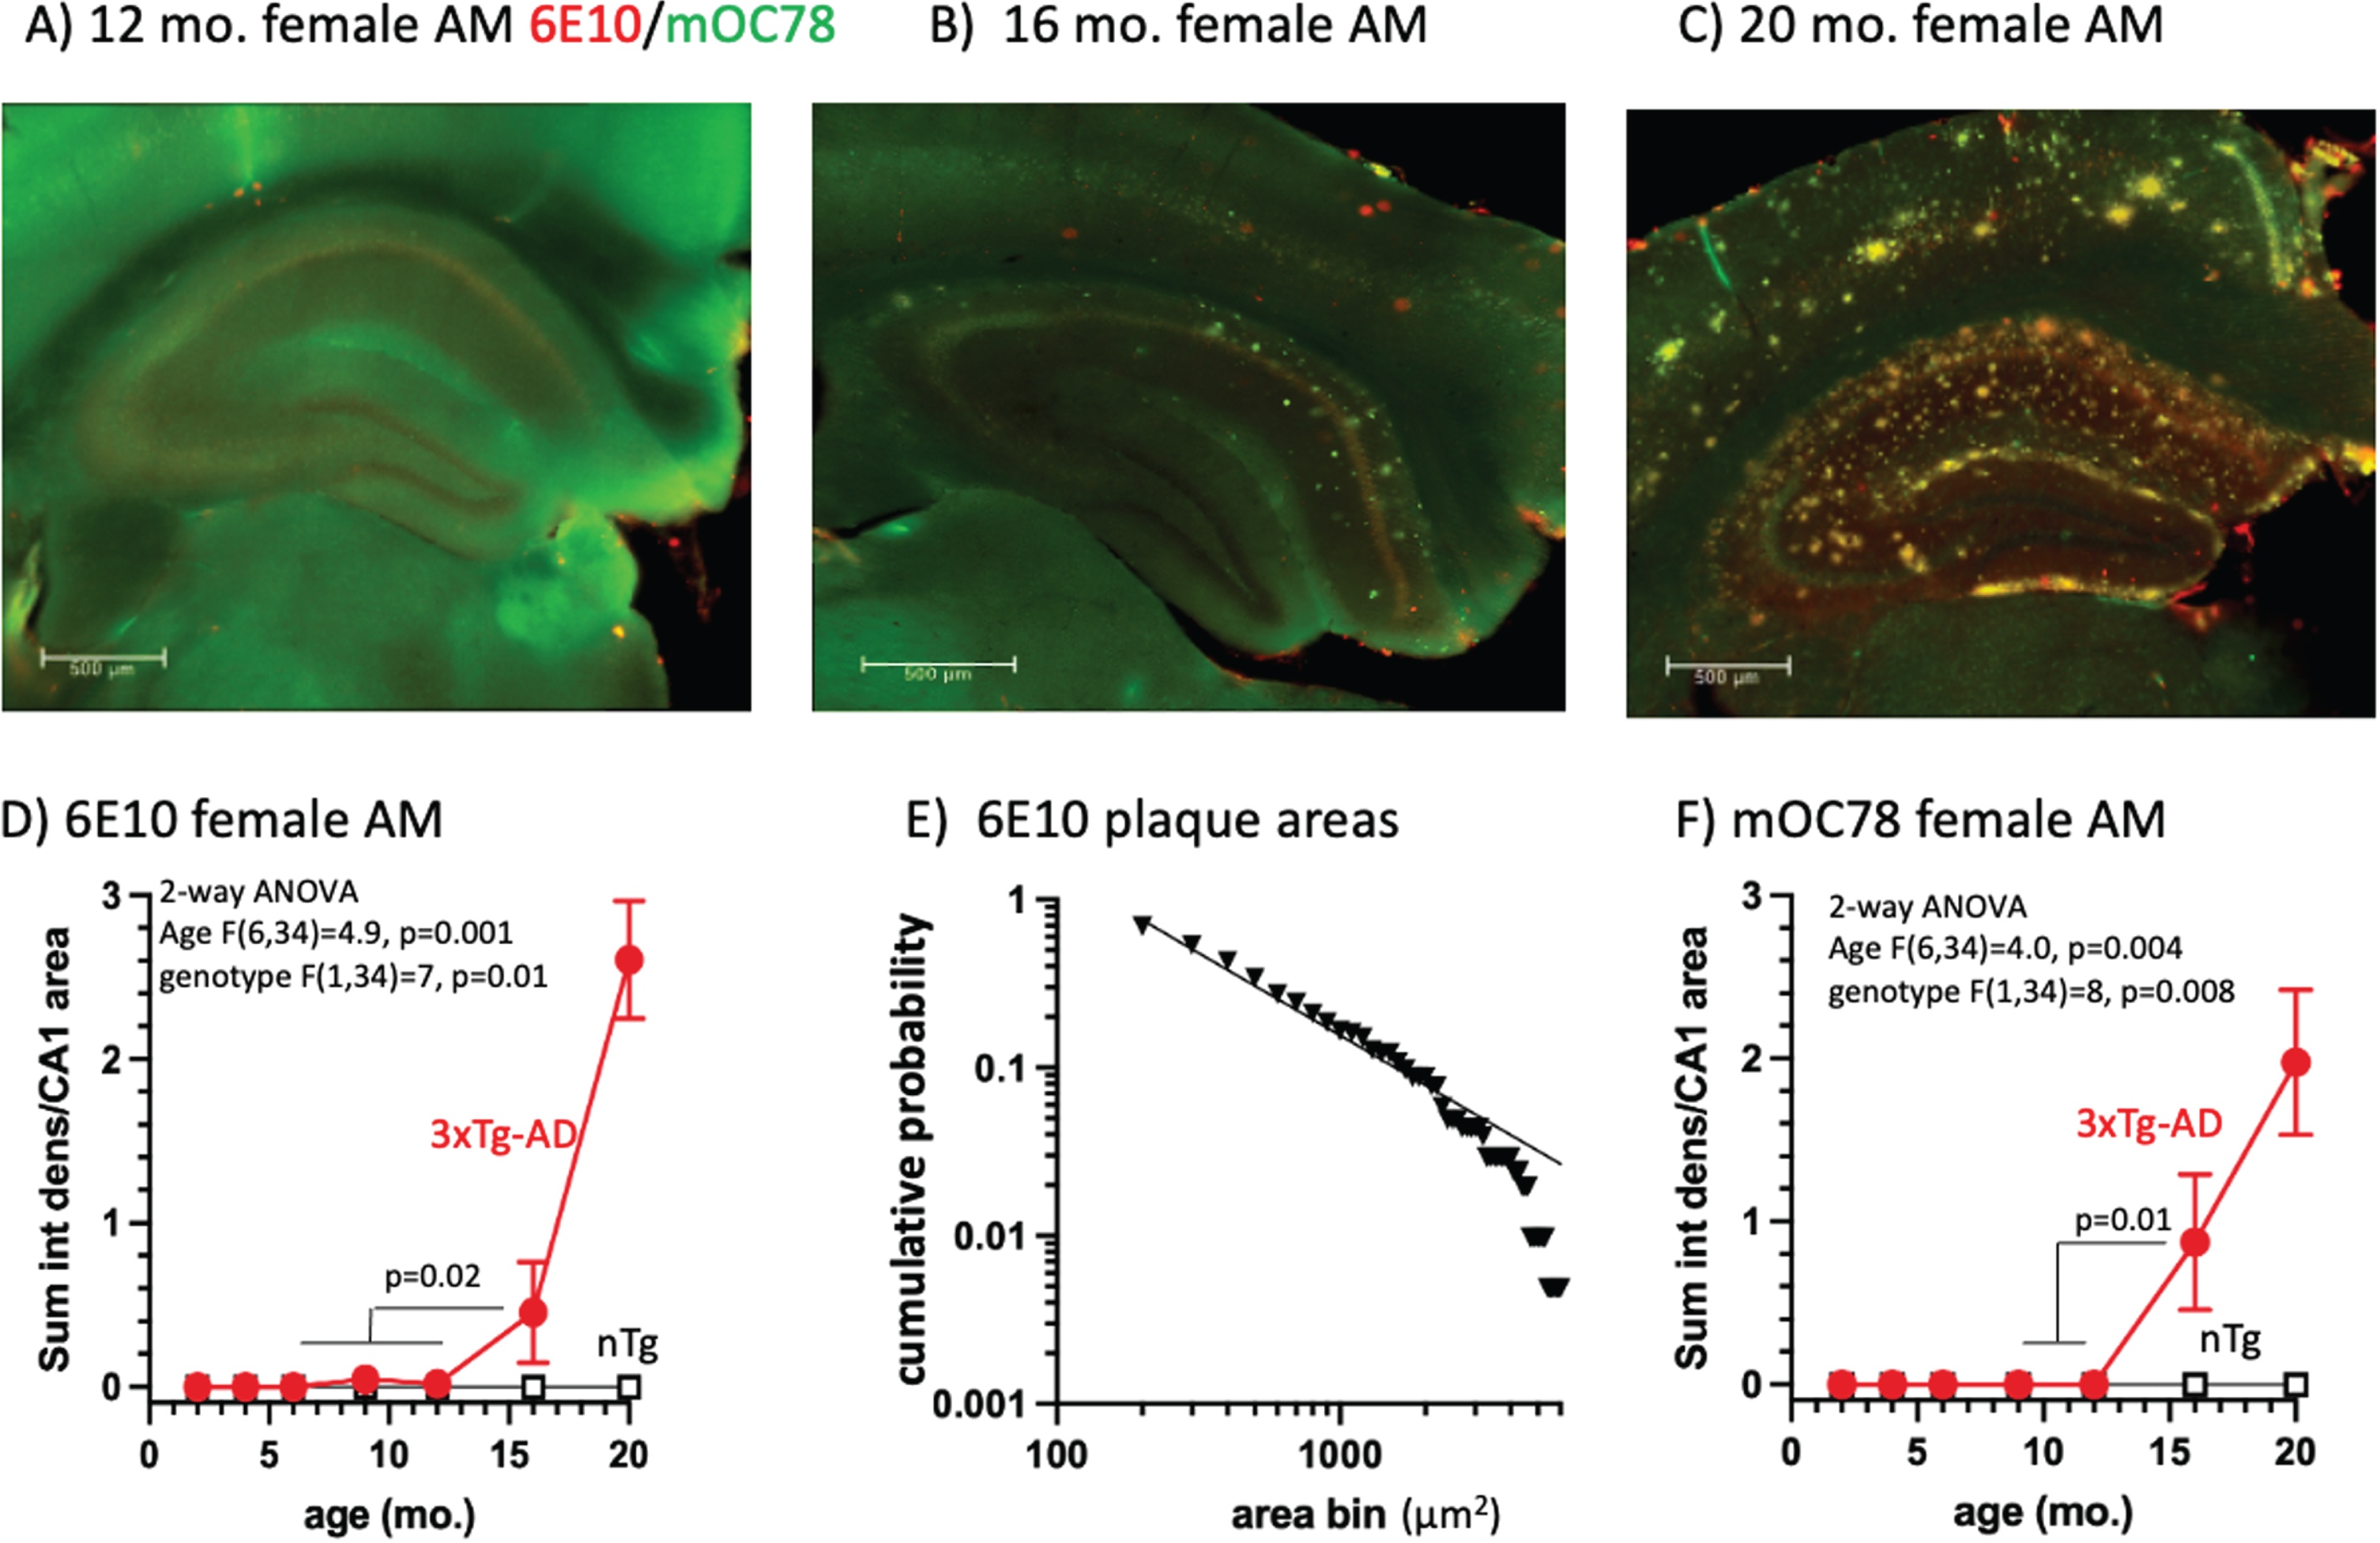
To profile the development of Aβ aggregates across the lifespan of 3xTg AD-model mice, we performed immunostaining of brain sections using 6E10, an antibody that recognizes exposed residues 5–7 of the human Aβ peptide [51], and mOC78 antibodies that recognize a conformational epitope at positions 8–11 and 24–26 [52] of aggregates of oligomeric mouse and human Aβ peptide and other amyloids [7]. We examined the staining of large aggregates and plaques (>80 μm2) in CA1 of the hippocampus, a region that is known to be affected early in AD [53]. We sampled three mice per age of each sex, each in the morning (AM) and evening (PM) to detect circadian variations [41, 54]. We found that large extracellular 6E10 deposits began to appear at 16 months of age (Fig. 1A, B, D) in female mice sampled in the AM (t-test, p = 0.02), and were abundant at 20 month (Fig. 1 C, D). The age and genotypic differences were more prominent in females than males only in the AM (p = 0.01), and larger in the AM than PM (p = 0.03) for brain collection (Supplementary Table 1). Including all AM and PM, males and females, genotype differences were prominent, since nTg immunoreactivity was virtually zero (n = 84/genotype, p = 0.004 and age, p = 0.0008). The size of these plaques was log-log distributed (Fig. 1E; R2 = 0.98), suggesting a snowball effect of seeding, once started [55, 56]. To complement these findings, we quantified large extracellular mOC78 aggregates, which were also not detected until 16 months of age in females in the AM (Fig. 1C, F, p = 0.01). ANOVA of the various mOC78 stains by group indicated significant overall effects of genotype (p = 0.003) and age (p < 0.0001) (Supplementary Table 2). Signals were stronger for females over males only in the AM (p = 0.008). These results suggest that the pathologic aggregated form of Aβ detected by mOC78 is part of the same pathway that increases 6E10 aggregates beginning around 16 months of age.
Fig. 1
A) 3xTg-AD hippocampus at 12 months with background levels of 6E10 (red) and mOC78 (green). Scale is 500 μm. B) Scattered deposits of extracellular 6E10 in cortex and mOC78 in CA1 and cortex. C) Prominent deposits of extracellular 6E10 and mOC78 in CA1 and cortex (yellow is overlap). D) Quantitative analysis indicates the rise in 6E10 above zero begins at 16 months. E) Log-log distribution of plaque areas in CA1 from 100 to 2000 μm2. F) mOC78 CA1 deposits jump above zero at 16 months.
Intracellular 6E10 Aβ and mOC78 Aβ aggregates in CA1 pyramidal cells at 9 months of age precede extracellular accumulation
To analyze intracellular Aβ, we created regions of interest specifically around the CA1 layer of pyramidal neurons (Fig. 2). Immunoreactivity was relatively weak in nTg brains, as expected (Fig. 2A). In 3xTg-AD mice, we found an abrupt two-fold increase of 6E10 in the pyramidal layer of the CA1 between 6 and 9 months (Fig. 2B-D). We also saw a two-fold more incremental increase in mean intensity in the non-transgenic (nTg) wildtype increasing steadily with age from 2 to 20 months (Fig. 2D). When comparing 3xTg-AD mice to wildtype, we see that in 3xTg-AD mice, there is consistently about two times higher 6E10 mean intensity (Fig. 2D). When looking specifically at female mice sacrificed in the morning, we see the same pattern, but a stronger increase in the 3xTg-AD mice between 6 and 9 months (Fig. 2E). There was no significant difference in 6E10 with time of sacrifice (Fig. 2F). We do, however, see a sex effect with female mice showing the greater increase (Fig. 2E, G; Supplementary Table 3).
Fig. 2
Age-dependence of intracellular CA1 6E10 and mOC78 immunoreactivity with a large increase at 9 months. A) Low 6E10 immunoreactivity in a 6-month-old female nTg brain. B) Only faint stain in a 6-month-old female 3xTg-AD mouse brain. C) Much stronger stain intensity in the CA1 pyramidal layer of a 9-month-old 3xTg-AD brain. D) Genotype comparison across the age-span shows large increase in 6E10 intensity from 6 to 9 months in 3xTg-AD brains (n = 12 brains/point). E) Largest effect of 9 months rise in 6E10 in female AM mice (n = 3 brains/point). F) Age-effect without a difference between 6E10 3xTg-AD brains collected in the AM versus PM (n = 6 brains/point, male and female combined). G) Female 6E10 increase at 9 months compared to male 3xTg-AD (n = 6 brains/point, AM and PM combined). H) mOC78 merged AM, PM, male and female indicate 9, 12, and 16 and 20 months brains jump higher in than 2, 4, and 6-month-old 3xTg-AD brains and nTg steadily increases with age (n = 12 brains/point). I) mOC78 female brains harvested in the AM compared by age and genotype (n = 3 brains per point). J) mOC78 female brains harvested in the PM (n = 3 brain/point). K) Female mOC78 levels are higher than male levels (n = 3 brains/point).
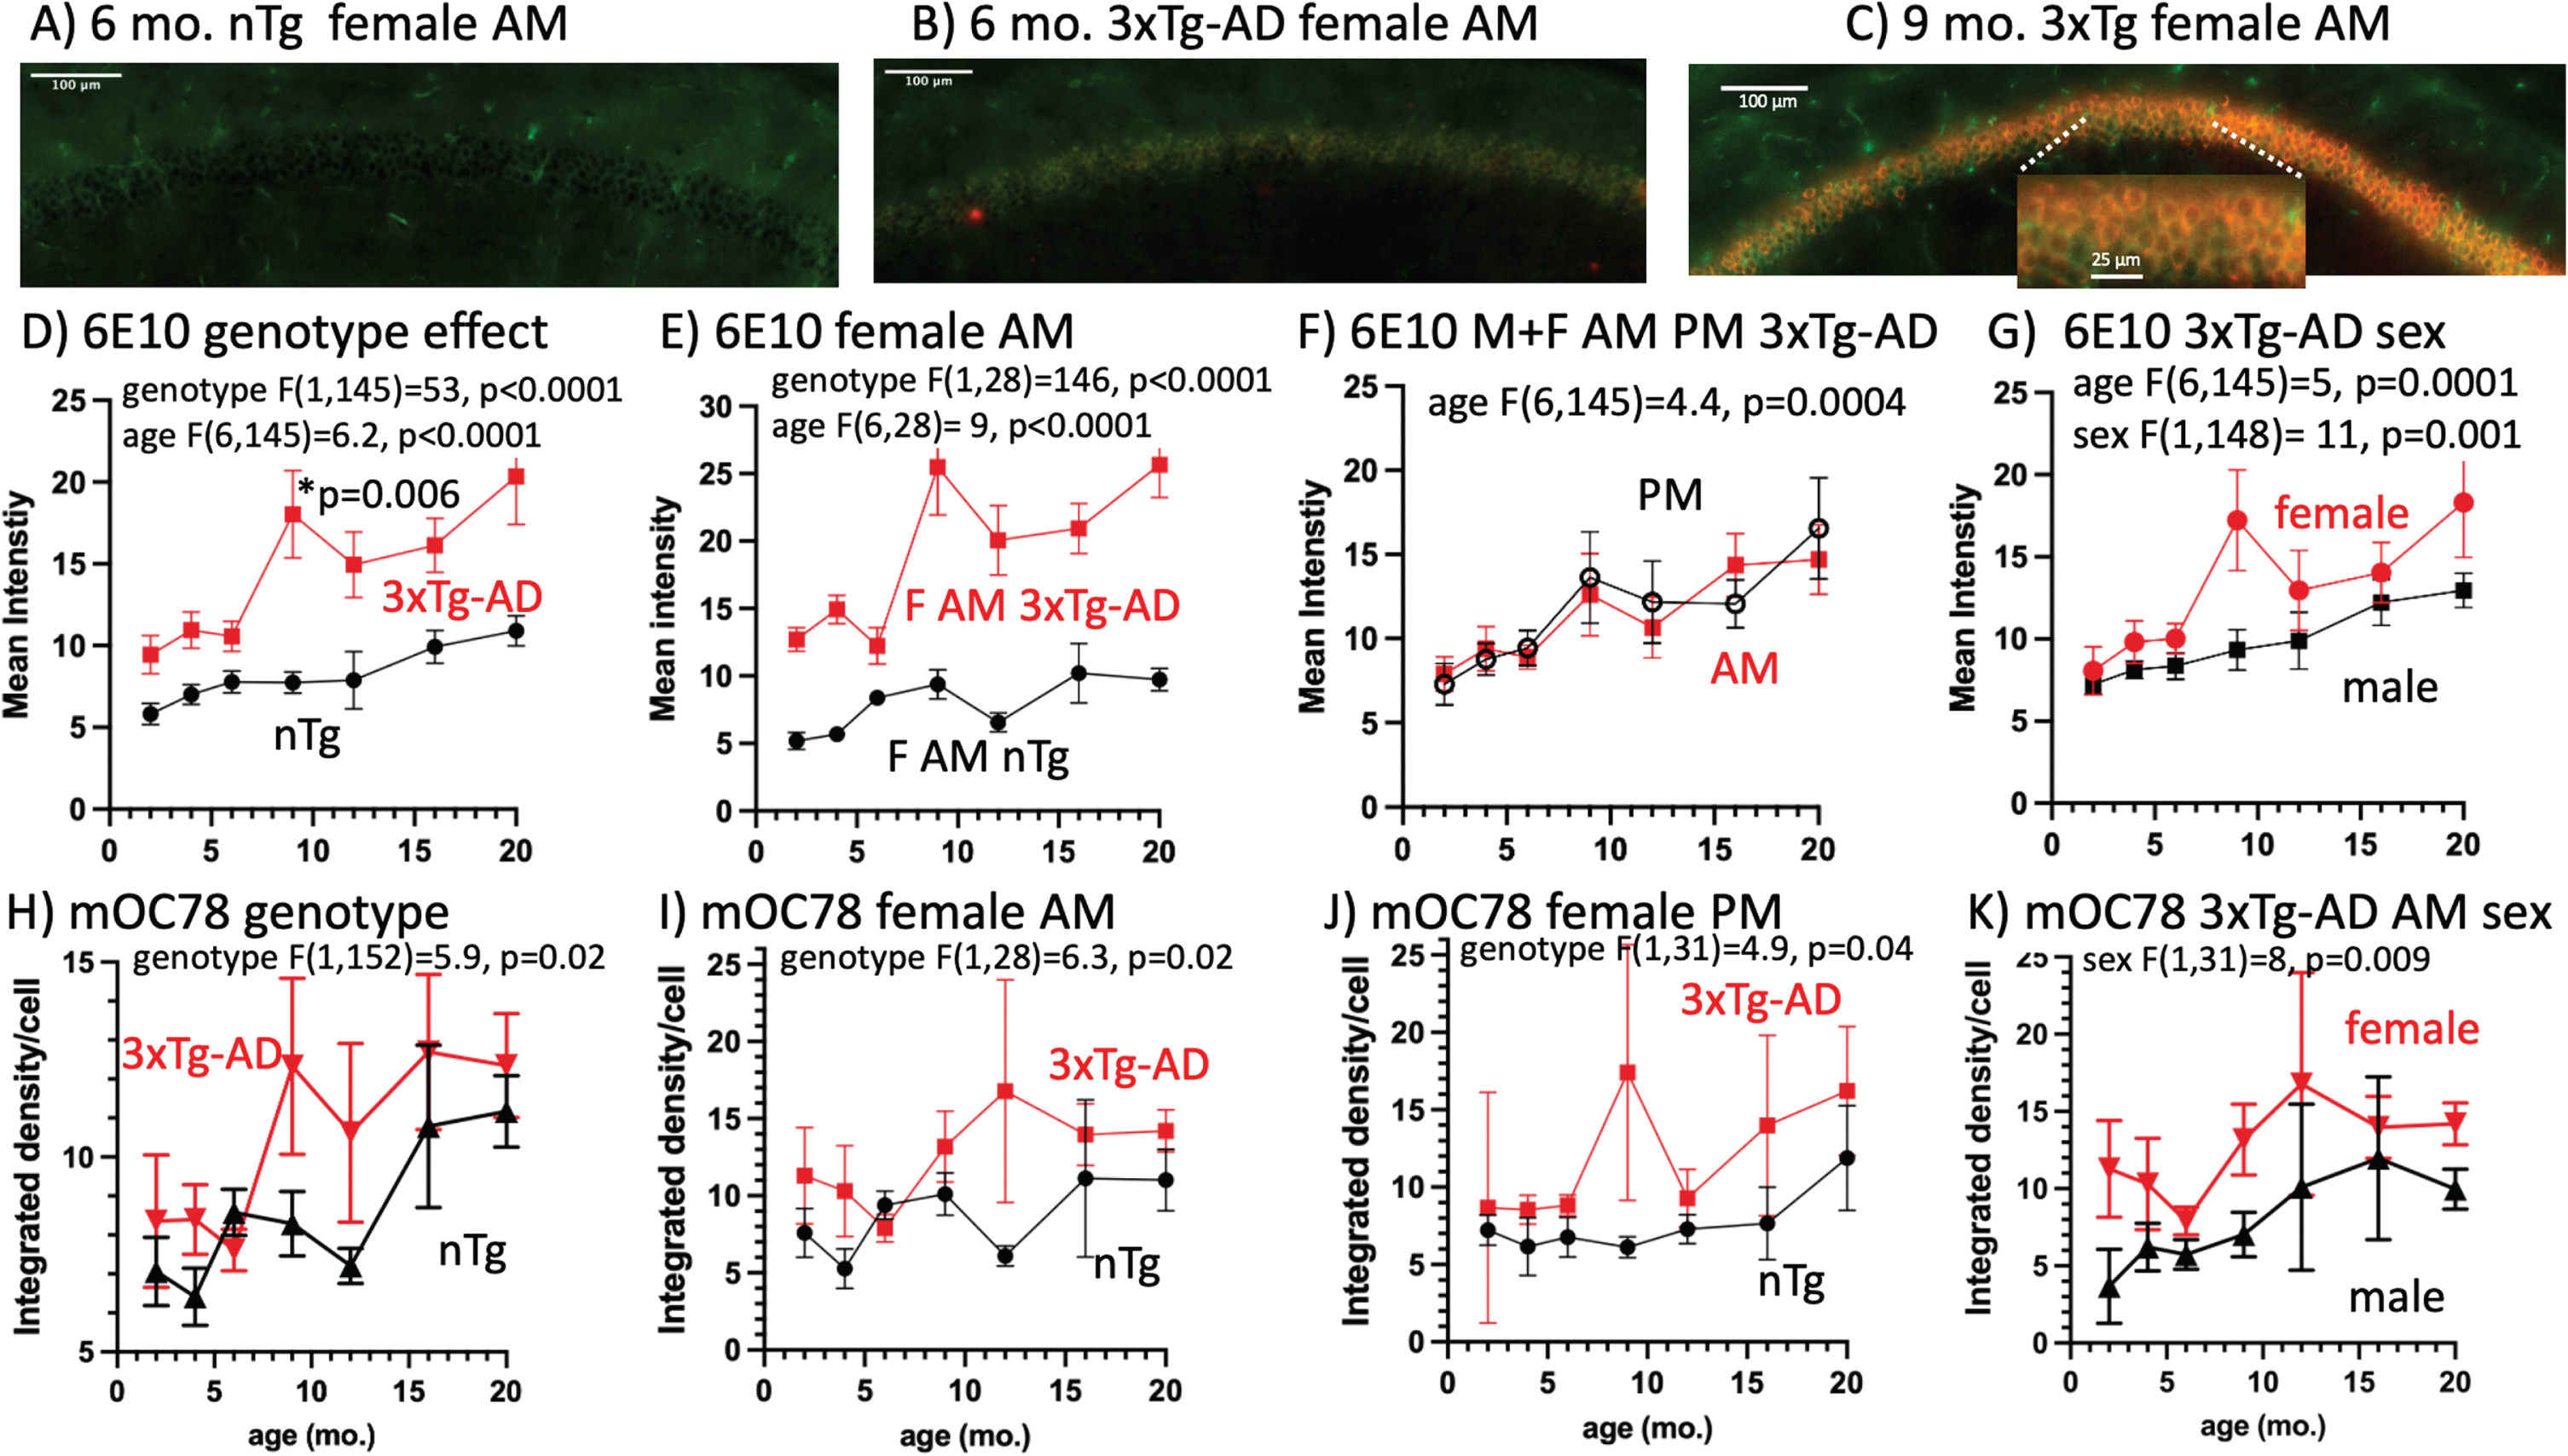
Previous studies have shown that misfolded and aggregated protein can be detected using the mOC78 antibody at 10 months of age in 3xTg-AD mice [7] and other protein aggregates in MCI brains [57]. Neuritic plaques that form subsequently share the same intracellular amyloid immunostaining, suggesting that these plaques originate from exocytosed Aβ or from neurons that have degenerated following intracellular amyloid toxicity. To examine the contribution of mOC78 intracellular Aβ to extracellular plaques, we looked at intracellular mOC78 aggregates across the lifespan. Pooling AM, PM, males, and females for 12 brains per age and genotype indicated a significant rise in mOC78 in the old brains (9, 12, 16, and 20 months compared to the young ones (2, 4, and 6 months) (Fig. 2H, p = 0.02). Interestingly, nTg brains also began a rising reversal with a slight delay at 12 months. We found that female brains collected in the AM showed significantly greater mOC78 accumulation of Aβ, beginning at 9 months compared to nTg brains (Fig. 2I, p = 0.02). Female brains collected in the PM also accumulated more mOC78 Aβ than nTg brains (Fig. 3J, p = 0.05), with an overall effect of higher mOC78 in females than males combining both genotypes (Supplementary Table 4). Female brains displayed higher mOC78 Aβ than males (Fig. 2K, p = 0.05). These ANOVAs showed no higher mOC78 in the AM than PM when the genotypes were combined (Supplementary Table 4).
Fig. 3
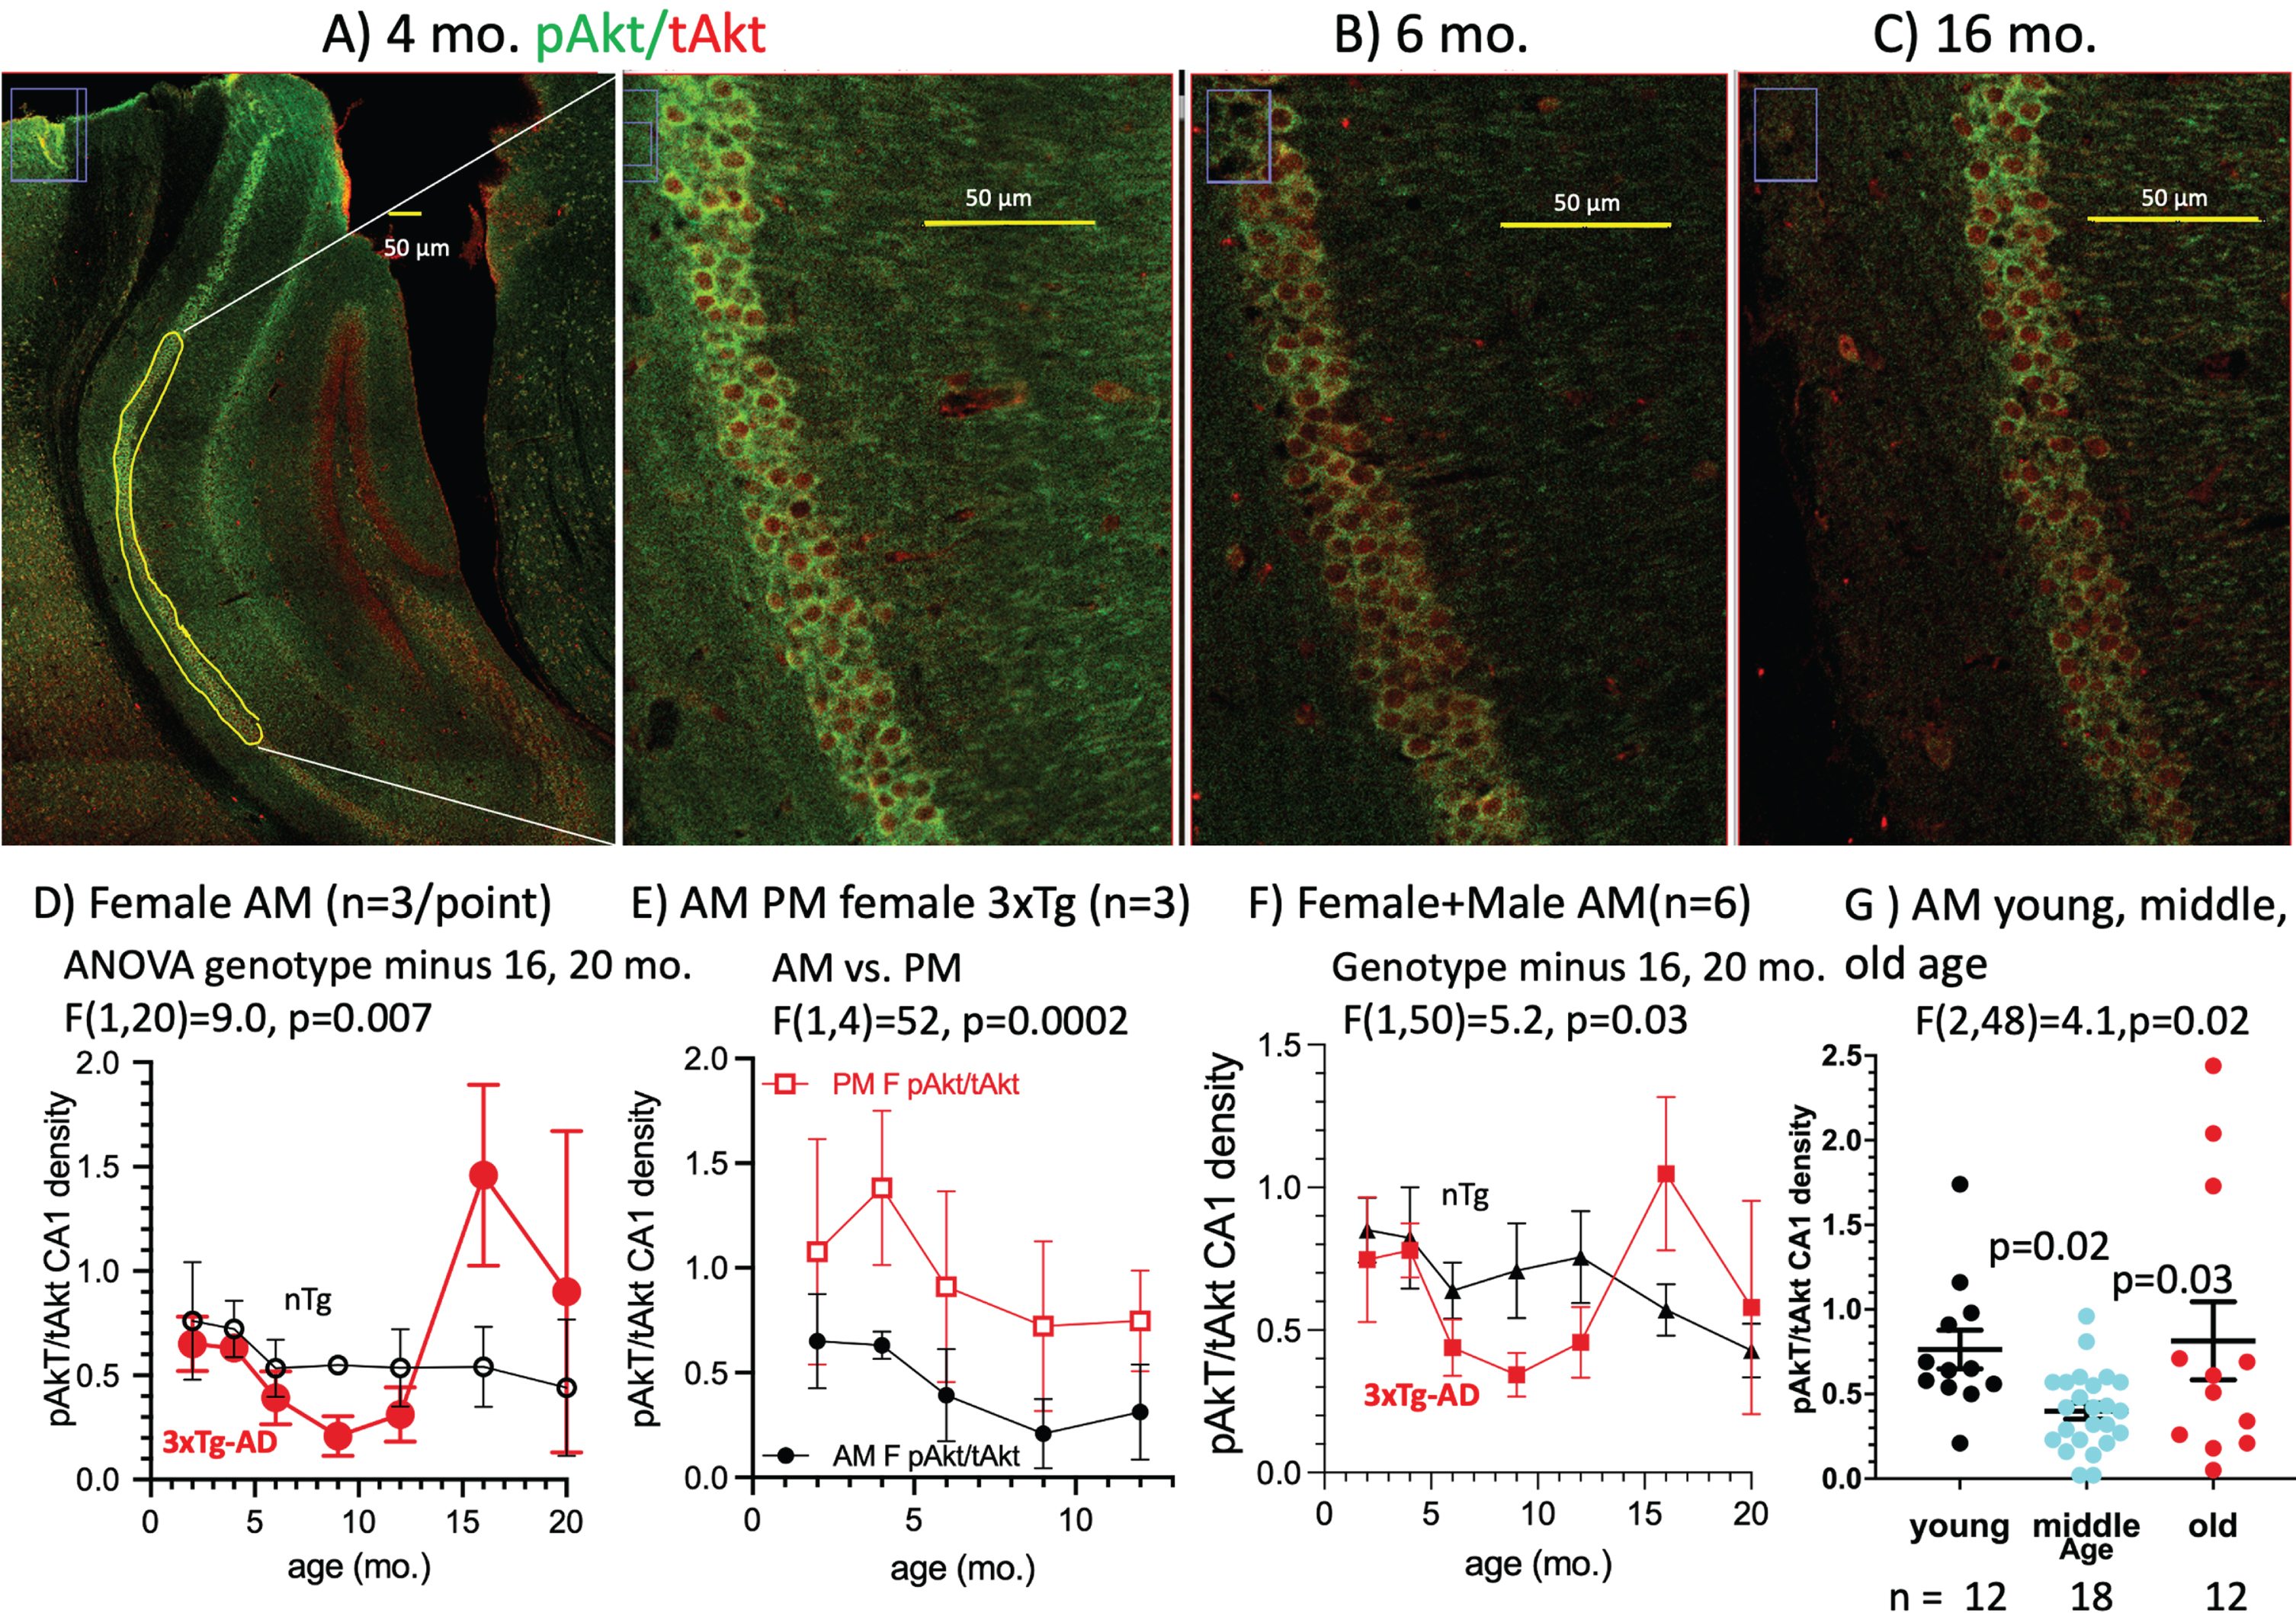
Age and genotype changes in pAkt/tAkt ratio in CA1 pyramidal neurons. A) In this 4-month-old female 3xTg-AD harvested in the AM, the pAkt/tAkt ratio was brighter than B) in a 6-month-old female AM brain (pAkt (green), tAkt (red)) due to a decrease in pAkt. C) A 16-month-old female AM brain with a higher ratio of pAkt/tAkt due to lower tAkt. Across the age-span, the pAkt/tAkt ratio in D) female AM mice dipped lower in middle-age, then higher in old age. E) Ratios in the female AM were lower than in the PM. F) 3xTg-AD ratios for males and females combined dipped lower than similar nTg brains. G) Age effects for AM females plus males combined and grouped by young (2 and 4 months), lower middle-age (6, 9, and 12 months) ratios and elevated ratios in old brains (16 and 20 months).
In the CA1 pyramidal cells of 3xTg-AD mice, these results reveal that intracellular 6E10 Aβ and mOC78 Aβ aggregates accumulate rapidly from 6–9 months of age, before the extracellular evidence of 6E10 plaques can be detected at 16 months. This time course shows the progression from intracellular to extracellular Aβ accumulation that suggests the hypothesis that cognitive defects in AD are caused more by intracellular Aβ than extracellular plaques. The rise in mOC78 with age in the nTg brains suggests that heightened transgene production of Aβ protein in the 3xTg-AD brains and aggregation is not the original trigger for intracellular protein aggregation, but that some other aspect of aging physiology may be an upstream cause.
Phospho-Akt, an indicator of cell metabolism, decreases with age prior to the accumulation of intracellular Aβ
Akt (protein kinase B) is a PI3K-dependent serine/threonine kinase in the mTOR pathway that is important for metabolism, cell survival, and proliferation. Using active Akt as a metabolic readout, we performed immunofluorescence staining to quantify phospho-Akt (active; pAkt) normalized to total Akt (tAkt) in the CA1 pyramidal cell layer in mouse brain sections. We found that pAkt levels were high at 4 months of age, decreased at 6 months, and increased again at 16 months of age (Fig. 3A-C). This could indicate that following a pathological decline in pAkt with age, an inflammatory mechanism over-reacts with high levels at 16 months that exceeded levels observed at the younger ages. We found that the pAkt/tAkt ratio in females decreases early from 2–4 months of age, prior to the observed rise in 6E10 or mOC78 intracellular Aβ. There was a 52% decrease from 6–12 months in the 3xTg-AD, but not in the nTg mice (Fig. 3D). There was no significant difference between pAkt/tAkt levels in male and female 3xTg-AD mice in the AM (Fig. 3E) and combining mice of both sexes accentuates the early decrease in the pAkt/tAkt ratio by genotype (Fig. 3F). There was a significant decline in pAkt/tAkt in the 3xTg-AD mice in the AM with middle age (p = 0.03) (Fig. 3G). A bimodal distribution becomes apparent in the old age group (Fig. 3G). This suggests that pAkt/tAkt levels that are either too high or too low are pathological. In addition, we found there to be a circadian difference in pAkt/tAkt levels in the female 3xTg-AD mice (p = 0.002), but not in the male mice (Supplementary Table 5). This table displays details of ANOVA comparisons among the different conditions.
An age-related decrease in the reduced antioxidant form of glutathione precedes the appearance of 6E10 intracellular Aβ
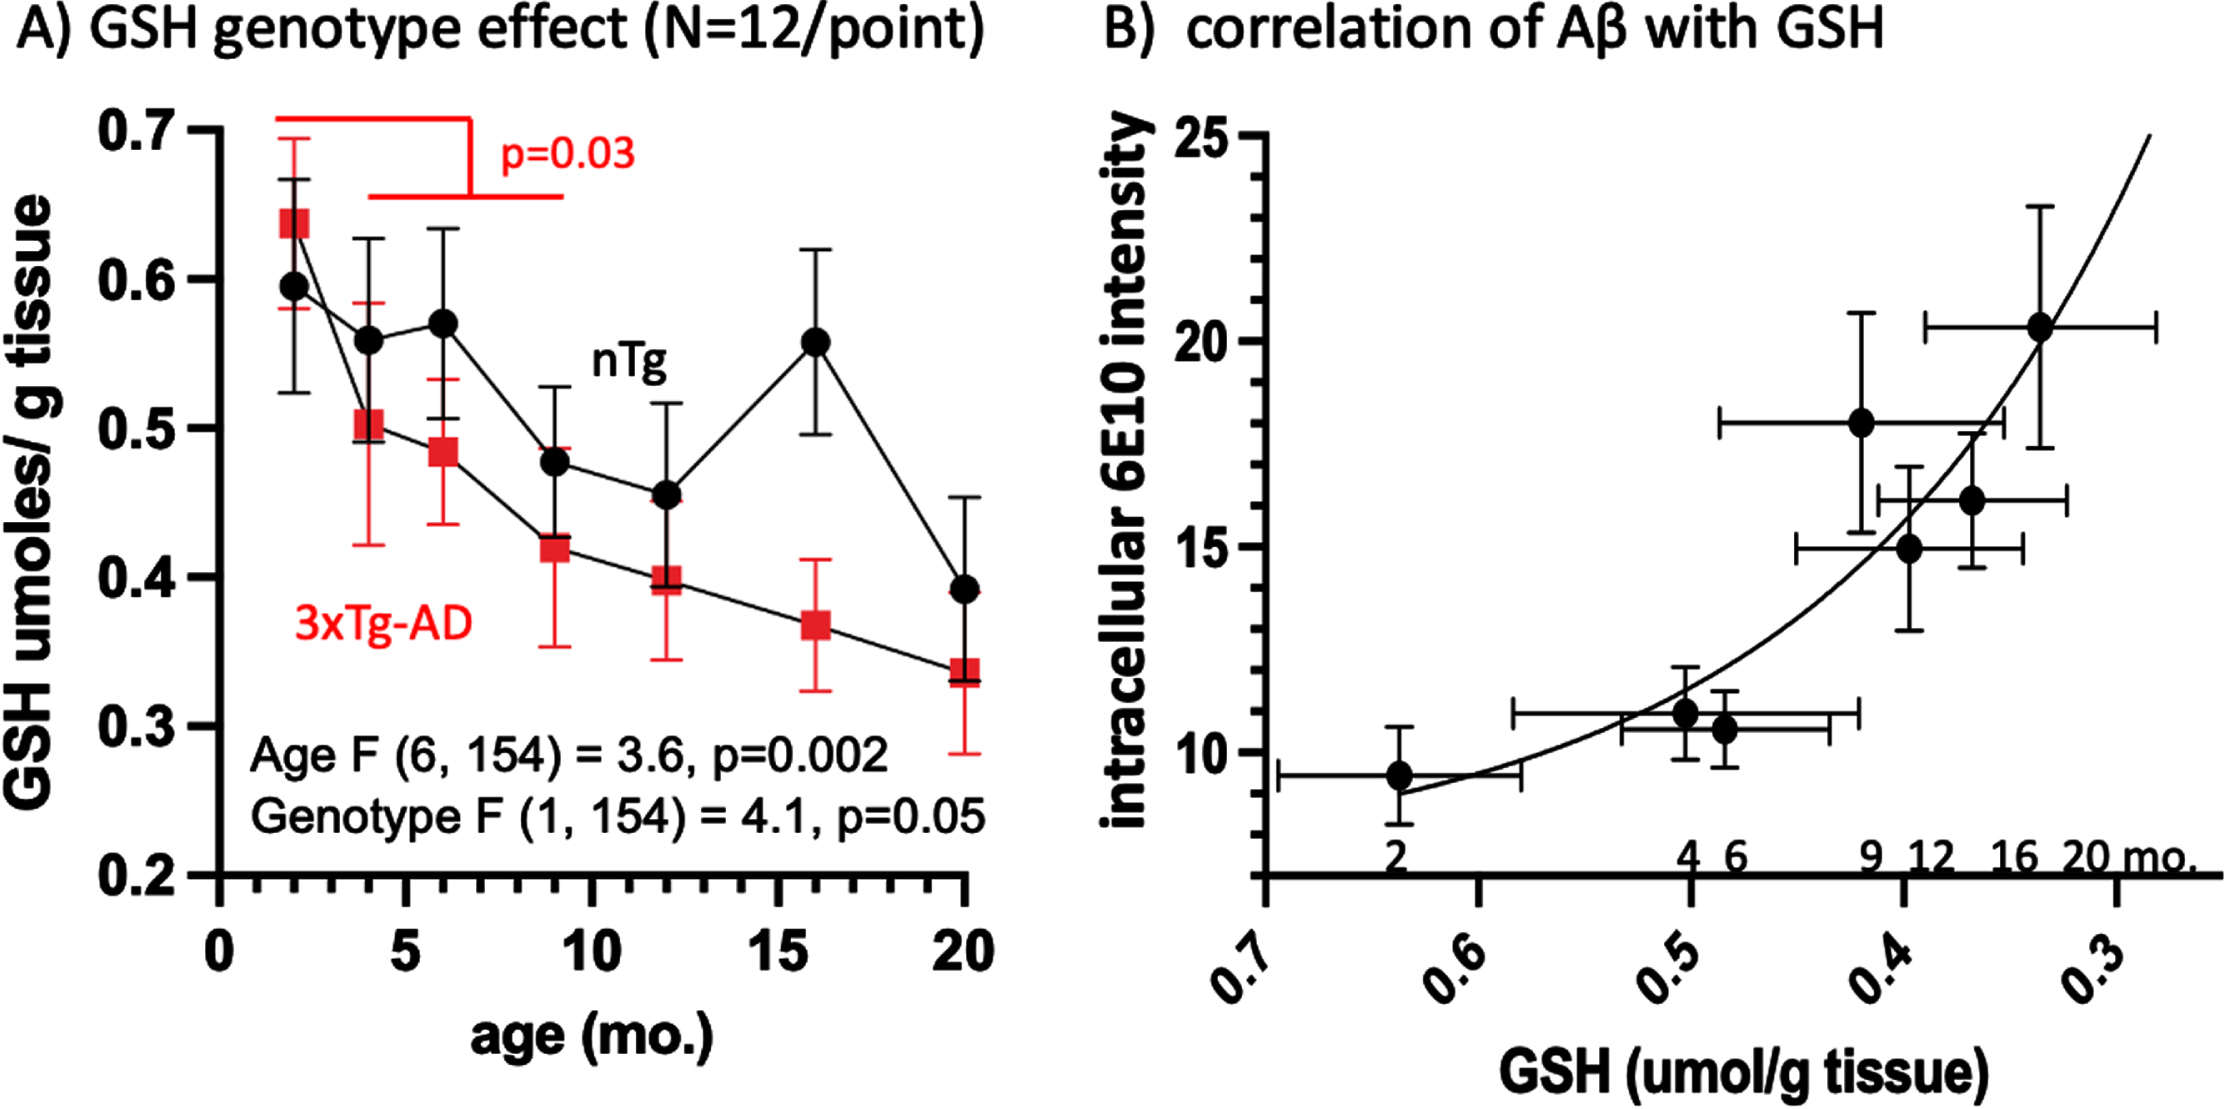
The reduced, protective form of GSH serves as the cell’s primary redox buffer, neutralizing free radicals and protecting the cell from oxidative stress. We quantified GSH levels in the left hemisphere of the mouse brain by monitoring an enzymatic recycling reaction using glutathione reductase. We found that GSH decreases over the lifespan in both nTg and 3xTg-AD mice (p = 0.002), with overall GSH levels lower in 3xTg-AD mice than in the nTg (p = 0.05) (Fig. 3A). This effect was exacerbated at 4 months of age (Fig. 3A) and was significant for the 3xTg-AD by comparison of 2 month to 4, 6, and 9 months combined (p = 0.03). In addition, low GSH levels correlate with the observed increase in CA1 pyramidal layer intracellular Aβ (Fig. 4B). From 2 to 4 months of age, GSH levels decreased by 22%, correlating with an exponential rise in 6E10 intracellular Aβ. These results suggest that the reduction in GSH with age may be a driving factor for the accumulation of intracellular Aβ. Due to larger variances in the GSH measures for whole brain, significance by ANOVA was only seen with larger sample sizes in combining AM PM and males and females (Supplementary Table 6). Perhaps samples of brain hippocampus or even CA1 would reach significance for the trends seen for circadian and sex differences.
Fig. 4
GSH declines early at 4 months and correlates with the rise in 6E10 Aβ. A) Brain GSH levels decline with age in 3xTg-AD faster than in nTg, with an early accelerated drop from 2 to 4 months (t-test of 2 months versus 4, 6, and 9 months, p = 0.03). B) Correlation of 3xTg-AD intracellular CA1 6E10 rises exponentially with a decline in GSH (reverse scale) (6E10 = 113*exp(-6.5*GSH) + 7.2, R2 = 0.83. Numbers indicate age of animals.
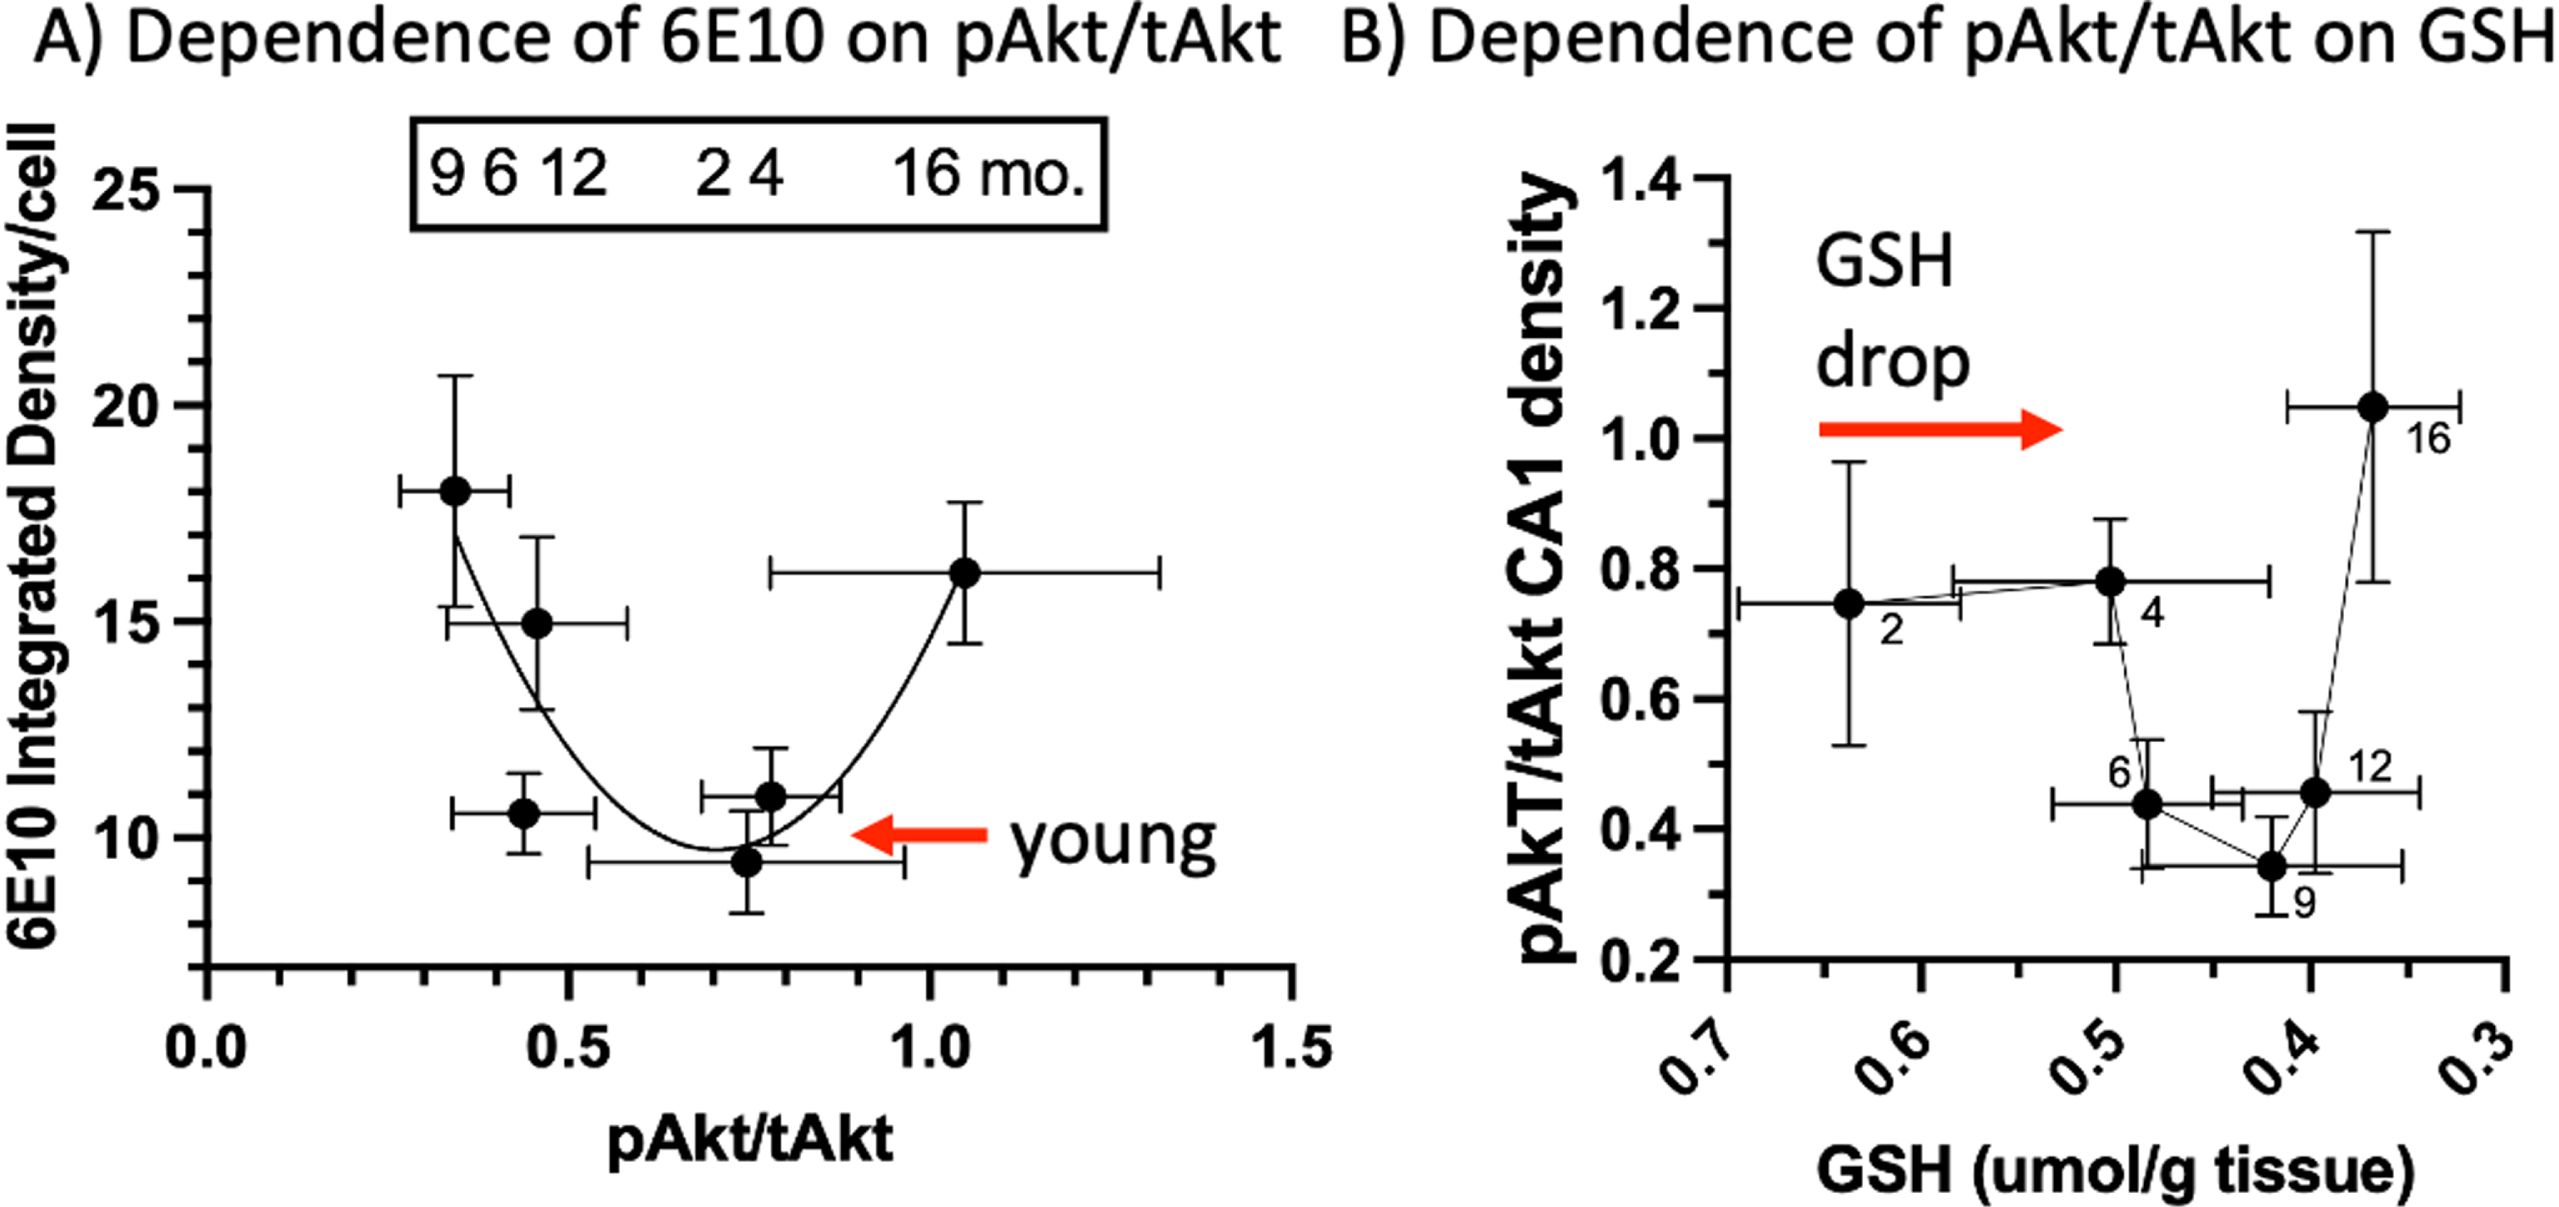
Correlations of pAkt/tAkt with 6E10 Aβ and GSH
We observed a U-shaped relationship of pAkt/tAkt levels for AM 3xTg-AD males and females combined compared to intracellular 6E10 and mOC78 Aβ accumulation (Fig. 5A). From the nadir of pAkt, the left side shows the rise in 6E10 correlated with the drop in pAkt/tAkt. The right side shows that a rise in pAkt/tAkt also associated with elevated iAβ. The relationship of GSH and pAkt/tAkt is also U-shaped (Fig. 5B). While GSH drops 23% from 2 to 4 months of age without a change in pAkt/tAkt, further declines in GSH were associated with the middle-age drop in pAkt/tAkt, before continued decline in old-age GSH was associated with the rise in pAkt/tAkt (Fig. 5B).
Taken together, these results characterize the timeline of pathological events across the lifespan of 3xTg-AD mice. An age-related decline in GSH occurs from 2 to 4 months, prior to the decrease in CA1 pyramidal cell pAkt/tAkt levels at 4 to 6 months. Intracellular Aβ accumulation can be detected in CA1 by 6E10 from 6 to 9 months of age and mOC78 at 9 months. Subsequently, extracellular plaques are first present at 16 months (6E10 and mOC78), with an increase in pAkt/tAkt levels co-occurring at 16 months of age. Our results are consistent with the hypothesis that age-driven redox changes in GSH drive pAkt/tAkt metabolic dysfunction within the brain to drive the accumulation of intracellular Aβ, which causes the pathologic extracellular accumulation of Aβ plaques in AD.
Fig. 5
U-shaped correlations of pAkt/tAkt with 6E10 Aβ and GSH. A) Mid-range pAkt/tAkt correlates with low intracellular CA1 6E10 while declines or elevations in this ratio correlate with higher 6E10 levels. B) Before a change in pAkt/tAkt ratios, GSH drops 23% from 2 to 4 months followed by a decline in pAkt/tAkt, then a rise in ratio as GSH declines further (reverse scale).
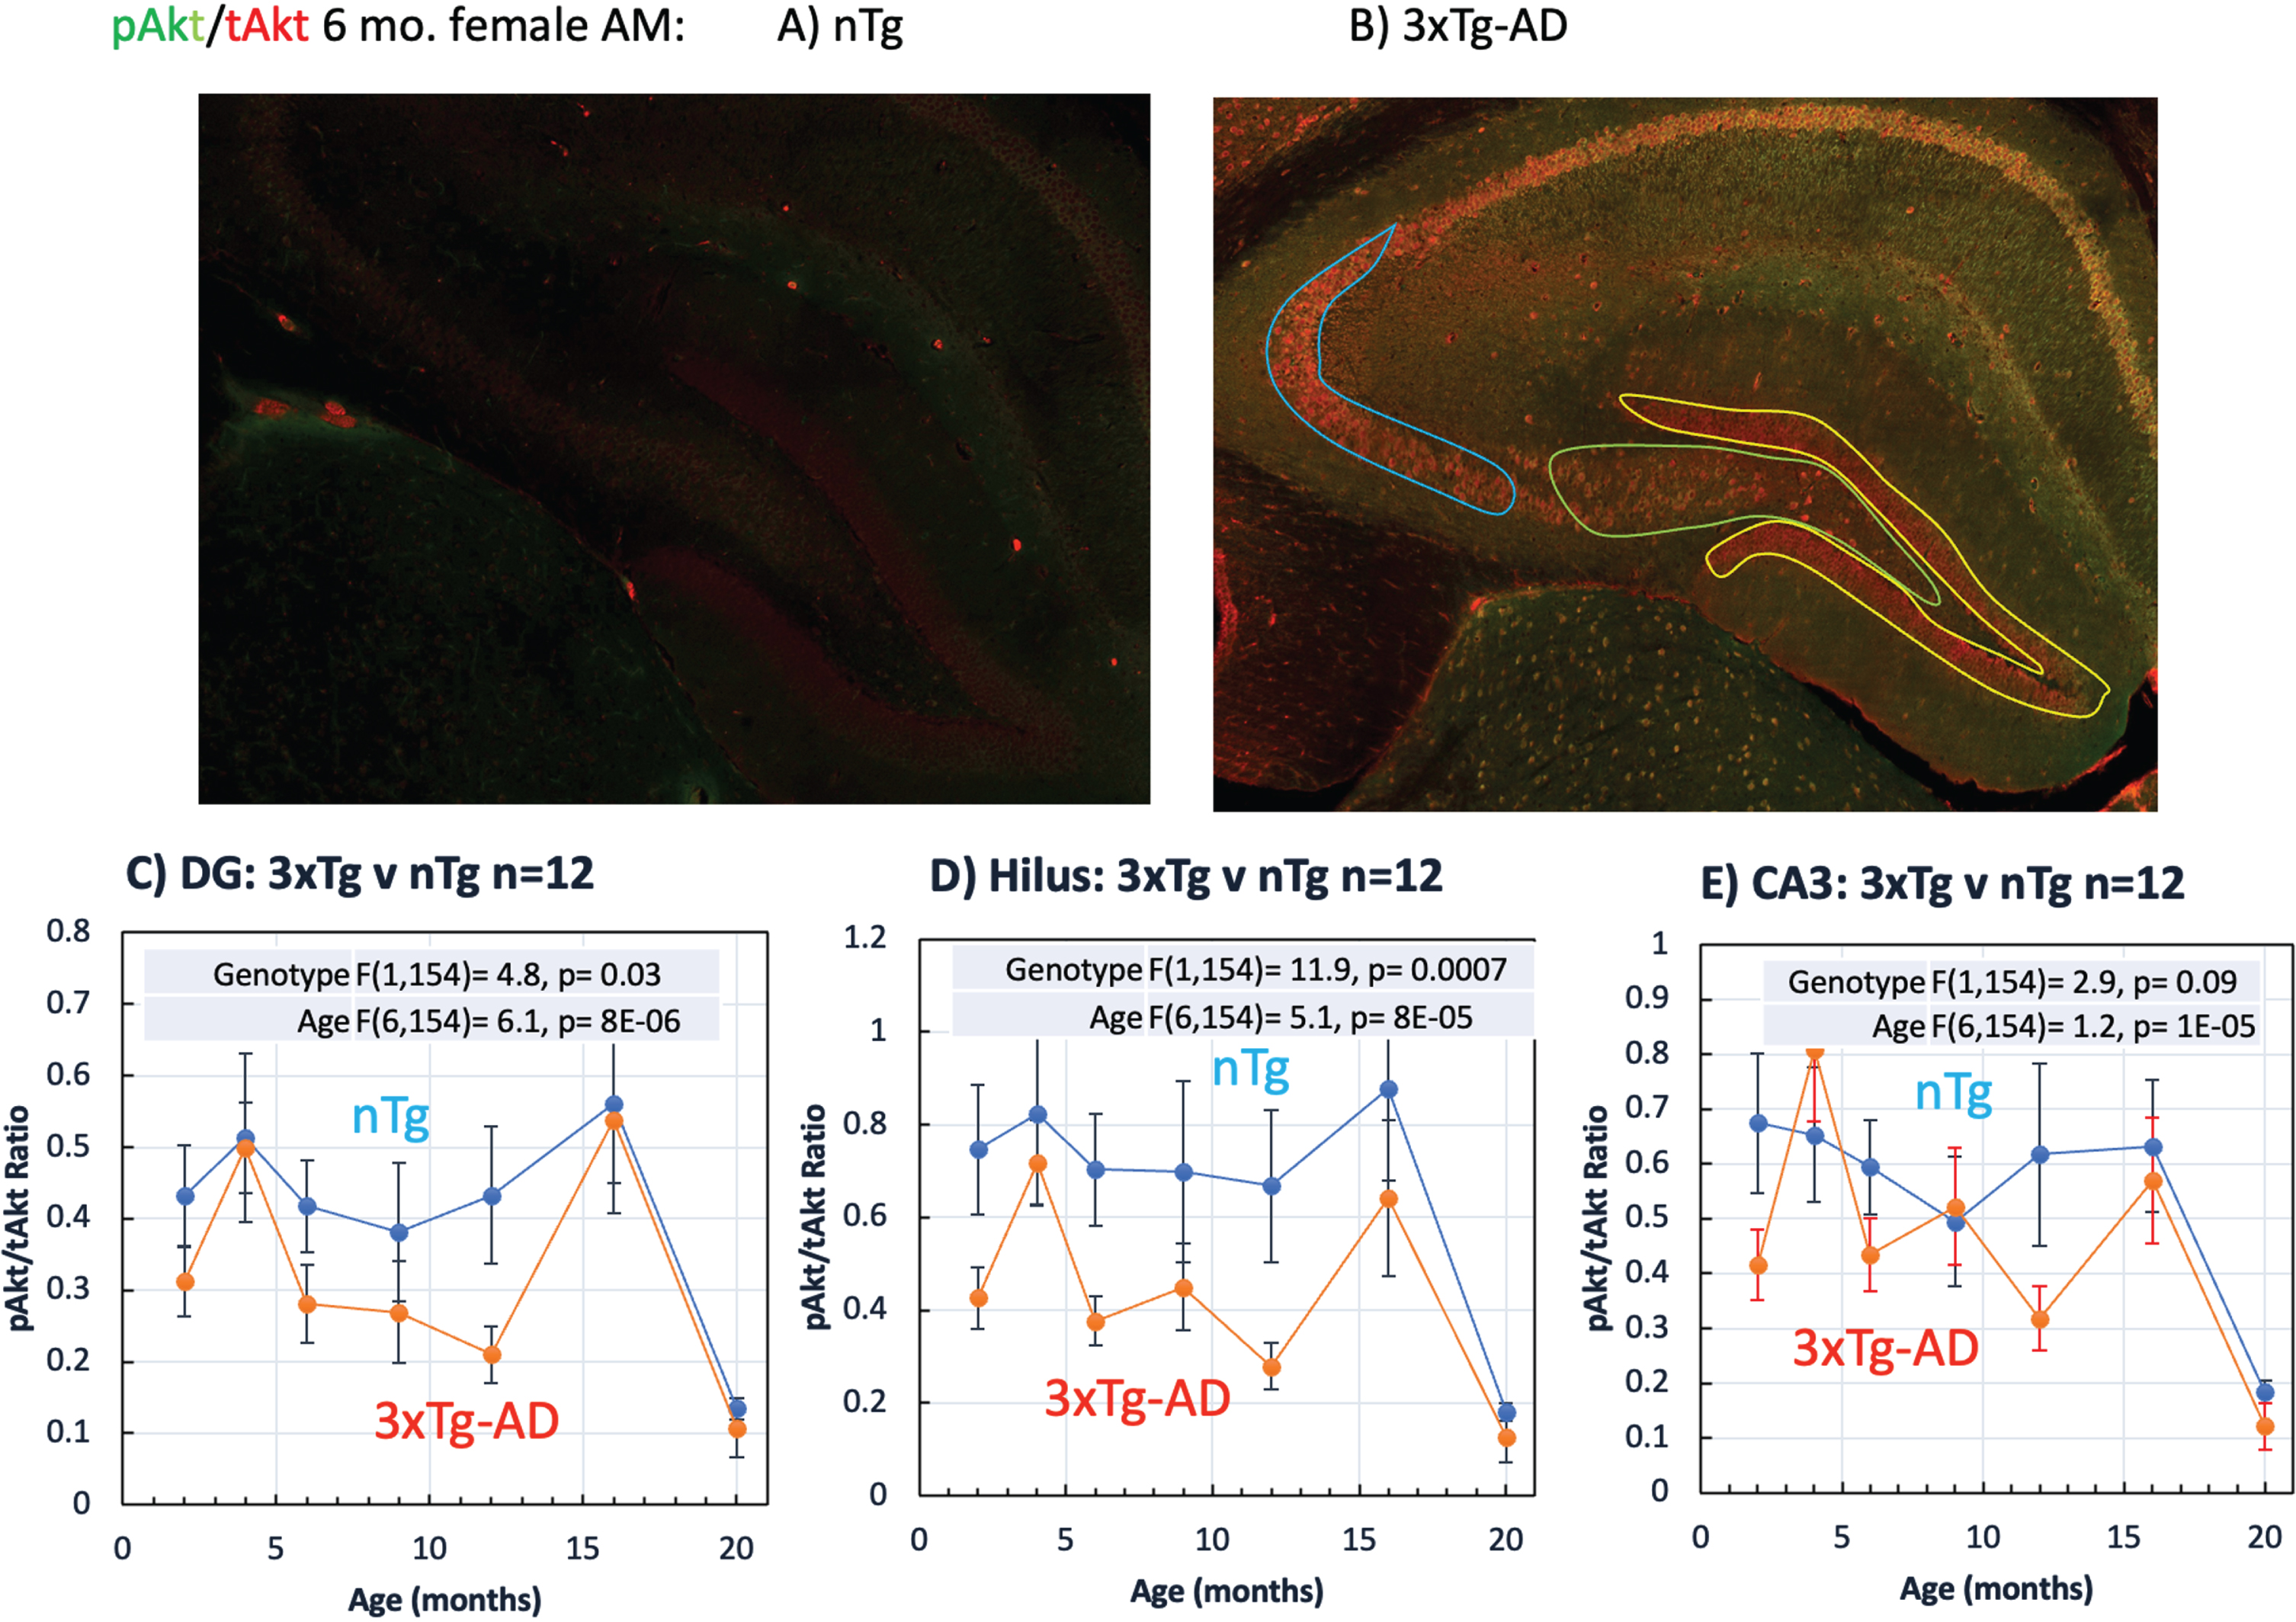
Selective vulnerability of pAkt changes with age in the dentate (DG), hilus, and CA3
CA1 and entorhinal cortex are known to be sites of higher synapse loss and greater density of extracellular deposition of Aβ-rich plaques in AD patients [53]. The 3xTg-AD mouse model is also known to show higher densities of plaque deposition in the CA1 and subiculum and iAβ [47] than other brain areas. Whether this selective vulnerability is due to metabolic changes signaled by pAkt is unknown. Here we measured pAkt/tAkt levels in the DG, hilus and CA3 as above in the CA1. The tAkt levels are much higher in this 6-month-old female AM 3xTg-AD brain than a corresponding nTg brain (Fig. 6A, B). Levels vary considerably between brains, which is why we use the ratio of pAkt/tAkt. The pAkt/tAkt ratio is lower in the DG and hilus of 3xTg-AD brains than the nTg brains in the middle-ages of 6–12 months (Fig. 6C, D), considering both sexes, AM and PM combined. Compared to the hilus (Fig. 6D), DG ratios (Fig. 6C) are about 50% lower because of the high tAkt in the DG denominator (see also Fig. 6B). The DG of 3xTg-AD brains also stain with a 40% lower ratio than nTg, especially in the middle-ages. Figure 6E shows the absence of a genotype effect in the CA3 subregion. Compared to the CA1 (Fig. 6D, E), lower pAkt/tAkt ratios in the DG and hilus are less robust and absent in CA3, demonstrating selective vulnerability of this metabolic sensor.
Fig. 6
pAkt/tAkt ratios in the dentate gyrus (DG), hilus, and CA3 demonstrate selective vulnerability. A) Low pAkt and tAkt levels in a 6-month-old female nTg brain harvested in the AM. B) Higher pAkt and tAkt staining in a 6-month-old female AM 3xTg-AD brain that varies by subregion: higher tAkt (red) in the DG (yellow outline) than the hilus (green outline) or CA3 (blue outline). All regions experience a decline in pAkt/tAkt ratio with age, especially at 20 months. Compared to nTg female brains collected in the AM, C) DG female AM 3xTg-AD pAkt/tAkt ratios were lower, especially at 6, 9, and 12 months, D) similar hilus ratios were well separated from higher nTg ratios. E) CA3 3xTg-AD ratios were not significantly different. (n = 3 brains/point in all cases).
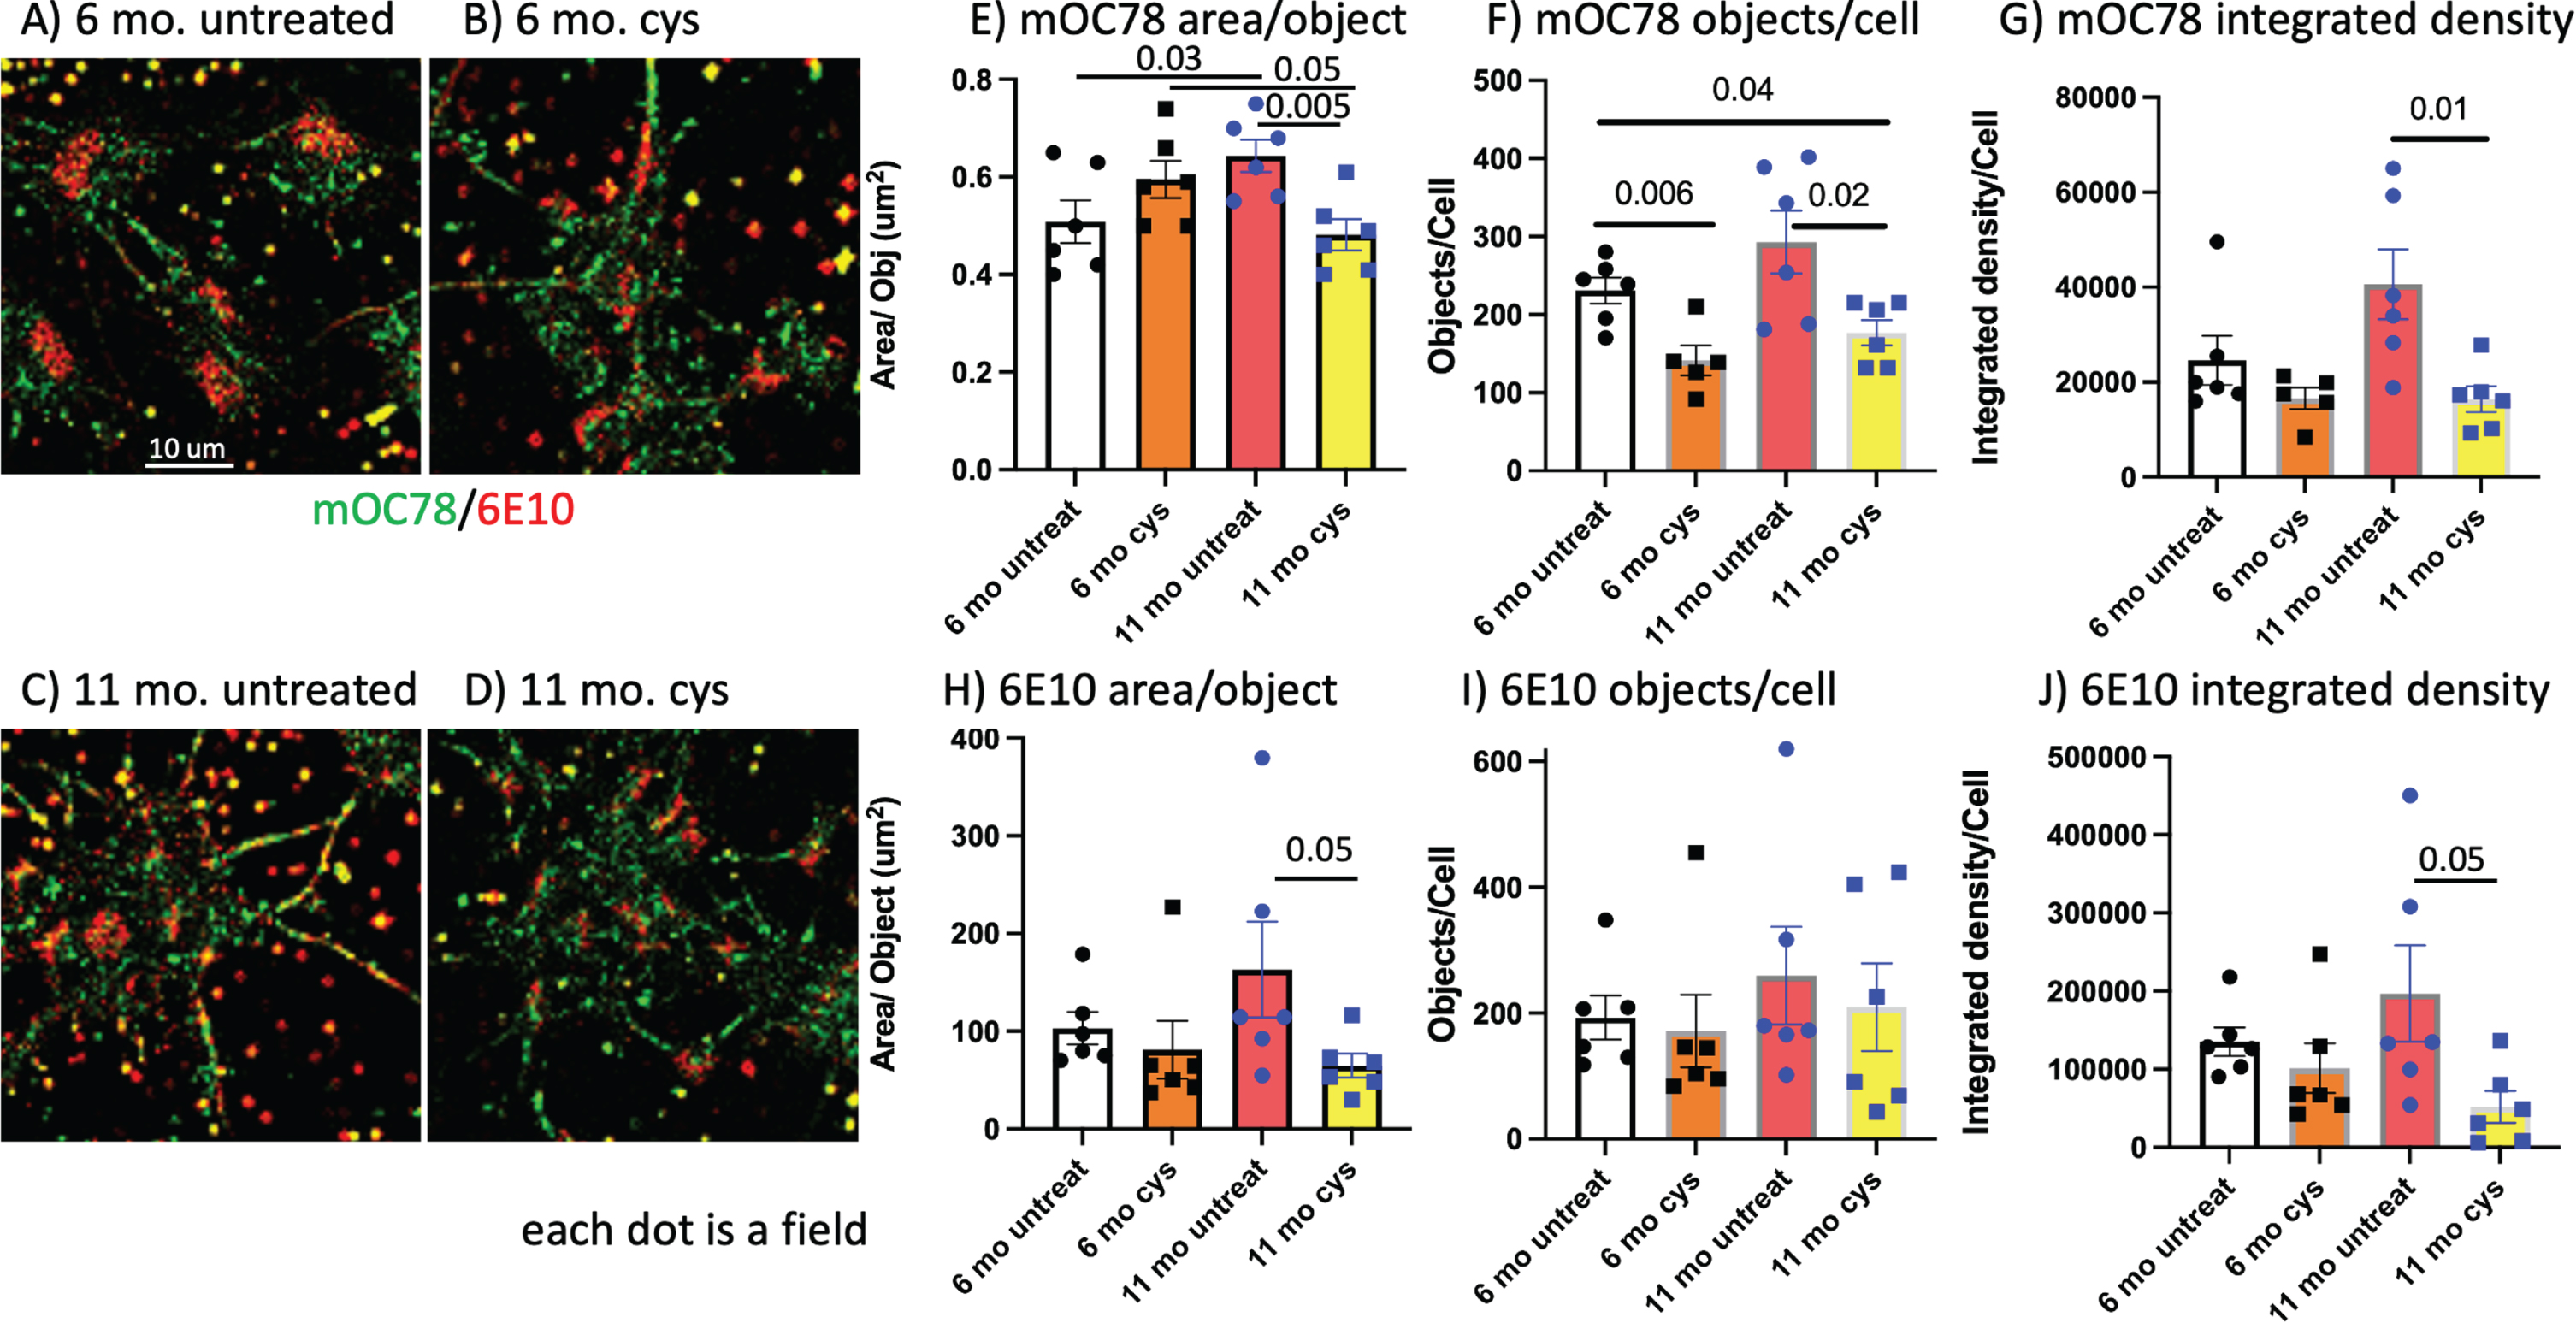
Reversal of age-related oxidized neuronal redox state with cysteine lowers mOC78 and 6E10 Aβ
The associations of the above GSH, pAkt, intra- and extracellular Aβ deposits do not establish causation. To address causation, we attempted to raise the earliest event, oxidatively shifted GSH levels, by intervention with the reducing amino acid, cysteine, as we previously showed in cultured adult neurons [16]. This treatment was more effective in neurons cultured from older 3xTg-AD brains than younger or nTg brains with higher levels of GSH. Figure 7A and B show little effect of 100 μM cysteine for 24 h on mOC78 (green) or 6E10 (red) Aβ in neurons cultured from a 6-month-old brain. In contrast, untreated neurons cultured from an 11-month-old brain stained stronger for Aβ (Fig. 7C), but only reached significance for mOC78 area/object (Fig. 7E). Figure 7D shows that cysteine treatment lowered the Aβ immunoreactivity compared to untreated (Fig. 7C). The 11 months cysteine treatment lowered mOC78 area per object (Fig. 7E), objects per cell (Fig. 7F), and integrated density by 60% (Fig. 7G). Cysteine lowered 6E10 area per object (Fig. 7H) and integrated density by 80% (Fig. 7J). Together, reversal of the oxidized GSH redox state with an intervention of reducing cysteine lowered Aβ levels. Thus, an oxidized redox state appears to cause increases in Aβ levels.
Fig. 7
In cultured middle-age neurons, reductive extracellular cysteine lowers mOC78 and 6E10 Aβ. A) 6-month-old male 3xTg-AD neurons with little overlap of red 6E10 and green mOC78. Five large red congregated stains are localized to nuclei. B) 6-month-old male 3xTg-AD neurons treated for 24 h with 100 μM cysteine to shift from oxidized to more reduced intracellular redox state. C) Untreated 11-month-old male 3xTg-AD with more red 6E10 and green mOC78 than 6 months. D) 11-month-old male 3xTg-AD treated for 24 h with 100 μM cysteine to lower 6E10 (red) and mOC78 (green). Quantitative analysis of 6 fields for E) mOC78 area per object with significant effects of age and cysteine treatment. F) mOC78 objects per cell with significant effects of cysteine treatment in both ages. G) mOC78 integrated density per cell with significant reduction in 11-month-old neurons by cysteine. H) 6E10 area per object with significant reduction in 11-month-old neurons by cysteine. I) 6E10 objects per cell. J) 6E10 integrated density per cell with significant reduction in 11-month-old neurons by cysteine. Each dot is the average in one 220×220 μm field.
DISCUSSION
We examined the age-related profile of three mechanisms that could be upstream of the prominent Aβ-rich plaque deposition in AD. One criterion of a causative mechanism is that it precedes the effect in time, in this case plaque deposition and cognitive impairment. Oddo et al. [58] originally reported that amyloid deposition preceded tau tangle formation, that synaptic dysfunction preceded amyloid deposition [47] and speculated that intraneuronal Aβ caused cognitive dysfunction [59] in the 3xTg-AD model mouse. Belfiore et al. [60] added microglial activation as an aspect of inflammation to the early mix at 6 months along with early detection of cognitive deficits at this age. However, since the 3xTg-AD mouse expresses transgenes from conception, we still have the question of why plaques and cognitive decline are not evident earlier. We identified chronological age-associated increases in CA1 intraneuronal Aβ accumulation that greatly increased from 6 to 9 months and preceded the small increases in extracellular plaque deposition that began at 16 months but reached maximum levels at 20 months in the brains of 3xTg-AD mice. Intracellular CA1 amyloid aggregation measured with mOC78 antibodies sensitive to oligomers also reached an early plateau at 9 months in the 3xTg-AD brains, a level eventually seen in nTg brains at 16–20 months. This suggests that the AD-like transgenes accelerated an aging-linked process also seen in nTg CA1 in old age. Indeed, the mutations introduced in 3xTg-AD mice have been shown to alter metabolism and GSH levels. The MAPT P301L mutation has been shown using fluorodeoxyglucose-positron emission tomography (FDG-PET) to disrupt brain metabolism in pre-symptomatic human patients [61]. A reduction in GSH was observed in lymphoblasts with presenilin1 and AβPP mutations [62], and AβPP overexpression perturbed metabolism by decreasing mitochondrial respiration and enhancing glycolysis in SH-SY5Y cells [63].
pAkt metabolic signaling was high in young 2–4-month-old CA1 and declined at 6, 9, and 12 months, before rising at 16 and 20 months. Thus, the pAkt decline preceded the rise in intracellular Aβ and protein aggregates. Even earlier, the principle redox buffer in cells, GSH, showed an accelerated decline in AD brains from 2 to 4 months that continued over the entire lifespan. Final old-age GSH values were similar for 3xTg-AD and nTg, again suggesting accelerated aging promoted by the transgenes. An exponential relationship correlated these GSH declines with the rise in intracellular Aβ, consistent with a causative relationship. The pAkt/tAkt ratios correlated with both Aβ and GSH levels in a U-shaped relationship. To establish a causal relationship of GSH redox state to intracellular Aβ accumulation, addition of reducing levels of exogenous cysteine to cultured middle-age neurons lowered intracellular Aβ accumulation. Together, among the mechanisms examined, an oxidative redox shift in GSH occurred the earliest in 3xTg-AD brains, which could be remediated in culture by addition of cysteine with consequent reduction in intracellular Aβ. Prior studies in cultures of neurons showed an oxidative redox shift with cystine promoted neuron death from old 3xTg-AD mice, but not young, while a reductive shift with cysteine lowered death coinciding with changes in pAkt [16]. Our prior work also showed that excess glutamate addition to old neurons increased the Alz-50 tau staining more than 2-fold, indicating late age-dependence and susceptibility to further pathology [55].
Intracellular and extracellular Aβ
As in this report, human [8, 64, 65] and some transgenic animal models like 3xTg-AD and 5xFAD mice accumulate iAβ before extracellular plaque deposition, prior to any observable tau pathology [7]. In AD-model mice, iAβ decreases as plaques increase [9, 47, 59, 66]. These kinetics are consistent with a precursor-product relationship. In human brain, iAβ is prominent at plaque stages A and B and more rarely observed in plaque stage C samples, suggesting that iAβ is also an early event that precedes plaque deposition in humans [7]. This study and others above saw these iAβ neurons stain with thioflavin S and the aggregation-specific mOC78, suggesting they are not just AβPP, but aggregated iAβ. Although the significance of iAβ has been debated for a long time, it appears to be causally related to plaque deposition. Separate observations that early treatment of 5xFAD mice with the CSF-R1 inhibitor PLX3397 prior to iAβ accumulation caused the ablation of microglia by 90%, reduced iAβ by 90% and also reduced the subsequent deposition of neuritic plaques by 90% are consistent with iAβ being the precursor to extracellular neuritic plaques [10]. Here we report that treatment of cultured adult neurons with cysteine lowers iAβ by 60–80%, largely in the absence of cultured microglia. However, we observed that cultured microglia from old rats respond to Aβ1 - 40 with elevated production of the inflammatory cytokine TNF compared to microglia from middle-age rats [67]. Interestingly, these studies showed that old rat neurons died with high levels of TNF, at higher rates than middle-age neurons, an effect suppressed by antioxidants. This suggests that neuron vulnerability to inflammatory TNF is heightened in old-age by reductions in GSH. Since microglia produce ROS in response to Aβ [67], as well as ATP to activate P2X7 receptors [69], it may not be surprising that inhibition of this receptor reduced Aβ-stimulated ROS. Interestingly, the same early ablation of microglia in tau transgenic mice also inhibits the ApoE4-dependent accumulation of aggregated and hyperphosphorylated tau, suggesting that they may share upstream signaling pathways for accumulation [70]. Overall, the literature seems to be exposing a shift in pathogenic mechanism from Aβ secretion causing plaques, to metabolic and redox modulation that increases iAβ, which upon cellular death or damage releases iAβ into the parenchyma as neuritic plaques to spread cellular damage, including uptake by microglia and concentration into dense core plaque deposits [71].
Sex effects
The 70% prevalence of AD in females appears to have mechanistic underpinnings beyond the longer lifespan of females, but mechanisms proven by interventions remain elusive [72, 73]. Prominent suspects for a higher age-specific female incidence involve hormonal differences, as well as differences in ApoE/cholesterol handling and in inflammatory responses. The R47H-TREM2 mutation associated with late-onset AD activates inflammatory genes in microglia, but more genes were activated in female excitatory and inhibitory neurons with slightly less in male inhibitory neurons [74]. To better address mechanism, studies in AD-transgenic mice found that bioenergetic deficits were exacerbated in females before extracellular Aβ deposition [75]. In age-matched cohorts, female 3xTg-AD mice had more extensive Aβ deposits than males, associated with higher beta-secretase activity and lower neprilysin degrading enzyme [76]. Age-related sex differences could be important at any of the age-related pathologic stages, but not necessarily all of them. Our findings reported here saw greater female than male 6E10 plaques, intracellular CA1 6E10, and mOC78, but not pAkt or GSH. This and the above cited work suggest sex effects may be more related to the later stages of Aβ processing, rather than earlier age or transgene redox changes.
Circadian time of day effects
Sundowning in AD patients involves neuropsychiatric symptoms of irritability, confusion, and aggressiveness at the end of the day [77, 78]. Sundown syndrome may be caused by the buildup of toxicants in the brain. In vivo hippocampal dialysis in AD-mouse brain and human cerebrospinal fluid (CSF) revealed a circadian cycle of interstitial Aβ levels that correlated with wakefulness [41, 54]. In mice, levels were highest at the end of the dark cycle (end of wakefulness, our evening) and lowest at the end of the light cycle (end of sleep, our morning). In our studies, higher iAβ levels were detected in female 3xTg-AD brains harvested at the end of the wake cycle in the AM than at the end of sleep in the PM, suggesting that the balance between production and degradation of iAβ changes on this short time scale. Lower levels of metabolic signaling from pAkt or oxidative GSH redox state in the females could drive this increase in iAβ. This iAβ could be the source for the interstitial Aβ that builds the more stable large Aβ deposits that did not show circadian changes. Age- and genotype-related changes in GSH did not show circadian changes, possibly because the whole brain wasevaluated.
Selective vulnerability
An intriguing aspect of neurodegenerative disease is the selective vulnerability of specific brain regions to each disease. The initial site for Parkinson’s disease pathology is the substantia nigra, whereas AD cognitive changes originate in the hippocampus, specifically subregion CA1 [40]. This selectivity was evident in AD-transgenic mice, despite thy-1 driven expression in all brain neurons, [66] as well as influencing tau pathology [79]. Other work in normal aging rats shows selective age-related vulnerability of the CA1 associated with differences in Akt survival signaling [40], suggesting that Akt signaling in the aging brain is part of a two-hit trigger for AD with redox stress adding to iAβ processing [80, 81]. Our work demonstrating the reduction of pAkt/tAkt levels in middle-age in the CA1 and somewhat in the DG and hilus, but not the CA3, support and extend a role for regionally selective metabolic signaling in thehippocampus.
Metabolic signaling through Akt
Akt is a pro-survival kinase that controls a variety of cell signaling pathways through phosphorylation of its targets in response to appropriate growth factor, hormone, integrin, neurotrophin, and cytokine receptor activation. The phosphorylation of Akt (pAkt) by PDK1 activates the kinase to induce autophagy from decreased receptor signaling. The early decline in pAkt signaling that is reported in AD patients, and that we observed in the 3xTg-AD CA1 at 6-9 months, may contribute to the development of AD pathogenesis through a reduction in beneficial autophagy and other downstream signaling pathways. Magrane et al. [82] found that induced adenoviral intracellular Aβ expression in postnatal primary cortical cultures led to a decrease in pAkt, and an increase in GSK-3 and apoptosis, whereas overexpression of constitutively active Akt reversed the toxic effects of intracellular Aβ. As we found in 3xTg-AD CA1, they also reported declines in levels of pAkt/tAkt in Tg2576 AD-transgenic mice beginning at 6 months in frontal cortex, an area selectively vulnerable compared to the cerebellum. These results demonstrate intracellular Aβ induces a stress response through Akt signaling. Further, Aβ toxicity could be reversed by activating stronger Akt signaling and by Hsp70 neuroprotection. In another study, Aβ injection into the mouse third ventricle led to a two-fold increase in cleaved caspase-3 and a 40% reduction in pAkt in CA1 stratum radiatum [83]. Interestingly, 2 weeks of daily brain infusions of an activator of Akt into brains of 5xFAD mice restored the pAkt/tAkt ratio to wild-type levels and rescued AD-like memory impairment, LTD and LTP deficits suggesting a metabolic burden of Aβ that can be remediated by increased activation of Akt. Hsp70 stabilizes unfolded proteins and is also upregulated by Akt and protects against intracellular Aβ toxicity [82].
We previously found in 3xTg-AD primary neurons in culture that lower pAkt/tAkt ratios were linearly correlated with neuronal survival, and that low ratios in neurons from older animals (with higher death) were under redox stress that could be reversed by cysteine [16]. Our studies across the age-span of mice are supported by earlier findings of declines in survival signaling in CA1 nuclear pAkt-thr308 of wild-type rats [40]. We observed that the early decline in pAkt was followed by elevated pAkt/tAkt in 3xTg-AD CA1 at 16 months. This pattern of an early decline followed by a rise was noted in AD as well [84, 85]. Griffin et al. [38] found late-stage AD brains contain high levels of pAkt and resultant increased phosphorylation of Akt substrates GSK3β, tau, and mTOR. The late increase in pAkt could result from a failed homeostatic mechanism attempting to restore normal pAkt levels, or it could be an upregulation of pAkt driven by a pathological cellular response to aging. The R47H-TREM2 mutation associated with late-onset AD activates inflammatory genes in excitatory and inhibitory neurons, and hyperactivates the Akt signaling pathways in microglia that may also be involved in neurons [74]. Inappropriate distribution of PTEN, a phosphatase that inactivates Akt, may lead to hyperactivation of the Akt pathway in late life [38]. Other groups have also predicted that increasing cell death in later stages of AD may induce hyperactivation of the Akt pathway [85]. This could lead to a reduction in Aβ clearance through autophagy, as Akt inhibition induces autophagy [86]. Indeed, we saw a late-life rebounding increase in the pAkt/tAkt ratio at 16 months of age that correlated with deficits reported in autophagy [55]. Together, these results suggest that both the early decline and old-age rise in pAkt expression in AD and AD model mice are pathogenic. All of these studies in culture, in mice and AD patients suggest critical metabolic controls by the Akt pathway for regulating the production and clearance of Aβ but these controls could be influenced by earlier redox changes.
Akt and redox oxidation
In addition to receptor activation of Akt, the kinase activity of Akt is also modulated by redox status [87]. At healthy redox states, Akt phosphorylation results in its translocation to the nucleus for normal protective mechanisms. With a strong oxidative shift, pAkt is diverted to mitochondria for promotion of apoptosis. Antico Arciuc et al. [87] showed that this difference was marked by selective oxidation of Akt at cys310 to sulfenic or cysteic acids. Ahmad et al. [88] further identified these redox-active cysteines as critical for regulation of Akt1 proteasomal degradation. They also found that inhibition of glutaredoxin (Grx1) led to dephosphorylation of Akt1 and loss of kinase activity with increased association of Akt with PP2A. Interestingly, these changes could be reversed by treatment of cells with N-acetylcysteine, demonstrating the redox sensitivity of Akt. Our reversal of age-related iAβ in cultured neurons by cysteine could also be influenced by redox-mediated rejuvenation of autophagic-endocytic degradation of AβPP or inhibition of gamma-secretase processing of AβPP.
Glutathione and redox state
GSH at millimolar intracellular concentrations serves as the major antioxidant and redox buffer inside cells. According to fundamental biochemistry, redox active NADH drives ATP synthesis by oxidative phosphorylation, and the redox state of the cell controls numerous receptors, signaling molecules, and transcription factors that can be dysregulated in the aging oxidized redox state [89, 90]. Our investigation into lower GSH levels in AD was motivated by early studies that plasma GSH levels decline with age in healthy humans [89, 91], and increased brain protein, lipid and nucleic acid oxidation is seen in AD [92, 93], upstream of amyloid pathology [94]. Since similarly poor outcomes are expected from sedentary behavior and high fat diets for heart disease and AD, interest was heightened by the finding of a two-fold higher risk of death from coronary artery disease in patients with low plasma GSH levels [95]. Our circadian observations were informed by the diurnal oscillations of 30% in GSH in healthy human plasma [96] and liver [97] and in rat brain [98]. In the 3xTg-AD brains examined here, we saw a nearly two-fold decline of brain GSH with age, accelerated early in the lifespan of 3xTg-AD mice, but largely parallel to the decline in nTg brains. The parallel decline suggests that increased stress from excess iAβ is just one of many possible age-related stressors possibly associated with inflammation. Oxidative redox stress is well known to alter signaling through sensitivity to dimerization of growth factor receptors, NfkB and Akt signaling (e.g., [99, 100]) and possibly AβPP processing [101]. We did not see evidence of circadian oscillation, possibly related to tighter control of redox state in the brain compared to plasma. We had previously found brain GSH levels to decline in AD-transgenic mice only after sleep deprivation stress, and only then was memory affected [42, 102].
The early decline in brain GSH occurred before changes in the other measures of pAkt, iAβ, and Aβ plaques in our 3xTg-AD mouse brains. The exponential rise in 6E10 iAβ was well correlated with the decline in GSH, suggesting a causal relationship. We previously showed by HPLC that this decline in GSH was accompanied by a rise in GSSG to truly represent an oxidized redox shift [102]. This study also showed that a Nrf-2 activator increased GSH levels through activation of γ-glutamyl cysteine ligase (GCL) to increase 3xTg-AD neuron survival against amyloid-β stress, independent of ROS. Stapper and Jahn [103] were able to genetically alter GSH levels to manipulate the toxicity of brain Aβ in a fly model. We had previously evaluated the rejuvenating effects of reductive levels of extracellular cysteine on the age-related oxidative shift in neuronal NADH in neurons from old 3xTg-AD mice [16, 50]. Here, we showed the effectiveness of cysteine in vitro to lower 6E10 iAβ to levels at or below those in young neurons.
In vivo, Huang et al. [104] found 5 months of oral administration of the membrane permeable N-acetylcysteine to AD-model mice lowered oxidized brain protein 20–30%. In the SAMP-8 accelerated aging mouse model, four weeks of intraperitoneal injection of N-acetylcysteine achieved good brain penetration, lowered oxidized brain protein levels, and improved memory [105]. Also relevant are human trials of N-acetylcysteine. In a small double-blind, placebo-controlled study of probable AD patients, Adair et al. [106] found Mini-Mental State Exam scores were insignificantly stabilized for 6 months with treatment (n = 25) compared to a small decline for the placebo group (n = 23). The small number of patients and short duration of the trial are likely problems for this study despite isolated treatment benefit in subtests of the WMS figure reproduction and letter fluency. Since our cysteine addition altered the processing of iAβ and was performed in the presence of antioxidants in the culture medium including reduced GSH, vitamin E, vitamin E acetate, superoxide dismutase, and catalase, we posit that redox state is upstream of oxidative damage and affects a broader range of reactions as we found in vitro [107] and explained next in therapeutic implications.
Therapeutic implications and summary
The cysteine antioxidant treatment we used here in vitro is unlikely to work in vivo due to adsorption problems. Many antioxidant clinical trials have failed to significantly reverse the cognitive course of AD, including vitamin E [108, 109], vitamin E + C [110], vitamin B12 + B6 [111], curcumin [112], and N-acetyl cysteine [106]. The easy explanation for their failure is that they were imposed too late in the course of AD when amyloid pathology, synapse and neuron loss was irreversible. Several other explanations are possible [113], including variations in adsorption and elimination that affect normal signaling by ROS, only targeting one aspect of redox state that differs in membranes and cytosol [114], free radicals versus peroxides, and deficiency status. One combination oral therapy with N-acetyl cysteine and 5 other ingredients appeared to be promising in a phase II clinical trial to improve cognition [115]. Oral N-Acetyl cysteine crosses the blood-brain barrier to dose-dependently enter the CSF [116]. More combination therapies aimed at the multiple etiologies of AD are needed. Upstream targets may prove strategically more effective for therapy than end-stage pathology because they precede irreversible damage [117, 118]. The inability to therapeutically validate a mechanistic target against AD to date encourages the search for other targets. In the interim, whether any of the sequence of events studied here will prove causal awaits an efficacious drug.
In summary, we investigated several early events that might lead to an ordering of pathologic progression in the 3xTg-AD mouse across the age-span and suggest upstream targets for intervention prior to irreversible neuron loss and plaque deposition. We found early loss of GSH (an oxidative redox shift), followed by declines in pAkt/tAkt from a metabolic shift in CA1, then intracellular CA1 Aβ accumulation, and finally extracellular Aβ deposits in CA1, which was more prominent in females than males. The earliest upstream age-related event was the oxidative shift in GSH, which may be a strategic target for middle-age intervention to reverse or prevent downstream pathology including deposition of intracellular and extracellular Aβ in AD. There appear to be several age-related metabolic changes upstream of the amyloid cascade.
ACKNOWLEDGMENTS
This work was supported in part by NIH grant RF1 AG058218 to GJB and CGG
Authors’ disclosures available online (https://www.j-alz.com/manuscript-disclosures/22-0824r1).
SUPPLEMENTARY MATERIAL
[1] The supplementary material is available in the electronic version of this article: https://dx.doi.org/10.3233/JAD-220824.
REFERENCES
[1] | Coleman PD , Mastroeni D ((2017) ) A call for new approaches to Alzheimer’s disease research, Neurobiol Aging 57: , iii–iv. |
[2] | Selkoe DJ , Podlisny MB , Joachim CL , Vickers EA , Lee G , Fritz LC , Oltersdorf T ((1988) ) Beta-amyloid precursor protein of Alzheimer disease occurs as 110- to 135-kilodalton membrane-associated proteins in neural and nonneural tissues. Proc Natl Acad Sci U S A 85: , 7341–7345. |
[3] | Grundke-Iqbal I , Iqbal K , George L , Tung YC , Kim KS , Wisniewski HM ((1989) ) Amyloid protein and neurofibrillary tangles coexist in the same neuron in Alzheimer disease. Proc Natl Acad Sci U S A 86: , 2853–2857. |
[4] | Arai H , Lee VM , Otvos L Jr. , Greenberg BD , Lowery DE , Sharma SK , Schmidt ML , Trojanowski JQ ((1990) ) Defined neurofilament, tau, and beta-amyloid precursor protein epitopes distinguish Alzheimer from non-Alzheimer senile plaques. Proc Natl Acad Sci U S A 87: , 2249–2253. |
[5] | Cras P , Kawai M , Siedlak S , Mulvihill P , Gambetti P , Lowery D , Gonzalez-DeWhitt P , Greenberg B , Perry G ((1990) ) Neuronal and microglial involvement in beta-amyloid protein deposition in Alzheimer’s disease. Am J Pathol 137: , 241–246. |
[6] | Cummings BJ , Su JH , Geddes JW , Van Nostrand WE , Wagner SL , Cunningham DD , Cotman CW ((1992) ) Aggregation of the amyloid precursor protein within degenerating neurons and dystrophic neurites in Alzheimer’s disease. Neuroscience 48: , 763–777. |
[7] | Pensalfini A , Albay R 3rd , Rasool S , Wu JW , Hatami A , Arai H , Margol L , Milton S , Poon WW , Corrada MM , Kawas CH , Glabe CG ((2014) ) Intracellular amyloid and the neuronal origin of Alzheimer neuritic plaques. Neurobiol Dis 71: , 53–61. |
[8] | Lee JH , Yang DS , Goulbourne CN , Im E , Stavrides P , Pensalfini A , Chan H , Bouchet-Marquis C , Bleiwas C , Berg MJ , Huo C , Peddy J , Pawlik M , Levy E , Rao M , Staufenbiel M , Nixon RA ((2022) ) Faulty autolysosome acidification in Alzheimer’s disease mouse models induces autophagic build-up of Abeta in neurons, yielding senile plaques. Nat Neurosci 25: , 688–701. |
[9] | Oakley H , Cole SL , Logan S , Maus E , Shao P , Craft J , Guillozet-Bongaarts A , Ohno M , Disterhoft J , Van Eldik L , Berry R , Vassar R ((2006) ) Intraneuronal beta-amyloid aggregates, neurodegeneration, and neuron loss in transgenic mice with five familial Alzheimer’s disease mutations: Potential factors in amyloid plaque formation. J Neurosci 26: , 10129–10140. |
[10] | Sosna J , Philipp S , Albay R 3rd , Reyes-Ruiz JM , Baglietto-Vargas D , LaFerla FM , Glabe CG ((2018) ) Early long-term administration of the CSF1R inhibitor PLX3397 ablates microglia and reduces accumulation of intraneuronal amyloid, neuritic plaque deposition and pre-fibrillar oligomers in 5XFAD mouse model of Alzheimer’s disease. Mol Neurodegener 13: , 11. |
[11] | Puzzo D , Privitera L , Leznik E , Fa M , Staniszewski A , Palmeri A , Arancio O ((2008) ) Picomolar amyloid-beta positively modulates synaptic plasticity and memory in hippocampus. J Neurosci 28: , 14537–14545. |
[12] | Parihar MS , Brewer GJ ((2010) ) Amyloid-beta as a modulator of synaptic plasticity. J Alzheimers Dis 22: , 741–763. |
[13] | Palmeri A , Ricciarelli R , Gulisano W , Rivera D , Rebosio C , Calcagno E , Tropea MR , Conti S , Das U , Roy S , Pronzato MA , Arancio O , Fedele E , Puzzo D ((2017) ) Amyloid-beta peptide is needed for cGMP-induced long-term potentiation and memory. J Neurosci 37: , 6926–6937. |
[14] | Ansari MA , Scheff SW ((2010) ) Oxidative stress in the progression of Alzheimer disease in the frontal cortex. J Neuropathol Exp Neurol 69: , 155–167. |
[15] | Mandal PK , Tripathi M , Sugunan S ((2012) ) Brain oxidative stress: Detection and mapping of anti-oxidant marker ‘Glutathione’ in different brain regions of healthy male/female, MCI and Alzheimer patients using non-invasive magnetic resonance spectroscopy. Biochem Biophys Res Commun 417: , 43–48. |
[16] | Ghosh D , Brewer GJ ((2014) ) External cys/cySS redox state modification controls the intracellular redox state and neurodegeneration via Akt in aging and Alzheimer’s disease mouse model neurons. J Alzheimers Dis 42: , 313–324. |
[17] | Manning BD , Toker A ((2017) ) AKT/PKB signaling: Navigating the network. Cell 169: , 381–405. |
[18] | Luo HR , Hattori H , Hossain MA , Hester L , Huang Y , Lee-Kwon W , Donowitz M , Nagata E , Snyder SH ((2003) ) Akt as a mediator of cell death. Proc Natl Acad Sci U S A 100: , 11712–11717. |
[19] | Yu HJ , Koh SJ ((2017) ) Role of the PI3K/AKT pathway and its therapeutic possibility in Alzheimer’s disease. Hanyang Med Rev 37: , 18–34. |
[20] | Curtis D , Bandyopadhyay S ((2021) ) Mini-review: Role of the PI3K/Akt pathway and tyrosine phosphatases in Alzheimer’s disease susceptibility. Ann Hum Genet 85: , 1–6. |
[21] | Franke TF , Yang SI , Chan TO , Datta K , Kazlauskas A , Morrison DK , Kaplan DR , Tsichlis PN ((1995) ) The protein kinase encoded by the Akt proto-oncogene is a target of the PDGF-activated phosphatidylinositol 3-kinase. Cell 81: , 727–736. |
[22] | King WG , Mattaliano MD , Chan TO , Tsichlis PN , Brugge JS ((1997) ) Phosphatidylinositol 3-kinase is required for integrin-stimulated AKT and Raf-1/mitogen-activated protein kinase pathway activation. Mol Cell Biol 17: , 4406–4418. |
[23] | Tzivion G , Dobson M , Ramakrishnan G ((2011) ) FoxO transcription factors; Regulation by AKT and 14-3-3 proteins. Biochim Biophys Acta 1813: , 1938–1945. |
[24] | Robey RB , Hay N ((2009) ) Is Akt the “Warburg kinase"?-Akt-energy metabolism interactions and oncogenesis. Semin Cancer Biol 19: , 25–31. |
[25] | Coloff JL , Rathmell JC ((2006) ) Metabolic regulation of Akt: Roles reversed. J Cell Biol 175: , 845–847. |
[26] | Alessi DR , James SR , Downes CP , Holmes AB , Gaffney PR , Reese CB , Cohen P ((1997) ) Characterization of a 3-phosphoinositide-dependent protein kinase which phosphorylates and activates protein kinase Balpha. Curr Biol 7: , 261–269. |
[27] | Sarbassov dD , Guertin DA , Ali SM , Sabatini DM ((2005) ) Phosphorylation and regulation of Akt/PKB by the rictor-mTOR complex. Science 307: , 1098–1101. |
[28] | Dan HC , Ebbs A , Pasparakis M , Van Dyke T , Basseres DS , Baldwin AS ((2014) ) Akt-dependent activation of mTORC1 complex involves phosphorylation of mTOR (mammalian target of rapamycin) by IkappaB kinase alpha (IKKalpha). J Biol Chem 289: , 25227–25240. |
[29] | Chibaya L , Karim B , Zhang H , Jones SN ((2021) ) Mdm2 phosphorylation by Akt regulates the p53 response to oxidative stress to promote cell proliferation and tumorigenesis. Proc Natl Acad Sci U S A 118: , e2003193118. |
[30] | Brunet A , Bonni A , Zigmond MJ , Lin MZ , Juo P , Hu LS , Anderson MJ , Arden KC , Blenis J , Greenberg ME ((1999) ) Akt promotes cell survival by phosphorylating and inhibiting a Forkhead transcription factor. Cell 96: , 857–868. |
[31] | Zhang X , Tang N , Hadden TJ , Rishi AK ((2011) ) Akt, FoxO and regulation of apoptosis. Biochim Biophys Acta 1813: , 1978–1986. |
[32] | Fang X , Yu SX , Lu Y , Bast RC Jr. , Woodgett JR , Mills GB ((2000) ) Phosphorylation and inactivation of glycogen synthase kinase 3 by protein kinase A. Proc Natl Acad Sci U S A 97: , 11960–11965. |
[33] | Eves EM , Xiong W , Bellacosa A , Kennedy SG , Tsichlis PN , Rosner MR , Hay N ((1998) ) Akt, a target of phosphatidylinositol 3-kinase, inhibits apoptosis in a differentiating neuronal cell line. Mol Cell Biol 18: , 2143–2152. |
[34] | Diez H , Garrido JJ , Wandosell F ((2012) ) Specific roles of Akt iso forms in apoptosis and axon growth regulation in neurons. PLoS One 7: , e32715. |
[35] | Liu Q , Qiu J , Liang M , Golinski J , van Leyen K , Jung JE , You Z , Lo EH , Degterev A , Whalen MJ ((2014) ) Akt and mTOR mediate programmed necrosis in neurons. Cell Death Dis 5: , e1084. |
[36] | Yamaguchi A , Tamatani M , Matsuzaki H , Namikawa K , Kiyama H , Vitek MP , Mitsuda N , Tohyama M ((2001) ) Akt activation protects hippocampal neurons from apoptosis by inhibiting transcriptional activity of p53. J Biol Chem 276: , 5256–5264. |
[37] | Orellana AM , Vasconcelos AR , Leite JA , de Sa Lima L , Andreotti DZ , Munhoz CD , Kawamoto EM , Scavone C ((2015) ) Age-related neuroinflammation and changes in AKT-GSK-3beta and WNT/ beta-CATENIN signaling in rat hippocampus. Aging (Albany NY) 7: , 1094–1111. |
[38] | Griffin RJ , Moloney A , Kelliher M , Johnston JA , Ravid R , Dockery P , O’Connor R , O’Neill C ((2005) ) Activation of Akt/PKB, increased phosphorylation of Akt substrates and loss and altered distribution of Akt and PTEN are features of Alzheimer’s disease pathology. J Neurochem 93: , 105–117. |
[39] | Lee HK , Kumar P , Fu Q , Rosen KM , Querfurth HW ((2009) ) The insulin/Akt signaling pathway is targeted by intracellular beta-amyloid. Mol Biol Cell 20: , 1533–1544. |
[40] | Jackson TC , Rani A , Kumar A , Foster TC ((2009) ) Regional hippocampal differences in AKT survival signaling across the lifespan: Implications for CA1 vulnerability with aging. Cell Death Differ 16: , 439–448. |
[41] | Musiek ES , Holtzman DM ((2016) ) Mechanisms linking circadian clocks, sleep, and neurodegeneration. Science 354: , 1004–1008. |
[42] | LeVault KR , Tischkau SA , Brewer GJ ((2016) ) Circadian disruption reveals a correlation of an oxidative GSH/GSSG redox shift with learning and impaired memory in an Alzheimer’s disease mouse model. J Alzheimers Dis 49: , 301–316. |
[43] | Lucey BP , Hicks TJ , McLeland JS , Toedebusch CD , Boyd J , Elbert DL , Patterson BW , Baty J , Morris JC , Ovod V , Mawuenyega KG , Bateman RJ ((2018) ) Effect of sleep on overnight cerebrospinal fluid amyloid beta kinetics. Ann Neurol 83: , 197–204. |
[44] | Buckley RF , Mormino EC , Amariglio RE , Properzi MJ , Rabin JS , Lim YY , Papp KV , Jacobs HIL , Burnham S , Hanseeuw BJ , Dore V , Dobson A , Masters CL , Waller M , Rowe CC , Maruff P , Donohue MC , Rentz DM , Kirn D , Hedden T , Chhatwal J , Schultz AP , Johnson KA , Villemagne VL , Sperling RA , Alzheimer’s Disease Neuroimaging Initiative; Australian Imaging , Biomarker and Lifestyle study of ageing; Harvard Aging Brain Study ((2018) ) Sex, amyloid, and APOE epsilon4 and risk of cognitive decline in preclinical Alzheimer’s disease: Findings from three well-characterized cohorts. Alzheimers Dement 14: , 1193–1203. |
[45] | Dennison JL , Ricciardi NR , Lohse I , Volmar CH , Wahlestedt C ((2021) ) Sexual dimorphism in the 3xTg-AD mouse model and its impact on pre-clinical research. J Alzheimers Dis 80: , 41–52. |
[46] | Guo Q , Sebastian L , Sopher BL , Miller MW , Ware CB , Martin GM , Mattson MP ((1999) ) Increased vulnerability of hippocampal neurons from presenilin-1 mutant knock-in mice to amyloid b-peptide toxicity: Central roles of superoxide production and caspase activation. J Neurochem 72: , 1019–1029. |
[47] | Oddo S , Caccamo A , Shepherd JD , Murphy MP , Golde TE , Kayed R , Metherate R , Mattson MP , Akbari Y , LaFerla FM ((2003) ) Triple-transgenic model of Alzheimer’s disease with plaques and tangles. Intracellular abeta and synaptic dysfunction. Neuron 39: , 409–421. |
[48] | Schliwa M , van Blerkom J ((1981) ) Structural interaction of cytoskeletal components. J Cell Biol 90: , 222–235. |
[49] | Brewer GJ , Torricelli JR ((2007) ) Isolation and culture of adult neurons and neurospheres. Nat Protoc 2: , 1490–1498. |
[50] | Dong Y , Sameni S , Digman MA , Brewer GJ ((2019) ) Reversibility of age-related oxidized free NADH redox states in Alzheimer’s disease neurons by imposed external Cys/CySS redox shifts. Sci Rep 9: , 11274. |
[51] | Baghallab I , Reyes-Ruiz JM , Abulnaja K , Huwait E , Glabe C ((2018) ) Epitomic characterization of the specificity of the anti-amyloid Abeta monoclonal antibodies 6E10 and 4G8. J Alzheimers Dis 66: , 1235–1244. |
[52] | Reyes-Ruiz JM , Nakajima R , Baghallab I , Goldschmidt L , Sosna J , Mai Ho PN , Kumosani T , Felgner PL , Glabe C ((2021) ) An “epitomic” analysis of the specificity of conformation-dependent, anti-Ass amyloid monoclonal antibodies. J Biol Chem 296: , 100168. |
[53] | Thal DR , Rub U , Schultz C , Sassin I , Ghebremedhin E , Del Tredici K , Braak E , Braak H ((2000) ) Sequence of Abeta-protein deposition in the human medial temporal lobe. J Neuropathol Exp Neurol 59: , 733–748. |
[54] | Kang JE , Lim MM , Bateman RJ , Lee JJ , Smyth LP , Cirrito JR , Fujiki N , Nishino S , Holtzman DM ((2009) ) Amyloid-beta dynamics are regulated by orexin and the sleep-wake cycle. Science 326: , 1005–1007. |
[55] | Brewer GJ , Herrera RA , Philipp S , Sosna J , Reyes-Ruiz JM , Glabe CG ((2020) ) Age-related intraneuronal aggregation of amyloid-beta in endosomes, mitochondria, autophagosomes, and lysosomes. J Alzheimers Dis 73: , 229–246. |
[56] | Katzmarski N , Ziegler-Waldkirch S , Scheffler N , Witt C , Abou-Ajram C , Nuscher B , Prinz M , Haass C , Meyer-Luehmann M ((2020) ) Abeta oligomers trigger and accelerate Abeta seeding. Brain Pathol 30: , 36–45. |
[57] | Kepchia D , Huang L , Dargusch R , Rissman RA , Shokhirev MN , Fischer W , Schubert D ((2020) ) Diverse proteins aggregate in mild cognitive impairment and Alzheimer’s disease brain. Alzheimers Res Ther 12: , 75. |
[58] | Oddo S , Caccamo A , Kitazawa M , Tseng BP , LaFerla FM ((2003) ) Amyloid deposition precedes tangle formation in a triple transgenic model of Alzheimer’s disease. Neurobiol Aging 24: , 1063–1070. |
[59] | Billings LM , Oddo S , Green KN , McGaugh JL , LaFerla FM ((2005) ) Intraneuronal abeta causes the onset of early Alzheimer’s disease-related cognitive deficits in transgenic mice. Neuron 45: , 675–688. |
[60] | Belfiore R , Rodin A , Ferreira E , Velazquez R , Branca C , Caccamo A , Oddo S ((2018) ) Temporal and regional progression of Alzheimer’s disease-like pathology in 3xTg-AD mice. Aging Cell 18: , e12873. |
[61] | Liu L , Chu M , Nie B , Liu L , Xie K , Cui Y , Kong Y , Chen Z , Nan H , Chen K , Rosa-Neto P , Wu L ((2022) ) Reconfigured metabolism brain network in asymptomatic microtubule-associated protein tau mutation carriers: A graph theoretical analysis. Alzheimers Res Ther 14: , 52. |
[62] | Cecchi C , Latorraca S , Sorbi S , Iantomasi T , Favilli F , Vincenzini MT , Liguri G ((1999) ) Gluthatione level is altered in lymphoblasts from patients with familial Alzheimer’s disease. Neurosci Lett 275: , 152–154. |
[63] | Lopez Sanchez MIG , Waugh HS , Tsatsanis A , Wong BX , Crowston JG , Duce JA , Trounce IA ((2017) ) Amyloid precursor protein drives down-regulation of mitochondrial oxidative phosphorylation independent of amyloid beta. Sci Rep 7: , 9835. |
[64] | Mochizuki A , Tamaoka A , Shimohata A , Komatsuzaki Y , Shoji S ((2000) ) Abeta42-positive non-pyramidal neurons around amyloid plaques in Alzheimer’s disease. Lancet 355: , 42–43. |
[65] | Gouras GK , Tampellini D , Takahashi RH , Capetillo-Zarate E ((2010) ) Intraneuronal beta-amyloid accumulation and synapse pathology in Alzheimer’s disease. Acta Neuropathol 119: , 523–541. |
[66] | Oh KJ , Perez SE , Lagalwar S , Vana L , Binder L , Mufson EJ ((2010) ) Staging of Alzheimer’s pathology in triple transgenic mice: A light and electron microscopic analysis. Int J Alzheimers Dis 2010: , 780102. |
[67] | Viel JJ , McManus DQ , Smith SS , Brewer GJ ((2001) ) Age- and concentration-dependent neuroprotection and toxicity by TNF in cortical neurons from beta-amyloid. J Neurosci Res 64: , 454–465. |
[68] | Bianca VD , Dusi S , Bianchini E , Dal Prà I , Rossi F ((1999) ) beta-amyloid activates the O-2 forming NADPH oxidase in microglia, monocytes, and neutrophils. A possible inflammatory mechanism of neuronal damage in Alzheimer’s disease. J Biol Chem 274: , 15493–15499. |
[69] | Kim SY , Moon JH , Lee HG , Kim SU , Lee YB ((2007) ) ATP released from beta-amyloid-stimulated microglia induces reactive oxygen species production in an autocrine fashion. Exp Mol Med 39: , 820–827. |
[70] | Shi Y , Manis M , Long J , Wang K , Sullivan PM , Remolina Serrano J , Hoyle R , Holtzman DM ((2019) ) Microglia drive APOE-dependent neurodegeneration in a tauopathy mouse model. J Exp Med 216: , 2546–2561. |
[71] | Lemke G , Huang Y ((2022) ) The dense-core plaques of Alzheimer’s disease are granulomas. J Exp Med 219: , e20212477. |
[72] | Zhao L , Mao Z , Woody SK , Brinton RD ((2016) ) Sex differences in metabolic aging of the brain: Insights into female suscetibility to Alzheimer’s disease. Neurobiol Aging 42: , 69–79 |
[73] | Fisher DW , Bennett DA , Dong H ((2018) ) Sexual dimorphism in predisposition to Alzheimer’s disease. Neurobiol Aging 70: , 308–324. |
[74] | Sayed FA , Kodama L , Fan L , Carling GK , Udeochu JC , Le D , Li Q , Zhou L , Wong MY , Horowitz R , Ye P , Mathys H , Wang M , Niu X , Mazutis L , Jiang X , Wang X , Gao F , Brendel M , Telpoukhovskaia M , Tracy TE , Frost G , Zhou Y , Li Y , Qiu Y , Cheng Z , Yu G , Hardy J , Coppola G , Wang F , DeTure MA , Zhang B , Xie L , Trajnowski JQ , Lee VMY , Gong S , Sinha SC , Dickson DW , Luo W , Gan L ((2021) ) AD-linked R47H-TREM2 mutation induces disease-enhancing microglial states via AKT hyperactivation. Sci Transl Med 13: , eabe3947. |
[75] | Yao J , Irwin RW , Zhao L , Nilsen J , Hamilton RT , Brinton RD ((2009) ) Mitochondrial bioenergetic deficit precedes Alzheimer’s pathology in female mouse model of Alzheimer’s disease. Proc Natl Acad Sci U S A 106: , 14670–14675. |
[76] | Hirata-Fukae C , Li HF , Hoe HS , Gray AJ , Minami SS , Hamada K , Niikura T , Hua F , Tsukagoshi-Nagai H , Horikoshi-Sakuraba Y , Mughal M , Rebeck GW , LaFerla FM , Mattson MP , Iwata N , Saido TC , Klein WL , Duff KE , Aisen PS , Matsuoka Y ((2008) ) Females exhibit more extensive amyloid, but not tau, pathology in an Alzheimer transgenic model. Brain Res 1216: , 92–103. |
[77] | Menegardo CS , Friggi FA , Scardini JB , Rossi TS , Vieira TDS , Tieppo A , Morelato RL ((2019) ) Sundown syndrome in patients with Alzheimer’s disease dementia. Dement Neuropsychol 13: , 469–474. |
[78] | Todd WD ((2020) ) Potential pathways for Circadian dysfunction and sundowning-related behavioral aggression in Alzheimer’s disease and related dementias. Front Neurosci 14: , 910. |
[79] | Fu H , Possenti A , Freer R , Nakano Y , Hernandez Villegas NC , Tang M , Cauhy PVM , Lassus BA , Chen S , Fowler SL , Figueroa HY , Huey ED , Johnson GVW , Vendruscolo M , Duff KE ((2019) ) A tau homeostasis signature is linked with the cellular and regional vulnerability of excitatory neurons to tau pathology. Nat Neurosci 22: , 47–56. |
[80] | Zhu X , Lee HG , Perry G , Smith MA ((2007) ) Alzheimer disease, the two-hit hypothesis: An update. Biochim Biophys Acta 1772: , 494–502. |
[81] | Hardas SS , Sultana R , Clark AM , Beckett TL , Szweda LI , Murphy MP , Butterfield DA ((2013) ) Oxidative modification of lipoic acid by HNE in Alzheimer disease brain. Redox Biol 1: , 80–85. |
[82] | Magrane J , Rosen KM , Smith RC , Walsh K , Gouras GK , Querfurth HW ((2005) ) Intraneuronal beta-amyloid expression downregulates the Akt survival pathway and blunts the stress response. J Neurosci 25: , 10960–10969. |
[83] | Yi JH , Baek SJ , Heo S , Park HJ , Kwon H , Lee S , Jung J , Park SJ , Kim BC , Lee YC , Ryu JH , Kim DH ((2018) ) Direct pharmacological Akt activation rescues Alzheimer’s disease like memory impairments and aberrant synaptic plasticity. Neuropharmacology 128: , 282–292. |
[84] | O’Neill C ((2013) ) PI3-kinase/Akt/mTOR signaling: Impaired on/off switches in aging, cognitive decline and Alzheimer’s disease. Exp Gerontol 48: , 647–653. |
[85] | Heras-Sandoval D , Perez-Rojas JM , Hernandez-Damian J , Pedraza-Chaverri J ((2014) ) The role of PI3K/AKT/mTOR pathway in the modulation of autophagy and the clearance of protein aggregates in neurodegeneration. Cell Signal 26: , 2694–2701. |
[86] | Ahmet I , Spangler E , Shukitt-Hale B , Juhaszova M , Sollott SJ , Joseph JA , Ingram DK , Talan M ((2009) ) Blueberry-enriched diet protects rat heart from ischemic damage. PLoS One 4: , e5954. |
[87] | Antico Arciuch VG , Galli S , Franco MC , Lam PY , Cadenas E , Carreras MC , Poderoso JJ ((2009) ) Akt1 intramitochondrial cycling is a crucial step in the redox modulation of cell cycle progression. PLoS One 4: , e7523. |
[88] | Ahmad F , Nidadavolu P , Durgadoss L , Ravindranath V ((2014) ) Critical cysteines in Akt1 regulate its activity and proteasomal degradation: Implications for neurodegenerative diseases. Free Radic Biol Med 74: , 118–128. |
[89] | Jones DP , Carlson JL , Mody VC , Cai J , Lynn MJ , Sternberg P ((2000) ) Redox state of glutathione in human plasma. Free Radic Biol Med 28: , 625–635. |
[90] | Jones DP , Sies H ((2015) ) The redox code. Antioxid Redox Signal 23: , 934–946. |
[91] | Jones DP ((2015) ) Redox theory of aging. Redox Biol 5: , 71–79. |
[92] | Markesbery WR , Lovell MA ((1998) ) Four-hydroxynonenal, a product of lipid peroxidation, is increased in the brain in Alzheimer’s disease. Neurobiol Aging 19: , 33–36. |
[93] | Butterfield DA , Drake J , Pocernich C , Castegna A ((2001) ) Evidence of oxidative damage in Alzheimer’s disease brain: Central role for amyloid beta-eptide. Trends Mol Med 7: , 548–554 . |
[94] | Arimon M , Takeda S , Post KL , Svirsky S , Hyman BT , Berezovska O ((2015) ) Oxidative stress and lipid peroxidation are upstream of amyloid pathology. Neurobiol Dis 84: , 109–115. |
[95] | Patel RS , Ghasemzadeh N , Eapen DJ , Sher S , Arshad S , Ko YA , Veledar E , Samady H , Zafari AM , Sperling L , Vaccarino V , Jones DP , Quyyumi AA ((2016) ) Novel biomarker of oxidative stress is associated with risk of death in patients with coronary artery disease. Circulation 133: , 361–369. |
[96] | Blanco RA , Ziegler TR , Carlson BA , Cheng PY , Park Y , Cotsonis GA , Accardi CJ , Jones DP ((2007) ) Diurnal variation in glutathione and cysteine redox states in human plasma. Am J Clin Nutr 86: , 1016–1023. |
[97] | Li XM , Metzger G , Filipski E , Boughattas N , Lemaigre G , Hecquet B , Filipski J , Levi F ((1997) ) Pharmacologic modulation of reduced glutathione circadian rhythms with buthionine sulfoximine: Relationship with cisplatin toxicity in mice. Toxicol Appl Pharmacol 143: , 281–290. |
[98] | Zhu Y , Carvey PM , Ling Z ((2006) ) Age-related changes in glutathione and glutathione-related enzymes in rat brain. Brain Res 1090: , 35–44. |
[99] | Niwa K , Inanami O , Yamamori T , Ohta T , Hamasu T , Kuwabara M ((2003) ) Redox regulation of PI3K/Akt and p53 in bovine aortic endothelial cells exposed to hydrogen peroxide. Antioxid Redox Signal 5: , 713–722. |
[100] | Cruz-Gregorio A , Aranda-Rivera AK , Pedraza-Chaverri J , Solano JD , Ibarra-Rubio ME ((2022) ) Redox-sensitive signaling pathways in renal cell carcinoma. Biofactors 48: , 342–358. |
[101] | Poon HF , Farr SA , Banks WA , Pierce WM , Klein JB , Morley JE , Butterfield DA ((2005) ) Proteomic identification of less oxidized brain proteins in aged senescence-accelerated mice following administration of antisense oligonucleotide directed at the Abeta region of amyloid precursor protein. Brain Res Mol Brain Res 138: , 8–16. |
[102] | Ghosh D , Levault KR , Brewer GJ ((2014) ) Dual-energy precursor and nuclear erythroid-related factor 2 activator treatment additively improve redox glutathione levels and neuron survival in aging and Alzheimer mouse neurons upstream of reactive oxygen species. Neurobiol Aging 35: , 179–190. |
[103] | Stapper ZA , Jahn TR ((2018) ) Changes in glutathione redox potential are linked to Abeta42-induced neurotoxicity. Cell Rep 24: , 1696–1703. |
[104] | Huang Q , Aluise CD , Joshi G , Sultana R , St Clair DK , Markesbery WR , Butterfield DA ((2010) ) Potential in vivo amelioration by N-acetyl-L-cysteine of oxidative stress in brain in human double mutant APP/PS-1 knock-in mice: Toward therapeutic modulation of mild cognitive impairment. J Neurosci Res 88: , 2618–2629. |
[105] | Farr SA , Poon HF , Dogrukol-Ak D , Drake J , Banks WA , Eyerman E , Butterfield DA , Morley JE ((2003) ) The antioxidants alpha-lipoic acid and N-acetylcysteine reverse memory impairment and brain oxidative stress in aged SAMP8 mice. J Neurochem 84: , 1173–1183. |
[106] | Adair JC , Knoefel JE , Morgan N ((2001) ) Controlled trial of N-acetylcysteine for patients with probable Alzheimer’s disease. Neurology 57: , 1515–1517. |
[107] | Ghosh D , Levault KR , Brewer GJ ((2014) ) Relative importance of redox buffers GSH and NAD(P)H in age-related neurodegeneration and Alzheimer disease-like mouse neurons. Aging Cell 13: , 631–640. |
[108] | Miller ER III , Pastor-Barriuso R , Dalal D , Riemersma RA , Appel LJ , Guallar E ((2005) ) Meta-analysis: High-dosage vitamin E supplementation may increase all-cause mortality. Ann Intern Med 142: , 37–46. |
[109] | Dysken MW , Sano M , Asthana S , Vertrees JE , Pallaki M , Llorente M , Love S , Schellenberg GD , McCarten JR , Malphurs J , Prieto S , Chen P , Loreck DJ , Trapp G , Bakshi RS , Mintzer JE , Heidebrink JL , Vidal-Cardona A , Arroyo LM , Cruz AR , Zachariah S , Kowall NW , Chopra MP , Craft S , Thielke S , Turvey CL , Woodman C , Monnell KA , Gordon K , Tomaska J , Segal Y , Peduzzi PN , Guarino PD ((2014) ) Effect of vitamin E and memantine on functional decline in Alzheimer disease: The TEAM-AD VA cooperative randomized trial. JAMA 311: , 33–44. |
[110] | Bjelakovic G , Nikolova D , Gluud LL , Simonetti RG , Gluud C ((2007) ) Mortality in randomized trials of antioxidant supplements for primary and secondary prevention: Systematic review and meta-analysis. JAMA 297: , 842–857. |
[111] | Aisen PS , Schneider LS , Sano M , Diaz-Arrastia R , van Dyck CH , Weiner MF , Bottiglieri T , Jin S , Stokes KT , Thomas RG , Thal LJ , Alzheimer Disease Cooperative S ((2008) ) High-dose B vitamin supplementation and cognitive decline in Alzheimer disease: A randomized controlled trial. JAMA 300: , 1774–1783. |
[112] | Baum L , Lam CW , Cheung SK , Kwok T , Lui V , Tsoh J , Lam L , Leung V , Hui E , Ng C , Woo J , Chiu HF , Goggins WB , Zee BC , Cheng KF , Fong CY , Wong A , Mok H , Chow MS , Ho PC , Ip SP , Ho CS , Yu XW , Lai CY , Chan MH , Szeto S , Chan IH , Mok V ((2008) ) Six-month randomized, placebo-controlled, double-blind, pilot clinical trial of curcumin in patients with Alzheimer disease. J Clin Psychopharmacol 28: , 110–113. |
[113] | Brewer GJ ((2010) ) Why vitamin E therapy fails for treatment of Alzheimer’s disease. J Alzheimers Dis 19: , 27–30. |
[114] | Subramaniam R , Koppal T , Green M , Yatin S , Jordan B , Drake J , Butterfield DA ((1998) ) The free radical antioxidant vitamin E protects cortical synaptosomal membranes from amyloid β peptide(25-35) toxicity but not from hydroxynonenal toxicity: Relevance to the free radical hypothesis of Alzheimer’s disease. Neurochem Res 23: , 1403–1410. |
[115] | Remington R , Lortie JJ , Hoffmann H , Page R , Morrell C , Shea TB ((2015) ) A nutritional formulation for cognitive performance in mild cognitive impairment: A placebo-controlled trial with an open-label extension. J Alzheimers Dis 48: , 591–595. |
[116] | Katz M , Won SJ , Park Y , Orr A , Jones DP , Swanson RA , Glass GA ((2015) ) Cerebrospinal fluid concentrations of N-acetylcysteine after oral administration in Parkinson’s disease. Parkinsonism Relat Disord 21: , 500–503. |
[117] | Knopman DS , Amieva H , Petersen RC , Chetelat G , Holtzman DM , Hyman BT , Nixon RA , Jones DT ((2021) ) Alzheimer disease. Nat Rev Dis Primers 7: , 33. |
[118] | Fillet H ((2021) ) Alzheimer’s Drug Discovery Foundation. 2021 Alzheimer’s clinical trials. |


