
A Machine Learning Approach for Early Diagnosis of Cognitive Impairment Using Population-Based Data
Abstract
Background:
The major mechanisms of dementia and cognitive impairment are vascular and neurodegenerative processes. Early diagnosis of cognitive impairment can facilitate timely interventions to mitigate progression.
Objective:
This study aims to develop a reliable machine learning (ML) model using socio-demographics, vascular risk factors, and structural neuroimaging markers for early diagnosis of cognitive impairment in a multi-ethnic Asian population.
Methods:
The study consisted of 911 participants from the Epidemiology of Dementia in Singapore study (aged 60– 88 years, 49.6% male). Three ML classifiers, logistic regression, support vector machine, and gradient boosting machine, were developed. Prediction results of independent classifiers were combined in a final ensemble model. Model performances were evaluated on test data using F1 score and area under the receiver operating curve (AUC) methods. Post modelling, SHapely Additive exPlanation (SHAP) was applied on the prediction results to identify the predictors that contribute most to the cognitive impairment prediction.
Findings:
The final ensemble model achieved a F1 score and AUC of 0.87 and 0.80 respectively. Accuracy (0.83), sensitivity (0.86), specificity (0.74) and predictive values (positive 0.88 negative 0.72) of the ensemble model were higher compared to the independent classifiers. Age, ethnicity, highest education attainment and neuroimaging markers were identified as important predictors of cognitive impairment.
Conclusion:
This study demonstrates the feasibility of using ML tools to integrate multiple domains of data for reliable diagnosis of early cognitive impairment. The ML model uses easy-to-obtain variables and is scalable for screening individuals with a high risk of developing dementia in a population-based setting.
INTRODUCTION
Dementia has become an increasingly important public health issue due to the rapid aging of societies. Alzheimer’s disease (AD) and vascular dementia are the most common causes of dementia affecting the elderly [1]. While there is no available disease modifying treatment for dementia, an accurate and early diagnosis will help identify individuals at risk and allow the adoption of preventive measures to mitigate this disease [2, 3].
The prodromal stages of dementia is characterized by mild cognitive impairment (MCI) [4], i.e., individuals with noticeable decline in mental abilities not interfering with everyday activities [5]. Previous studies suggest that individuals with MCI are at a higher risk of dementia than cognitively healthy individuals [6, 7]. The conventional practice of diagnosing cognitive impairment focuses on cognitive and neuropsychological assessments [8]. However, these diagnostic tools have been criticized for detecting the disease late. Studies have shown dementia to be a slowly progressive disease and lesions in the brain could be shown as early as 10–15 years before onset of clinical symptoms [9–11]. More recently, biomarker-based diagnostics such as amyloid-β and tau proteins detected using positron emission tomography (PET) scans and cerebrospinal fluid (CSF) analysis have been recognized as promising markers for pathology [12]. While these biomarkers offer high predictive ability, their high cost and invasive procedures have hindered their widespread use [13]. By contrast, magnetic resonance imaging (MRI) is a non-invasive procedure commonly used in general clinical practice for the visualization of soft tissue structure [14]. Previous studies have demonstrated the potential of structural MRI scans as sensitive biomarkers for the diagnosis of early cognitive impairment [15–17]. As dementia is a complex multi-factorial disease, it is desirable to combine data from multiple domains to better characterize its causes and progression [10, 18].
In the recent years, clinical prediction models developed using artificial intelligence (AI) and machine learning (ML) have gained substantial interest in the healthcare community. ML is a subtype of AI that offers a class of models, often described as more efficient and accurate than conventional regression models [19]. ML can analyze large complex medical data and unravel hidden dependencies between factors and outcomes [20, 21]. ML-based models have been successfully applied to various disease outcome prediction studies [21, 22] as well as in dementia and AD detection [4, 13, 23, 24]. These studies demonstrate the capability of ML models in assisting patient diagnosis and reducing disease and health system burden [19]. Identifying individuals with cognitive impairment by applying ML techniques on structural MRI biomarkers and routinely available clinical variables provides a cost-effective means to detect at-risk individuals in a population-based setting [13]. Hence, this study aims to use ML models to combine MRI biomarkers with conventional clinical variables for early diagnosis of cognitive impairment. We hypothesize that our ML model consisting of socio-demographics, vascular risk factors and neuroimaging biomarkers predicts cognitive impairment in a multi-ethnic Asian population.
MATERIALS AND METHODS
Study participants
Data used in this study were obtained from the Epidemiology of Dementia in Singapore (EDIS) study. EDIS is a subsample of population-based study (i.e., Singapore Epidemiology of Eye Diseases) that identifies the prevalence and risk factors for cognitive impairment and dementia. Recruitment of participants and data collection methodology were described in previous study [25]. Briefly, the EDIS participants consist of Singaporean citizens or permanent residents from three ethnic groups (i.e., Chinese, Malay, and Indian) aged≥60 years. The study participants were screened using the Abbreviated Mental Test (AMT) and the Progressive Forgetfulness Questionnaire (PFQ). Screen positives were defined as: an AMT score of≤6 for those who received≤6 years of formal education, an AMT score of≤8 for those who received > 6 years of formal education, or if the caregiver reported a history of progressive forgetfulness. Screened positives (n = 957) agreed to be assessed at the National University of Singapore where clinical, neuropsychological assessment, neuroimaging scans, and laboratory test data were collected. Of the 957 individuals, 46 were diagnosed with dementia and hence were excluded from the study leaving a final sample size of 911 for analysis. Ethics approval for this study was obtained from the National Healthcare Group-specific Review Board and the Singapore Eye Research Institute. Informed consent was also obtained from the study participants in their preferred language.
Predictors
Three sets of predictors (socio-demographics and genetic risk factor, vascular risk factors, and neuroimaging biomarkers) were considered for model development. Socio-demographics and vascular risk factors were obtained from interviewer administered questionnaire. Data collected included age, sex, ethnicity, highest education attainment, smoking status, and body mass index. Blood pressure readings of participants were measured twice with 5 minute interval. Systolic (SBP) and diastolic (DBP) blood pressure were derived using average of the two readings. Hypertension was defined as having a SBP≥140 mmHg, a DBP≥90 mmHg, and/or use of anti-hypertensive medication. Hyperlipidemia was defined as a total cholesterol level≥4.14 mmol/l, or the use of lipid-lowering medication. Diabetes mellitus was defined as a glycated hemoglobin (HbA1c)≥6.5%, or the use of anti-diabetic medication. Apolipoprotein ɛ4 (APOE ɛ4) status was obtained from genome-wide genotyping using the Illumina Human610-Quad BeadChip with the 1000 Genomes (phase 1, version 3) reference panel used for imputation as described in previous study [25].
Neuroimaging markers used in this study were acquired from 3T Siemens Magnetom Trio Tim scanner. Volumetry MRI data were obtained using FreeSurfer, v.5.1, automatic image processing software on T1-weighted images. The neuroimaging markers consisted of total grey matter volume (GMV), white matter volume (WMV), intracranial volume, average hippocampus volume, and white matter hyperintensities (WMH). Presence of lacunes, cortical microinfarcts, cerebral microbleeds, cortical infarcts, and intracranial stenosis were expressed as binary representation (1 = present and 0 = absent). Brain atrophy gradings follow a binary label (0 = none to mild, 1 = moderate to severe). The grading of neuroimaging markers were performed by experienced raters using T1-weighted, T2-weighted, and fluid-attenuated inversion recovery (FLAIR) sequences [26]. Cerebral microinfarct were identified by lesions < 5 mm diameter in the cortex, perpendicular to the cortical surface which were hyperintense or isointense on FLAIR and T2. Cortical infarcts were identified as focal lesions involving cortical gray matter with a hyperintense rim on FLAIR images and a center following CSF intensity. Lacunes were deemed as lesions between 3 to 15 mm in diameter in the subcortical regions, with low signal on T1-weighted image and FLAIR, a high signal on T2-weighted image, and a hyperintense rim with a center following CSF intensity on FLAIR. Cerebral microbleeds were defined as lesions of hyperintensity graded on susceptibility-weighted images using the Brain Observer Microbleed Scale [2] Lastly, intracranial stenosis was graded on magnetic resonance angiography and was defined as stenosis≥50% in the internal carotids, vertebral, basilar, posterior cerebral, middle cerebral, and/or anterior cerebral arteries. Supplementary Table 1 details the list predictor variables and their representation in each set.
Outcome
Cognitive status was assessed using a composite global cognitive score established previously [25]. The scores were calculated and standardized across seven cognitive domains (five non-memory and two memory). Participants were assigned a label of either no cognitive impairment (NCI), cognitive impairment no dementia (CIND) mild, or CIND moderate. As our study aim was to distinguish individuals with cognitive impairment from those with NCI, no distinction between subgroup of cognitive impairment (i.e., CIND mild or moderate) were made. A total of 623 (68.4%) participants had a clinical diagnosis of cognitive impairment.
Statistical analysis
To ensure model parsimony, we performed tests of association with cognitive outcome using chi-square test for categorical variables, student’s t-test for continuous variables, Wilcoxon signed rank test for continuous variables with skewed distribution. Variables were selected for ML models if their association with cognitive outcome were found to be significant at p-value≤0.05 or if the predictors were known risk factors of dementia (APOE ɛ4). In addition, DBP and cholesterol low-density lipoprotein (LDL) with p-values of 0.08 and 0.07 respectively was also considered for modelling. A total of 22 predictor variables with five socio-demographics, six vascular risk factors and 11 neuroimaging markers were selected for ML model development.
Machine learning models
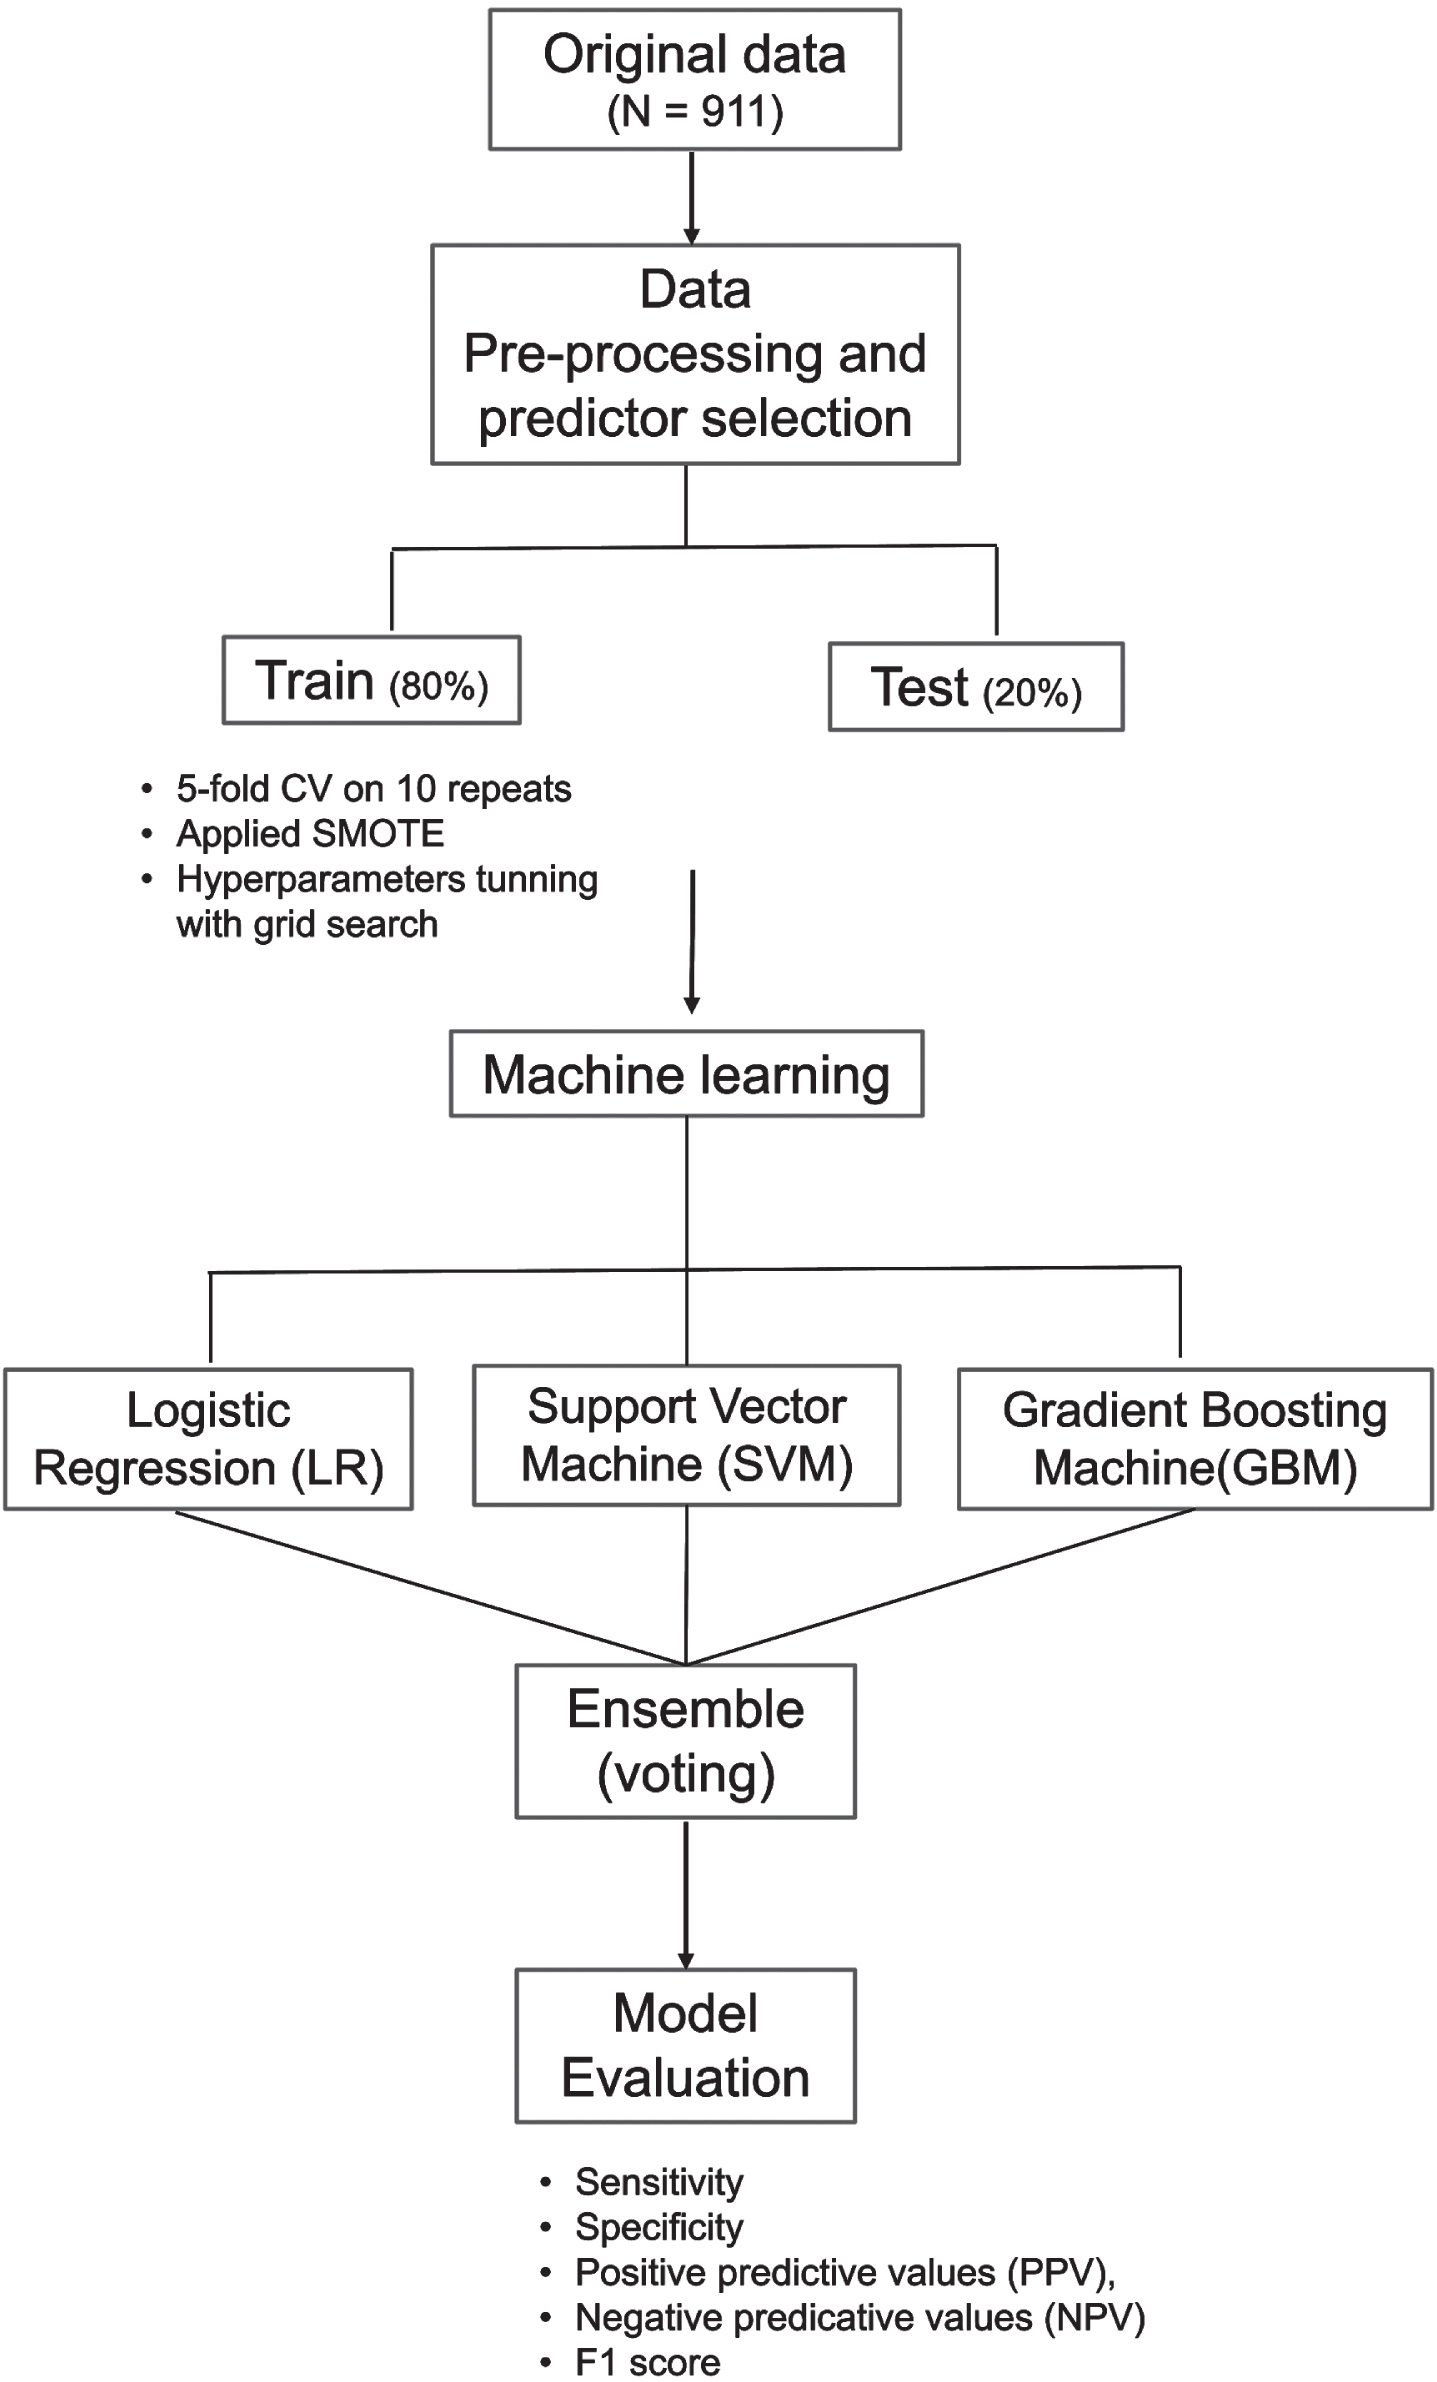
Figure 1 illustrates the ML pipeline. We developed ML models using three classifiers, namely, logistic regression (LR), support vector machine (SVM), and gradient boosting machine (GBM). Prediction results of the three classifiers was subsequently combined in an ensemble model using a majority vote. The three classifiers (LR, SVM, and GBM) were chosen as they are widely used in various clinical research [27–29] and had delivered promising performance in discriminating individuals with dementia, MCI, and NCI [27, 30]. The different types of ML classifiers and their complexities have been explained elsewhere in detail [31]; hence, a brief summary is presented here:
Fig. 1
Machine learning pipeline. The machine learning model consist of three classifiers, logistic regression (LR), support vector machine (SVM), and gradient boosting machine (GBM). Prediction results of LR, SVM, and GBM combined in an ensemble model to derive the final prediction using majority vote. Model was trained and validated using five-fold cross validation (CV) on 10 repeats. Synthetic minority over-sampling technique (SMOTE) was applied on the train data.
LR is a classic ML algorithm that uses the maximum likelihood estimation to predict the risk of cognitive impairment. The SVM algorithm uses hyperplanes and a set of mathematical function (kernel) to classify individuals as cognitive impairment or NCI. The kernel function allows the data to be modelled in a non-linear fashion [32]. GBM is an efficient ensemble classifier that combines learning from a set of weak classifiers into a strong classifier by sequentially training the algorithms over multiple iterations [33, 34]. Finally, the voting ensemble was derived from the idea of “wisdom of crowds”. It suggests that a single base classifier may not perform well due to high bias or variance. However, combining the results of several classifiers can work collectively to compensate their shortcomings and achieve better model performance than individual classifiers [34, 35]. For ensemble classifier to outperform than base classifiers, the base classifiers are preferred to be diverse in nature [30, 36].
Using the selected predictors, we randomly partitioned the data into two sets: 80% training and 20% testing [37]. Training data was used for model development and hyperparameter tuning while testing data was reserved for model evaluation. The classifiers were trained independently on five-fold cross-validation with 10 repeats to maximize the number of samples available for classifiers to learn underlying relationship. Training performances were averaged across the 10 repetitions. Hyperparameters were tuned using the grid search approach with AUC as the scoring metric. Grid range for hyperparameter searches along with optimal parameters for each classifier were detailed in supplementary materials Table 2. The optimized parameter for each classifier were saved and applied on testing data. As the EDIS dataset have an imbalanced class distribution with higher proportion of individuals with cognitive impairment (68.4%) compared to NCI (31.6%), synthetic minority over-sampling technique (SMOTE) was applied on the training data to balance the class distribution [22].
Explanatory analysis was performed on every predictor to examine their distribution and association with cognitive outcome. Log transformation was performed on triglycerides and WMH with right skewed distribution. Variables with missing data were mainly related to laboratory, neuroimaging markers and APOE ɛ4 carrier status. Missing data for each variable were described in Supplementary Table 3. Missing data were imputed using a ML-based imputation technique, k-Nearest Neighbors (kNN). kNN is a ML-based imputation technique that uses a distance measure computation. The approach is simple and efficient [38] and the imputation does not require specification of relationship between outcome and predictor variables; hence, they are less prone to model misspecification [39]. Our study used the kNN algorithm on Euclidean distance with k = 5 for estimating the missing values. We have also explored an advanced imputation technique, Multiple Imputation by Chained Equation (MICE) method [40] as an alternative to kNN imputation. The test of associations between predictors and cognitive impairment outcome using kNN and MICE imputation leads to the same set of significant predictors with modest change in p-values. Predictor variables were normalized using a min-max scaler to transform the data into uniform range between 0 to 1. The normalized data were fitted into respective models and results from each model were recorded and compared.
Evaluation
Performance of the ML models were evaluated on testing data using sensitivity, specificity, positive predictive values (PPV), negative predicative values (NPV), and F1 scores. Details of each metric can be found in Supplementary Material 1. Briefly, we defined participants with cognitive impairment as true positive (TP) otherwise as true-negative (TN) if participants are correctly predicted by the ML model. Participants were deemed as false positive (FP) or false negative (FN) if being wrongly predicted by the ML model. The F1 score is a harmonic metric that combines sensitivity (recall) and PPV (precision) based on a formula as follows:
F1 score ranges between 0 and 1. F1 score is suitable to assess ML model trained and tested on imbalance datasets.
All analysis was performed using open-source software Python version 3.8.8, tableone 0.7.12 and scikit-learn 1.1.1 libraries.
Model interpretability
There has been an inherent trade-off between prediction accuracy and interpretability in modelling. ML models are often trained to optimize prediction accuracy at reduced interpretability. Hence, ML models are deemed to be ‘black boxes’ as they were developed on complex algorithmic functions that are not easily interpretable or comprehensible by humans [41]. To address the issue of black-box predictions in ML, we applied an explainer model, Shapley Additive Explanations (SHAP) to data generated by the ensemble ML model to understand how the algorithm make its prediction. This method has been previously described [5, 42, 43] and was applied to studies on dementia and cognitive impairment. More details on SHAP explainer model can be found in Supplementary Material 2. Briefly, the SHAP explainer model computes the SHAP values to quantify how much each input feature contribute to the predicted output. These values were subsequently used to rank features and visualize important relationships [43]. A high value suggests that the predictor is important and has a strong influence in prediction of cognitive impairment.
RESULTS
Participant characteristics
The risk factors of cognitive impairment and their corresponding p-values in test of association for 911 study participants were presented in Table 1. The prevalence of cognitive impairment was 68.4%. There were 32.2% Chinese, 32.5% Malay, and 35.3% Indian. The mean age of study participants was 69.8±6.4 years and 49.5% of the participants were male. A total of 18.9% of the participants reported having no formal education and 11.4% received tertiary education. A high prevalence of hyperlipidemia and hypertension was observed among EDIS participants at 76.0% and 80.0% respectively.
Table 1
Characteristics of study participants based on cognitive impairment status
| Risk factors | Overall | NCI | Cognitive | p |
| N = 911 | N = 288 | Impairment | ||
| N = 623 | ||||
| Socio-demographics and genetic risk factors | ||||
| Age, years | 69.8±6.4 | 66.9±5.0 | 71.1±6.5 | < 0.001 |
| Sex (male) | 452 (49.6) | 173 (60.1) | 279 (44.8) | < 0.001 |
| Race | < 0.001 | |||
| Chinese | 293 (32.2) | 128 (44.4) | 165 (26.5) | |
| Indian | 322 (35.3) | 101 (35.1) | 221 (35.5) | |
| Malay | 296 (32.5) | 59 (20.5) | 237 (38.0) | |
| Highest education attainment | < 0.001 | |||
| Nil | 172 (18.9) | 14 (4.9) | 158 (25.4) | |
| Primary | 380 (41.7) | 113 (39.2) | 267 (42.9) | |
| Secondary | 255 (28.0) | 102 (35.4) | 153 (24.6) | |
| Tertiary | 104 (11.4) | 59 (20.5) | 45 (7.2) | |
| Apolipoprotein ɛ4 (APOE ɛ4) | 117 (16.9) | 34 (15.0) | 83 (17.8) | 0.429 |
| Vascular risk factors | ||||
| Smoking | 257 (28.2) | 85 (29.5) | 172 (27.6) | 0.607 |
| Body mass index | 25.6±4.6 | 25.6±4.1 | 25.6±4.8 | 0.986 |
| SBP, mmHg, | 146.1±19.1 | 143.8±18.6 | 147.1±19.2 | 0.014 |
| DBP, mmHg | 77.1±10.7 | 78.0±10.5 | 76.7±10.7 | 0.078 |
| Total cholesterol, mmol/L | 5.0±1.1 | 5.0±1.0 | 5.0±1.1 | 0.347 |
| Cholesterol HDL, mmol/L | 1.4±0.4 | 1.4±0.4 | 1.4±0.4 | 0.300 |
| Cholesterol LDL, mmol/L | 3.1±0.9 | 3.1±0.9 | 3.0±1.0 | 0.073 |
| Triglycerides, mmol/L | 1.5 [1.0,2.1] | 1.4 [1.0,2.1] | 1.5 [1.1,2.1] | 0.639 |
| Glycated hemoglobin (HbA1c) | 6.0±1.5 | 5.9±1.6 | 6.0±1.4 | 0.129 |
| Diabetes | 335 (36.8) | 91 (31.6) | 244 (39.2) | 0.033 |
| Hyperlipidemia | 692 (76.0) | 202 (70.1) | 490 (78.7) | 0.007 |
| Hypertension | 731 (80.2) | 212 (73.6) | 519 (83.3) | 0.001 |
| History of stroke | 43 (4.7) | 8 (2.8) | 35 (5.6) | 0.087 |
| Neuroimaging markers | ||||
| Presence of lacunes | 132 (14.5) | 17 (5.9) | 115 (18.5) | < 0.001 |
| Presence of cortical microinfarcts | 45 (4.9) | 7 (2.4) | 38 (6.1) | 0.027 |
| Presence of cerebral microbleeds | 281 (30.8) | 75 (26.0) | 206 (33.1) | 0.040 |
| Presence of infarct | 23 (2.5) | 3 (1.0) | 20 (3.2) | 0.087 |
| Presence of intracranial stenosis | 104 (11.4) | 24 (8.3) | 80 (12.8) | 0.060 |
| Total grey matter volume, ml | 515.9±63.9 | 525.6±54.2 | 511.4±67.4 | 0.001 |
| Total white matter volume, ml | 352.6±52.9 | 366.2±43.8 | 346.4±55.6 | < 0.001 |
| Hippocampus volume, ml | 3.5±0.4 | 3.7±0.4 | 3.4±0.4 | < 0.001 |
| White matter hyperintensities | 1.5 [0.4,4.4] | 1.1 [0.3,3.0] | 1.7 [0.5,5.2] | < 0.001 |
| Total intracranial volume, ml | 1060.5±111.2 | 1085.2±108.5 | 1049.3±110.6 | < 0.001 |
| Central atrophy | 239 (26.2) | 53 (18.4) | 186 (29.9) | < 0.001 |
| Cortical atrophy | 383 (42.0) | 89 (30.9) | 294 (47.2) | < 0.001 |
| Medial temporal atrophy | 288 (31.6) | 61 (21.2) | 227 (36.4) | < 0.001 |
Continuous variables were expressed as a mean value (±SD), while categorical variables expressed as number (percentage %). Test of association with cognitive impairment status for normally distributed continuous variables and categorical variables were performed using student’s t-test and chi-square respectively. Non normally distributed variables (triglyceride and white matter hyperintensities) were expressed as median [IQR] and compared using the Wilcoxon signed rank test (also known as Mann-Whitney U test). A two-tailed p-value (≤0.05) was considered statistically significant. NCI, no cognitive impairment; SBP, systolic blood pressure; DBP, diastolic blood pressure; HDL, high-density lipoprotein; LDL, low-density lipoprotein.
Preliminary analysis showed no statistical difference in most explanatory variables between participants with complete data vs participants with missing data except for APOE ɛ4 carrier and presence of cerebral microbleeds. Compared to participants in the complete data sample, a higher proportion of participants in the missing data sample were non APOE ɛ4 carrier (92.1% versus 81.8%, p = 0.02) and have no cerebral microbleeds (73.9% versus 66.7%, p = 0.03). See Supplementary Table 4.
Participants with cognitive impairment were observed to be older (mean age of 71.1±6.5), more likely to be female, non-Chinese, with no or low educational attainment and were diabetic and hypertensive. Neuroimaging markers differed significantly between participants with and without cognitive impairment. Participants with cognitive impairment have lower subcortical structure volume, higher prevalence of lacunes, infarcts, cortical microinfarcts, cerebral microbleeds, and intracranial stenosis compared to participants with NCI. Atrophy in central, cortical, and medial temporal regions were also more apparent among participants with cognitive impairment.
Modelling results
A summary of the prediction result was presented in Table 2. F1 scores for LR, SVM, and GBM ranged between 0.78-0.81. Among the three classifiers, SVM achieved the highest sensitivity and NPV at 0.81 and 0.59, while GBM recorded the highest specificity and PPV at 0.71 and 0.85 respectively. Combining the predictions results of three classifiers, F1 score of the ensemble model was raised to 0.87 along with increased sensitivity, specificity, PPV, and NPV at 0.86, 0.74, 0.88, and 0.72 respectively. Figure 2 showed the receiver operating characteristic (ROC) curves along with AUC values for LR, SVM, GBM, and ensemble model.
Table 2
Summary of the prediction results for LR, SVM and GBM
| Evaluation | LR1 | SVM2 | GBM3 | Ensemble |
| Accuracy | 0.71 | 0.74 | 0.73 | 0.83 |
| F1 | 0.78 | 0.81 | 0.79 | 0.87 |
| AUC | 0.69 | 0.71 | 0.73 | 0.80 |
| FPR | 0.38 | 0.40 | 0.29 | 0.26 |
| Sensitivity / Recall / TPR | 0.75 | 0.81 | 0.74 | 0.86 |
| Specificity / TNR | 0.62 | 0.60 | 0.71 | 0.74 |
| PPV / Precision | 0.81 | 0.81 | 0.85 | 0.88 |
| NPV | 0.54 | 0.59 | 0.56 | 0.72 |
1LR denotes logistic regression; 2SVM denotes support vector classifier; 3GBM denotes gradient boosting. Ensemble model contains the prediction results of LR, SVM and GBM. Final prediction was based on majority vote. Evaluation was based on test data. The bold values indicate the best performance. LR, logistic regression; SVM, support vector machine; GBM, gradient boosting machine; AUC, area under the curve, FPR, false positive rate; TPR, true positive rate; TNR, true negative rate; PPV, positive predictive values; NPV, negative predicative values.
Fig. 2
Receiver operating characteristic (ROC) curves along with AUC values for LR, SVM, GBM, and ensemble model. AUC of the ensemble model was 0.80, approximately 12.7% better than average AUC of the independent classifiers.
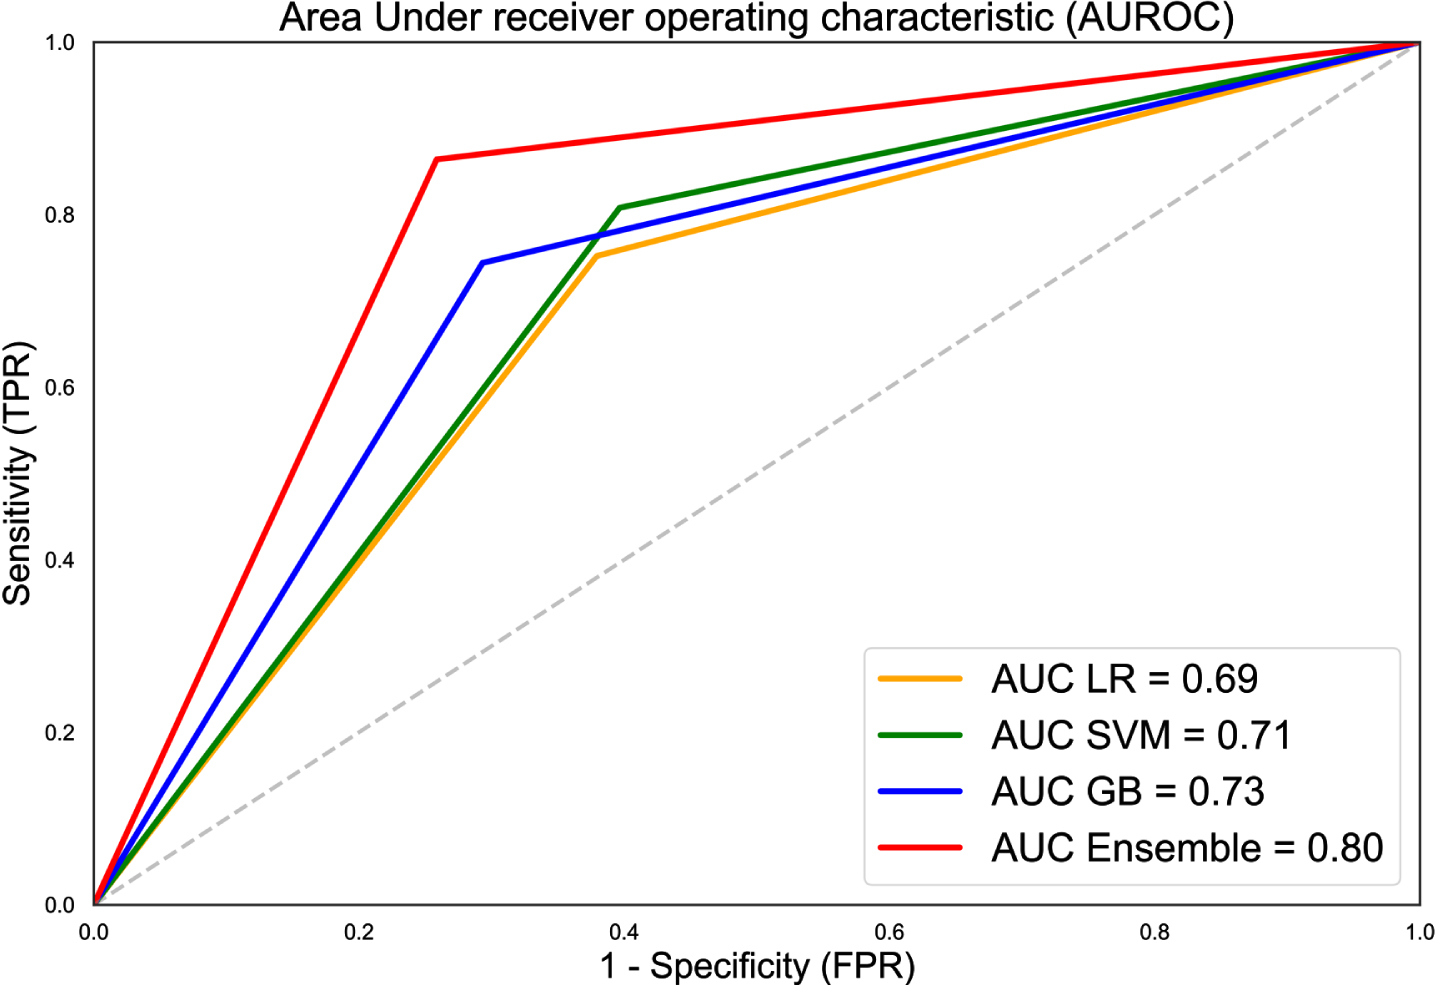
In Fig. 2, the diagonal line corresponds to the receiver operating characteristic curve (ROC) curve of a classifier that makes prediction at random. ROC of all three classifiers had a larger area under curve (AUC) compared to the random model suggesting higher prediction ability. AUC was further enhanced when the results of the three classifiers were combined in an ensemble model. This was illustrated by ROC of the ensemble model having substantially larger AUC and being nearer to the upper left corner of the plot compared to ROC of the individual classifiers.
Feature importance
Figure 3 showed the SHAP summary plot that combines feature importance with feature effects for all 911 participants. Each point on the summary plot represents a Shapley value for a feature and an instance. Feature importance were ordered top down along the y-axis according to their importance. Value of the feature was denoted by color, with higher feature values being redder. Data points clustered at the vertical line where Shapley value axis was zero suggest the predictors have little influence on the prediction.
Fig. 3
Feature importance from SHAP analysis. Vertical axis indicates the features, ordered top down, from the most to the least important predictors. Horizontal axis indicates the SHAP values. Each point represents an observation in the data. The points were colored according to the value of the feature; pink color indicates direct association with cognitive impairment outcome and blue color indicates inverse association with cognitive impairment outcome.
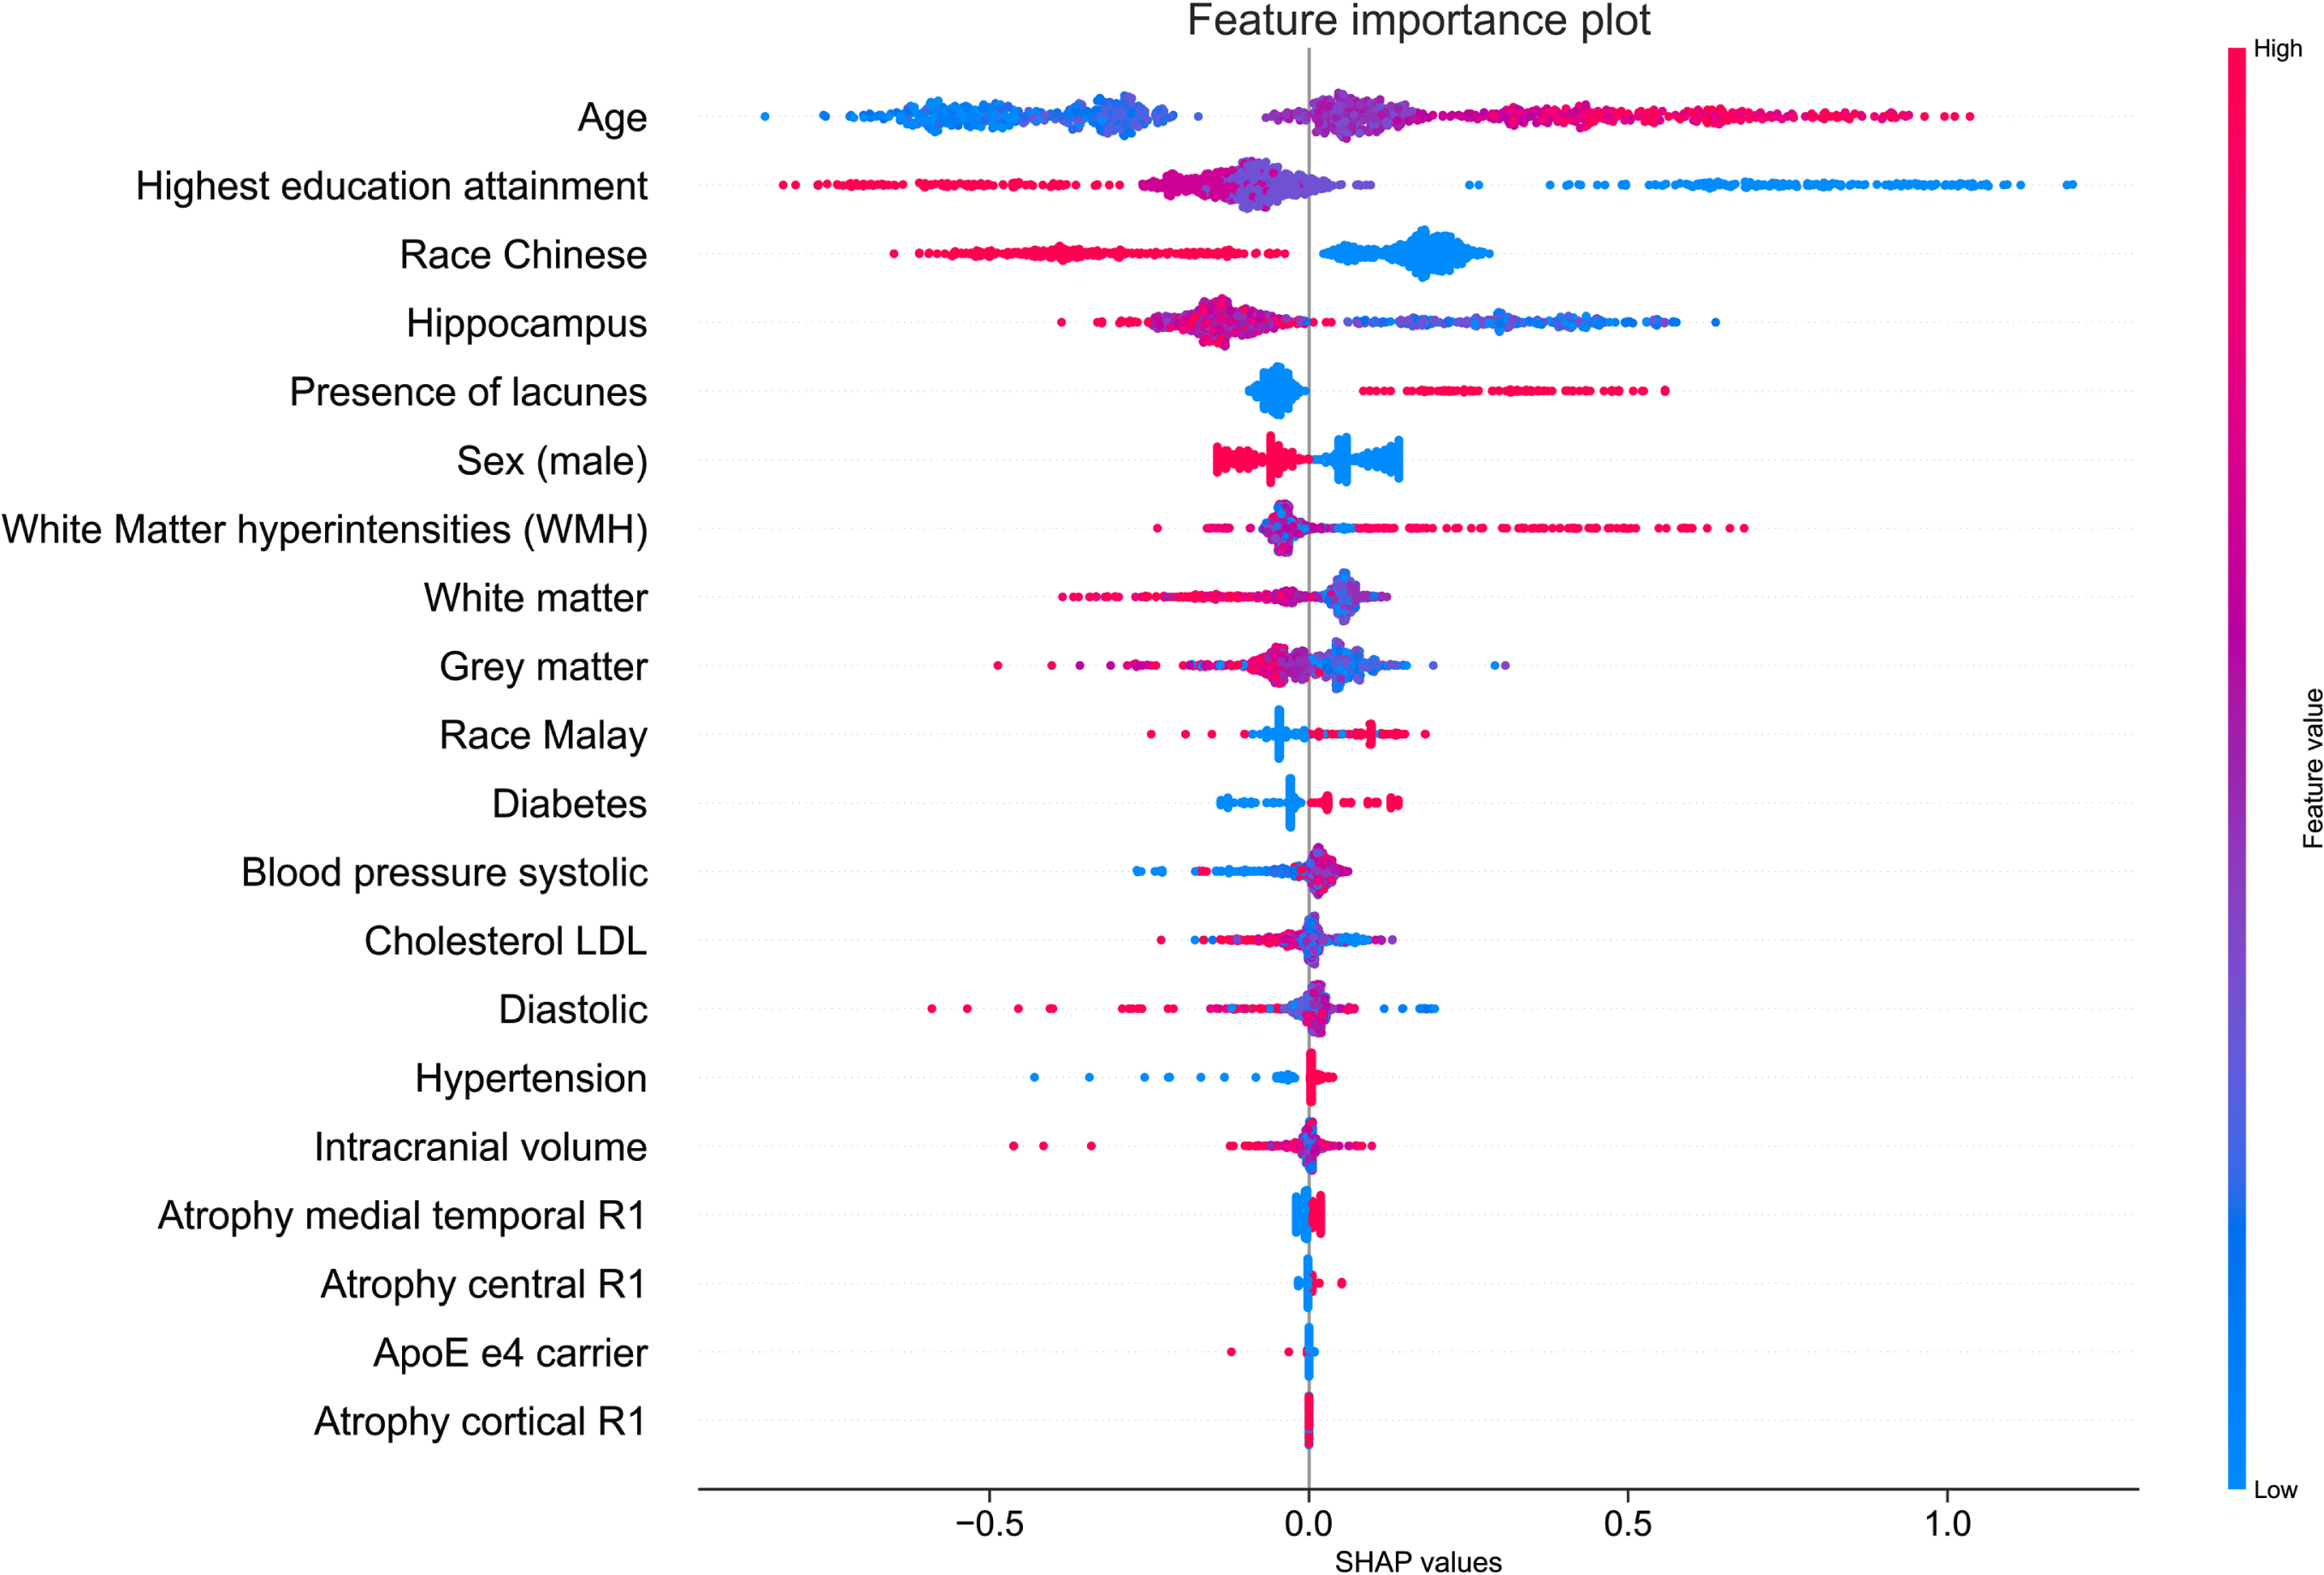
Figure 3 showed age as the most important feature to predict Shapley values. Increased age was associated with high Shapley values (colored in pink) and increased likelihood of being predicted as cognitive impairment. The second and third most important feature was education attainment and race being Chinese. Having a tertiary education attainment or being a Chinese (colored in blue) was associated with low Shapley values and were negative predictors of cognitive impairment. The volume of the hippocampus was the fourth most important feature to predict the Shapley values. Increased hippocampus volume was associated low Shapley values and reduced likelihood of being predicted as having cognitive impairment. In summary, the SHAP summary plot illustrated that being older, having lacunes, higher WMH volume, and having diabetes were positive predictors of cognitive impairment, while a tertiary education attainment, being Chinese, male, having larger hippocampus and GMV were negative predictors of cognitive impairment. To provide greater clarity on the effect magnitude, a complementary mean SHAP plot can be found in Supplementary Figure 1. The mean SHAP plot aggregates the mean of the absolute SHAP values across all 911 participants. Predictors with large mean SHAP values have significant impact on the model’s cognitive impairmentpredictions.
Unlike the SHAP summary plot in Fig. 3 that analyzed prediction results at the aggregated level, the SHAP force plot in Fig. 4 showed prediction results analyzed at the individual level. We present two random cases of correct cognitive outcome prediction and two random cases of incorrect cognitive outcome prediction. Figure 4A illustrates the force plot of a correctly predicted case of cognitive impairment. The model correctly predicts with high probability of 0.80 that the individual has cognitive impairment. The model’s prediction was supported by Shapley values from lower WMV, presence of lacunes, and low education attainment.
Fig. 4
A) SHAP force plot of a correctly predicted case of cognitive impairment. Bolded value indicates the likelihood of cognitive impairment based on ensemble model. Pink indicates predictors that contribute to cognitive impairment prediction, while blue color indicates towards no cognitive impairment. B) SHAP force plot of a correctly predicted case of no cognitive impairment (NCI). C) SHAP force plot of an incorrectly predicted case of cognitive impairment. D) SHAP force plot of an incorrectly predicted case of no cognitive impairment (NCI).
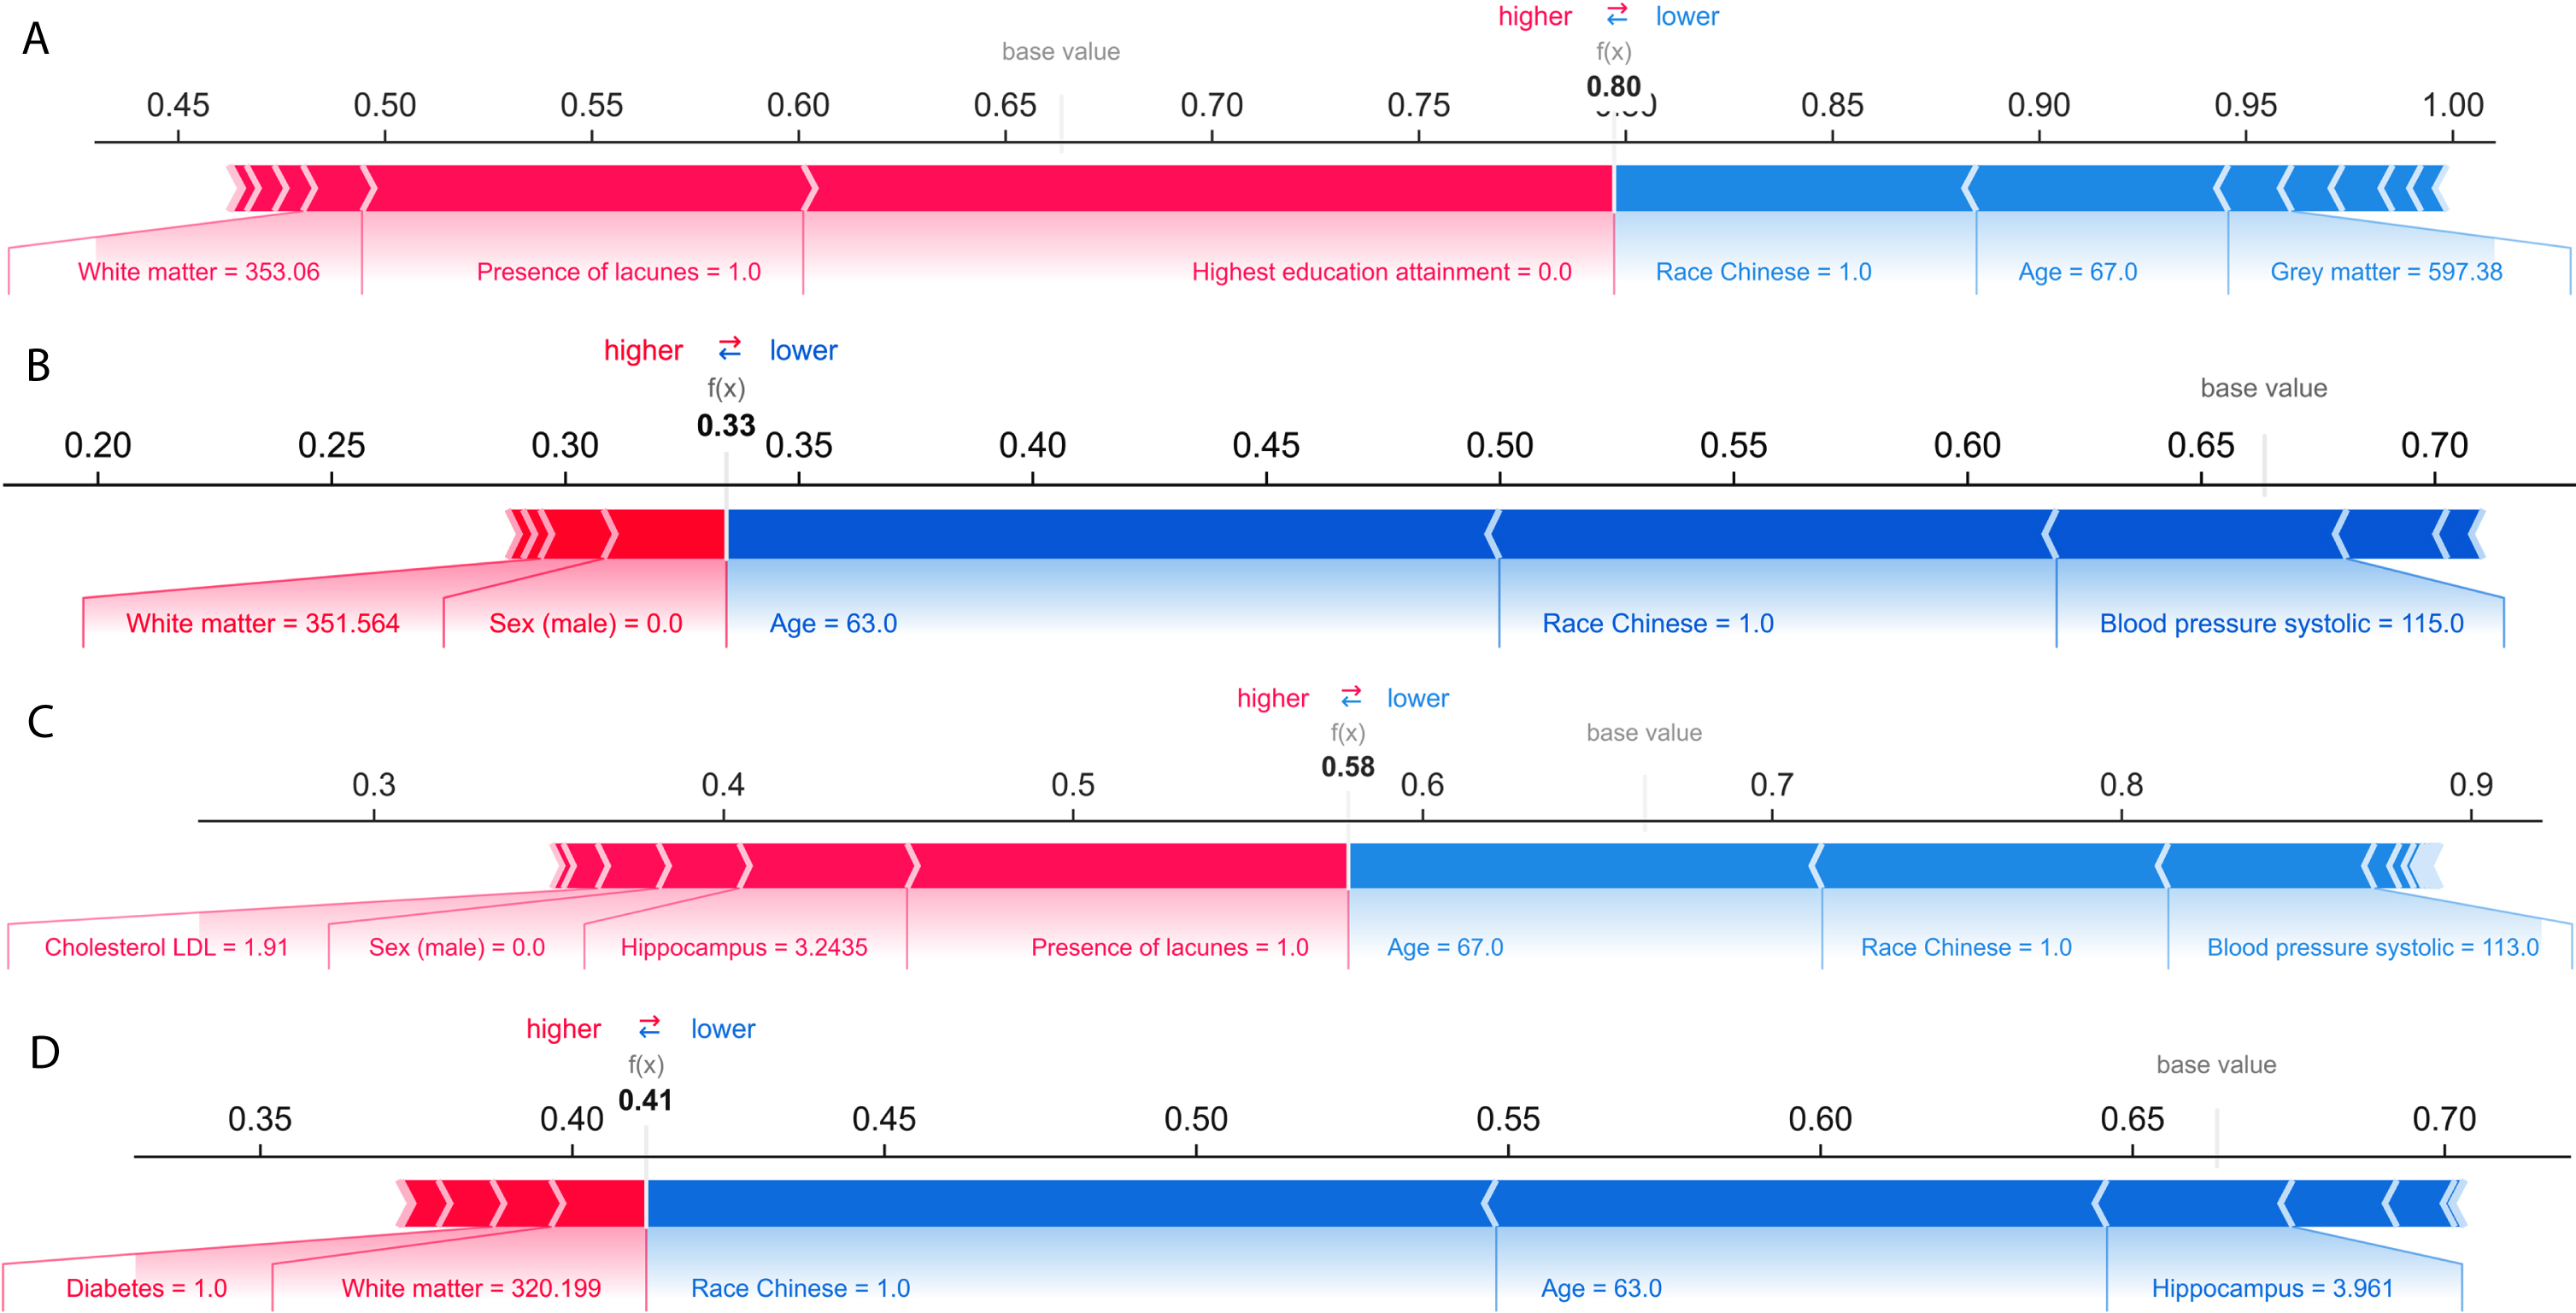
Figure 4B illustrates the force plot of a correctly predicted case of NCI. The model correctly predicts with high probability of 0.67 (1-0.33) that the individual to be negative case of cognitive impairment. Being younger, Chinese, and having healthy SBP were identified as negative prognostic predictors of cognitive impairment.
Figure 4C illustrates the force plot of an incorrect prediction of cognitive impairment. The model incorrectly predicts the individual to cognitively impaired with probability of 0.58. Predictors that favored the cognitive impairment prediction were being female, having lacune, lower hippocampus volume, and having higher cholesterol LDL.
Figure 4D illustrates the force plot of an incorrect prediction of NCI. The model incorrectly predicts the individual to be NCI with probability of 0.59 (1-0.41). Predictors that favored the NCI prediction were being Chinese, younger, and higher hippocampus volume.
DISCUSSION
In this study, we demonstrated that ML models can integrate multiple domains of data from socio-demographic, vascular risk factors, and neuroimaging markers for accurate early diagnosis of cognitive impairment. We showed that while independent ML classifiers (LR, SVM, and GBM) performed well in discriminating individuals with cognitive impairment, combining their results in a voting ensemble can further enhance the performance of the ML models. Post modelling, the SHAP explainer model identified factors such as age, ethnicity, education attainment, and structural neuroimaging markers as important predictors of cognitive impairment. ML models can efficiently integrate multiple domains of data and offer a scalable approach to predict cognitive impairment in population-based setting.
Cognitive impairment prediction
Three ML classifiers namely, LR, SVM, and GBM were explored. All classifiers achieved good accuracy and F1 scores with an average of 0.7 and above. Among the three classifiers, LR had the worst performance while performance of SVM and GB were largely similar with modest differences in sensitivity, specificity, PPV, and NPV. We found the performance of the voting ensemble model outperformed those of the individual classifiers. Compared to the average accuracy (0.73) and F1 score (0.79) of the three classifiers, the ensemble model achieved an accuracy of 0.83 (13.2% higher) and F1 score of 0.87 (9.6% higher). The better performance of the ensemble model was consistent with findings from studies [30, 44, 45] that adopt ensemble model for clinical diagnosis.
The SHAP explainer model enhances the ML model’s transparency and interpretability. An interpretable model provides essential reasoning behind the predictions, hence, increases its trust and acceptability in clinical practice [46]. Among the three set of predictors, neuroimaging markers such as volumetric findings and WMH were more sensitive to prediction of cognitive impairment. In addition, being older, non-Chinese, and having low education attainment increased the probability of being predicted as a positive case of cognitive impairment. Previous studies on clinical prediction models [10, 18, 47] for dementia diagnosis have already established specific risk factors of cognitive impairment. Our findings on socio-demographic predictors were consistent with previous studies that investigate the use easy-to-obtain and routine variables for detecting MCI among community-dwelling elderly [13]. Findings on structural neuroimaging biomarkers reinforce the importance of GMV, WMV, and hippocampus as sensitive biomarkers for early diagnosis of cognitive impairment and AD dementia [48, 49].
Our study found ethnicity to be the third most important predictor of cognitive impairment and those of Chinese ethnicity had a lower likelihood of cognitive impairment compared to non-Chinese. This finding concurred with previous studies [25, 50, 51] where it was shown that racial/ethnic disparities exist, and Chinese had lower prevalence of cognitive impairment compared to Indians and Malays. The lower prevalence of cognitive impairment among Chinese remained significant after controlling for demographic and vascular risk factors. The prevalence of cognitive impairment among non-Chinese may be influenced by factors related to their level of education, dietary habits, and genetic factors such as APOE ɛ4 [51].
While vascular risk factors reported by other studies demonstrated close association with cognitive function, they appeared less important compared to neuroimaging biomarkers in this study. We attribute this finding to the selection criteria of EDIS study recruitment. EDIS data included participants aged 60 years and above. These participants were observed to have high prevalence of chronic conditions such as hyperlipidemia compared to other age groups in Singapore [51]. Among participants with diabetes, hyperlipidemia, and hypertension, 72.6%, 72.4%, and 76.5% were on anti-diabetic, lipid-lowering, and anti-hypertensive medications respectively. Awareness of these conditions coupled with good adherence of medications contributes to well-controlled blood pressure, cholesterol, and HbA1c measurements. Hence, little differences were observed in vascular risk factors between participants with and without cognitive impairment.
The multi-factorial predictor approach of this study differs from previous work in several ways. Firstly, most of the previously developed ML models for detection of dementia and cognitive impairment focused on a single modality [14, 16, 52]. A review by Solomon et al. [29] highlighted the importance of integrating multiple domains of data to improve the discriminatory performance of the ML models. Secondly, this study modelled the data using a ML approach as opposed to a traditional statistical approach. The key difference between the two approaches is that the earlier study adopts a non-parametric approach and are free from a priori assumptions. The main advantage of ML models is the ability to efficiently integrate a diverse array of variables and automatic learning without being specifically programmed [53]. In contrast, traditional statistical models tend to not work well on datasets with high dimensions [54]. These parametric models also require the specification of some parameters (i.e., normality of data, homogeneity of variance) which may not be met in real world data. Additionally, ML model can also address interactions, which are difficult to investigate with traditional statistical methods [55]. Our study also differs from studies [13, 24] that use cognitive assessment scores such as Mini-Mental State Exam (MMSE) and Montreal Cognitive Assessment (MoCA) score as predictor variables. While cognitive assessment scores are widely regarded as an important predictors of dementia, they are time consuming to administer and they detect disease late. Additionally, performances of cognitive assessment tend to correlate strongly with performances in NPI assessment. To avoid ‘outcome leakage’ (i.e., predictor variables contain information that can be used to easily infer outcome), we precluded cognitive assessment scores as part of the predictor variables for development of ML models. We hypothesized that structural MRI being a sensitive biomarker, when combined with other clinical factors of cognitive impairment can reliably distinguish individuals with and without cognitive impairment.
Limitations
While this study demonstrates the feasibility of identifying individuals with cognitive impairment using ML models, we acknowledge that the proposed models have several limitations. Firstly, lifestyle factors were omitted from the ML model as this information was not collected in the EDIS study. Model performance may benefit from the inclusion of lifestyle factors as well as their effect of interaction with existing risk factors. Secondly, data used in model development were obtained under restricted study inclusion criteria (for example, participants were eligible if they are age 60 and above and screened positive under AMT and PFQ). Validation of the model using data obtained from population-based settings with minimal inclusion criteria may enhance the model’s generalizability and strengthen feature importance score that augment predictive outcome. Thirdly, the participant recruitment and screening procedures may have created selection bias and contributed to an imbalanced data class distribution. However, SMOTE was applied on the training data to mitigate issue of class imbalance. Lastly, we recognized that as the data used for model development was obtained from a cross-sectional study, the findings should be interpreted as associations between risk factors and cognitive impairment rather than evidence of causality. Despite these limitations, this study demonstrates how ML can combine multiple domains of data for accurate early diagnosis of cognitive impairment. Findings in this study also highlights the role and importance of neuroimaging biomarkers for identifying individuals with cognitive impairment in a multi-ethnic Asian population.
Clinical translation
The ML-based cognitive impairment prediction model can add value in current clinical practice in several ways. Firstly, variables deemed as important predictors in ML model (such as age, ethnicity, education attainment, and volumetric neuroimaging markers) are easy-to-obtain in the clinical and research setting. The use of easy-to-obtain variables can be readily deployed in clinics as a web application tool to screen individuals with high risk of developing dementia. Clinicians can enter and/or upload details on their patients’ socio-demographic, laboratory test results, and MRI scans to generate an estimated risk of cognitive impairment. Risk predictions are supported by the SHAP explainer model by identifying variables that contribute to the prediction outcome. Secondly, the ML model can complement existing dementia and cognitive impairment diagnosis to improve clinician prognostication and potentially assist in patient– physician– family communication. Lastly, an accurate prediction model for early identification of individuals with cognitive impairment in population-based setting provide opportunities for intensive intervention so as to reduce disease mortality and healthcare resource burden.
CONCLUSION
ML models consisting of multi-domain data, offer a scalable approach to predict cognitive impairment in a population-based setting which is beneficial to the wider community of clinicians and researchers. In future work, we plan to apply our ML models on other large-scale population-based data enriched with lifestyle factors. With further development and validation, we believed our ML models can be a valuable tool for early diagnosis of cognitive impairment.
ACKNOWLEDGMENTS
We thank Professor Ching-Yu Cheng from Singapore Eye Research Institute, Singapore and Academic Medicine Research Institute, Duke-NUS Medical School for data acquisition and support to this study. We also thank all the participants and staff of EDIS study for their dedication and contribution to the study.
This work was supported by National Medical Research Council Singapore, Transition Award (R-608-000-342-213), Ministry of Education, Academic Research Fund Tier 1 (A-0006106-00-00) and Absence Leave Grant (A-8000336-00-00) and NUS start-up grant (A-0006088-00-00). The funders had no role in study design, data collection and analysis, decision to publish, or preparation of the manuscript.
Authors’ disclosures available online (https://www.j-alz.com/manuscript-disclosures/22-0776r2).
SUPPLEMENTARY MATERIAL
[1] The supplementary material is available in the electronic version of this article: https://dx.doi.org/10.3233/JAD-220776.
REFERENCES
[1] | Global action plan on the public health response to dementia 2017–2025 World Health Organization, https://www.who.int/publications/i/item/global-action-plan-on-the-public-health-response-to-dementia-2017—2025, Accessed August 15, 2022. |
[2] | Morley JE , Morris JC , Berg-Weger M , Borson S , Carpenter BD , Del Campo N , Dubois B , Fargo K , Fitten LJ , Flaherty JH ((2015) ) Brain health: The importance of recognizing cognitive impairment: An IAGG consensus conference. J Am Med Dir Assoc 16: , 731–739. |
[3] | Livingston G , Huntley J , Sommerlad A , Ames D , Ballard C , Banerjee S , Brayne C , Burns A , Cohen-Mansfield J , Cooper C , Costafreda SG ((2020) ) Dementia prevention, intervention, and care: 2020 report of the Lancet Commission. Lancet 396: , 413–446. |
[4] | Mahendran N , Vincent PDR , Srinivasan K , Chang C-Y ((2021) ) Improving the classification of Alzheimer’s disease using hybrid gene selection pipeline and deep learning. Front Genet 12: , 784814. |
[5] | Bloch L , Friedrich CM ((2021) ) Data analysis with Shapley values for automatic subject selection in Alzheimer’s disease data sets using interpretable machine learning. Alzheimers Res Ther 13: , 1–30. |
[6] | Moreira HS , Costa AS , Machado Á , Castro SL , Lima CF , Vicente SG ((2019) ) Distinguishing mild cognitive impairment from healthy aging and Alzheimer’s disease: The contribution of the INECO Frontal Screening (IFS). PLoS One 14: , e0221873. |
[7] | Langhough Koscik R , Hermann BP , Allison S , Clark LR , Jonaitis EM , Mueller KD , Betthauser TJ , Christian BT , Du L , Okonkwo O ((2021) ) Validity evidence for the research category,“cognitively unimpaired– declining,” as a risk marker for mild cognitive impairment and Alzheimer’s disease. Front Aging Neurosci 13: , 688478. |
[8] | Woodford H , George J ((2007) ) Cognitive assessment in the elderly: A review of clinical methods. QJM 100: , 469–484. |
[9] | Dubois B , Hampel H , Feldman HH , Scheltens P , Aisen P , Andrieu S , Bakardjian H , Benali H , Bertram L , Blennow K , Broich K , Cavedo E , Crutch S , Dartigues JF , Duyckaerts C , Epelbaum S , Frisoni GB , Gauthier S , Genthon R , Gouw AA , Habert MO , Holtzman DM , Kivipelto M , Lista S , Molinuevo JL , O’Bryant SE , Rabinovici GD , Rowe C , Salloway S , Schneider LS , Sperling R , Teichmann M , Carrillo MC , Cummings J , Jack CR Jr ; Proceedings of the Meeting of the International Working Group (IWG) and the American Alzheimer’s Association on “The Preclinical State of AD”; July 23, 2015; Washington DC, USA ((2016) ) Preclinical Alzheimer’s disease: Definition, natural history, and diagnostic criteria. Alzheimers Dement 12: , 292–323. |
[10] | Devanand DP , Liu X , Tabert MH , Pradhaban G , Cuasay K , Bell K , de Leon MJ , Doty RL , Stern Y , Pelton GH ((2008) ) Combining early markers strongly predicts conversion from mild cognitive impairment to Alzheimer’s disease. Biol Psychiatry 64: , 871–879. |
[11] | Sperling RA , Aisen PS , Beckett LA , Bennett DA , Craft S , Fagan AM , Iwatsubo T , Jack CR Jr , Kaye J , Montine TJ ((2011) ) Toward defining the preclinical stages of Alzheimer’s disease: Recommendations from the National Institute on Aging-Alzheimer’s Association workgroups on diagnostic guidelines for Alzheimer’s disease. Alzheimers Dement 7: , 280–292. |
[12] | Remnestål J , Bergström S , Olofsson J , Sjöstedt E , Uhlén M , Blennow K , Zetterberg H , Zettergren A , Kern S , Skoog I ((2021) ) Association of CSF proteins with tau and amyloid β levels in asymptomatic 70-year-olds. Alzheimers Res Ther 13: , 1–19. |
[13] | Na K-S ((2019) ) Prediction of future cognitive impairment among the community elderly: A machine-learning based approach. Sci Rep 9: , 3335. |
[14] | Ashby K , Adams BN , Shetty M ((2021) ) Appropriate Magnetic Resonance Imaging Ordering. StatPearls Publishing, StatPearls [Internet]. |
[15] | Zandifar A , Fonov VS , Ducharme S , Belleville S , Collins DL , Alzheimer’s Disease Neuroimaging Initiative ((2020) ) MRI and cognitive scores complement each other to accurately predict Alzheimer’s dementia 2 to 7 years before clinical onset. Neuroimage 25: , 102121. |
[16] | Jack CR , Petersen RC , Xu YC , Waring SC , O’Brien PC , Tangalos EG , Smith GE , Ivnik RJ , Kokmen E ((1997) ) Medial temporal atrophy on MRI in normal aging and very mild Alzheimer’s disease. Neurology 49: , 786–794. |
[17] | Payton NM , Kalpouzos G , Rizzuto D , Fratiglioni L , Kivipelto M , Bäckman L , Laukka EJ ((2018) ) Combining cognitive, genetic, and structural neuroimaging markers to identify individuals with increased dementia risk. J Alzheimers Dis 64: , 533–542. |
[18] | Dallora AL , Minku L , Mendes E , Rennemark M , Anderberg P , Sanmartin Berglund J ((2020) ) Multifactorial 10-year prior diagnosis prediction model of dementia. Int J Environ Res Public Health 17: , 6674. |
[19] | Andaur Navarro CL , Damen JA , Takada T , Nijman SW , Dhiman P , Ma J , Collins GS , Bajpai R , Riley RD , Moons KG ((2022) ) Completeness of reporting of clinical prediction models developed using supervised machine learning: A systematic review. BMC Med Res Methodol 22: , 1–13. |
[20] | Zhang B , Cao P ((2019) ) Classification of high dimensional biomedical data based on feature selection using redundant removal. PLoS One 14: , e0214406. |
[21] | Ahsan MM LS , Siddique Z . ((2022) ) Machine-learning-based disease diagnosis: A comprehensive review. Healthcare (Basel) 10: , 541. |
[22] | Alghamdi M , Al-Mallah M , Keteyian S , Brawner C , Ehrman J , Sakr S ((2017) ) Predicting diabetes mellitus using SMOTE and ensemble machine learning approach: The Henry Ford ExercIse Testing (FIT) project. PLoS One 12: , e0179805. |
[23] | Danso SO , Zeng Z , Muniz-Terrera G , Ritchie CW ((2021) ) Developing an explainable machine learning-based personalised dementia risk prediction model: A transfer learning approach with ensemble learning algorithms. Front Big Data 4: , 21. |
[24] | Hu M , Shu X , Yu G , Wu X , Välimäki M , Feng H ((2021) ) A risk prediction model based on machine learning for cognitive impairment among Chinese community-dwelling elderly people with normal cognition: Development and validation study. J Med Internet Res 23: , e20298. |
[25] | Wong LCK , Wong MYZ , Tan CS , Vrooman H , Venketasubramanian N , Cheng C-Y , Chen C , Hilal S ((2020) ) Interethnic differences in neuroimaging markers and cognition in Asians, a population-based study. Sci Rep 10: , 2655. |
[26] | Hilal S , Sikking E , Shaik MA , Chan QL , Van Veluw SJ , Vrooman H , Cheng C-Y , Sabanayagam C , Cheung CY , Wong TY ((2016) ) Cortical cerebral microinfarcts on 3T MRI: A novel marker of cerebrovascular disease. Neurology 87: , 1583–1590. |
[27] | Ryu S-E , Shin D-H , Chung K ((2020) ) Prediction model of dementia risk based on XGBoost using derived variable extraction and hyper parameter optimization. IEEE Access 8: , 177708–177720. |
[28] | Vijayakumar K ((2021) ) Computational intelligence, machine learning techniques, and IOT. Concurr Eng Res Appl 29: , 3–5. |
[29] | Solomon A , Stephen R , Altomare D , Carrera E , Frisoni GB , Kulmala J , Molinuevo JL , Nilsson P , Ngandu T , Ribaldi F ((2021) ) Multidomain interventions: State-of-the-art and future directions for protocols to implement precision dementia risk reduction. A user manual for Brain Health Services— part 4 of 6. Alzheimers Res Ther 13: , 171. |
[30] | Farhan S , Fahiem MA , Tauseef H ((2014) ) An ensemble-of-classifiers based approach for early diagnosis of Alzheimer’s disease: Classification using structural features of brain images. Comput Math Methods Med 2014: , 862307. |
[31] | Mitchell TM ((1997) ), Machine learning,McGraw-hillNew York. |
[32] | Battineni G , Chintalapudi N , Amenta F ((2019) ) Machine learning in medicine: Performance calculation of dementia prediction by support vector machines (SVM). Inform Med Unlocked 16: , 100200. |
[33] | Natekin A , Knoll A ((2013) ) Gradient boosting machines, a tutorial. Front Neurorobot 7: , 21. |
[34] | Boosting IBM Cloud Education, https://www.ibm.com/cloud/learn/boosting, May 26, 2021 Accessed August 15, 2022. |
[35] | Kim SY , Upneja A ((2021) ) Majority voting ensemble with a decision trees for business failure prediction during economic downturns. J Innov Knowl 6: , 112–123. |
[36] | Dietterich TG ((2000) ) Ensemble Methods in Machine Learning. In: Multiple Classifier Systems, Springer, Berlin, Heidelberg. |
[37] | Gholamy A , Kreinovich V , Kosheleva O ((2018) ) Why 70/30 or 80/20 relation between training and testing sets: A pedagogical explanation. Departmental Technical Reports (CS) 1209, https://scholarworks.utep.edu/cs_techrep/1209. |
[38] | Dhilsath Fathima M , Hariharan R , Raja S ((2021) ) Multiple imputation by chained equations– K-nearest neighbors and deep neural network architecture for kidney disease prediction. Int J Image Graphics 2350014. |
[39] | Beretta L , Santaniello A ((2016) ) Nearest neighbor imputation algorithms: A critical evaluation. BMC Med Inform Decis Mak 16: , 197–208. |
[40] | Azur MJ , Stuart EA , Frangakis C , Leaf PJ ((2011) ) Multiple imputation by chained equations: What is it and how does it work? Int J Methods Psychiatr Res 20: , 40–49. |
[41] | Petch J , Di S , Nelson W ((2022) ) Opening the black box: The promise and limitations of explainable machine learning in cardiology. Can J Cardiol 38: , 204–213. |
[42] | Hernandez M , Ramon-Julvez U , Ferraz F , with the ADNI Consortium ((2022) ) Explainable AI toward understanding the performance of the top three TADPOLE Challenge methods in the forecast of Alzheimer’s disease diagnosis. PLoS One 17: , e0264695. |
[43] | Gómez-Ramírez J , Ávila-Villanueva M , Fernández-Blázquez MÁ ((2020) ) Selecting the most important self-assessed features for predicting conversion to mild cognitive impairment with random forest and permutation-based methods. Sci Rep 10: , 20630. |
[44] | Sherazi SWA , Bae J-W , Lee JY ((2021) ) A soft voting ensemble classifier for early prediction and diagnosis of occurrences of major adverse cardiovascular events for STEMI and NSTEMI during 2-year follow-up in patients with acute coronary syndrome. PLoS One 16: , e0249338. |
[45] | Dietterich TG ((2000) ) Ensemble methods in machine learning. International Workshop on Multiple Classifier Systems, Springer, pp.1–15. |
[46] | Ribeiro MT , Singh S , Guestrin C ((2016) ) “Why should i trust you?” Explaining the predictions of any classifier. Proceedings of the 22nd ACM SIGKDD International Conference on Knowledge Discovery and Data Mining, pp.1135–1144. |
[47] | Vipin A , Wong BYX , Kumar D , Low A , Ng KP , Kandiah N ((2021) ) Association between white matter hyperintensity load and grey matter atrophy in mild cognitive impairment is not unidirectional. Aging (Albany NY) 13: , 10973. |
[48] | Uysal G , Ozturk M ((2020) ) Hippocampal atrophy based Alzheimer’s disease diagnosis via machine learning methods. J Neurosci Methods 337: , 108669. |
[49] | Pinaya WH , Scarpazza C , Garcia-Dias R , Vieira S , Baecker L , F da Costa P , Redolfi A , Frisoni GB , Pievani M , Calhoun VD ((2021) ) Using normative modelling to detect disease progression in mild cognitive impairment and Alzheimer’s disease in a cross-sectional multi-cohort study. Sci Rep 11: , 15746. |
[50] | Mungas D , Shaw C , Hayes-Larson E , DeCarli C , Farias ST , Olichney J , Saucedo HH , Gilsanz P , Glymour MM , Whitmer RA ((2021) ) Cognitive impairment in racially/ethnically diverse older adults: Accounting for sources of diagnostic bias. Alzheimers Dement (Amst) 13: , e12265. |
[51] | Man RE , Gan AHW , Fenwick EK , Gan ATL , Gupta P , Sabanayagam C , Tan N , Wong KH , Wong TY , Cheng C-Y ((2019) ) Prevalence, determinants and association of unawareness of diabetes, hypertension and hypercholesterolemia with poor disease control in a multi-ethnic Asian population without cardiovascular disease. Popul Health Metrics 17: , 17. |
[52] | Lombardi G , Crescioli G , Cavedo E , Lucenteforte E , Casazza G , Bellatorre AG , Lista C , Costantino G , Frisoni G , Virgili G ((2020) ) Structural magnetic resonance imaging for the early diagnosis of dementia due to Alzheimer’s disease in people with mild cognitive impairment. Cochrane Database Syst Rev 3: , CD009628. |
[53] | Nanayakkara S , Fogarty S , Tremeer M , Ross K , Richards B , Bergmeir C , Xu S , Stub D , Smith K , Tacey M ((2018) ) Characterising risk of in-hospital mortality following cardiac arrest using machine learning: A retrospective international registry study. PLoS Med 15: , e1002709. |
[54] | Belabbas M-A , Wolfe PJ ((2009) ) Spectral methods in machine learning and new strategies for very large datasets. Proc Natl Acad Sci U S A 106: , 369–374. |
[55] | Rajula HSR , Verlato G , Manchia M , Antonucci N , Fanos V ((2020) ) Comparison of conventional statistical methods with machine learning in medicine: Diagnosis, drug development, and treatment. Medicina (Kaunas) 56: , 455. |


