
Could Country-Level Factors Explain Sex Differences in Dementia Incidence and Prevalence? A Systematic Review and Meta-Analysis
Abstract
Background:
Despite rising interest in sex differences in dementia, it is unclear whether sex differences in dementia incidence and prevalence are apparent globally.
Objective:
We examine sex differences in incidence and prevalence of Any dementia, Alzheimer’s disease (AD), and vascular dementia (VaD), and evaluate whether country-level indicators of gender inequality account for differences.
Methods:
Systematic review with meta-analysis was used to obtain estimates of incidence and prevalence of Any dementia, AD, and VaD using random effects meta-analysis, and population-based studies with clinical or validated dementia measures. Meta-regression was used to evaluate how country-specific factors of life expectancy, education, and gender differences in development, unemployment, and inequality indices influenced estimates.
Results:
We identified 205 eligible studies from 8,731 articles, representing 998,187 participants across 43 countries. There were no sex differences in the incidence of Any dementia, AD, or VaD, except in the 90+ age group (women higher). When examined by 5-year age bands, the only sex difference in prevalence of Any dementia was in the 85+ group and there was no sex difference in VaD. AD was more prevalent in women at most ages. Globally, the overall prevalence of dementia in adults 65 + was higher for women (80.22/1000, 95% CI 62.83–97.61) than men (54.86/1000, 95% CI 43.55–66.17). Meta-regression revealed that sex differences in Any dementia prevalence were associated with gender differences in life expectancy and in education.
Conclusion:
Globally, there are no sex differences in age-specific dementia incidence, but prevalence of AD is higher in women. Country-level factors like life expectancy and gender differences in education may explain variability in sex differences.
INTRODUCTION
Globally, the health care costs of dementia are expected to reach over $2 billion by 2030 [1] and the prevalence of dementia is expected to rise globally to 152 million by 2050 [2]. Dementia prevalence is increasing more rapidly in low- and middle-income countries than in high-income countries. In the US and UK [3], higher prevalence rates of dementia are reported in women than in men, particularly Alzheimer’s disease (AD). However, this difference is not reported universally and a recent review of data from the US and Europe found no differences in dementia incidence between men and women [4].
Dementia epidemiology has rarely made a distinction in measurement between sex (a biological construct) and gender (a social construct), and recently authors have called for research to address knowledge gaps in this area [5, 6]. The origins of any differences between men and women may vary according to whether they are biologically based, or due to socially constructed influences associated with gender [5]. Given the multidomain nature of the many risk factors for dementia [7], it is plausible that a combination of biological and socially constructed factors moderate risk of dementia differentially for men and women. Analyses of individual cohorts have shown a range of medical, biological, and socio-demographic risk factors that differ in prevalence between men and women [8, 9]. However, it is also the case that the number of risk factors for dementia is so large that with small samples it may be difficult to discern clear patterns or profiles of risk factors associated with either gender or sex.
If there is a broad systemic biological difference in the risk of dementia, it could be expected that there would be global trends for dementia to be more prevalent in either males or females. If they are country specific, there may be sociodemographic factors which contribute to the observed sex differences in dementia prevalence and incidence such as differences in education and occupational levels that may moderate the opportunity for individuals to build cognitive reserve [10–12]. Social inequality and early life adversity may also increase stress and explain demographic differentials in dementia incidence [13]. Observational research from Latin America and the Caribbean has suggested that different opportunities to access education may also impact cognitive reserve and this may be associated with gender [14]. Educational experiences are thought to enhance brain development and lead to cognitive reserve, which is thought to provide resilience against cognitive loss from neurodegeneration and dementia [15]. Sociodemographic factors, vascular risk factors, and occupational and educational participation rates vary between and within countries, between men and women, and change over time. It is possible that changes in the prevalence of these factors influence late-life cognitive decline and risk of dementia.
We aimed to address gaps in knowledge relating to the clence of Any dementia, AD, and vascular dementia (VaD). Specifically, we aimed to evaluate whether a) there are sex differences in the incidence of Any dementia, AD, and VaD globally, at specific ages; b) there are sex differences in the prevalence of Any dementia, AD, and VaD at specific ages; and c) country-level factors related to gender (life expectancy, gender inequality index, education, and unemployment rate) are associated with dementia incidence and prevalence and explain sex differences.
METHODS
We conducted a systematic review and meta-analysis to evaluate sex differences in the global prevalence and incidence of dementia, adhering to the Guidelines for Accurate and Transparent Health Estimates Reporting. The review was registered with the International Prospective Register of Systematic Reviews (PROSPERO, CRD42017053915) and reported in accordance with the PRISMA Statement (Preferred Reporting Items for Systematic Reviews and Meta-Analyses) [16] (see Supplementary File 1: Supplementary Table 1). Extracted data, analytic code, and output from this study have been made available at http://dx.doi.org/10.17632/c93bf5v4bg.1.
Search strategy and selection criteria
We conducted an unrestricted search in PubMed, Cochrane, ProQuest, and the Global Index Medicus (GIM) from inception to 24 November 2020 (see Supplementary File 1: Supplementary Table 3 for search terms). GIM was searched for regional databases and was critical to providing access to data from low- and middle-income countries (LMIC). Articles were eligible for review if they were peer reviewed publications that reported separate male and female estimates for prevalence and/or incidence of Any dementia, AD, or VaD. To ensure comparability of results, only population-based studies of human subjects which either used screening tools with validated cut-offs (e.g., Mini-Mental State Examination) [17] or clinical diagnostic criteria (e.g., Diagnostic Statistical Manual for Mental Disorders (DSM)) [18] for dementia were included. Studies were excluded from the main review if: data was derived from non-population based (e.g., convenience sampling, samples from health insurance databases) or clinical samples, or if they only reported outcomes for early onset dementia or familial AD. However, studies reporting data for special populations (e.g., Indigenous samples) were retained for reporting separately (not for inclusion in meta-analysis).
Studies using any combination of the following methods of diagnosis along with clinical (e.g., DSM or ICD) criteria were deemed eligible: cognitive screening test (e.g., Mini-Mental State Examination), comprehensive neuropsychological assessment, neurologist examination, neuroimaging, blood analysis or genotyping, participant and/or informant interview, consensus approach from sparse data, use of medical records, postmortem neuropathology, or a consensus approach when determining diagnosis. Diagnoses based solely on Clinical Dementia Rating Scale [19] staging were excluded. For papers published in the last 10 years, missing or unclear data (e.g., data presented only in figures from which estimates can be derived) were requested from authors. Some studies were also excluded from meta-analysis (but not from the review) after data extraction because their data were not compatible for pooling with other studies. This included data based on the calculated lifetime risk using survival models, where person-year data were missing, and where only a hazard ratio was available.
Country-level data
Details of the country-specific variables are described in Supplementary File 1: Supplementary Table 9. Life expectancy at age 65 years in 2016 and 2006 for males and females was derived from the World Health Organization Global Health Observatory. Country-specific Gender Development Index, Gender Inequality Index (GII), years of education for males and females, and the unemployment ratio of males to females were taken from the Organization for Economic Co-operation and Development (OECD, 2016) [20]. The Gender Development Index (GDI) was the ratio of female to male Human Development Index (HDI) calculated separately for the two genders, where HDI incorporates development across three measures: health (life expectancy at birth), education (expected years of schooling during childhood, and the mean years of schooling for adults aged 25 years and older), and economic resources (estimated earned income). GDI ranged from 0 to 1 with higher values indicating greater female development. The GII was a composite measure of health (maternal mortality ratio and adolescent birth rate), empowerment (female to male ratio of population with secondary education, and ratio of shares in parliamentary seats), and labor market (female to male ratio of labor force participation) with values ranging from 0 to 1 and higher values indicating greater inequality.
Outcome measures
The key outcome measures of the study were incidence (per 1000 person-years) and prevalence (per 1000 people) of Any dementia, AD, and VaD for males and females by age group (60–64, 65–69, 70–74, 75–79, 80–84, 85–89, 90+).
Study quality
Study quality was assessed using the Newcastle Ottawa Quality Assessment Scale [21] (see Supplementary File 1: Supplementary Tables 7 and 8).
Data analysis
We extracted the following information from included studies: first author, publication year, study name (if available), year of data collection, country, settings, and sample sizes (number of men and women) in five-year age bands from 60 years. Where the sample size was reported but only a percentage or ratio for female and male subgroups was provided, numbers of males and females were calculated and rounded to the closest whole number.
For the incidence studies, we also extracted the number of incident cases and person-years at risk for Any dementia, AD, and VaD in five-year age bands from 60 years. In cases when only incidence rates were available and person-years or case numbers were unavailable, we contacted the corresponding authors to request these data. Crude age-specific incidence rates for each of the three outcomes were then pooled in the meta-analysis. Specifically, we used a weighted random effects model with a country-specific random intercept for males and females separately, weighted by the person-years at risk for each of the age bands. Random effects models provide more conservative estimates, which are appropriate for our analyses given the potential heterogeneity across studies.
For prevalence studies we also extracted the number of prevalent cases and prevalence percentage of Any dementia, AD, and VaD, and 95% confidence intervals (CI) for each age band and for males and females separately. Using the age-specific prevalence, we also calculated the number of people in each age band where this was not reported separately. Where dementia prevalence was provided as cases per 100, 1000, or 100,000 people, the prevalence per 1000 was calculated.
As a form of sensitivity analysis, crude prevalence for adults aged 65 years and older and 75 and older were calculated by aggregating the number of people in each group and the corresponding case numbers. This was because a large number of studies aggregated their data for ages 65 and older or 75 and older. For the meta-analysis of prevalence studies, the crude prevalence of each of the three dementia outcomes at five-year age bands were pooled across studies using a weighted random effects model with a country-specific random intercept for males and females separately, where the number of people at each age-band was used as the weight. This analysis was also repeated to estimate the pooled prevalence among 65 + and 75 + age groups.
For both incidence and prevalence data, the country-specific estimated incidence/prevalence was then examined using forest plots. Heterogeneity was examined by using the inconsistency index (I2) statistic. Subgroup analyses were conducted to explore sources of heterogeneity by calculating Cochran’s Q statistic. Publication bias was assessed visually using a funnel plot (log odds of the effect measure, i.e., log odds against the standard error). All statistical analyses were performed using Stata 16.1.
Additional analyses
The degree to which country-level factors explained variability in prevalence and incidence of dementia globally was evaluated by inclusion of country-level meta-data (e.g., life expectancy, education level for males and females in each country, GII, GDI) in a meta-regression.
Role of the funding source
The funder of the study had no role in study design, data collection, data analysis, data interpretation, or writing of the report. The corresponding author had full access to all the data in the study and had final responsibility for the decision to submit for publication.
RESULTS
The study selection process is described in Supplementary File 1: Supplementary Figure 1. Electronic database searches identified 8,731 articles, of which 6,922 were screened for eligibility following the removal of duplicates. Of these 6,922 articles, two non-English language publications were translated (via Google Translate and native speaker), 6,717 were found to be ineligible, 205 met inclusion criteria for the systematic review, and 200 were included in the meta-analysis.
The characteristics of studies included in the review are shown in Supplementary File 1: Supplementary Table 4. Data were available for 43 countries. There were 13 countries from Europe (Belgium, Denmark, France, Germany, Greece, Italy, Norway, Poland, Portugal, Spain, Sweden, The Netherlands, and the United Kingdom), 10 countries from Asia (Bangladesh, China, India, Japan, Mongolia, Singapore, South Korea, Sri Lanka, Taiwan, and Thailand), 2 from North America (Canada and the United States), 1 country from Oceania (Australia), 5 countries from Africa (Benin, Central African Republic, Democratic Republic of the Congo, Nigeria, and Tanzania), 7 countries from Latin America and the Caribbean (Brazil, Cuba, Dominican Republic, Jamaica, Mexico, Peru, and Venezuela), 4 countries from the Middle East (Egypt, Iran, Israel, and Lebanon), and Turkey, which is in both Asia and Europe. Reasons for exclusion of excluded studies are reported in Supplementary File 1: Supplementary Table 5.
The incidence data were collected between 1980 and 2019, and prevalence data between 1978 and 2018. Altogether there were 178,227 participants included in the synthesis of the incidence data and 824,424 for prevalence data. A total of 187 studies reported use of clinical diagnoses of dementia, and 13 did not use clinical diagnoses of dementia but used a validated application of DSM or ICD criteria (Supplementary File 1: Supplementary Table 4). A summary of data from studies included in the systematic review, but not meta-analysis, is presented in Supplementary File 1: Supplementary Table 6.
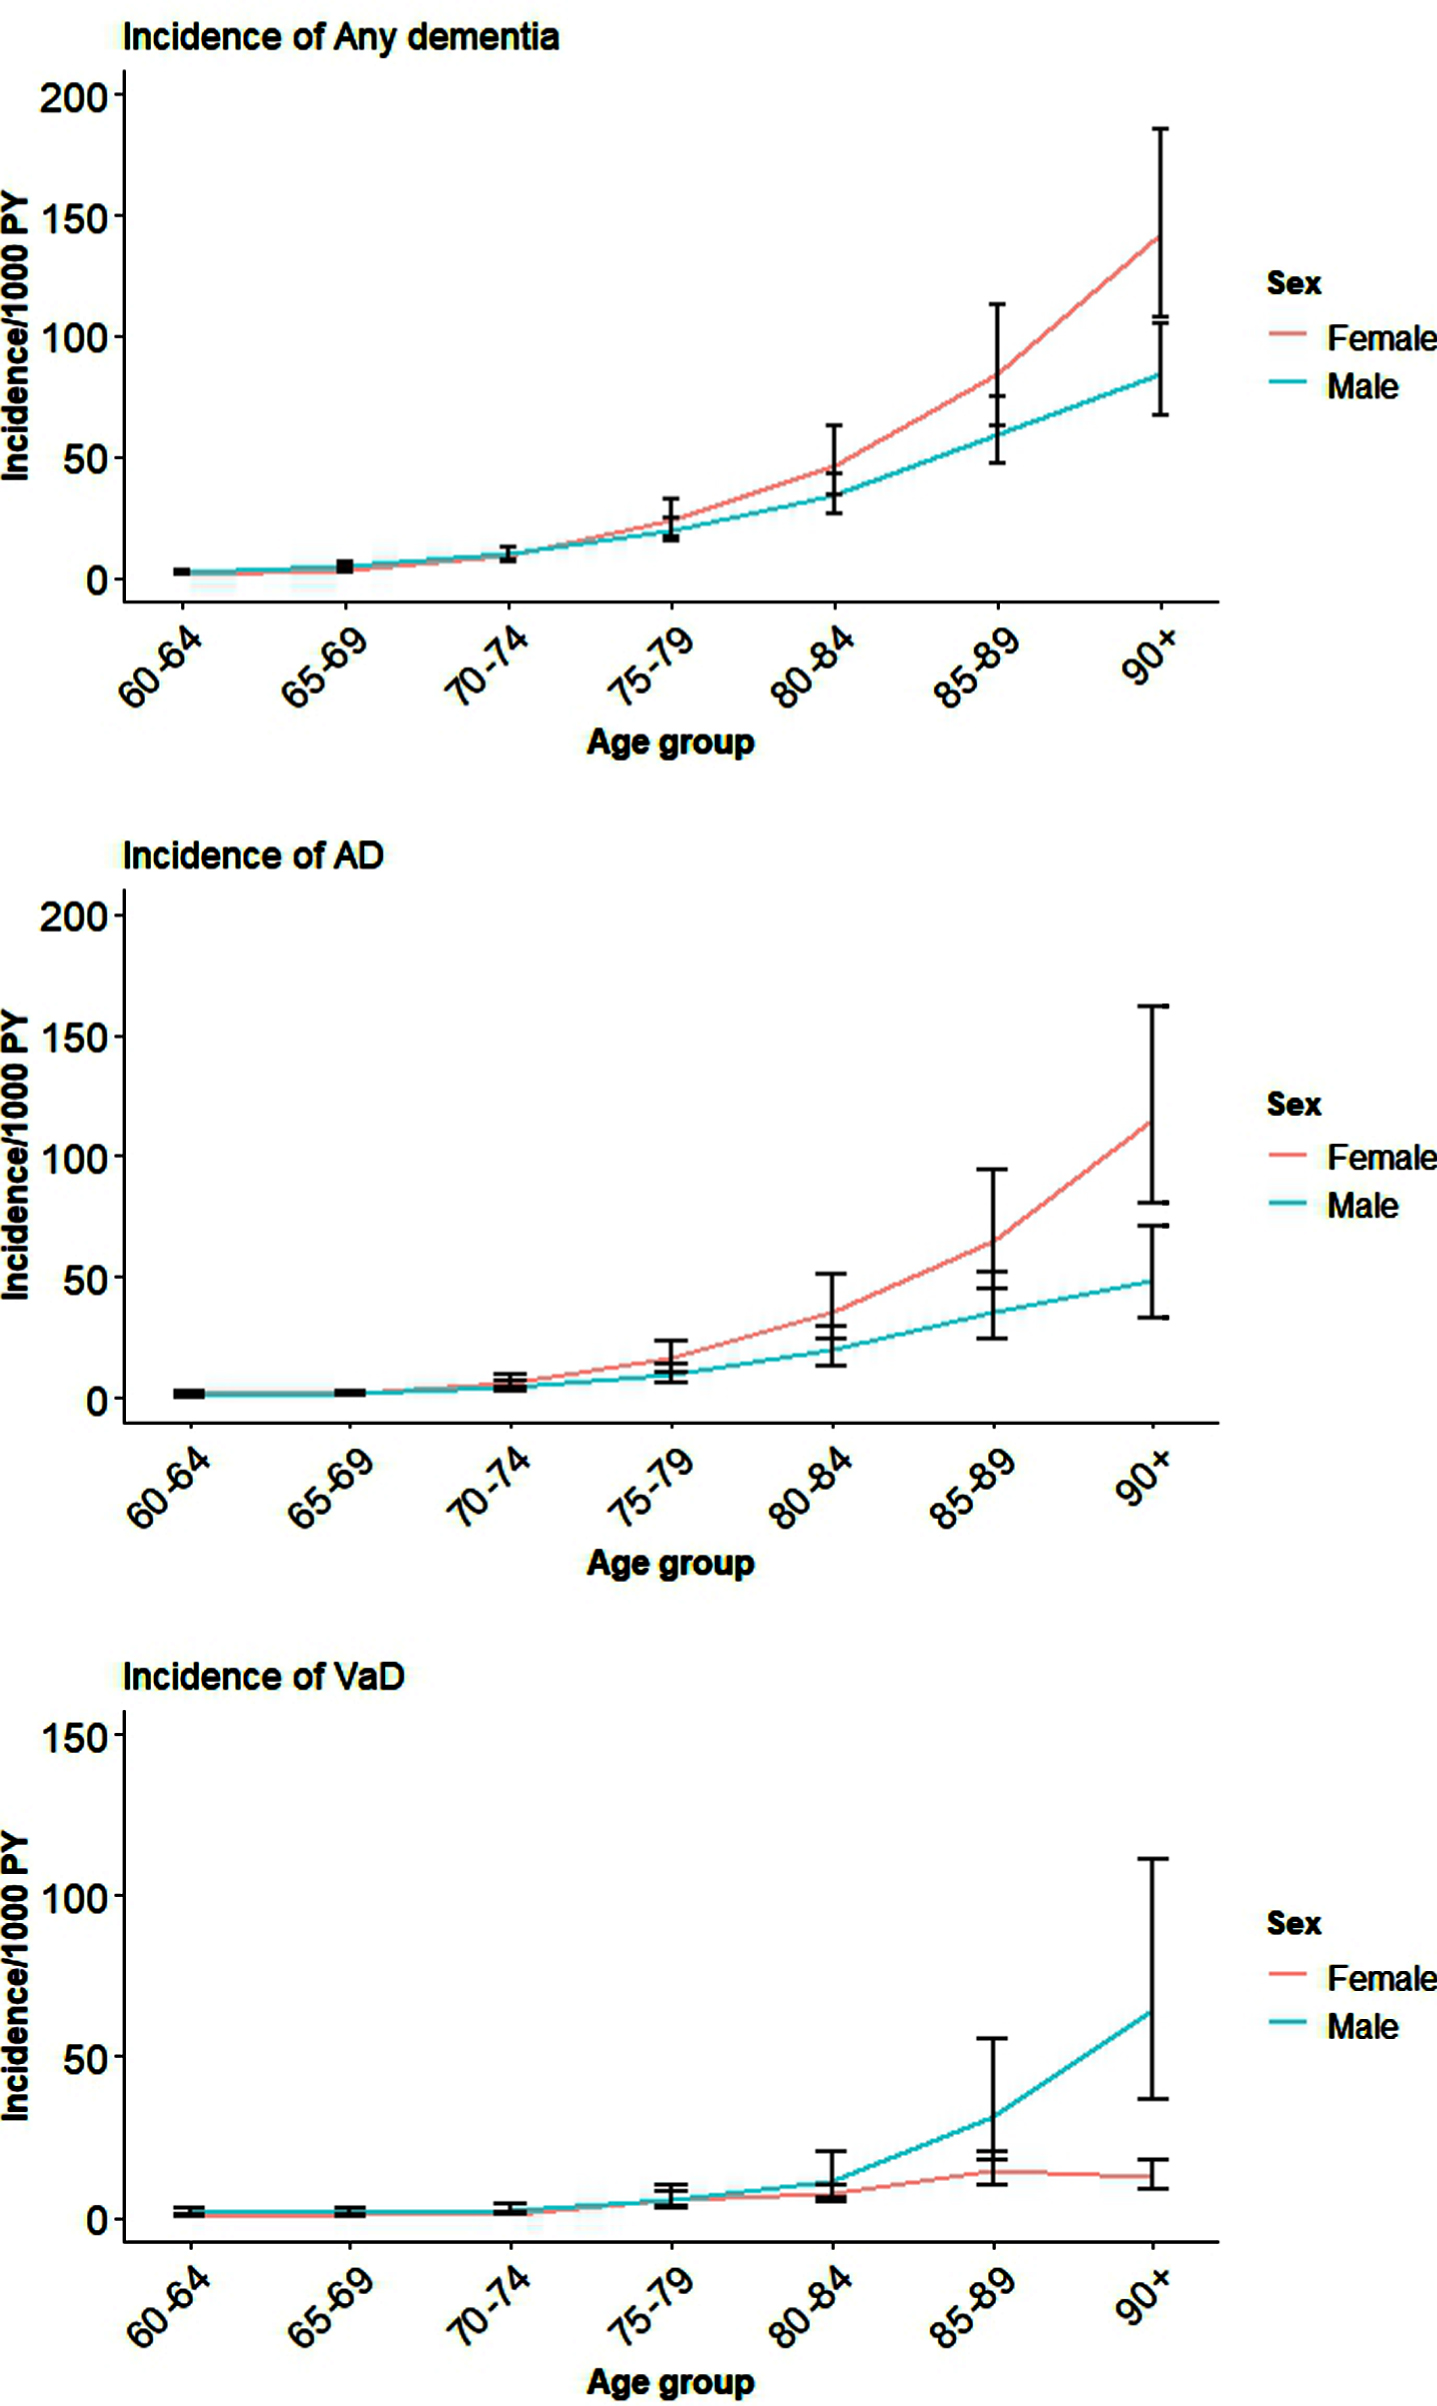
The pooled results for incident Any dementia, AD, and VaD for all the available studies for males and females are shown in Table 1 and Fig. 1. Country-level data and global estimates for Any dementia, AD, and VaD in five-year age bands from 60 years are reported in Supplementary File 2: Supplementary Figures 1–3. It is clear from Fig. 1 and Supplementary File 2: Supplementary Figures 1–3 that although women have higher incidence of Any dementia, AD, and VaD compared to men, this was not significant except in very late life (age 90+).
Table 1
Global age- and sex-specific incidence per 1000 person-years and prevalence per 1000 people for Any dementia, AD, and VaD
| Incidence (95% CI) | ||||||
| Any dementia | AD | VaD | ||||
| Male | Female | Male | Female | Male | Female | |
| 60–64 | 2.5 (1.9, 3.2) | 1.8 (1.3, 2.5) | 0.6 (0.4, 1.0) | 1.8 (1.2, 2.7) | 1.7 (1.0, 3.1) | 0.5 (0.3, 0.7) |
| 65–69 | 5.1 (4.0, 6.5) | 3.4 (2.5, 4.7) | 1.9 (1.3, 2.9) | 2.0 (1.4, 3.0) | 1.6 (0.9, 2.8) | 0.9 (0.6, 1.3) |
| 70–74 | 10.1 (7.9, 12.8) | 9.1 (6.6, 12.4) | 4.7 (3.1, 7.0) | 6.4 (4.3, 9.4) | 2.6 (1.4, 4.6) | 1.4 (1.0, 2.0) |
| 75–79 | 19.7 (15.5, 24.9) | 23.7 (17.3, 32.4) | 9.6 (6.5, 14.3) | 16.2 (11.0, 23.9) | 5.5 (3.0, 9.9) | 5.7 (4.0, 8.1) |
| 80–84 | 34.0 (26.9, 43.0) | 46.4 (34.1, 62.9) | 20.0 (13.5, 29.7) | 35.2 (24.0, 51.4) | 11.3 (6.3, 20.2) | 7.3 (5.1, 10.4) |
| 85–89 | 59.6 (47.3, 74.8) | 84.54 (62.8, 112.9 | 35.4 (24.0, 52.1) | 65.3 (44.9, 94.0) | 31.7 (17.8, 55.8) | 14.6 (10.2, 20.8) |
| 90+ | 84.5 (67.5, 105.4) | 142.2 (107.4, 185.9) | 48.6 (33.0, 71.0) | 115.0 (80.4, 161.9) | 64.7 (36.7, 111.4) | 12.6 (8.9, 18.0) |
| Prevalence (95% CI) | ||||||
| Any dementia | AD | VaD | ||||
| Male | Female | Male | Female | Male | Female | |
| 60–64 | 5.1 (4.1, 6.4) | 8.5 (6.6, 10.9) | 3.1 (2.3, 4.1) | 5.6 (4.2, 7.4) | – | – |
| 65–69 | 15.2 (12.1, 19.1) | 16.1 (12.5, 20.7) | 8.9 (6.7, 11.7) | 14.7 (11.0, 19.5) | 9.9 (7.8, 12.5) | 4.2 (3.2, 5.6) |
| 70–74 | 30.2 (24.1, 37.8) | 30.9 (24.1, 39.6) | 16.1 (12.1, 21.3) | 23.9 (18.0, 31.7) | 12.4 (9.8, 15.7) | 11.1 (8.4, 14.7) |
| 75–79 | 56.8 (45.6, 70.5) | 65.8 (51.7, 83.4) | 34.7 (26.3, 45.6) | 64.4 (49.0, 84.3) | 13.6 (10.8, 17.2) | 15.1 (11.4, 19.9) |
| 80–84 | 115.4 (93.8, 141.2) | 134.4 (107.3, 167.2) | 77.6 (59.4, 100.6) | 109.3 (149.7, 239.4) | 22.6 (17.9, 28.5) | 24.0 (18.2, 31.5) |
| 85–89 | 182.0 (150.0, 219.0) | 249.9 (205.0, 301.0) | 113.4 (87.8, 145.8) | 190.6 (149.7, 239.4) | 32.8 (26.0, 41.2) | 49.2 (37.6, 64.2) |
| 90+ | 263.7 (221.2, 311.1) | 423.0 (361.9, 486.6) | 230.4 (183.2, 285.7) | 354.2 (290.8, 423.3) | 38.7 (30.6, 48.9) | 41.5 (31.6, 54.3) |
Fig. 1
Global incidence of Any dementia, AD, and VaD for males and females by age.
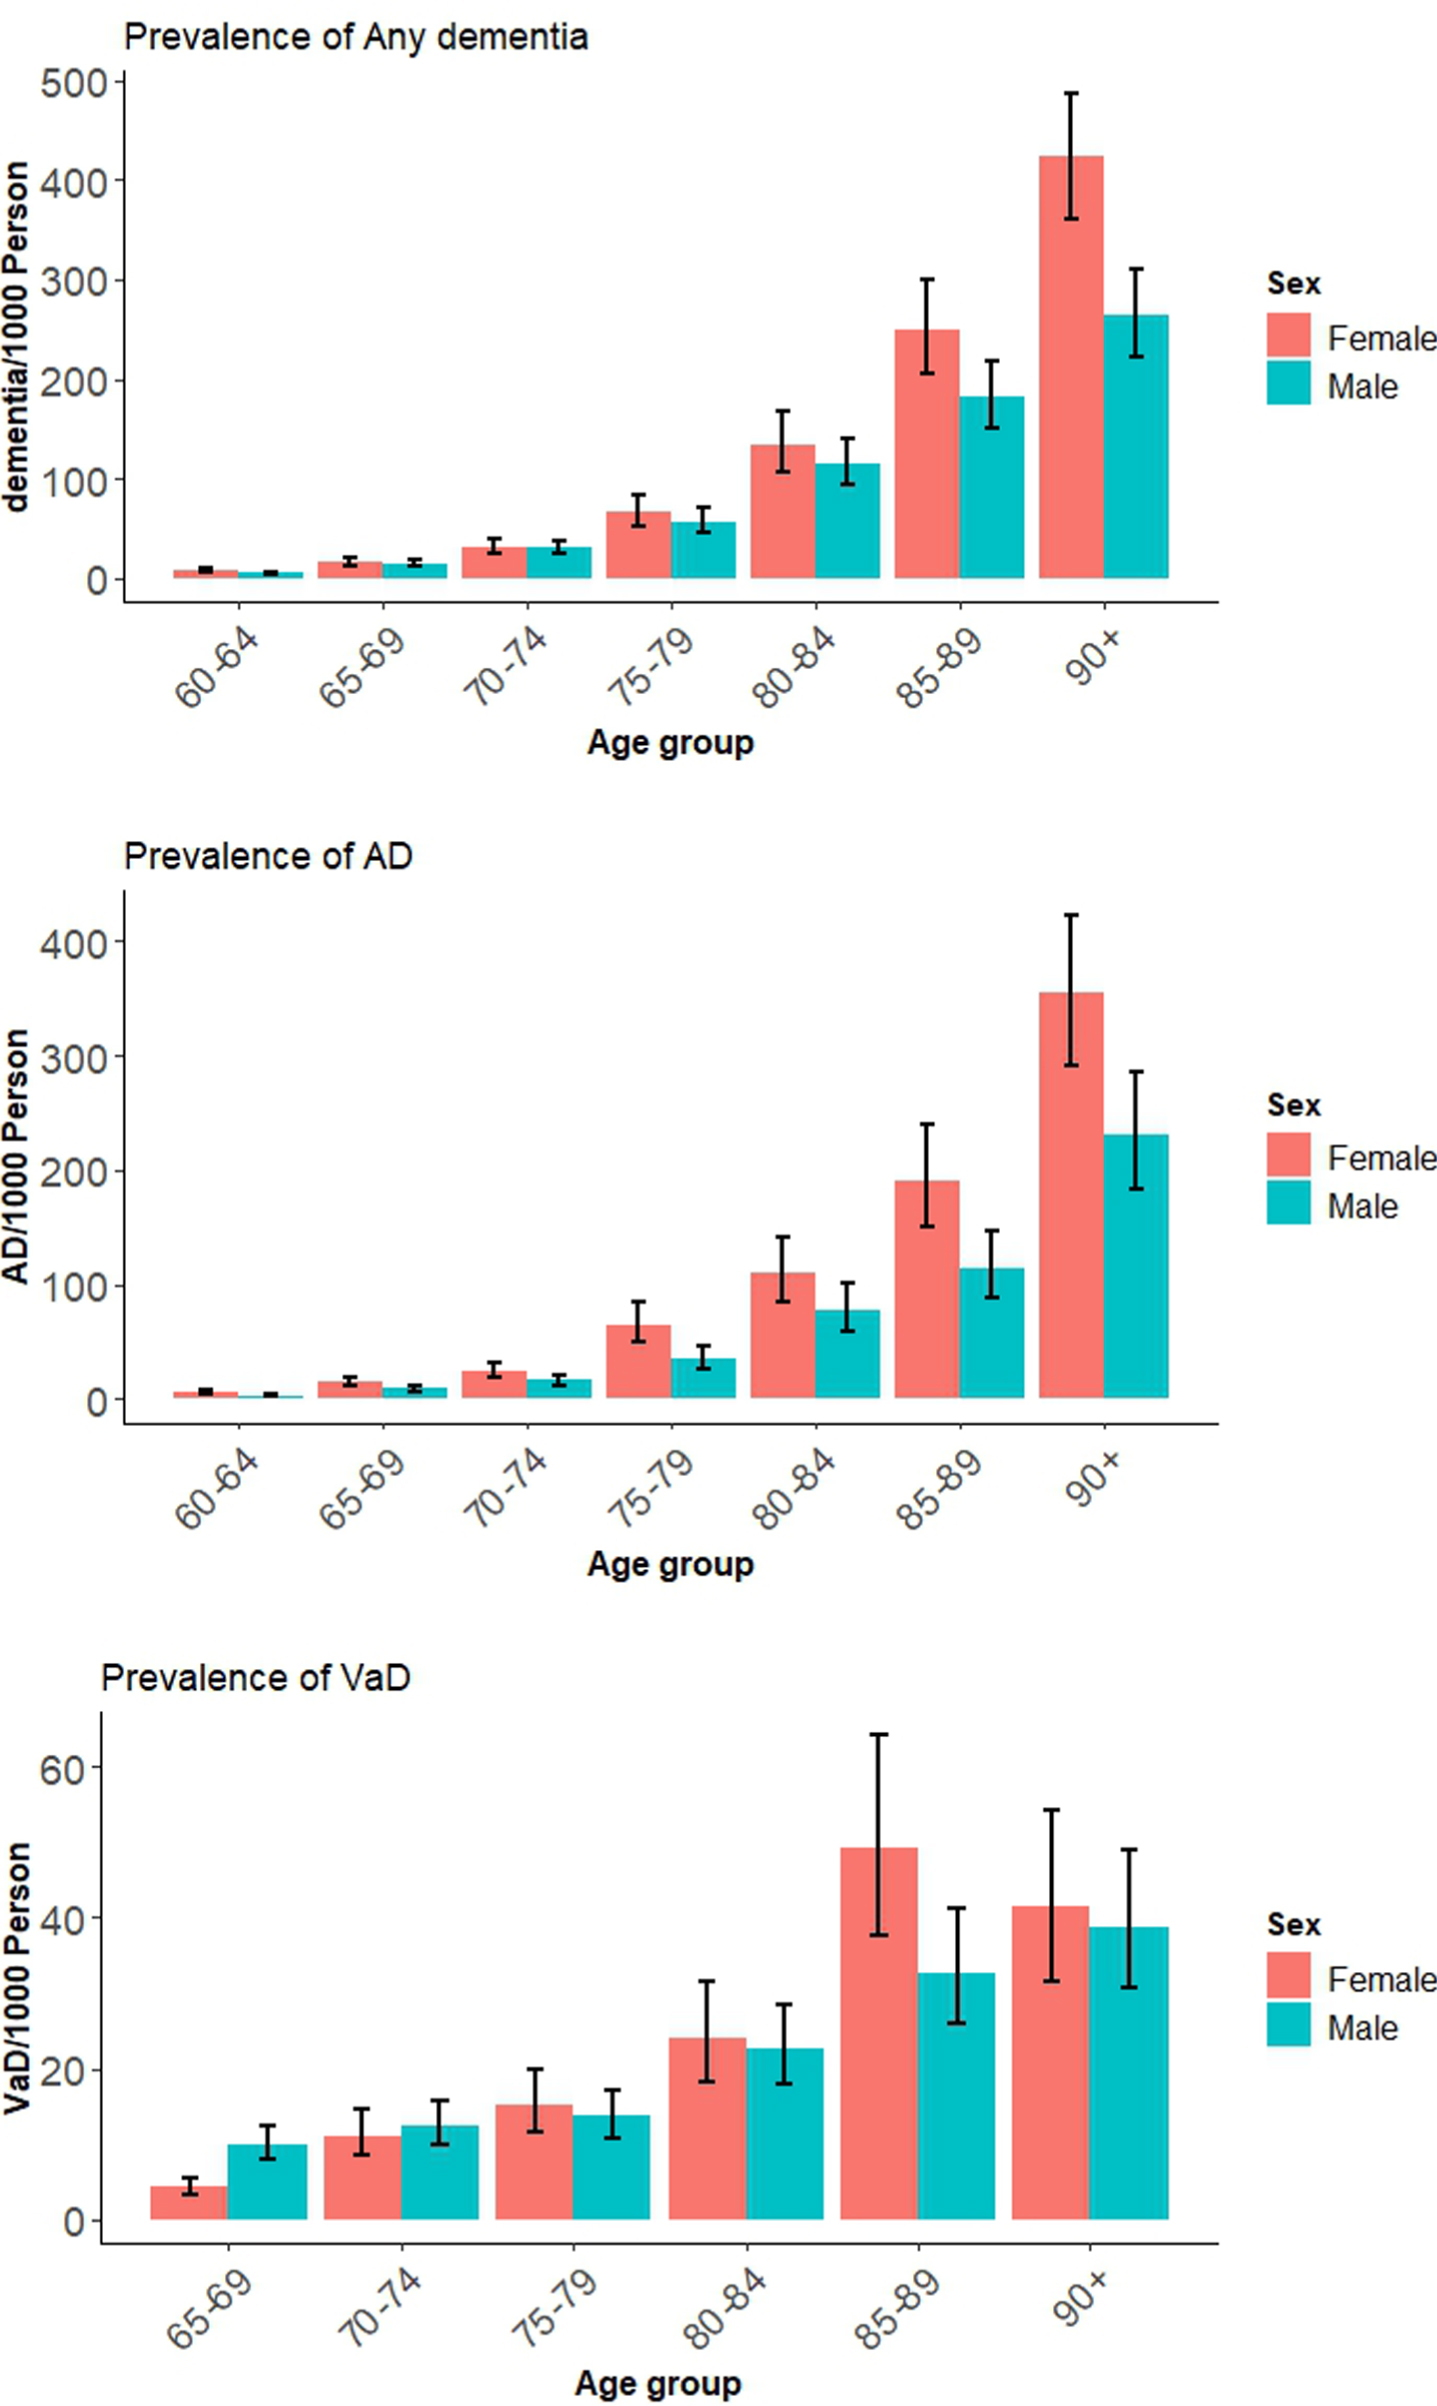
The pooled estimates of prevalence of Any dementia, AD and VaD in 5-year age bands are shown in Table 1 and Fig. 2. Country-level distribution of the prevalence data are reported in Supplementary File 2: Supplementary Figures 4–6 for Any dementia, AD, and VaD. The prevalence of Any dementia was only higher in women than men among adults aged 85 and older. Global prevalence of AD (95% CI) was significantly higher in women compared with men among all age groups except between 70 and 74.
Fig. 2
Global prevalence of Any dementia, AD, and VaD for males and females by age.
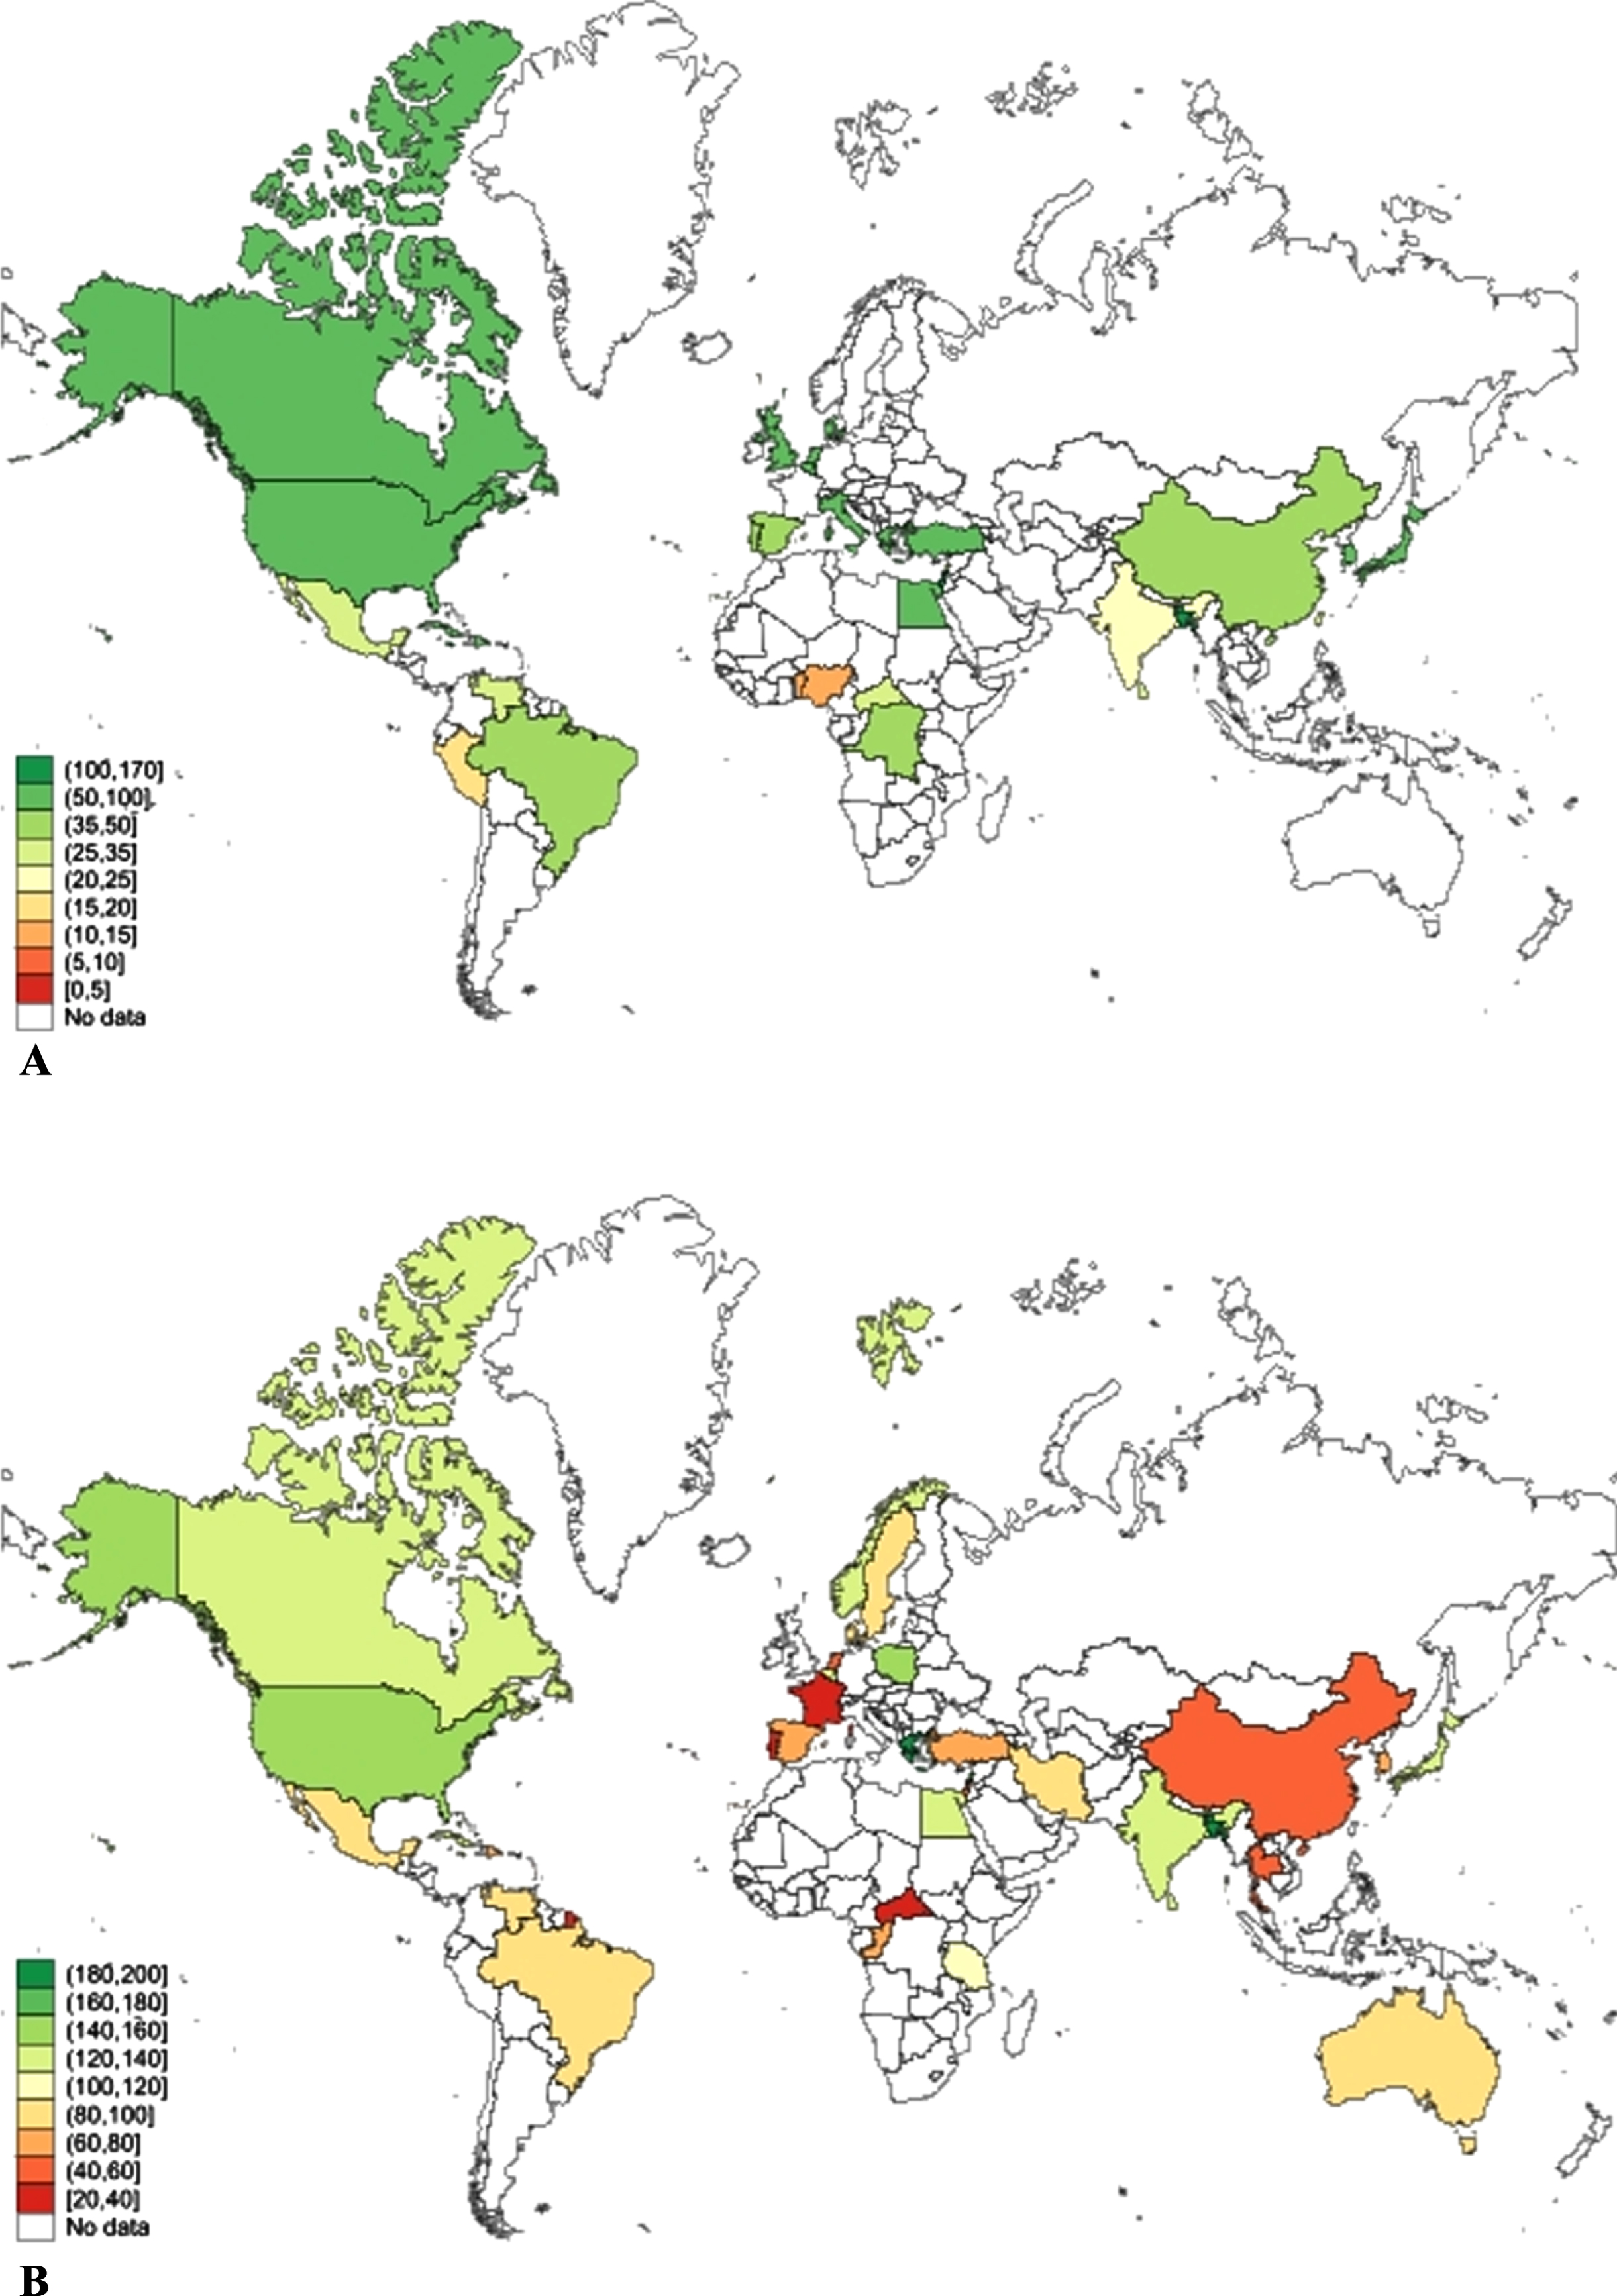
We also estimated the global prevalence of Any dementia, AD, and VaD in men and women among those aged 65 and older and 75 years and older as a sensitivity analysis. This was done because some of the studies reported aggregated prevalence rather than prevalence for 5-year age intervals. These results are presented in Supplementary File 2: Supplementary Figures 7–9. Global prevalence of dementia among those aged 65 years and older was 67.54 (95% CI 56.82–78.27) per 1000 and this was significantly higher for women (80.22/1000, 95% CI 62.83–97.61) than men (54.86/1000, 95% CI 43.55–66.17). Among those aged 75 and older, global prevalence of Any dementia was 116.97/1000 (95% CI 104.23–129.71) and was higher in women (134.43/1000, 95% CI 114.81–154.05) than men 99.51/1000 (85.13–113.89). This significant difference in dementia prevalence is greater in older age groups. Global distribution of dementia prevalence in this age group across countries is shown in Fig. 3.
Fig. 3
Global prevalence of dementia among persons (A) aged 65 years and older, and (B) aged 75 years and older, by country.
Country-level data for prevalence of AD in those aged 65 and over and 75 and over are reported in Supplementary File 2: Supplementary Figure 8. Among those aged 65 and over, the global prevalence of AD was 46.38 (95% CI 37.38–55.39) per 1000, and this was higher for women (61.18, 95% CI 47.36–75.00) than men (31.59, 95% CI 24.94–38.23), p < 0.01. Among those 75 and older, global AD prevalence was 89.51 (95% CI 73.57–105.45) and was again higher in women (119.32, 95% CI 96.97–141.66) compared to men (61.36, 95% CI 48.11–74.61), p < 0.01.
Country-level data for prevalence of VaD are reported in Supplementary File 2: Supplementary Figure 9 for those aged 65 and 75 and over, respectively. Among people aged 65 and over, the global prevalence of VaD was 17.10/1000 (95% CI 13.59–20.61), and among adults aged 75 and over it was 28.07/1000 (95% CI 19.81–36.33). The difference in prevalence of VaD between men and women was not significant.
Funnel plots (Supplementary File 2: Supplementary Figures 10–15) showed some publication bias in the estimates of the prevalence of Any dementia. Apart from this, there was little evidence of bias in the estimates of incidence or prevalence. The most common study limitation was short length of follow-up. There was also variation in the proportion of females within the samples, which was likely due to the different baseline ages of samples, particularly in countries where men and women differ in life expectancy. There were also differences in the years of birth cohorts included in the study. Gender ratios for study participation are reported in Supplementary File 1: Supplementary Table 4.
Finally, we used hierarchical meta-regression to evaluate whether country-level factors explained variability in sex differences in the prevalence and incidence of dementia. In unadjusted analyses, there was a significant association between sex and prevalence of dementia (B = 0.28 (95% CI 0.12 to 0.43)), but not incidence (B = 0.14 (95% CI –0.07 to 0.34)). (Supplementary File 2: Supplementary Table 1). When life expectancy at 65 (LE65) was included in the models, the coefficients for sex increased (prevalence B = 0.58 (95% CI 0.29 to 0.86); incidence B = 1.03 (95% CI 0.75 to 1.31) compared to the unadjusted models. Results showed that life expectancy was a potential confounder as it was influenced by sex and was significantly associated with the outcome. Education was a significant predictor of both incidence and prevalence and was also a potential confounder because it was associated with sex. This was confirmed by its inclusion in the model leading to a change in the coefficient for sex. The GDI was associated with incidence but not prevalence, the GII was associated with both incidence and prevalence, and the unemployment ratio of female to male was associated with incidence but not prevalence. However, these three factors do not qualify as potential confounders because their adjustment did not affect the sex coefficient. Finally, there were no interactions between LE65 and sex, and the interaction between education and sex was B = –0.13 (95% CI –0.25 to –0.01). All meta-regression models were adjusted for age group.
The final meta-regression evaluated the impact of the above covariates on estimates of dementia incidence and prevalence (Table 2). Using the 2016 country-level data, women with higher education had reduced dementia incidence and prevalence compared with men with the same level of education. In a sensitivity analysis using 2006 country-level data (Table 2), higher education reduced the incidence and prevalence of dementia for men and women equally.
Table 2
Meta-regression to find the association between dementia incidence/prevalence and country-specific factors in 2006 and 2016
| Incidence | Prevalence | |||
| 2016 Country-level factors | β (95% Cl) | p | β (95% Cl) | p |
| Female | 1.05 (–2.37, 4.46) | 0.55 | 1.56 (–2.14, 5.27) | 0.41 |
| Life expectancy at age 65 | –0.37 (–0.52, –0.22) | <0.001 | –0.14 (–0.26, –0.02) | 0.02 |
| Gender difference in life expectancy* | 0.12 (–0.06, 0.29) | 0.18 | 0.08 (–0.07, 0.23) | 0.32 |
| Education (y) | 0.02 (–0.07, 0.12) | 0.62 | –0.00 (–0.09, 0.09) | 0.99 |
| Gender difference in education* | –0.13 (–0.26, –0.00) | 0.05 | –0.14 (–0.26, –0.02) | 0.02 |
| Age group | ||||
| 60–64 | Ref | Ref | ||
| 65–69 | 0.90 (0.47, 1.33) | <0.001 | 0.72 (0.35, 1.09) | <0.001 |
| 70–74 | 1.73 (1.30, 2.16) | <0.001 | 1.43 (1.06, 1.79) | <0.001 |
| 75–79 | 2.61 (2.19, 3.02) | <0.001 | 2.15 (1.79, 2.51) | <0.001 |
| 80–84 | 3.22 (2.81, 3.64) | <0.001 | 2.91 (2.54, 3.28) | <0.001 |
| 85–89 | 3.73 (3.29, 4.18) | <0.001 | 3.56 (3.17, 3.94) | <0.001 |
| 90+ | 4.28 (3.84, 4.73) | <0.001 | 4.23 (3.85, 4.61) | <0.001 |
| Incidence | Prevalence | |||
| 2006 Country-level factors | β (95% Cl) | p | β (95% Cl) | p |
| Female | 3.17 (–1.16, 7.50) | 0.15 | 1.05 (–1.40, 3.50) | 0.40 |
| Life expectancy at age 65 | –0.20 (–0.40, –0.00) | 0.05 | –0.18 (–0.30, –0.06) | 0.003 |
| Gender difference in life expectancy* | –0.10 (–0.32, 0.13) | 0.40 | –0.02 (–0.16, 0.13) | 0.81 |
| Education (y) | –0.10 (–0.18, –0.02) | 0.02 | –0.03 (–0.09, 0.03) | 0.33 |
| Gender difference in education* | –0.03 (–0.15, 0.08) | 0.55 | 0.02 (–0.07, 0.10) | 0.66 |
| Age group | ||||
| 60–64 | Ref | |||
| 65–69 | 0.83 (0.37, 1.28) | <0.001 | 0.83 (0.48, 1.18) | <0.001 |
| 70–74 | 1.65 (1.20, 2.11) | <0.001 | 1.53 (1.18, 1.87) | <0.001 |
| 75–79 | 2.57 (2.13, 3.01) | <0.001 | 2.25 (1.91, 2.59) | <0.001 |
| 80–84 | 3.19 (2.75, 3.63) | <0.001 | 3.04 (2.69, 3.39) | <0.001 |
| 85–89 | 3.73 (3.26, 4.20) | <0.001 | 3.75 (3.38, 4.11) | <0.001 |
| 90+ | 4.34 (3.87, 4.81) | <0.001 | 4.42 (4.06, 4.79) | <0.001 |
*‘Gender difference in life expectancy at age 65’ refers to the interaction term gender*life expectancy at age 65, and ‘gender difference in education’ refers to the interaction term gender*education, with male as the reference.
DISCUSSION
Our study reports, what is to our knowledge, the first synthesis of global data on dementia incidence and prevalence stratified by sex. Apart from higher incidence of Any dementia in very old adults, which is similar to a previous report [22], we found no difference in incidence between men and women for Any dementia, AD, or VaD. The heterogeneity among studies was high. We found higher prevalence of AD in women at all ages except 70 to 74, but there was no sex difference in the prevalence of VaD. Prevalence data were also highly heterogenous. Gender differences in education contributed to prevalence and incidence of dementia, with women benefiting more from higher education when the 2016 country-level data were analyzed. We note that in very late life when sex differences are most apparent, there are high rates of mixed dementia, and the clinical diagnoses are less reliable. Although country-level indicators of gender inequality and development did not explain gender differences in dementia rates, they were associated with higher dementia rates regardless of sex.
A recent systematic review reported that between the ages of 60 and 69, females had 1.9 times the rate of AD compared to males, but that this difference did not reach statistical significance [22] and a second review also reported higher incidence and prevalence of dementia in women but again, these differences did not reach significance [23]. In comparison, our study also found that the prevalence of AD at age 65 was twice as high in women than in men but in our analysis, this was statistically significant. The difference in our study may have been due to our inclusion of more studies leading to a larger sample size. The difference in age ranges used for meta-analyses may have also influenced results. We also observed higher rates of AD at age 75, confirming many other reports of the higher prevalence of AD among women.
Our review’s findings of the global incidence of dementia based on 53 studies of 178,227 participants had similar findings to a comparable prior review of global incidence of dementia including 62 studies [1] of 109,952 participants from the literature up until 2015. While our review found incidence of 2.55, 4.90, and 11.08 for ages 60–64, 65–69, and 70–74, the prior review reported incidence of 3.9, 6.4, and 10.6 for ages 60–64, 65–69, and 70–74, respectively. However, that review did not report incidence by sex.
Our review is limited by the quality of diagnostic classification in the source studies, variable geographical representation and constraints on the availability of data from many low- and middle-income countries (Fig. 3). There was also variation in the number of studies contributing data for different age groups with less data available for the youngest and oldest age ranges, and variation in the birth era of cohorts. Our findings may also be subject to mortality bias. As women live longer than men, this may lead to higher rates of dementia observed among women and some risk factors for dementia may also cause mortality. The use of standardized tools for case ascertainment is a study strength, but language and cultural differences between countries may still introduce bias. Other study strengths include the large sample size, consideration of country-level factors, and consideration of dementia sub-types. The lower rates of women in some studies may reflect bias at recruitment or gender differences in education or engagement with health services.
Our meta-regression analyses suggest that the main contribution to sex differences in dementia prevalence is life expectancy and gender differences in education. This suggests that classification of research participants into categories of sex is likely to be strongly influenced by the socio-cultural factors contributing to gender. Hence ‘sex differences’ in dementia prevalence may be attributable in part to gender inequality. Education may impact opportunities to build cognitive reserve [24] in early life, which is recognized as important for reducing risk of late-life dementia [25]. Employment provides opportunity for mental stimulation as well as financial independence, which in turn provides opportunities for health care, education, and social engagement, which have been linked to reduced risk of dementia [26]. Without considering the broad impact of socio-demographic factors, research into biological mechanisms underpinning sex and gender differences in risk of dementia is likely to be inconclusive.
Conclusion
In conclusion, we found dementia incidence was the same for men and women except in the over 90s age group, where it was higher in women. We found AD more prevalent in women, but no sex difference in the prevalence of VaD or Any dementia. Although women’s longer lives explain some of their observed higher prevalence of AD, gender differences in education may also influence dementia outcomes. Greater focus on gender differences in life expectancy and inequality in education as potential explanations of sex differences in dementia and AD prevalence is needed.
ACKNOWLEDGMENTS
The authors have no acknowledgments to report.
FUNDING
We acknowledge the support of the ARC Centre of Excellence in Population Ageing Research. KJA is funded by ARC Laureate Fellowship FL190100011 and National Health and Medical Research Council (NHMRC) Grants 1100579 and 1102694. RP is funded by the NHMRC Dementia Centre for Research Collaboration. Funders of this study had no role in study design, data collection, data analysis, data interpretation, or writing of the report.
CONFLICT OF INTEREST
KJA and RP are members of the Editorial Board of this journal but were not involved in the peer review process nor had access to any information regarding its peer review.
All other authors have no conflicts of interest to report.
DATA AVAILABILITY
The datasets generated and analyzed during this study are available in the Mendeley Data repository, http://dx.doi.org/10.17632/c93bf5v4bg.1.
SUPPLEMENTARY MATERIAL
[1] The supplementary material is available in the electronic version of this article: https://dx.doi.org/10.3233/JAD-220724.
REFERENCES
[1] | Prince M , Wimo A , Guerchet M , Ali G-C , Wu Y-T , Prina M ((2015) ) World Alzheimer Report 2015. The global impact of dementia: An analysis of prevalence, incidence, cost and trends. Alzheimer’s Disease International, London. |
[2] | Patterson C ((2018) ) World Alzheimer Report 2018: The state of the art of dementia research: New frontiers. Alzheimer’s Disease International, London. |
[3] | Ahmadi-Abhari S , Guzman-Castillo M , Bandosz P , Shipley MJ , Muniz-Terrera G , Singh-Manoux A , Kivimaki M , Steptoe A , Capewell S , O’Flaherty M , Brunner EJ ((2017) ) Temporal trend in dementia incidence since 2002 and projections for prevalence in England and Wales to 2040: Modelling study. BMJ 358: , j2856. |
[4] | Wolters FJ , Chibnik LB , Waziry R , Anderson R , Berr C , Beiser A , Bis JC , Blacker D , Bos D , Brayne C , Dartigues JF , Darweesh SKL , Davis-Plourde KL , de Wolf F , Debette S , Dufouil C , Fornage M , Goudsmit J , Grasset L , Gudnason V , Hadjichrysanthou C , Helmer C , Ikram MA , Ikram MK , Joas E , Kern S , Kuller LH , Launer L , Lopez OL , Matthews FE , McRae-McKee K , Meirelles O , Mosley TH Jr. , Pase MP , Psaty BM , Satizabal CL , Seshadri S , Skoog I , Stephan BCM , Wetterberg H , Wong MM , Zettergren A , Hofman A ((2020) ) Twenty-seven-year time trends in dementia incidence in Europe and the United States: The Alzheimer Cohorts Consortium, Neurology 95: , e519–e531. |
[5] | Nebel RA , Aggarwal NT , Barnes LL , Gallagher A , Goldstein JM , Kantarci K , Mallampalli MP , Mormino EC , Scott L , Yu WH , Maki PM , Mielke MM ((2018) ) Understanding the impact of sex and gender in Alzheimer’s disease: A call to action. Alzheimers Dement 14: , 1171–1183. |
[6] | Mielke MM , Vemuri P , Rocca WA ((2014) ) Clinical epidemiology of Alzheimer’s disease: Assessing sex and gender differences. Clin Epidemiol 6: , 37–48. |
[7] | Yu JT , Xu W , Tan CC , Andrieu S , Suckling J , Evangelou E , Pan A , Zhang C , Jia J , Feng L , Kua EH , Wang YJ , Wang HF , Tan MS , Li JQ , Hou XH , Wan Y , Tan L , Mok V , Tan L , Dong Q , Touchon J , Gauthier S , Aisen PS , Vellas B ((2020) ) Evidence-based prevention of Alzheimer’s disease: Systematic review and meta-analysis of 243 observational prospective studies and 153 randomised controlled trials. J Neurol Neurosurg Psychiatry 91: , 1201–1209. |
[8] | Anstey KJ , Peters R , Mortby ME , Kiely KM , Eramudugolla R , Cherbuin N , Huque MH , Dixon RA ((2021) ) Association of sex differences in dementia risk factors with sex differences in memory decline in a population-based cohort spanning 20-76 years. Sci Rep 11: , 7710. |
[9] | McDermott KL , McFall GP , Andrews SJ , Anstey KJ , Dixon RA ((2017) ) Memory resilience to Alzheimer’s genetic risk: Sex effects in predictor profiles. J Gerontol B Psychol Sci Soc Sci 72: , 937–946. |
[10] | Petrosini L , De Bartolo P , Foti F , Gelfo F , Cutuli D , Leggio MG , Mandolesi L ((2009) ) On whether the environmental enrichment may provide cognitive and brain reserves. Brain Res Rev 61: , 221–239. |
[11] | Caamano-Isorna F , Corral M , Montes-Martinez A , Takkouche B ((2006) ) Education and dementia: A meta-analytic study. Neuroepidemiology 26: , 226–232. |
[12] | Matthews FE , Jagger C , Miller LL , Brayne C ((2009) ) Education differences in life expectancy with cognitive impairment. J Gerontol A Biol Sci Med Sci 64: , 125–131. |
[13] | Radford K , Delbaere K , Draper B , Mack HA , Daylight G , Cumming R , Chalkley S , Minogue C , Broe GA ((2017) ) Childhood stress and adversity is associated with late-life dementia in Aboriginal Australians. Am J Geriatr Psychiatry 25: , 1097–1106. |
[14] | Maurer J ((2011) ) Education and male-female differences in later-life cognition: International evidence from Latin America and the Caribbean. Demography 48: , 915–930. |
[15] | Xu H , Yang R , Dintica C , Qi X , Song R , Bennett DA , Xu W ((2020) ) Association of lifespan cognitive reserve indicator with the risk of mild cognitive impairment and its progression to dementia. Alzheimers Dement 16: , 873–882. |
[16] | Moher D , Liberati A , Tetzlaff J , Altman DG , Group P ((2009) ) Preferred reporting items for systematic reviews and meta-analyses: The PRISMA statement. BMJ 339: , b2535. |
[17] | Folstein MF , Robins LN , Helzer JE ((1983) ) The Mini-Mental State Examination. Arch Gen Psychiatry 40: , 812. |
[18] | American Psychiatric Association ((1994) ) Diagnostic and Statistical Manual of Mental Disorders (DSM-IV), APA, Washington. |
[19] | Morris JC ((1993) ) The Clinical Dementia Rating (CDR): Current version and scoring rules. Neurology 43: , 2412–2414. |
[20] | OECD, Social Institutions and Gender Index, https://www.genderindex.org/, Accessed 1/07/2019. |
[21] | Deeks JJ , Dinnes J , D’Amico R , Sowden AJ , Sakarovitch C , Song F , Petticrew M , Altman DG , International Stroke Trial Collaborative G, European Carotid Surgery Trial Collaborative Group ((2003) ) Evaluating non-randomised intervention studies. Health Technol Assess 7: , iii-x, 1–173. |
[22] | Cao Q , Tan CC , Xu W , Hu H , Cao XP , Dong Q , Tan L , Yu JT ((2020) ) The prevalence of dementia: A systematic review and meta-analysis. J Alzheimers Dis 73: , 1157–1166. |
[23] | Fiest KM , Roberts JI , Maxwell CJ , Hogan DB , Smith EE , Frolkis A , Cohen A , Kirk A , Pearson D , Pringsheim T , Venegas-Torres A , Jette N ((2016) ) The prevalence and incidence of dementia due to Alzheimer’s disease: A systematic review and meta-analysis. Can J Neurol Sci 43 Suppl 1: , S51–82. |
[24] | Meng X , D’Arcy C ((2012) ) Education and dementia in the context of the cognitive reserve hypothesis: A systematic review with meta-analyses and qualitative analyses. PLoS One 7: , e38268. |
[25] | Livingston G , Huntley J , Sommerlad A , Ames D , Ballard C , Banerjee S , Brayne C , Burns A , Cohen-Mansfield J , Cooper C , Costafreda SG , Dias A , Fox N , Gitlin LN , Howard R , Kales HC , Kivimaki M , Larson EB , Ogunniyi A , Orgeta V , Ritchie K , Rockwood K , Sampson EL , Samus Q , Schneider LS , Selbaek G , Teri L , Mukadam N ((2020) ) Dementia prevention, intervention, and care: 2020 report of the Lancet Commission. Lancet 396: , 413–446. |
[26] | Anstey KJ , Ee N , Eramudugolla R , Jagger C , Peters R ((2019) ) A systematic review of meta-analyses that evaluate risk factors for dementia to evaluate the quantity, quality, and global representativeness of evidence. J Alzheimers Dis 70: , S165–S186. |


