
Prediction of Alzheimer’s Disease Using Patterns of Methylation Levels in Key Immunologic-Related Genes
Abstract
Background:
DNA methylation is expected to become a kind of new diagnosis and treatment method of Alzheimer’s disease (AD). Neuroinflammation- and immune-related pathways represent one of the major genetic risk factors for AD.
Objective:
We aimed to investigate DNA methylation levels of 7 key immunologic-related genes in peripheral blood and appraise their applicability in the diagnosis of AD.
Methods:
Methylation levels were obtained from 222 participants (101 AD, 72 MCI, 49 non-cognitively impaired controls). Logistic regression models for diagnosing AD were established after least absolute shrinkage and selection operator (LASSO) and best subset selection (BSS), evaluated by respondent working curve and decision curve analysis for sensitivity.
Results:
Six differentially methylated positions (DMPs) in the MCI group and 64 in the AD group were found, respectively. Among them, there were 2 DMPs in the MCI group and 30 DMPs in the AD group independent of age, gender, and APOE4 carriers (p < 0.05). AD diagnostic prediction models differentiated AD from normal controls both in a training dataset (LASSO: 8 markers, including methylation levels at ABCA7 1040077, CNR1 88166293, CX3CR1 39322324, LRRK2 40618505, LRRK2 40618493, NGFR 49496745, TARDBP 11070956, TARDBP 11070840 area under the curve [AUC] = 0.81; BSS: 2 markers, including methylation levels at ABCA7 1040077 and CX3CR1 39322324, AUC = 0.80) and a testing dataset (AUC = 0.84, AUC = 0.82, respectively).
Conclusion:
Our work indicated that methylation levels of 7 key immunologic-related genes (ABCA7, CNR1, CX3CR1, CSF1R, LRRK2, NGFR, and TARDBP) in peripheral blood was altered in AD and the models including methylation of immunologic-related genes biomarkers improved prediction of AD.
INTRODUCTION
Alzheimer’s disease (AD) is the leading cause of dementia. Approximately 10% of elders aged≥65 years are thought to have AD [1, 2]. The exact etiology and mechanism of AD are still unclear. Numerous studies have confirmed that AD is affected by both genetic and environmental factors, leading to plaques formed by amyloid-β (Aβ) deposits, neurofibrillary tangles, neuron and synapse loss, excessive microglial activation, and immunopathological changes in the brain [3, 4].
Multiple genome-wide association studies have revealed genetic risk factors for the late-onset AD [5]. Neuroinflammation- and immune-related pathways represent major genetic risk factors for AD. ABCA7, BIN1, CR1, SORL1 [6], CX3CR1 [7], NGFR [8], LRRK2 [9], and other mutations related to the risk of AD are located in immune cells. These genes are highly expressed in AD and trigger neuroimmune and inflammation by regulating the function of microglia, participating in the complement system, and mediating Aβ and tau immune phagocytosis and synaptic refinement [10].
DNA methylation indicates the transfer of S-adenosyl methionine as the methyl donor under the catalysis of DNA methyltransferase to a specific base. The methylation level of a specific CpG site in humans varies greatly between individuals, but remains stable within a specific individual for a certain period of time [11]. Differential methylation levels of specific genes among individuals can be used to explore interactions between genetic and environmental effects on diseases [12]. Large-scale genome-wide methylation studies have revealed that BIN1, SORL1, ABCA7, HLA-DRB5, SLC24A4, ANK1, CDH23, DIP2A, RHBDF2, RPL13, SERPINF1, and SERPINF2 have differentially methylated regions and differentially methylated sites in the brain [13, 14]. Since it is almost impossible to obtain brain samples before a patient is born, the study of methylation markers of AD in the patient’s peripheral blood is gaining attention [15–20]. Peripheral DNA methylation shows few large magnitude changes over a period of several years during late life [21]. The study of DNA methylation in blood cells can help to clarify the biological impact of the environment and behavior on diseases, and can be used as a biomarker to predict the occurrence of disease [15].
Few studies have focused on the relationship between the methylation of multiple immune-related genes and AD, as well as mild cognitive impairment (MCI). In this study, we concentrated on differential methylation in the promoter regions of seven immune-related AD risk genes: CX3CR1, ABCA7, NGFR, LRRK2, TARDBP, CNR1, and CSF1R. These genes either act as members of molecular networks involved in microglial activation [22, 23], regulation [24], phagocytosis [25], apoptosis [8, 26–28], or as signaling molecules for microglia and neurons [7, 29], and participate in the neuroinflammatory mechanism of AD, ultimately regulating the processes of Aβ clearance in the brain and the tau protein accumulation, aggregation, and release [30, 31]. Methylation in the promoter regions of the abovementioned genes was investigated in peripheral blood of patients with MCI and AD, and non-cognitively impaired controls (NC), in an effort to provide further evidence for differential methylation level of genes in peripheral blood as biomarkers for the diagnosis of AD.
MATERIALS AND METHODS
Participants
This was a case-control study of Chinese patients from the neurology clinics of Fujian Medical University Union Hospital. A total of 173 patients from the Dementia Clinic with a clinical diagnosis of cognitive impairment were included in this study. The patients with MCI and AD were recruited among routine visitors of the cognitive disorder clinic of the Department of Neurology, Fujian Medical University Union Hospital, with history of concomitant memory loss≥6 months. Additionally, 49 NC were recruited in the physical examination center and from the community at the same time. They were matched to the patients in terms of age, sex, and education level, and found to have no cognitive impairment through a cognitive function assessment. The diagnosis of AD was based on the 2011 NIA-AA criteria [32]. The diagnostic criteria for the MCI group were the following (based on Petersen’s criteria [33]): 1) cognitive impairment reported by the patient or an informed or experienced clinician for more than three months; 2) objective evidence of cognitive impairment; 3) maintenance of independent activities of daily living, with a normal ADL score; 4) diagnostic criteria for dementia have not been met. The exclusion criteria were as follows: 1) presence of mental and neurodevelopmental retardation, mental disorders, congenital mental retardation, severe depression, and other mental disorders; 2) presence of frontotemporal dementia, vascular dementia, and other cognitive disorders; 3) presence of brain tumors, encephalitis, syphilis, normal intracranial pressure hydrocephalus, and other neurological organic diseases that affect cognition; 4) presence of other neurodegenerative diseases, such as multiple system atrophy and Parkinson’s disease; 5) presence of a vitamin deficiency, abnormal thyroid function, alcoholism, drug abuse, or other medical diseases and metabolic factors that affect cognitive function; 6) presence of other nervous system disorders, severe heart, lung, liver, or kidney dysfunction, and other diseases; 7) presence of paraplegia, aphasia, inactivation, and visual or auditory problems inferring with the completion of the neurocognitive battery; 8) presence of infection, metabolic disease, immune system abnormality, or other diseases that cause abnormal proportion of peripheral blood cells.
This study was approved by the Ethics Committee of the Fujian Medical University Union Hospital. All participation was voluntary, and written informed consent was obtained. If the dementia experts determined that the patient lacked the ability to consent due to severe cognitive impairments, we obtained a written informed consent form from the patient’s legal close relatives, with the consent of the patient, as approved by the local ethics committee.
Neuropsychological measurements and diagnosis of AD and MCI
A set of cognitive psychological assessments were executed to determine subjects’ cognitive functions, covering areas such as global cognition, executive function, spatial structure function, memory, language, and attention. Dementia cases were diagnosed by a team of clinical dementia experts and researchers using a variety of sources of evidence, including medical historical data, physical examination, neuropsychometer evaluation results, and cranial brain MRI. MCI or possible AD diagnosis was made based on the National Alzheimer’s Association standards without reference to biomarkers.
Blood specimen collection and DNA methylation determination
Lithium heparin tubes (BD Vacutainer, 75 usp units) were used to collect 3–5 ml of whole blood from the elbow vein of the participants. Samples of the subject’s whole blood were centrifuged for 10 min with 2000 rpm within 2 h of collection. The separated white blood cell layer was stored in a sterile 1.5 ml EP tube at –80°C before testing.
White blood cell samples were extracted using a Blood Genomic DNA kit (TGuide), and an automatic nucleic acid extractor (TGuide M6) was used to extract DNA. A garose gel electrophoresis was used to detect genomic DNA integrity, Nanodrop 2000 was used to detect genomic DNA quality: concentration≥20 ng/l, total≥1μg (for detection of 10 multiple PCR Panels), OD260/280 1.7–2.0, OD260/230≥1.8. The methylation of specific CpG sites in targeted genes’ promoter regions was tested by methyl target sequencing (Genesky Biotechnologies Inc, Shanghai, China), using next-generation sequencing-based multiple-target CpG methylation analysis [34, 35]. High-quality sequencing primers were designed to flank each targeted CpG site in 100–300 nucleotide regions using Methylation FastTarget V4.1. Selected primers used human genomes converted with bisulfite as a template to amplify with a clear single band for subsequent experiments. Genomic Tip-500 columns (Qiagen, Valencia, CA, USA) was used to extract DNA from blood samples and EZ DNA Methylation™-GOLD Kit (Zymo Research, CA, USA) was used for bisulfite conversion according to the manufacturer’s protocols. After polymerase chain reaction amplification (HotStarTaq polymerase kit, TAKARA, Tokyo, Japan) and library construction, samples were sequenced (Illumina HiSeq Benchtop Sequencer, CA, USA) using the paired-end sequencing protocol according to the manufacturer’s guidelines [36].
Statistical analysis
For sample characteristics, age was presented as the mean±standard deviation and Montreal Cognitive Assessment was presented as median (interquartile range). The number of apolipoproteins E4 carriers and sex were expressed as frequencies (%). The D’Agostino-Pearson test was used to verify whether the data were normally distributed. The student’s t-test was used to compare continuous normally and Mann–Whitney U test for non-normally distributed data. Categorical variables were compared using the Pearson’s χ2 test.
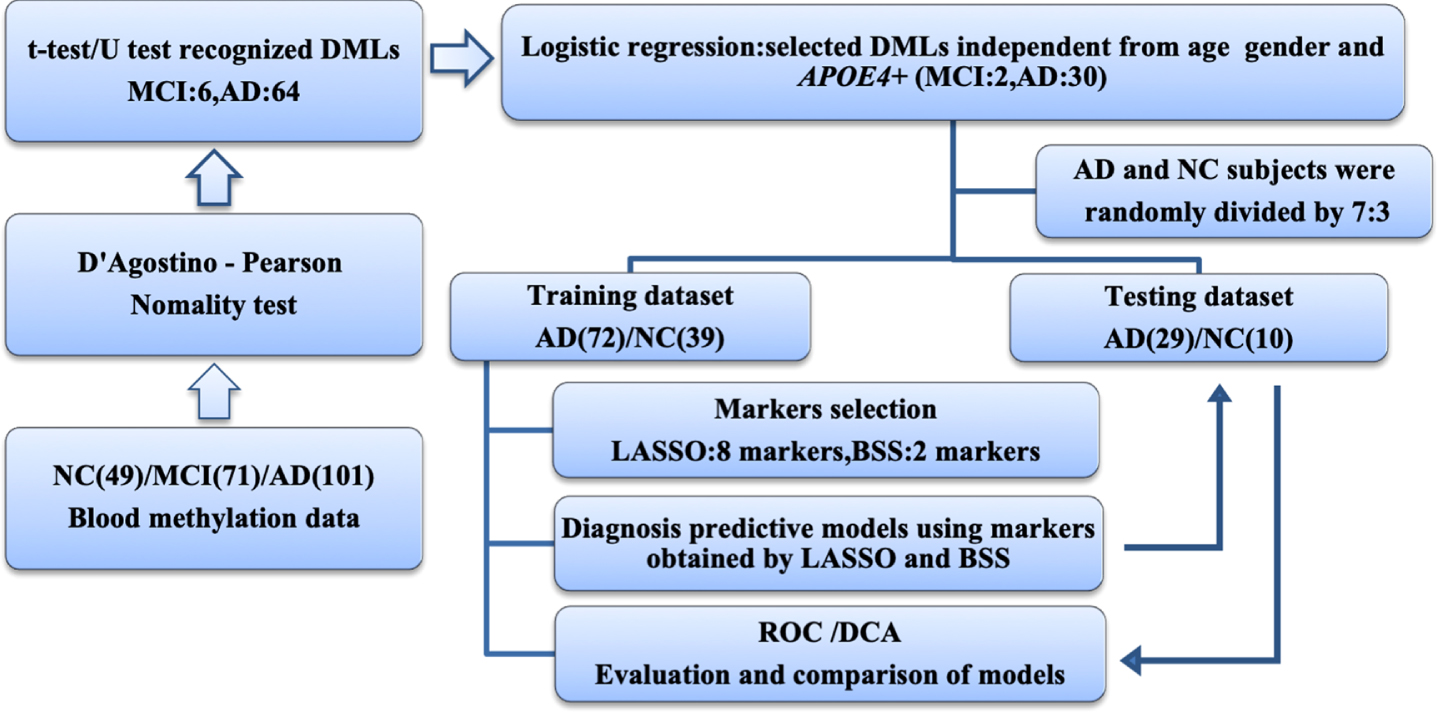
Benjamin-Hochberg correction was used for analyzing the data of differentially methylated locus (DMPs) and a false discovery rate (FDR)<0.15 was considered to be statistically different. DMPs were evaluated with adjustment for age, sex, and APOE4 carriers in binary logistic regression analyses. The Spearman’s rank correlation coefficient was used to identify the pairwise correlations between every 2 of the 7 genes, respectively. Least absolute shrinkage and selection operator (LASSO) and best subset selection (BSS) were used to reduce the dimensionality of DMPs. Receiver operating characteristic (ROC) curve analysis was used to evaluate and compare the models established by the two-dimension reduction methods. Decision curve analysis (DCA) was used to compare the benefits between models and diagnostic efficacy was evaluated by the area under the ROC curve (AUC) and DCA curve (AUDC) (Fig. 1).
Fig. 1
Workflow chart of data generation and analysis. Methylation data of 7 gene promoters in peripheral blood in MCI, AD, and NC groups revealed 64 AD and 6 MCI differentially methylated loci. Logistic regression was used to identify diagnostic markers independent of age, sex and APOE4 carriers. LASSO and BSS were applied to a training cohort of 72 patients with AD and 39 NC to determine the final selection of markers. These markers were then applied to a testing cohort of 29 patients with AD and 10 NC. The areas under ROC and DCA curves were used to evaluate and compare models. AD, Alzheimer’s disease; BSS, best subset selection; DCA, decision curve analysis; DMP, differentially methylated locus; LASSO, least absolute shrinkage and selection operator; MCI, mild cognitive impairment; NC, non-cognitively impaired controls; ROC, receiver operating characteristic.
The t-test, U test, Pearson’s χ2 test, binary logistics regression analysis, D’Agostino-Pearson test, Spearman’s rank correlation coefficient analysis, and ROC curve analysis were performed in SPSS v26.0 (IBM, Armonk, NY, USA) and Prism v 9 (GraphPad, San Diego, CA, USA). LASSO, BSS, and DCA were performed in R 4.0.5 GUI 1.74 Catalina build (7950).
RESULTS
Characteristics of the study population
Among the 173 patients with a clinical diagnosis of cognitive impairment, 72 patients had MCI and 101 had AD. There were no significant differences in age, sex, and the presence of the APOE4 allele among the MCI, AD, and NC groups (p > 0.05) (Table 1).
Table 1
Characteristics of study population
| Characteristics | Total | AD | MCI | NC | p |
| N | 222 | 101 | 72 | 49 | / |
| Age, Mean±SD | 66.60±8.38 | 67.16±7.91 | 66.97±8.85 | 64.84±8.69 | 0.468* |
| Sex, female (%) | 122 (54.95%) | 61 (60.40%) | 34 (47.22%) | 28 (57.1%) | 0.479† |
| Smoking (%) | 63 (28.38%) | 35 (34.65%) | 17 (23.61%) | 11 (17.19%) | 0.165† |
| APOE4+(%) | 42 (18.92%) | 26 (25.74%) | 10 (13.89%) | 6 (12.24%) | 0.059† |
| MoCA, median (q1-q3) | 21 (14-25) | 13.5 (8.75-17) | 23 (22-24) | 27 (26 -28) | <0.0001† |
AD, Alzheimer disease; APOE4+, apolipoprotein E4 carrier; MCI, mild cognitive impairment; MoCA, Montreal Cognitive Assessment; N, numbers; NC, non-cognitively impaired controls; q1, the first quartile; q3, the third quartile; SD, standard deviation. *Intergroup comparisons were tested by Mann–Whitney U test. †Intergroup comparisons were tested by Chi-square test.
Distribution and methylation level of DMPs in MCI and AD groups
We focused on 15 detection fragments in the promoter regions of seven target genes. Among these, the CX3CR1 and CSF1 R promoter regions, and one detection fragment of TARDBP (TARDBP_1) showed medium to high levels of methylation, while the CNR1, LRRK2, NGFR, and ABCA7 gene promoter regions, and the other detection fragment of TARDBP (TARDBP_2) showed low levels of methylation.
6 DMPs were found in the comparison between MCI and NC groups, and 64 DMPs were found in the comparison between AD and NC groups. Patients with AD showed hypomethylation in CpG sites in LRRK2, CNR1, NGFR_3, and CSF1 R, and hypermethylation in CpG sites in ABCA7, CX3CR1, NGFR_1, and TARDBP (Fig. 2). Information regarding the location of the target gene detection fragments and the methylation levels are provided in Table 2.
Fig. 2
Distribution and methylation level of DMPs. The black scale on the outer circle indicates the size of the methylation detection fragments of the 7 gene promoter regions, and the DMPs of MCI and AD (p < 0.05, FDR < 0.15) are marked with numbers. The red-green circle inward is a heat map of the mean methylation level of 15 detection fragments. The change in color from red to green indicates that the level of methylation changes from high to low. The inner circle displays all CpG sites we detected, with each short red line representing the position of one detected CpG site. The blue and purple rings show the DMPs of the AD and MCI groups compared to the methylation level of NC, respectively. Red indicates a change in hypermethylation, whereas green indicates a change in hypomethylation. The black short coils between them show the -log10 (p-value) of corresponding sites in the AD or MCI groups compared with the NC. The chord diagram in the center area shows the correlation of the methylation of the gene’s promoter regions between two pairs. Spearman’s rank correlation coefficient only showed the combination of Spearman’s ρ>0.5 and p < 0.05. Red, positively; Gray, negatively; ABCA7, ATP-binding cassette, sub-family A, member 7; AD, Alzheimer’s disease; CNR1, cannabinoid receptor type 1; CSF1 R, colony-stimulating factor 1 receptor; CX3CR1, fractalkine (CX3CL1) receptor; LRRK2, leucine-rich repeat kinase 2; MCI, mild cognitive impairment; NC, non-cognitively impaired controls; NGFR, nerve growth factor receptor; TARDBP, TAR DNA binding protein. The numbers behind the gene indicate different regions of gene promoters.
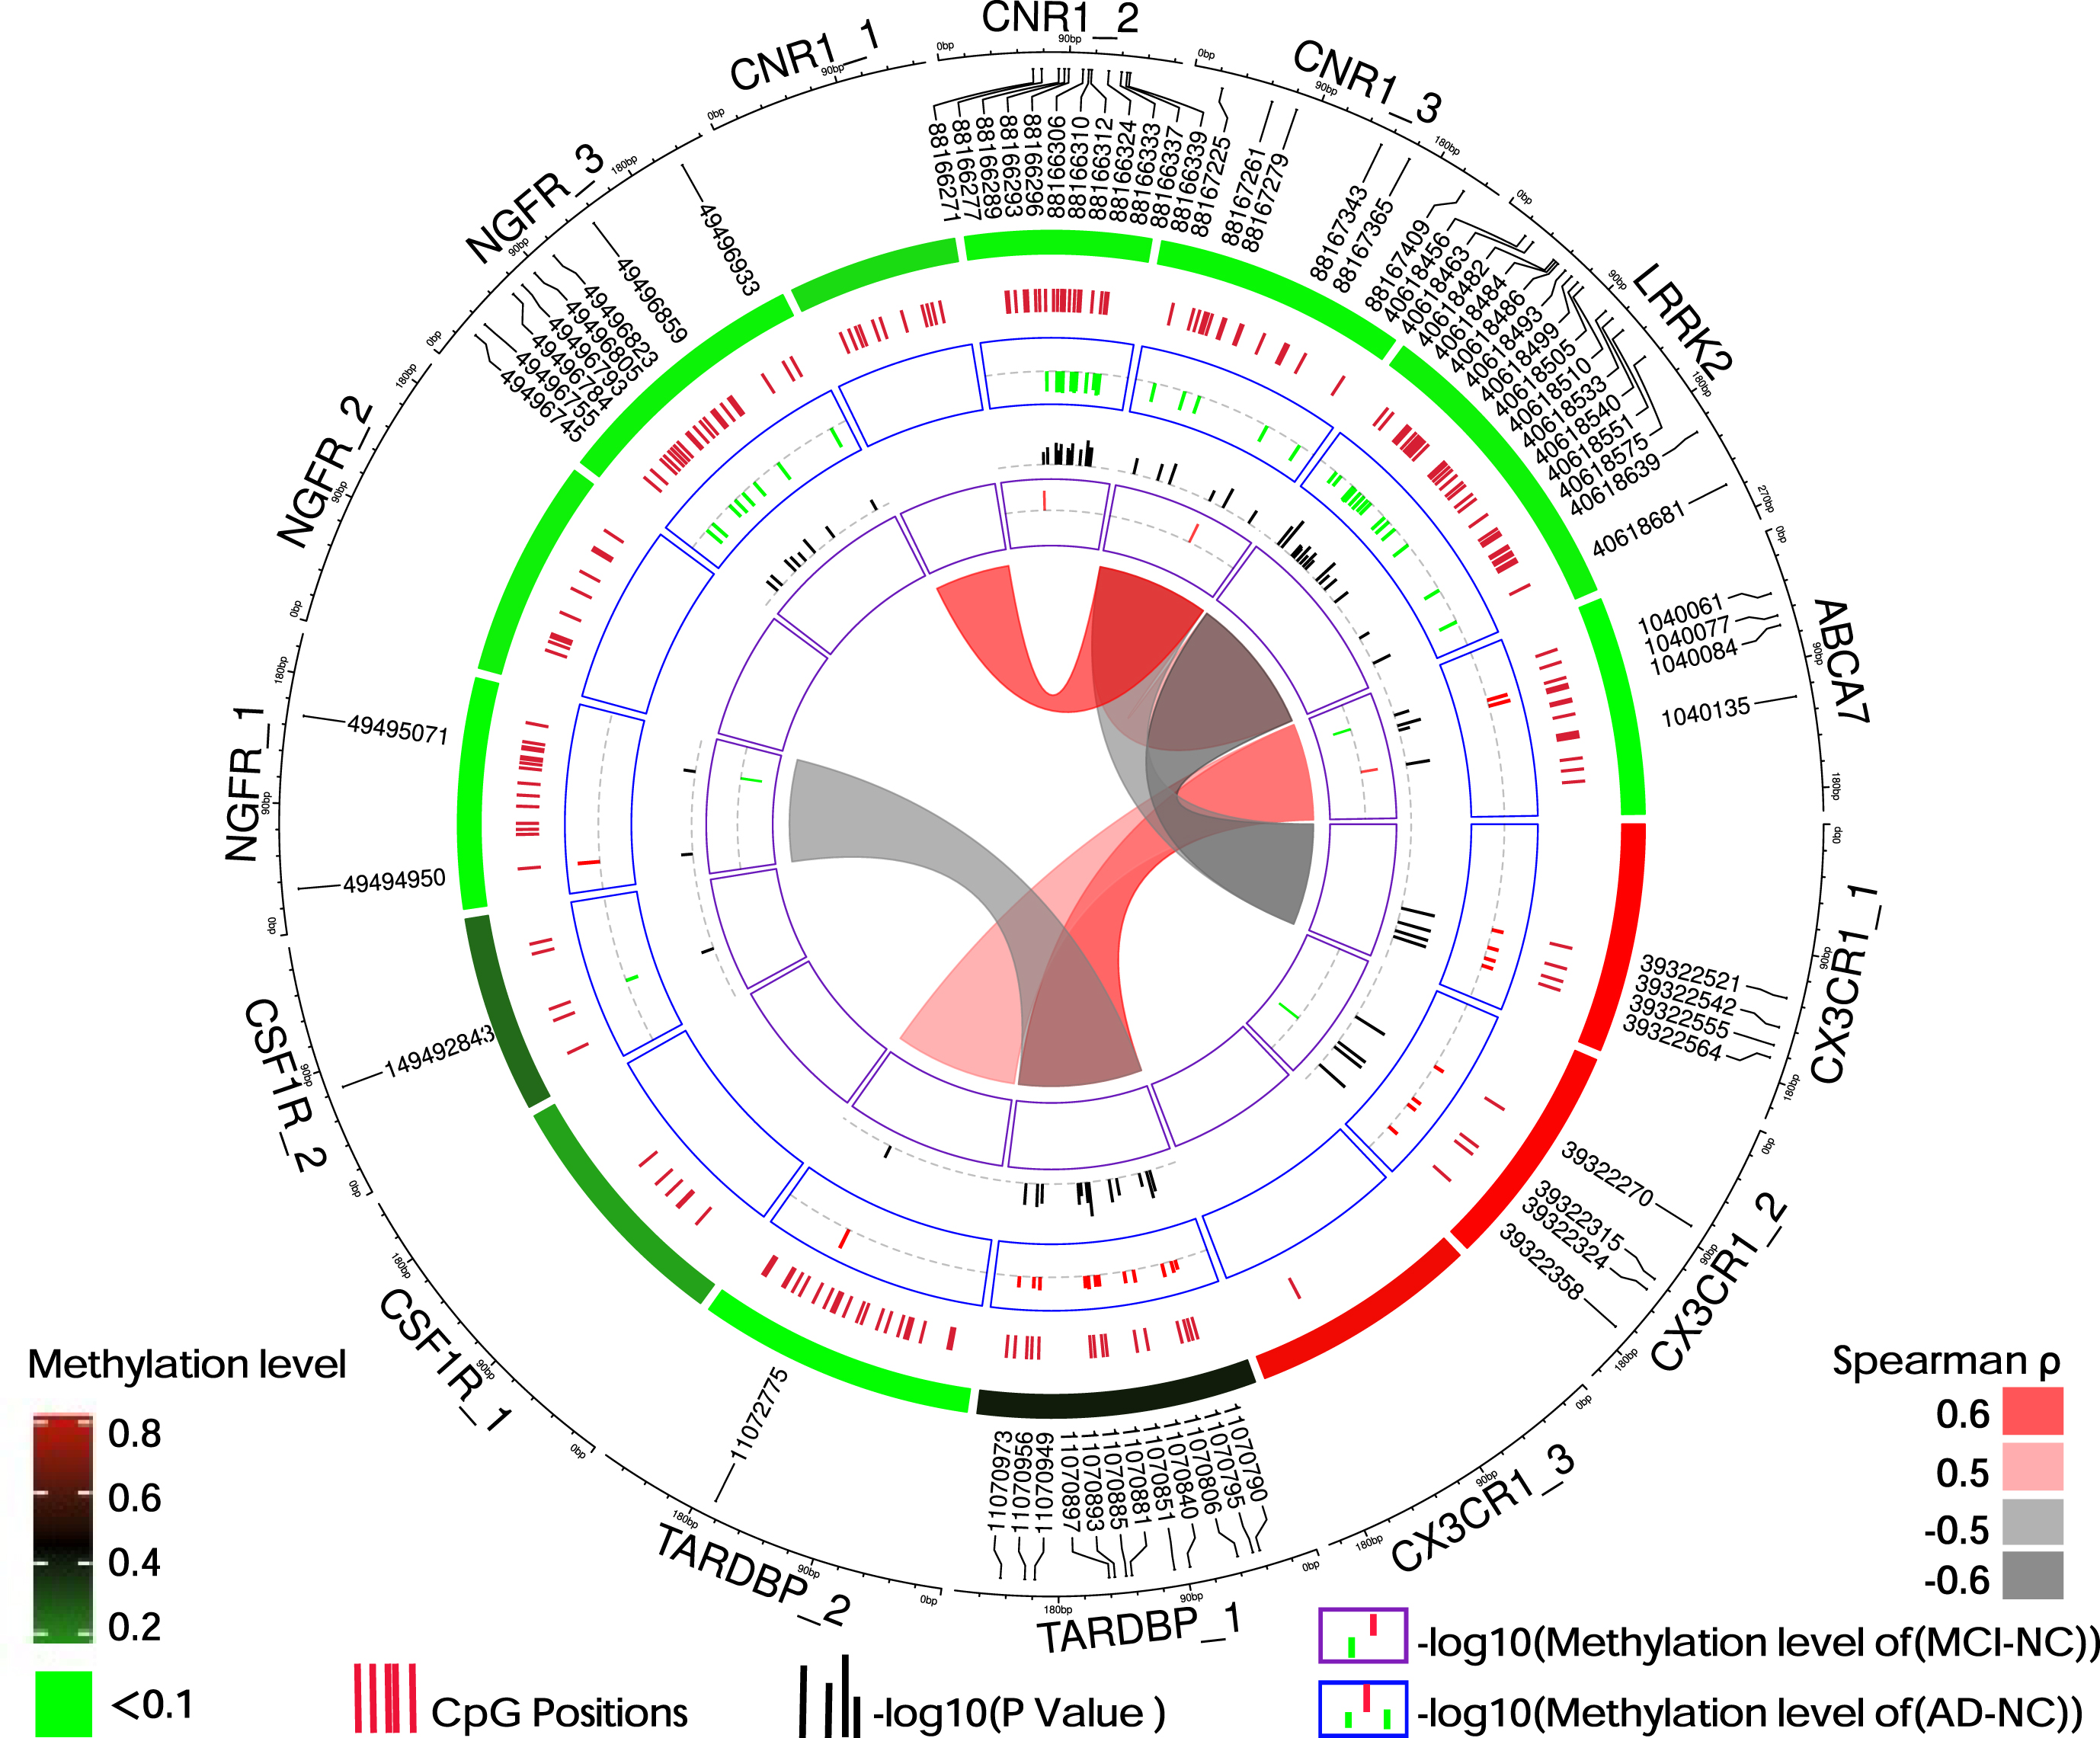
Table 2
Omnibus test for DNA methylation in associated Alzheimer’s disease
| Locus | Chr | Covered Region* | NO of CpGs | Median methylation level | p† | ||||
| start | end | AD (n = 101) | MCI (n = 72) | NC (n = 49) | AD/NC | MCI/NC | |||
| ABCA7 | 9 | 1040020 | 1040216 | 14 | 0.00830979 | 0.00745141 | 0.00757075 | 0.103 | 0.57 |
| CNR1_1 | 6 | 88167739 | 88167587 | 11 | 0.06176567 | 0.06371511 | 0.0611165 | 0.469 | 0.167 |
| CNR1_2 | 6 | 88166374 | 88166207 | 20 | 0.02098191 | 0.02336141 | 0.02411008 | 0.001 | 0.290 |
| CNR1_3 | 6 | 88167431 | 88167204 | 15 | 0.01664872 | 0.01795457 | 0.01868072 | 0.001 | 0.389 |
| CSF1R_1 | 1 | 149468342 | 149468118 | 6 | 0.15629787 | 0.15798427 | 0.15660834 | 0.877 | 0.901 |
| CSF1R_2 | 1 | 149492946 | 149492769 | 5 | 0.22702109 | 0.24944051 | 0.25353721 | 0.300 | 0.938 |
| CX3CR1_1 | 3 | 39322605 | 39322399 | 4 | 0.91538282 | 0.90145737 | 0.87918715 | <0.001 | 0.166 |
| CX3CR1_2 | 3 | 39322394 | 39322190 | 4 | 0.91351796 | 0.89365724 | 0.86356466 | <0.001 | 0.057 |
| CX3CR1_3 | 3 | 39322166 | 39321960 | 1 | 0.89230769 | 0.87096774 | 0.87217195 | 0.233 | 0.626 |
| LRRK2 | 12 | 40618434 | 40618713 | 31 | 0.02251602 | 0.02555931 | 0.02809568 | 0.010 | 0.800 |
| NGFR_1 | 17 | 49494920 | 49495127 | 15 | 0.01108358 | 0.01136358 | 0.0114223 | 0.221 | 0.470 |
| NGFR_2 | 17 | 49495913 | 49496109 | 10 | 0.02914236 | 0.02945779 | 0.02909906 | 0.526 | 0.172 |
| NGFR_3 | 17 | 49496955 | 49496720 | 21 | 0.02425722 | 0.02623852 | 0.02592746 | 0.012 | 0.969 |
| TARDBP_1 | 1 | 11070753 | 11071004 | 15 | 0.41443018 | 0.38904911 | 0.39499731 | 0.005 | 0.875 |
| TARDBP_2 | 1 | 11072608 | 11072857 | 21 | 0.01093909 | 0.01106351 | 0.01079146 | 0.628 | 0.911 |
ABCA7, ATP-binding cassette, sub-family A, member 7; AD, Alzheimer’s disease; Chr, Chromosome; NO, numbers; n, number; CNR1, cannabinoid receptor type 1; CSF1 R, colony-stimulating factor 1 receptor; CX3CR1, fractalkine (CX3CL1) receptor; LRRK2, leucine-rich repeat kinase 2; MCI, mild cognitive impairment; NC, non-cognitively impaired controls; NGFR, nerve growth factor receptor; TARDBP, TAR DNA binding protein. The numbers behind the gene indicate different methylation detection fragments. *The location corresponded to the sequence of hg19 reference genomes. †Intergroup comparisons were tested by Mann–Whitney U test.
Correlation between methylation levels in targeted genes
The correlation analysis of the mean methylation levels of methylation islands in the promoter regions of seven genes (the average level of methylation of all CpG sites in the methylation islands) revealed that the methylation levels of the CpG islands in the promoter regions of different genes were diverse (Fig. 2).
DMPs after adjustment for age, sex, and APOE4 carriers
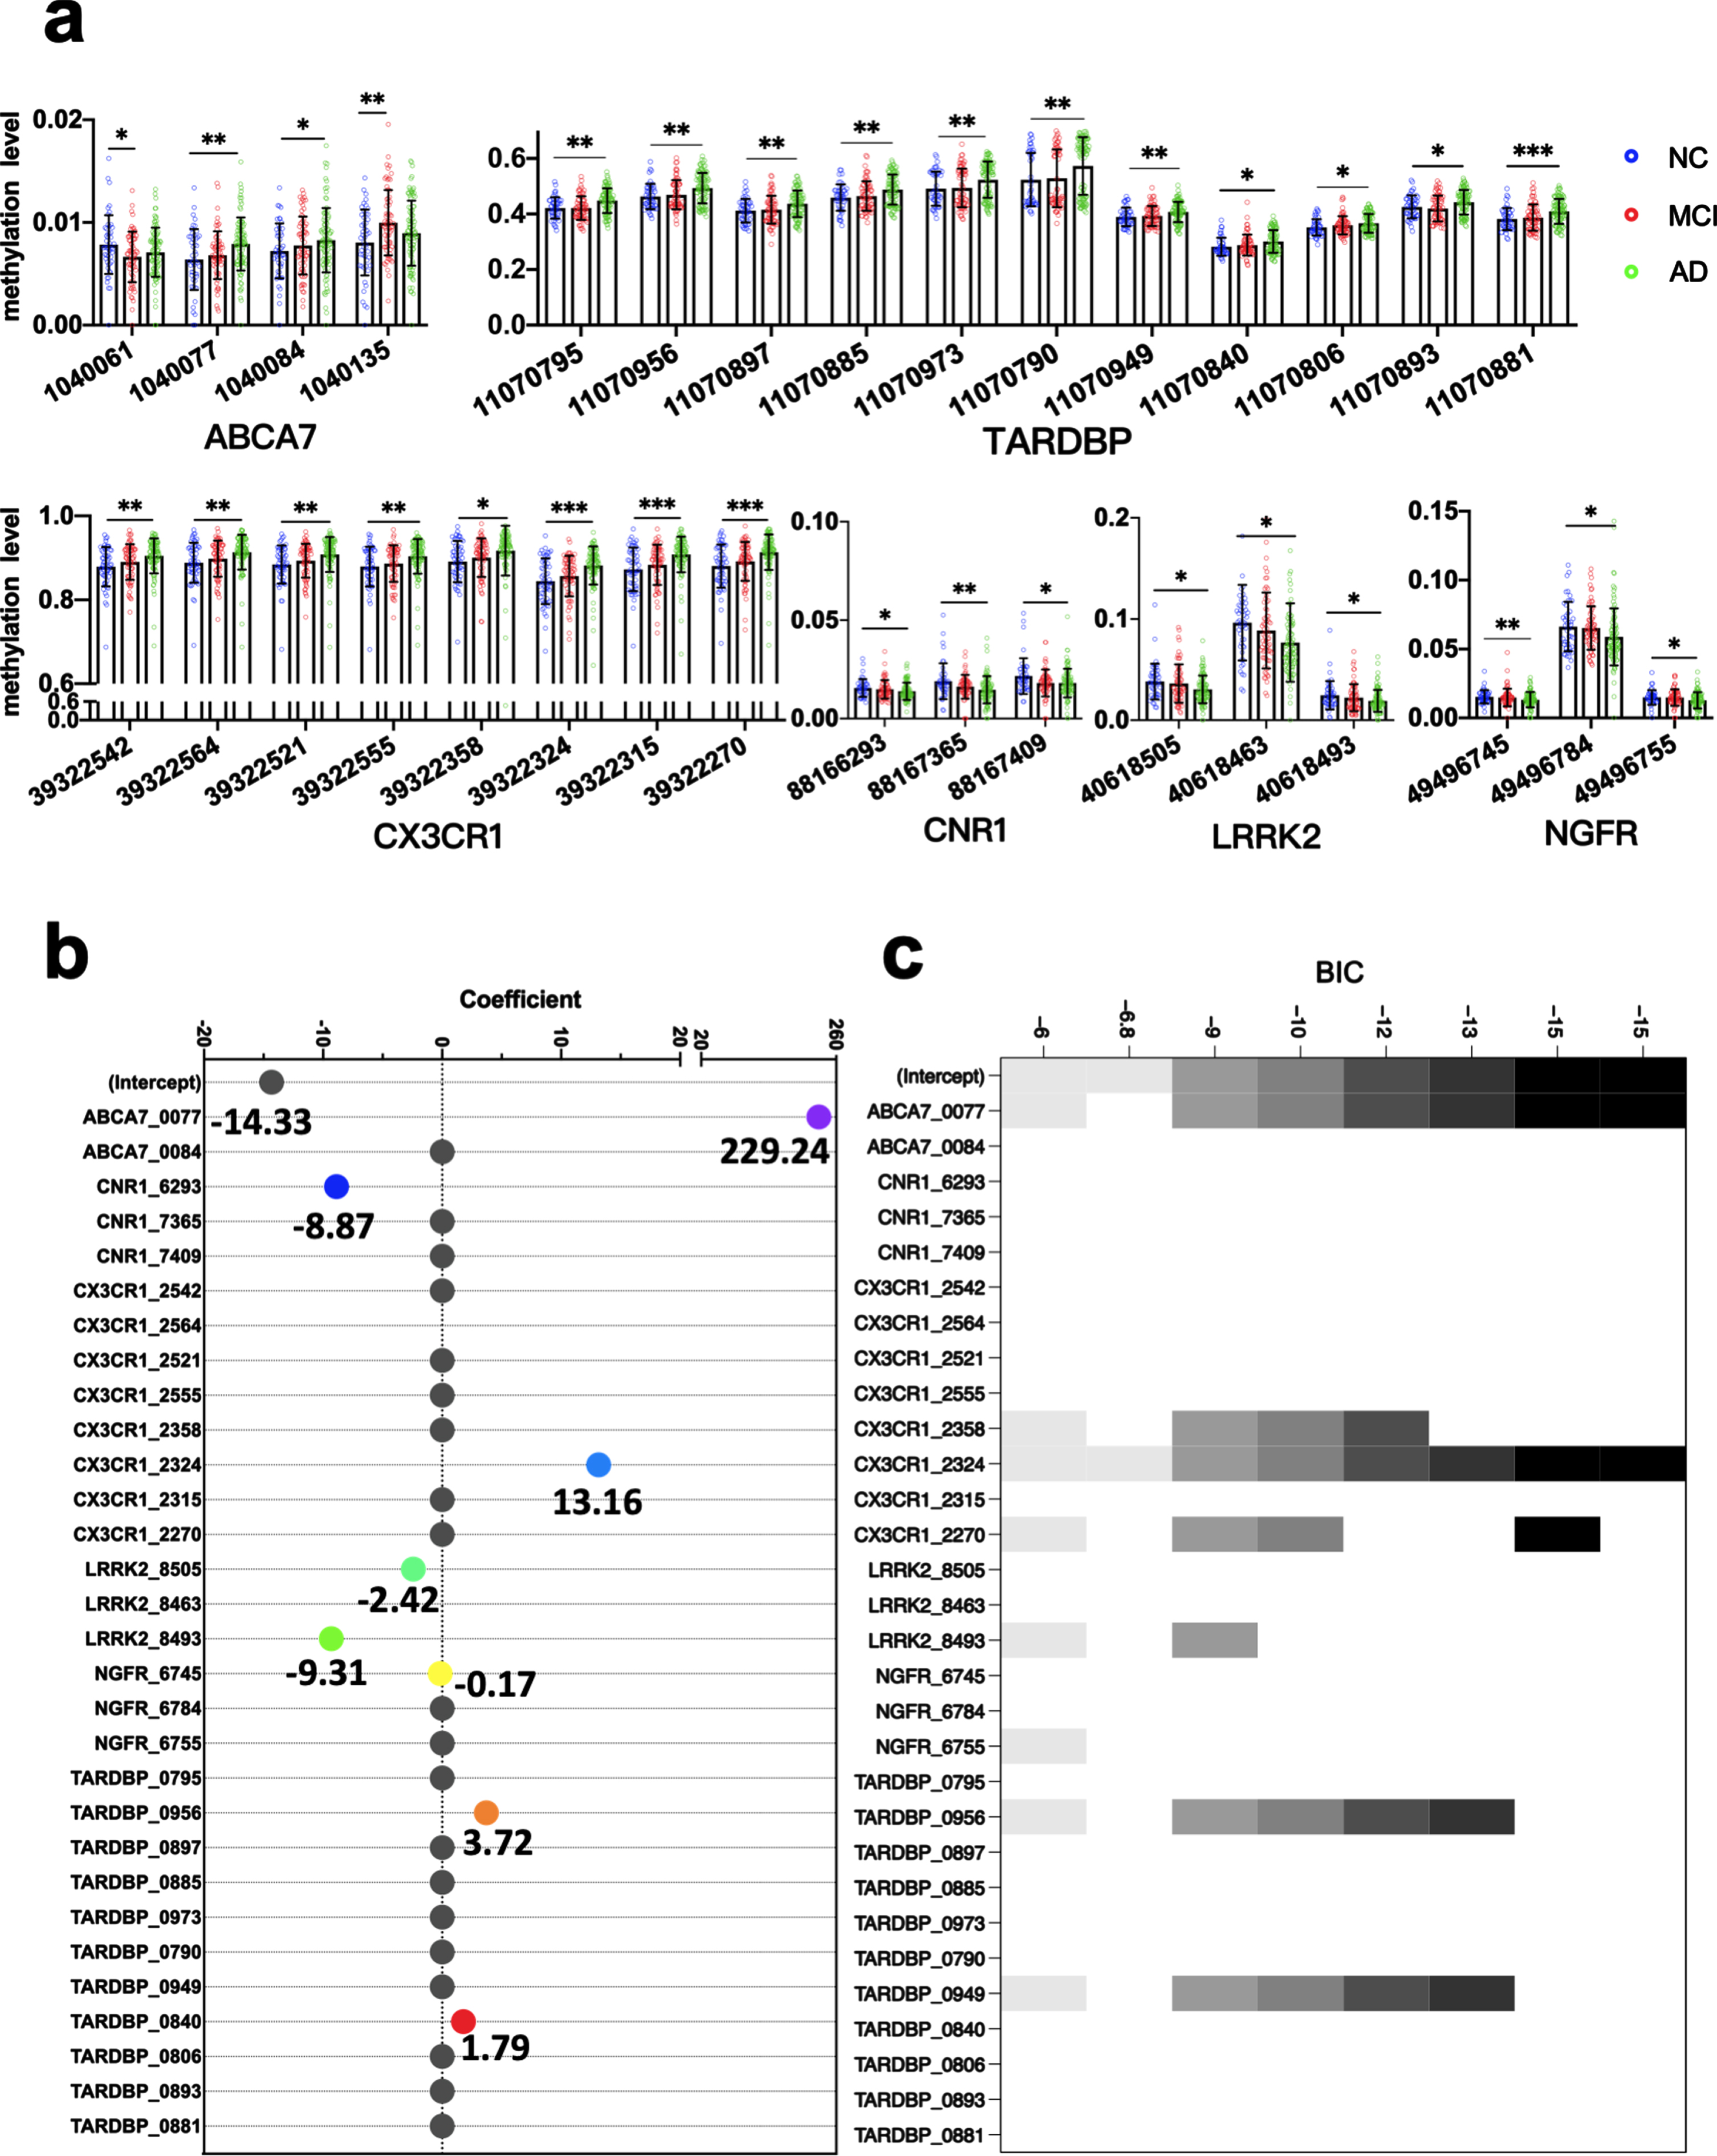
Adjusted for age, sex and APOE4 carriers, there were MCI or AD DMPs in the promoter regions of six genes, including 2 MCI DMPs in ABCA7 and 8 AD DMPs in CX3CR1, 3 AD DMPs in LRRK2, 3 AD DMPs in CNR1, 11 AD DMPs in TARDBP, 3 AD DMPs in NGFR, and 2 AD DMPs in ABCA 7 (Fig. 3a).
Fig. 3
Multifactor analysis and biomarker screening. DMPs related to AD and MCI adjusted for age, sex, and APOE4 carriers (a). Methylation levels of DMPs in the peripheral blood of the NC, MCI and AD: each point represents the methylation level of one CpG site in the gene of a subject. The horizontal and error bars represent the mean±standard deviation. Binary logistic regression analysis was used. *p < 0.05, **p < 0.01, ***p < 0.001. Coefficients of the candidate markers in the Least absolute shrinkage and selection operator (LASSO) (b) and models of candidate markers in the Best Subset Selection (BSS) (c). AD, Alzheimer’s disease; BSS, best subset selection; DMP, differentially methylated locus; LASSO, least absolute shrinkage and selection operator; MCI, mild cognitive impairment; NC, non-cognitively impaired controls. Methylation sites are represented by the last four digits of the genes’ names and location information.
Selection of AD diagnostic model markers
The peripheral blood methylation levels of 30 selected markers that were identified as DMPs independent of age, sex, and APOE4 carriers were further analyzed in a training dataset of 72 patients with AD and 39 NC using the LASSO and BSS methods to reduce the number of markers. We obtained 8 markers in the LASSO analysis, in which markers with the smallest mean square error were selected. The markers comprised the methylation levels at the following sites: ABCA7_1040077, CNR1_88166293, CX3CR1_39322324, LRRK2_40618505, LRRK2_40618493, NGFR_49496745, TARDBP_11070956, and TARDBP_11070840. We obtained two markers in the BSS analysis, in which markers with the smallest Bayesian information criterion were selected. The markers comprised the methylation levels at ABCA7_1040077 and CX3CR1_39322324 (Fig. 3b, c).
Blood methylation prognostic models for the prediction of AD
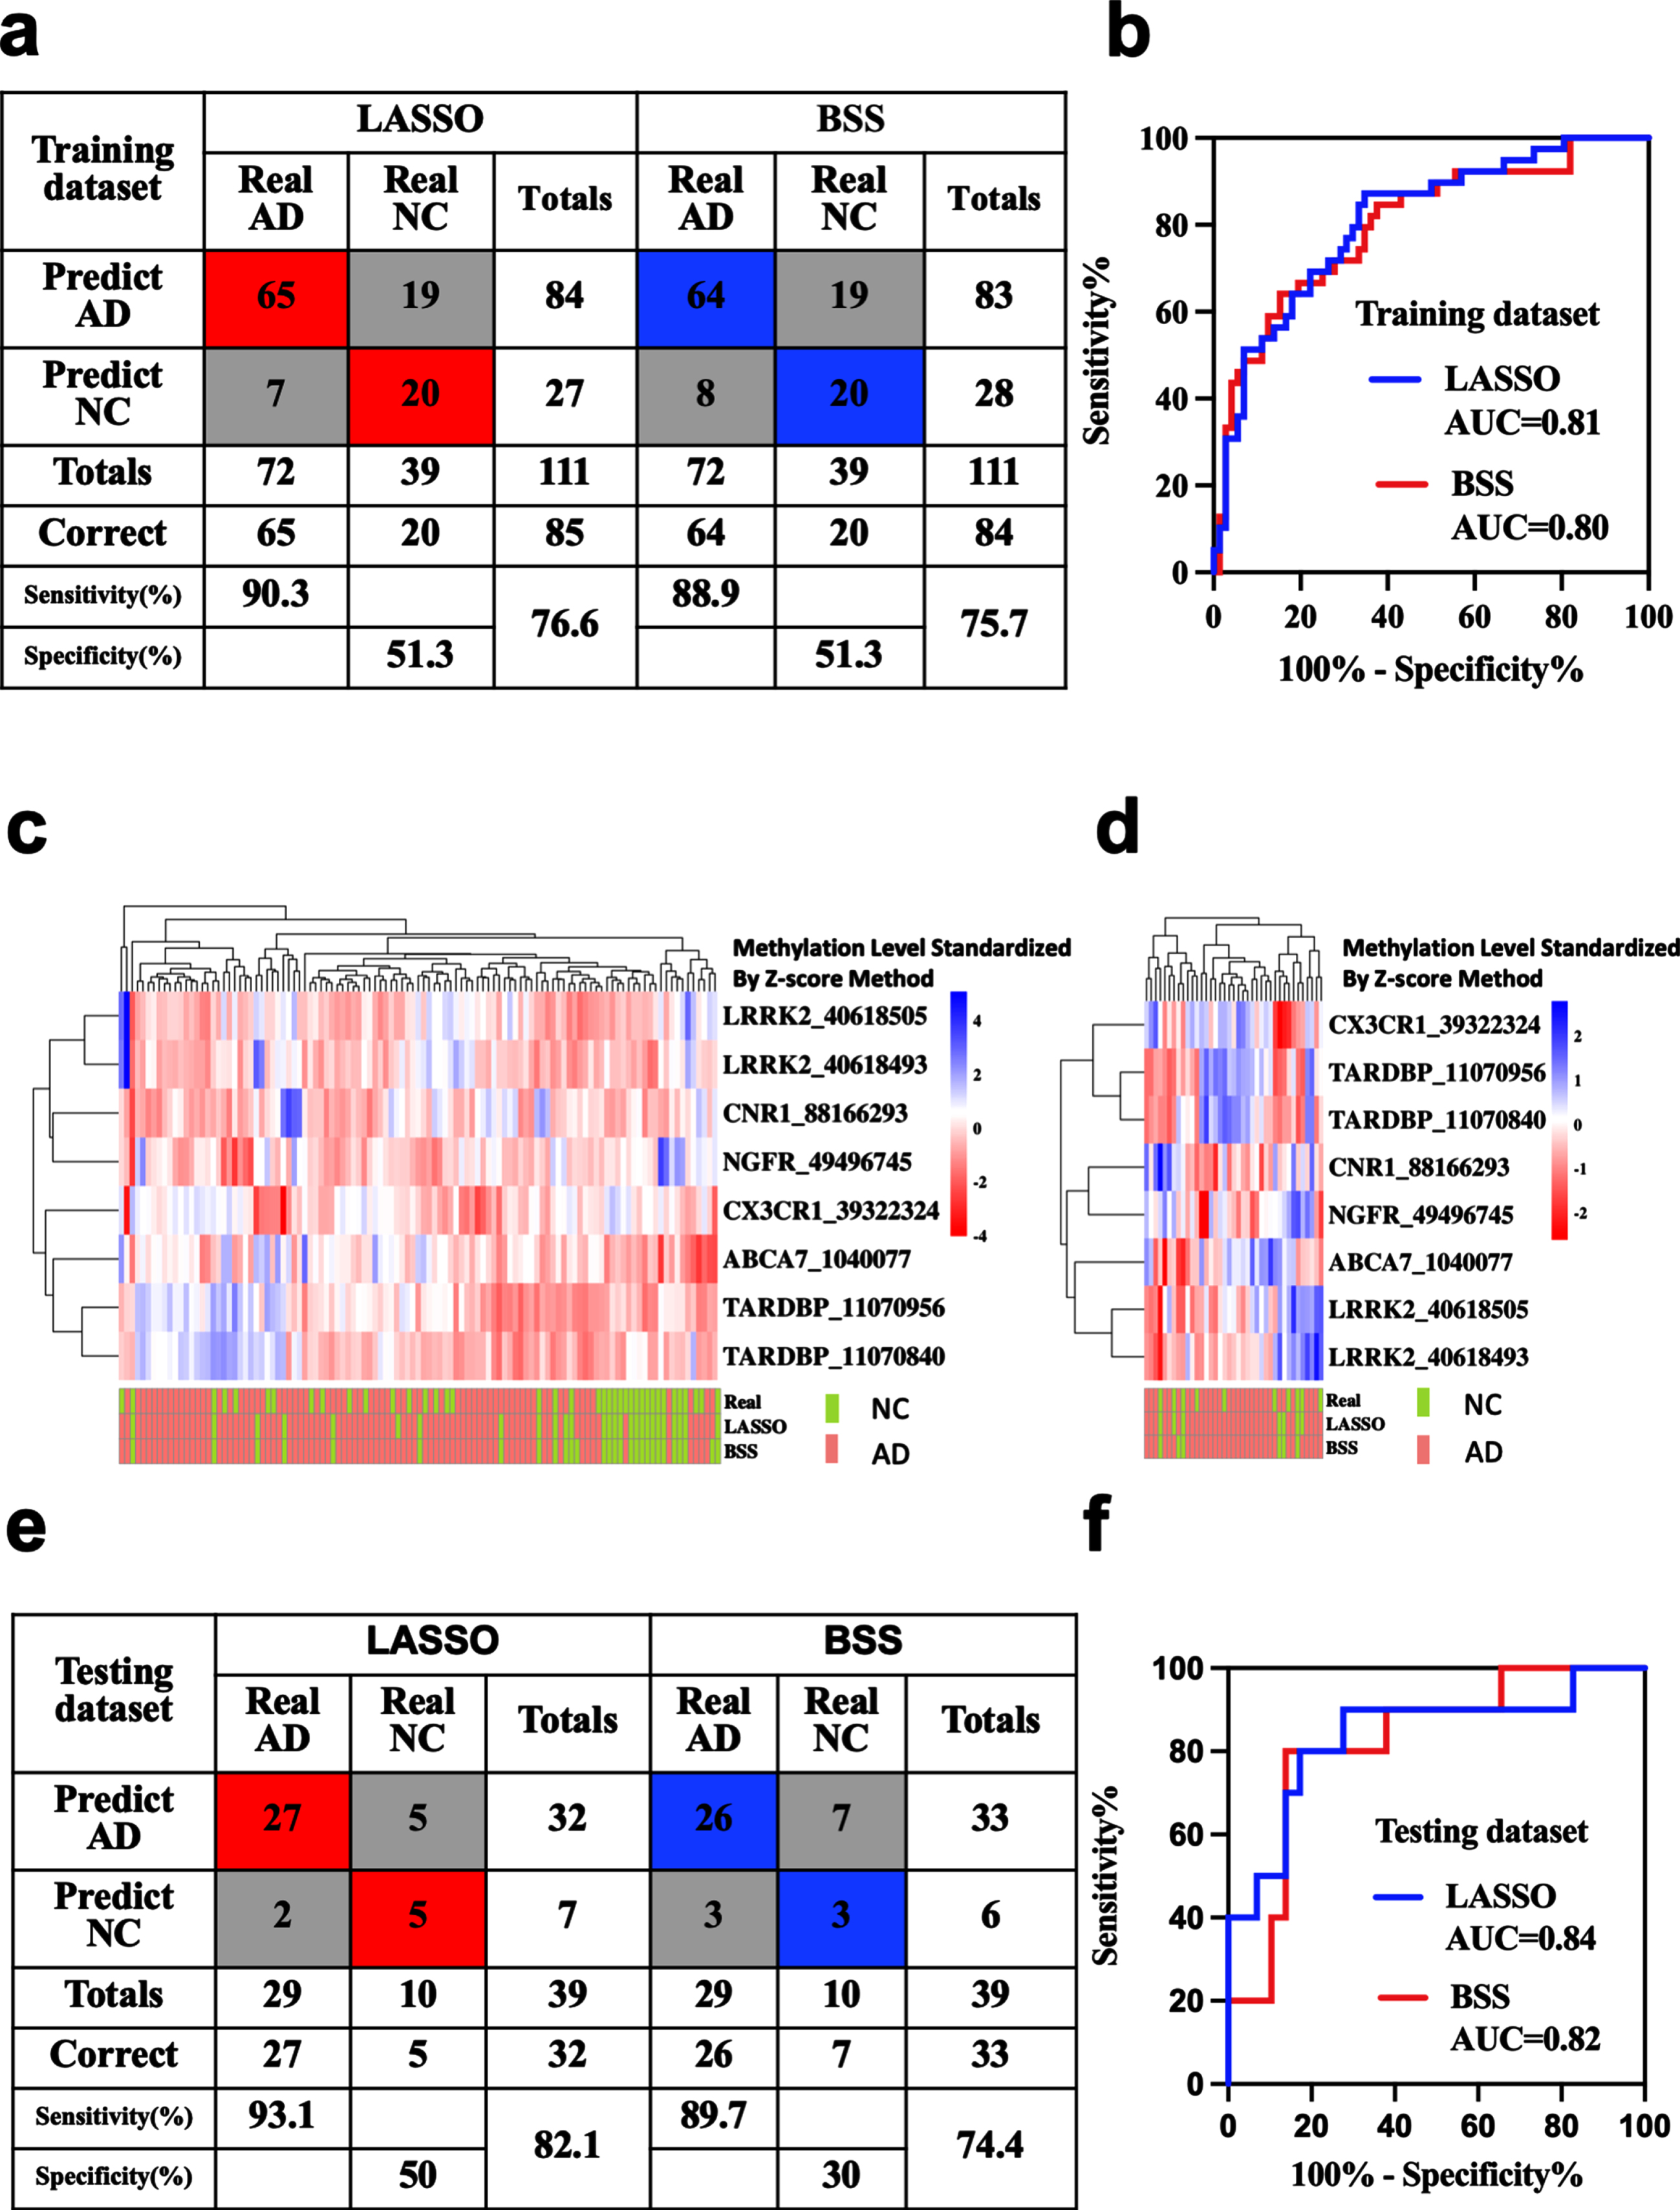
AD diagnostic prediction models were constructed with the 8 markers obtained by LASSO and 2 markers obtained by BSS separately. Applying the model to the training dataset yielded a sensitivity of 90.3% and specificity of 51.3% for AD with the LASSO model, and a sensitivity of 88.9% and specificity of 51.3% with the BSS model (Fig. 4a, c). Applying the model to the testing dataset yielded a sensitivity of 93.1% and specificity of 50% for AD with the LASSO model, and a sensitivity of 89.7% and specificity of 30% with the BSS model (Fig. 4d, e). We also demonstrated that these models could differentiate AD from NC in both the training dataset (LASSO: AUC = 0.81, BSS: AUC = 0.80) and the testing dataset (LASSO: AUC = 0.84, BSS: AUC = 0.82) (Fig. 4b, f).
Fig. 4
Blood methylation prognostic prediction for AD. Confusion tables of binary results of the diagnostic prediction model (a) and ROC of the diagnostic prediction model (b) with methylation markers in the training dataset. Unsupervised hierarchical clustering of nine methylation markers selected for use in the diagnostic prediction models in the training (c) and testing datasets (d). Confusion tables of binary results of the diagnostic prediction models (e) and ROC of the diagnostic prediction models (f) with methylation markers in the testing dataset. AD, Alzheimer’s disease; AUC, area under the roc curve; MCI, mild cognitive impairment; NC, non-cognitively impaired controls; ROC, respondent working curve. Accuracy was applied in the totals of Sensitivity and Specificity.
Prognostic models combined with age, sex, and APOE status
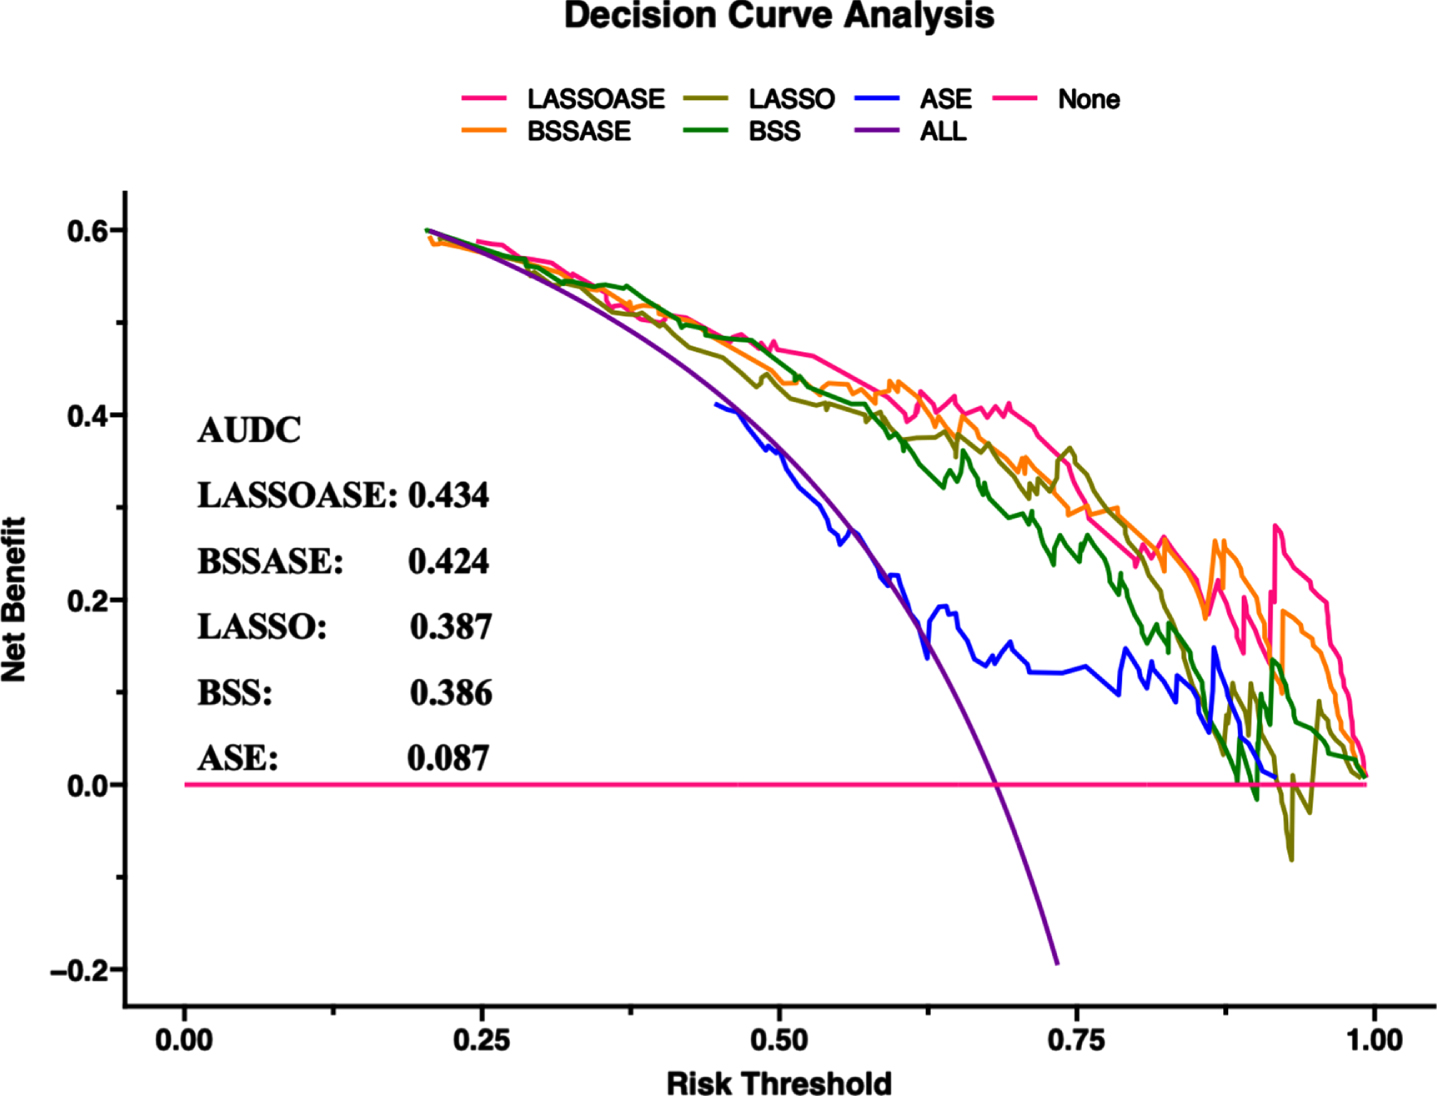
Based on the conversion tables and ROC analysis, the LASSO model was a good choice to further improve diagnostic sensitivity of AD. For a comprehensive economic effect, the BSS model performance was also good. To improve diagnostic model decisions, we built three additional diagnostic models based on the markers of the two models in combination with age, sex, and the presence of APOE4. The benefits of the five evaluated models were compared using DCA. The AUDCs of the models were as follows: 1) LASSO markers with age, sex, APOE: 0.434, 2) BSS markers with age, sex, APOE: 0.424, 3) LASSO markers: 0.387, 4) BSS markers: 0.386, and 5) age, sex, APOE: 0.087 (Fig. 5).
Fig. 5
DCA comparing the benefits of multiple models. Models: LASSOASE: includes methylation level of markers in the LASSO model, age, sex, and APOE; BSSASE: includes methylation level of markers in the BSS model, age, sex, and APOE; LASSO: includes methylation level of 8 markers in the LASSO model; BSS: includes methylation level of 2 markers in the BSS model; ASE: includes age, sex, and APOE. AUDC, area under DCA; BSS, best subset selection; DCA, decision curve analysis; LASSO, Least absolute shrinkage and selection operator.
DISCUSSION
In the present study, we evaluated DNA methylation of seven target immunologic-related genes in peripheral blood. After adjustment by age, sex, and APOE4 carriers, we found that DNA methylation levels in 2 CpG sites in ABCA7 were associated with a diagnosis of MCI, and 30 CpG sites in six genes, including ABCA7, CNR1, CX3CR1, LRRK2, NGFR, and TARDBP were associated with a diagnosis of AD. Our findings further confirm that methylation levels in peripheral blood are associated with AD.
The current study demonstrated that ABCA7_1040077 and ABCA7_10400784 were differentially methylated the peripheral blood of patients with AD and ABCA7_1040061 and ABCA7_1040135 were differentially methylated the peripheral blood of patients with MCI, compared to levels in NC. In contrast, studies by Yamazaki et al. [37] found no significant differences between patients with AD and control patients in methylation rates at each CpG site. Thus, the DMPs found in the present study were not detected in these previous two studies. However, the method used for methyl target sequencing in the present can calculate the methylation level of each CpG site with higher accuracy than pyrosequencing (used by Yamazaki et al.).
Evidence shows that the level of methylation in ABCA7 and BIN1 regions is significantly associated with the burden of AD pathology [38]. Furthermore, another study found that DNA methylation in SORL1, ABCA7, and BIN1 in the brain was associated with pathological AD, this association was robustly retained after replacing the binary trait of pathological AD with Aβ load and paired helical filament tau tangle density [14]. However, methylation changes in brains with neuropathology have not been replicated in CD4 + lymphocytes [21] or in whole blood [39, 40] from the same individuals with AD. Furthermore, genome-wide studies have shown that there is no agreement between the methylation levels of the brain and peripheral blood [21]. More research is needed to verify whether a relationship exists between gene methylation in the brain and peripheral blood.
In addition to previously discovered AD differentially methylated genes in the brain and peripheral blood mentioned above, the present study, by sequencing bisulfite-converted cell-free DNA, identified numerous previously unknown CpG markers differentially methylated in AD versus NC plasma, including DMPs in CNR1, CX3CR1, LRRK2, NGFR, and TARDBP. Our work provides more evidence for identifying methylation biomarkers of AD in the peripheral blood. However, the results may be specific to Chinese populations, and confirmation of methylation differences in these genes in other ethnic populations is needed to employ the identified markers as clinical markers, as described below.
The clinical diagnosis of possible AD is mainly based on detailed medical history data, cognitive and neuropsychological assessments, detection of Aβ and phosphorylated tau protein in cerebrospinal fluid (CSF), Aβ-positron emission tomography (PET) scanning, and examination of pathogenic genes. Generally, when judging patients with dementia or not, these assays show good sensitivity and specificity (>80%), but show limited ability to distinguish AD from other cause of dementia (with a specificity of 23–88%) [2].
Patients with AD undergo pathophysiological changes long before the onset of symptoms. Aβ-PET and tau-PET examinations are helpful for the early diagnosis of AD; however, due to their high cost and particularities of their operation and equipment, these assays are difficult to popularize in clinical settings. Accordingly, it is of far-reaching significance to find new early and sensitive AD diagnostic markers, as this would aid in the early diagnosis of AD and early intervention [41].
By consensus, qualified AD diagnostic markers are required to show sensitivity for diagnosing AD and specificity for distinguishing AD from other dementias of more than 80% [42]. The pathological changes in AD can begin decades before the first clinical symptoms appear [43]. Thus, the present study included patients with MCI to explore the early biomarkers of AD. Unfortunately, it was difficult to distinguish NC and patients with MCI by the level of methylation in the genes we targeted.
LASSO regression was used to distinguish the most characteristic DMPs and eliminate collinearity in the DMPs among those identified in the present study. Subsequently, the result was exploited to establish a logistic regression model for diagnosing AD. The sensitivity of the model was 90.3% in the training dataset and 88.9% in the testing dataset. To simplify the model, the best subset selection (BSS) was included for dimensionality reduction. The sensitivity of the AD logistic regression models of the two DMPs established by the BSS was 93.1% in the training dataset and 89.7% in the testing dataset. Thus, all sensitivities meet the standard of 80%. From the perspective of economic benefits, it would be better to choose the differential methylation combination determined by the BSS method.
DCA was used to assist in the model selection decision. Comparing the AUDCs of various models, as expected, the model including the methylation level of markers established by LASSO regression, age, sex, and APOE4 carriers was the best among the five evaluated models. However, it is worth noting that the model including the BSS markers, age, sex, and APOE status performed better than the simple model comprising only LASSO markers. These results were also observed in the validation dataset. Therefore, in making clinical decisions, it may be useful to include only two indicators, ABCA7_1040077 and CX3CR1_39322324, combined with age, sex, and APOE4 carriers to predict AD risk, considering the diagnostic sensitivity and cost savings.
The present research has several valuable strengths. Firstly, it focused on exploring findings in three separate clinical cohorts and used unselected, routinely archived clinical samples. Additionally, the differences in DNA methylation of immune-related genes’ promoter in peripheral blood were compared among three cohorts, and two diagnostic models of AD were constructed.
This study is limited by the lack of clinical follow-up, making it difficult to assess the predictive ability of methylation marker diagnostic models for dynamic prediction of AD disease. And although we found alterations in the methylation levels of several immune-related genes in the peripheral blood of AD patients, more in-depth research is needed to confirm how methylation participates in AD’s immune mechanisms. In addition, our subjects were only able to meet the clinical diagnostic criteria for AD without brain amyloid PET or CSF AD biomarkers, with no supporting evidence of pathology. Finally, it is worth noting that although our data show that the AD diagnostic model based on the methylation level of immune-related genes has good sensitivity, its specificity is not ideal, which may lead to misdiagnosis of patients without cognitive impairment. The clinical sample set is small, and the lack of replication by an independent study, limits its application to various clinical backgrounds.
In summary, the methylation levels of ABCA7, CNR1, CX3CR1, LRRK2, NGFR, and TARDBP in peripheral blood are altered in patients with MCI and AD. Furthermore, the inclusion of the methylation levels of immunologic-related gene biomarkers improves the prediction of AD from NC.
ACKNOWLEDGMENTS
The authors thank this research participants for their generosity and hard work. This work was supported by the National Natural Science Foundation of China (No.82071175, No.81771179); the National Key Research and Development Program of China (2019YFC0118201); the Natural Science Foundation (Key Project) of Fujian Province, China (No. 2020J02022); the Startup Fund for scientific research from Fujian Medical University (No. 2020QH2018).
Authors’ disclosures available online (https://www.j-alz.com/manuscript-disclosures/22-0701r1).
REFERENCES
[1] | Joe E , Ringman JM ((2019) ) Cognitive symptoms of Alzheimer’s disease: clinical management and prevention. BMJ 367: , 6217. |
[2] | Scheltens P , Blennow K , Breteler MMB , de Strooper B , Frisoni GB , Salloway S , Van der Flier WM ((2016) ) Alzheimer’s disease. Lancet 388: , 505–517. |
[3] | Selkoe DJ , Hardy J ((2016) ) The amyloid hypothesis of Alzheimer’s disease at 25 years. EMBO Mol Med 8: , 595–608. |
[4] | Gatz M , Pedersen NL , Berg S , Johansson B , Johansson K , Mortimer JA , Posner SF , Viitanen M , Winblad B , Ahlbom A ((1997) ) Heritability for Alzheimer’s disease: the study of dementia in Swedish twins. J Gerontol A Biol Sci Med Sci 52: , M117–125. |
[5] | Seshadri S , Fitzpatrick AL , Ikram MA , DeStefano AL , Gudnason V , Boada M , Bis JC , Smith AV , Carassquillo MM , Lambert JC , Harold D , Schrijvers EMC , Ramirez-Lorca R , Debette S , Longstreth WT , Janssens ACJW , Pankratz VS , Dartigues JF , Hollingworth P , Aspelund T , Hernandez I , Beiser A , Kuller LH , Koudstaal PJ , Dickson DW , Tzourio C , Abraham R , Antunez C , Du Y , Rotter JI , Aulchenko YS , Harris TB , Petersen RC , Berr C , Owen MJ , Lopez-Arrieta J , Varadarajan BN , Becker JT , Rivadeneira F , Nalls MA , Graff-Radford NR , Campion D , Auerbach S , Rice K , Hofman A , Jonsson PV , Schmidt H , Lathrop M , Mosley TH , Au R , Psaty BM , Uitterlinden AG , Farrer LA , Lumley T , Ruiz A , Williams J , Amouyel P , Younkin SG , Wolf PA , Launer LJ , Lopez OL , van Duijn CM , Breteler MMB ((2010) ) Genome-wide analysis of genetic loci associated with Alzheimer disease. JAMA 303: , 1832–1840. |
[6] | Wu K-M , Zhang Y-R , Huang Y-Y , Dong Q , Tan L , Yu J-T ((2021) ) The role of the immune system in Alzheimer’s disease. Ageing Res Rev 70: , 101409. |
[7] | Fuhrmann M , Bittner T , Jung CKE , Burgold S , Page RM , Mitteregger G , Haass C , LaFerla FM , Kretzschmar H , Herms J ((2010) ) Microglial Cx3cr1 knockout prevents neuron loss in a mouse model of Alzheimer’s disease. Nat Neurosci 13: , 411–413. |
[8] | Yi C , Goh KY , Wong L-W , Ramanujan A , Tanaka K , Sajikumar S , Ibañez CF ((2021) ) Inactive variants of death receptor p75 reduce Alzheimer’s neuropathology by interfering with APP internalization. EMBO J 40: , e104450. |
[9] | Linnertz C , Lutz MW , Ervin JF , Allen J , Miller NR , Welsh-Bohmer KA , Roses AD , Chiba-Falek O ((2014) ) The genetic contributions of SNCA and LRRK2 genes to Lewy Body pathology in Alzheimer’s disease. Hum Mol Genet 23: , 4814–4821. |
[10] | Sims R , Hill M , Williams J ((2020) ) The multiplex model of the genetics of Alzheimer’s disease. Nat Neurosci 23: , 311–322. |
[11] | Wang S-C , Oelze B , Schumacher A ((2008) ) Age-specific epigenetic drift in late-onset Alzheimer’s disease. PloS One 3: , e2698. |
[12] | Liu Y , Aryee MJ , Padyukov L , Fallin MD , Hesselberg E , Runarsson A , Reinius L , Acevedo N , Taub M , Ronninger M , Shchetynsky K , Scheynius A , Kere J , Alfredsson L , Klareskog L , Ekström TJ , Feinberg AP ((2013) ) Epigenome-wide association data implicate DNA methylation as an intermediary of genetic risk in rheumatoid arthritis. Nat Biotechnol 31: , 142–147. |
[13] | Bakulski KM , Dolinoy DC , Sartor MA , Paulson HL , Konen JR , Lieberman AP , Albin RL , Hu H , Rozek LS ((2012) ) Genome-wide DNA methylation differences between late-onset Alzheimer’s disease and cognitively normal controls in human frontal cortex. J Alzheimers Dis 29: , 571–588. |
[14] | Yu L , Chibnik LB , Srivastava GP , Pochet N , Yang J , Xu J , Kozubek J , Obholzer N , Leurgans SE , Schneider JA , Meissner A , De Jager PL , Bennett DA ((2015) ) Association of Brain DNA methylation in SORL1, ABCA7, HLA-DRB5, SLC24A4, and BIN1 with pathological diagnosis of Alzheimer disease. JAMA Neurol 72: , 15–24. |
[15] | Fransquet PD , Lacaze P , Saffery R , McNeil J , Woods R , Ryan J ((2018) ) Blood DNA methylation as a potential biomarker of dementia: A systematic review. Alzheimers Dement 14: , 81–103. |
[16] | Hu H , Tan L , Bi YL , Xu W , Tan L , Shen XN , Hou XH , Ma YH , Dong Q , Yu JT ((2021) ) Association between methylation of BIN1 promoter in peripheral blood and preclinical Alzheimer’s disease. Transl Psychiatry 11: , 89. |
[17] | Chen Y , Li TR , Hao SW , Wang XN , Cai YN , Han Y ((2021) ) Blood NCAPH2 methylation is associated with hippocampal volume in subjective cognitive decline with apolipoprotein E epsilon4 non-carriers. Front Aging Neurosci 13: , 632382. |
[18] | Kobayashi N , Shinagawa S , Nagata T , Shimada K , Shibata N , Ohnuma T , Kasanuki K , Arai H , Yamada H , Nakayama K , Kondo K ((2016) ) Usefulness of DNA methylation levels in COASY and SPINT1 gene promoter regions as biomarkers in diagnosis of Alzheimer’s disease and amnestic mild cognitive impairment. PLoS One 11: , e0168816. |
[19] | Tannorella P , Stoccoro A , Tognoni G , Petrozzi L , Salluzzo MG , Ragalmuto A , Siciliano G , Haslberger A , Bosco P , Bonuccelli U , Migliore L , Coppedè F ((2015) ) Methylation analysis of multiplegenes in blood DNA of Alzheimer’s disease and healthy individuals. Neurosci Lett 600: , 143–147. |
[20] | Konki M , Malonzo M , Karlsson IK , Lindgren N , Ghimire B , Smolander J , Scheinin NM , Ollikainen M , Laiho A , Elo LL , Lonnberg T , Roytta M , Pedersen NL , Kaprio J , Lahdesmaki H , Rinne JO , Lund RJ ((2019) ) Peripheral blood DNA methylation differences in twin pairs discordant for Alzheimer’s disease. Clin Epigenetics 11: , 130. |
[21] | Yu L , Chibnik LB , Yang J , McCabe C , Xu J , Schneider JA , De Jager PL , Bennett DA ((2016) ) Methylation profiles in peripheral blood CD4+lymphocytes versus brain: The relation to Alzheimer’s diseaseathology. Alzheimers Dement 12: , 942–951. |
[22] | Aikawa T , Holm M-L , Kanekiyo T ((2018) ) ABCA7 and pathogenic pathways of Alzheimer’s disease. Brain Sci 8: , 27. |
[23] | Satoh K , Abe-Dohmae S , Yokoyama S , St George-Hyslop P , Fraser PE ((2015) ) ATP-binding cassette transporter A7 (ABCA7) loss of function alters Alzheimer amyloid processing. J Biol Chem 290: , 24152–24165. |
[24] | Xu J , Zhang P , Huang Y , Zhou Y , Hou Y , Bekris LM , Lathia J , Chiang C-W , Li L , Pieper AA , Leverenz JB , Cummings J , Cheng F ((2021) ) Multimodal single-cell/nucleus RNA sequencing data analysis uncovers molecular networks between disease-associated microglia and astrocytes with implications for drug repurposing in Alzheimer’s disease. Genome Res 31: , 1900–1912. |
[25] | Paolicelli RC , Jawaid A , Henstridge CM , Valeri A , Merlini M , Robinson JL , Lee EB , Rose J , Appel S , Lee VMY , Trojanowski JQ , Spires-Jones T , Schulz PE , Rajendran L ((2017) ) TDP-43 depletion in microglia promotes amyloid clearance but also induces synapse loss. Neuron 95: , 297–308. |
[26] | Rabizadeh S , Bitler CM , Butcher LL , Bredesen DE ((1994) ) Expression of the low-affinity nerve growth factor receptor enhances beta-amyloid peptide toxicity. Proc Natl Acad Sci U S A 91: , 10703–10706. |
[27] | Yaar M , Zhai S , Pilch PF , Doyle SM , Eisenhauer PB , Fine RE , Gilchrest BA ((1997) ) Binding of beta-amyloid to the p75 neurotrophin receptor induces apoptosis. A possible mechanism for Alzheimer’s disease. J Clin Invest 100: , 2333–2340. |
[28] | Perini G , Della-Bianca V , Politi V , Della Valle G , Dal-Pra I , Rossi F , Armato U ((2002) ) Role of p75 neurotrophin receptor in the neurotoxicity by beta-amyloid peptides and synergistic effect of inflammatory cytokines. J Exp Med 195: , 907–918. |
[29] | Subbarayan MS , Joly-Amado A , Bickford PC , Nash KR ((2021) ) CX3CL1/CX3CR1 signaling targets for the treatment of neurodegenerative diseases. Pharmacol Ther 231: , 107989. |
[30] | Mancuso R , Fryatt G , Cleal M , Obst J , Pipi E , Monzón-Sandoval J , Ribe E , Winchester L , Webber C , Nevado A , Jacobs T , Austin N , Theunis C , Grauwen K , Daniela Ruiz E , Mudher A , Vicente-Rodriguez M , Parker CA , Simmons C , Cash D , Richardson J , Jones DNC , Lovestone S , Gómez-Nicola D , Perry VH ((2019) ) CSF1R inhibitor JNJ-40346527 attenuates microglial proliferation and neurodegeneration in P301S mice. Brain 142: , 3243–3264. |
[31] | Guerreiro PS , Gerhardt E , Lopes da Fonseca T , Bähr M , Outeiro TF , Eckermann K ((2016) ) LRRK2 promotes tau accumulation, aggregation and release. Mol Neurobiol 53: , 3124–3135. |
[32] | Albert MS , DeKosky ST , Dickson D , Dubois B , Feldman HH , Fox NC , Gamst A , Holtzman DM , Jagust WJ , Petersen RC , Snyder PJ , Carrillo MC , Thies B , Phelps CH ((2011) ) The diagnosis of mild cognitive impairment due to Alzheimer’s disease: recommendations from the National Institute on Aging-Alzheimer’s Association workgroups on diagnostic guidelines for Alzheimer’s disease. Alzheimers Dement 7: , 270–279. |
[33] | Petersen RC ((2004) ) Mild cognitive impairment as a diagnostic entity. J Intern Med 256: , 183–194. |
[34] | Ashktorab H , Daremipouran M , Goel A , Varma S , Leavitt R , Sun X , Brim H ((2014) ) DNA methylome profiling identifies novel methylated genes in African American patients with colorectal neoplasia. Epigenetics 9: , 503–512. |
[35] | Wilmot B , Fry R , Smeester L , Musser ED , Mill J , Nigg JT ((2016) ) Methylomic analysis of salivary DNA in childhood ADHD identifies altered DNA methylation in VIPR2. J Child Psychol Psychiatry 57: , 152–160. |
[36] | Masser DR , Berg AS , Freeman WM ((2013) ) Focused, high accuracy 5-methylcytosine quantitation with base resolution by benchtop next-generation sequencing. Epigenetics Chromatin 6: , 33. |
[37] | Yamazaki K , Yoshino Y , Mori T , Yoshida T , Ozaki Y , Sao T , Mori Y , Ochi S , Iga JI , Ueno SI ((2017) ) Gene expression and methylation analysis of ABCA7 in patients with Alzheimer’s disease. J Alzheimers Dis 57: , 171–181. |
[38] | De Jager PL , Srivastava G , Lunnon K , Burgess J , Schalkwyk LC , Yu L , Eaton ML , Keenan BT , Ernst J , McCabe C , Tang A , Raj T , Replogle J , Brodeur W , Gabriel S , Chai HS , Younkin C , Younkin SG , Zou F , Szyf M , Epstein CB , Schneider JA , Bernstein BE , Meissner A , Ertekin-Taner N , Chibnik LB , Kellis M , Mill J , Bennett DA ((2014) ) Alzheimer’s disease: early alterations in brain DNA methylation at ANK1, BIN1, RHBDF2 and other loci. Nat Neurosci 17: , 1156–1163. |
[39] | Lunnon K , Smith R , Hannon E , De Jager PL , Srivastava G , Volta M , Troakes C , Al-Sarraj S , Burrage J , Macdonald R , Condliffe D , Harries LW , Katsel P , Haroutunian V , Kaminsky Z , Joachim C , Powell J , Lovestone S , Bennett DA , Schalkwyk LC , Mill J ((2014) ) Methylomic profiling implicates cortical deregulation of ANK1 in Alzheimer’s disease. Nat Neurosci 17: , 1164–1170. |
[40] | Smith RG , Hannon E , De Jager PL , Chibnik L , Lott SJ , Condliffe D , Smith AR , Haroutunian V , Troakes C , Al-Sarraj S , Bennett DA , Powell J , Lovestone S , Schalkwyk L , Mill J , Lunnon K ((2018) ) Elevated DNA methylation across a 48-kb regionspanning the HOXA gene cluster is associated with Alzheimer’sdisease neuropathology. Alzheimers Dement 14: , 1580–1588. |
[41] | The L ((2016) ) Alzheimer’s disease: expedition into the unknown. Lancet 388: , 2713. |
[42] | ((1998) ) Consensus report of the Working Group on: “Molecular and Biochemical Markers of Alzheimer’s Disease”. The Ronald and Nancy Reagan Research Institute of the Alzheimer’s Association and the National Institute on Aging Working Group. Neurobiol Aging 19: , 109–116. |
[43] | Dubois B , Hampel H , Feldman HH , Scheltens P , Aisen P , Andrieu S , Bakardjian H , Benali H , Bertram L , Blennow K , Broich K , Cavedo E , Crutch S , Dartigues J-F , Duyckaerts C , Epelbaum S , Frisoni GB , Gauthier S , Genthon R , Gouw AA , Habert M-O , Holtzman DM , Kivipelto M , Lista S , Molinuevo J-L , O’Bryant SE , Rabinovici GD , Rowe C , Salloway S , Schneider LS , Sperling R , Teichmann M , Carrillo MC , Cummings J , Jack CR ((2016) ) Preclinical Alzheimer’s disease: Definition, natural history, and diagnostic criteria. Alzheimers Dement 12: , 292–323. |


