
Improved Alzheimer’s Disease versus Frontotemporal Lobar Degeneration Differential Diagnosis Combining EEG and Neurochemical Biomarkers: A Pilot Study
Abstract
Background:
Distinguishing between Alzheimer’s disease (AD) and frontotemporal lobar degeneration (FTLD) results in poor diagnostic accuracy.
Objective:
To investigate the utility of electroencephalography (EEG)-based biomarkers in comparison and in addition to established cerebrospinal fluid (CSF) biomarkers in the AD versus FTLD differential diagnosis.
Methods:
The study cohort comprised 37 AD and 30 FTLD patients, of which 17 AD and 9 FTLD patients had definite diagnoses. All participants had CSF neurochemical (NCM) biomarker analyses (Aβ1-42, T-tau, P-tau181, and Nf-L) and underwent 19-channel resting-state EEG. From the EEG spectra, dominant frequency peaks were extracted in four regions resulting in four dominant frequencies. This produced eight features (4 NCM + 4 EEG).
Results:
When NCM and EEG markers were combined, the diagnostic accuracy increased significantly. In the whole group, the accuracy went up from 79% (NCM) to almost 82%, while in the definite group only, it went up from around 85% to almost 95%. Two differences in the occurrence of the dominant EEG frequency were discovered: people lacking a clear dominant peak almost all had definite AD, while people with two peaks more often had FTLD.
Conclusion:
Combining EEG with NCM biomarkers resulted in differential diagnostic accuracies of 82% in clinically diagnosed AD and FTD patients and of 95% in patients having a definite diagnosis, which was significantly better than with EEG or NCM biomarkers alone. This suggests that NCM and EEG markers are complementary, revealing different aspects of the disease and therefore confirms again their relevance in developing additional diagnosis tools.
INTRODUCTION
The differential diagnosis between two of the most common causes of dementia— namely Alzheimer’s disease (AD) and frontotemporal lobar degeneration (FTLD)— is difficult, mainly due to overlap in clinical presentation, especially in the early disease stages [1, 2].
A promising tool to increase the diagnostic accuracy of AD is the use of cerebrospinal fluid (CSF) biomarkers [3]. During the past decades, biomarker-based research diagnostic criteria, also for its prodromal stage of mild cognitive impairment (MCI) due to AD, have been published [4–6]. Analysis of the core AD CSF biomarkers (amyloid-β peptide composed of 42 amino acids (Aβ1-42), the Aβ1-42/Aβ1-40 ratio, total tau protein (T-tau), and phosphorylated tau at threonine 181 (P-tau181)) can help to differentiate between AD and non-AD dementias like FTLD, but they cannot be used to confirm a non-AD dementia [3]. CSF P-tau181 is a more specific marker for AD and is of help for AD versus non-AD dementia differential diagnosis [7]. However, in order to improve the discriminatory power for the differential diagnosis of dementia, additional markers, more specific to the non-AD dementia are valuable. As CSF levels of neurofilament light chain (Nf-L) were significantly higher in FTLD compared to AD and controls, there is an added value for Nf-L in the differential diagnosis of FTLD [8].
Electroencephalography (EEG) is an easily accessible, non-invasive, inexpensive technique capable of picking up functional changes in the brain, and is already being investigated as an adjunctive investigation in dementia [9]. EEG can be used to investigate the disruption of brain connectivity that results of neurodegeneration. Trained neurologists use visual analysis of EEG to support clinical dementia diagnosis, but this is a subjective measure and therefore difficult to reproduce. To objectively assess EEG recordings and pick up more subtle differences, quantification of EEG characteristics is needed. We have previously shown that EEG maxpeak frequency is an easy and useful measure with an added value in the differentiation between AD and FTLD, reaching a diagnostic accuracy of 78.4% [10].
In this pilot study, we investigated the utility of EEG-based biomarkers in comparison and in addition to established neurochemical biomarkers in the AD versus FTLD differential diagnosis.
METHODS
Study participants
The study cohort comprised 37 subjects with probable (n = 20) or definite (n = 17) dementia due to AD, and 30 patients with probable (n = 21) or definite (n = 9) FTLD (Table 1). Patients were selected from the Memory Clinic of Hospital Network Antwerp [11, 12]. To ensure a high certainty level of dementia subtypes for patients without definite diagnosis, only patients with extensive clinical follow-up were included. All patients underwent (among others) neuropsychological testing including Mini-Mental State Examination (MMSE), and core AD CSF biomarker analyses (Aβ1-42, T-tau, P-tau181) [13]. Clinical diagnosis of probable AD was based on NIA-AA [6] and IWG-2 criteria [5] and included these biomarkers. Diagnosis of probable FTLD was based on criteria described by Neary [14]. The FTLD cohort consisted of subjects with semantic dementia (n = 1), progressive nonfluent aphasia (n = 1), and frontotemporal dementia (n = 28). Subgroups of definite dementia patients were defined by causal gene mutation carrier status and/or follow-up till death and postmortem confirmation of brain pathology [15–17]. This study was approved by the ethics committee of University of Antwerp (Antwerp, Belgium).
Table 1
Demographic data and APOE genotype data of the different patient groups (NS, not statistically significant)
| Group | AD | FTLD | p | |
| Complete | Number of patients | 37 | 30 | |
| Age –±SD (y) | 74.1±10.0 | 67.9±8.8 | 0.0098 | |
| Male | 17 | 20 | NS | |
| APOE ɛ4 carriers | 49% | 28% | NS | |
| Definite | Number of patients | 17 | 9 | |
| Age±SD (y) | 77.1±10.3 | 63.5±8.1 | 0.0022 | |
| Male | 11 | 7 | NS | |
| APOE ɛ4 carriers | 53% | 36% | NS |
Neurochemical (NCM) biomarkers
Lumbar puncture and CSF sampling and handling was performed according to a standardized protocol [13, 18]. All CSF samples were stored at the IBB Biobank in polypropylene vials at –80°C until analysis.
CSF biomarker levels were quantified using commercially available single-analyte ELISA kits (one kit lot each), strictly following the manufacturer’s instructions (INNOTEST β-Amyloid(1–42), INNOTEST hTau-Ag and INNOTEST Phospho-Tau(181P) from Fujirebio Europe; and Nf-L from UmanDiagnostics). All samples were run in duplicate, blinded for diagnosis. Intra-assay coefficient of variation was below 10% for all analytes.
Electroencephalographic (EEG) markers
EEG recordings
EEG data were recorded using OSG digital equipment (BrainLab/BrainRT) with the international 10–20 system used for electrode placement. ECG was recorded in a separate channel. Recordings were exported in EEGLab format [19] for offline analysis and each file contained continuous data in 19 channels. During recording, subjects were seated upright and were asked to alternate between eyes closed and eyes open to stay awake. EEG data was processed manually using BrainRT. Artefact-free EEG during the eyes-closed condition was flagged. This flag consisted of start latency of the useable part and its duration, both in milliseconds. No epileptiform activity was observed in any of the EEG recordings. The EEGs were re-referenced to average.
Epoch extraction
The EEGs were then imported into our group’s Channel Analysis Toolbox (CAT, https://gitlab.com/AIMS/aims-public) for further processing and analysis. In our previous study on this dataset [10], we extracted two-second epochs. This proved to be too coarse to detect smaller frequency differences. Therefore, we doubled the epoch length to 4-s epochs from each EEG and selected six epochs (the minimum over all patients) equally spread over all available epochs of that patient. This epoch length ensured retaining most of the artefact-free signal, while also allowing a spectral resolution of 0.25 Hz. We did not increase the epoch length further, as this started to increase loss of artefact-free EEG. With longer epochs, chances increase that certain continuous parts of clean EEG are not long enough to contain a number of epochs that accounts for the same total time.
Transformation to frequency spectrum
We used Welch’s power spectral density estimate [20]. In Matlab [21], this method is implemented with integrated support for windowing and based on the built-in fft (Fast Fourier Transform). Instead of computing the spectrum on each epoch separately, we concatenated the epochs back into a ‘continuous’ signal. We aligned the windowing exactly with the epoch boundaries, by using a Hamming window with a length equal to the epoch length and the overlap between windows equal to zero. This resulted in a smooth, average spectrum with much smaller roll-off than a rectangular window.
To increase the resolution, we padded the epochs with zeroes, by setting the nfft parameter of Matlab’s built-in pwelch function to a multiple of the epoch length, thus increasing the resolution by the same factor. Padding makes the resolution higher but does not add any more information. The extra points in the spectrum are estimated by sinc interpolation between the original points. For our purpose— detecting peaks in the spectra— this was perfectly adequate.
Dominant frequency peak extraction
Dominant frequency peaks (DFPs) were detected within the interval [5–15] Hz in every channel. A peak was defined as a frequency of which both neighboring frequencies have lower amplitudes. In case multiple peaks were detected, only the peak with the highest amplitude was retained, and this in each channel.
The spectra of neighboring electrodes are known to be correlated, due to volume conduction. To reduce this redundancy, balance the number of NCM and EEG features and deal with the fact that some channels did not always exhibit peaks, we summarized the peaks found over all channels into four regions. To do this, we fine-tuned the algorithm from our previous study [10] to detect the DFP with the highest amplitude over the channels within a specific region. These regions were defined as follows: F, frontal (Fp1, Fp2, F3, Fz and F4); P, parietal and occipital (P3, Pz, P4, O1 and O2); L, left-temporal and central (F7, T3, C3 and T5); R, right-temporal and central (F8, T4, C4 and T6).
This procedure was also helpful in avoiding missing data, as only one channel per region needed to show a clearly distinguishable peak. The resulting dataset contained the frequency of every region’s DFP, for each subject.
Classification
Feature sets
We used three feature sets: one subset containing the four NCM markers, one subset containing the four EEG markers, and one set of eight features containing both the NCM and EEG markers. All these features were corrected for age. Each of these sets was used for training and testing the classifier algorithm, such that we could compare the performance of the subsets and verify if combining them improves the accuracy.
Cross-validation
Training and testing were done using cross-validation. Features (NCM and/or EEG markers) were collected into one dataset, which was then randomly divided into ten subsets or folds with the same proportion of the two groups (AD and FTLD) as in the complete dataset. We applied tenfold cross-validation: nine folds were used for training the classifier, while the remaining fold was used to test the trained classifier. This step was repeated until each fold had been used exactly once for testing. The test results for each fold were then combined into a total estimate of the classifier’s performance.
We repeated tenfold cross-validation 100 times, which allowed for the calculation of the mean and standard deviation of the classifier’s performance indices: sensitivity, specificity, positive predictive value (PPV), negative predictive value (NPV), and percentage correctly classified (PCC, also called accuracy). The sensitivity and specificity respectively show the ratio of correct positives over actual positives and correct negatives over actual negatives. The positive and negative predictive values respectively show the ratio of correct positives over all instances classified as positive and negatives over all instances classified as negative.
With TP = True Positives, correctly classified positives; TN = True Negatives, correctly classified negatives; FP = False Positives, negatives incorrectly classified as positives; and FN = False Negatives, positives incorrectly classified as negatives.
Classifier algorithm: Random Forest
A Random Forest is a collection of randomly generated decision trees. For each of these individual trees, a subset of features is selected at random from the complete feature set and then the tree is built. This resolves a major problem of decision trees: training a decision tree is difficult when there is a large number of features. After a fixed number of trees has been built, the prediction is based on majority voting of all trees. Most of these trees will be useless and giving random responses, but on average these will cancel each other out, which results in only the relevant trees adding to the prediction. We used the function randomForest of the R package “randomForest” [22] with number of trees set to 500 and default parameters for this classifier.
RESULTS
Data check: Special spectra
When we verified the validity of our spectral peak detection algorithm, we found three spectrum categories and listed them in Table 2. We also noticed that AD spectra were generally noisier and had lower amplitude than FTLD spectra. In a small number of patients, mainly AD, only in a few channels a dominant peak was found. However, these peaks were often not very pronounced in these patients: less than double the spectral average.
Table 2
Number of spectral peaks
| Group | Weak peak and only in a few channels | 1 clear peak in most channels | 1 clear peak and 1 extra peak in several channels |
| AD | 7 | 24 | 6 |
| AD –definite | 6 | 10 | 1 |
| FTLD | 2 | 18 | 10 |
| FTLD –definite | 0 | 4 | 5 |
In a considerable number of participants, mainly FTLD, we detected two dominant EEG peaks in the spectrum at around 2 Hz from each other. Of these two, the peak with the highest frequency was usually in the alpha range, around 9 Hz, and the other was usually around 7 Hz. The two clearest examples of spectra with two peaks in either group (AD patient on the left, FTLD right) are shown in Fig. 1. As a side note, they both had a non-definite diagnosis.
Fig. 1
Two examples of patients who have two peaks in their spectrum. In each region, the algorithm is able to extract the best dominant peak candidate, which is marked with a red cross. Left column: AD patient; right column: FTLD patient. Top row: frontal (F); second row: parietal-occipital (P); third row: left-temporal (L); bottom row: right-temporal (R).
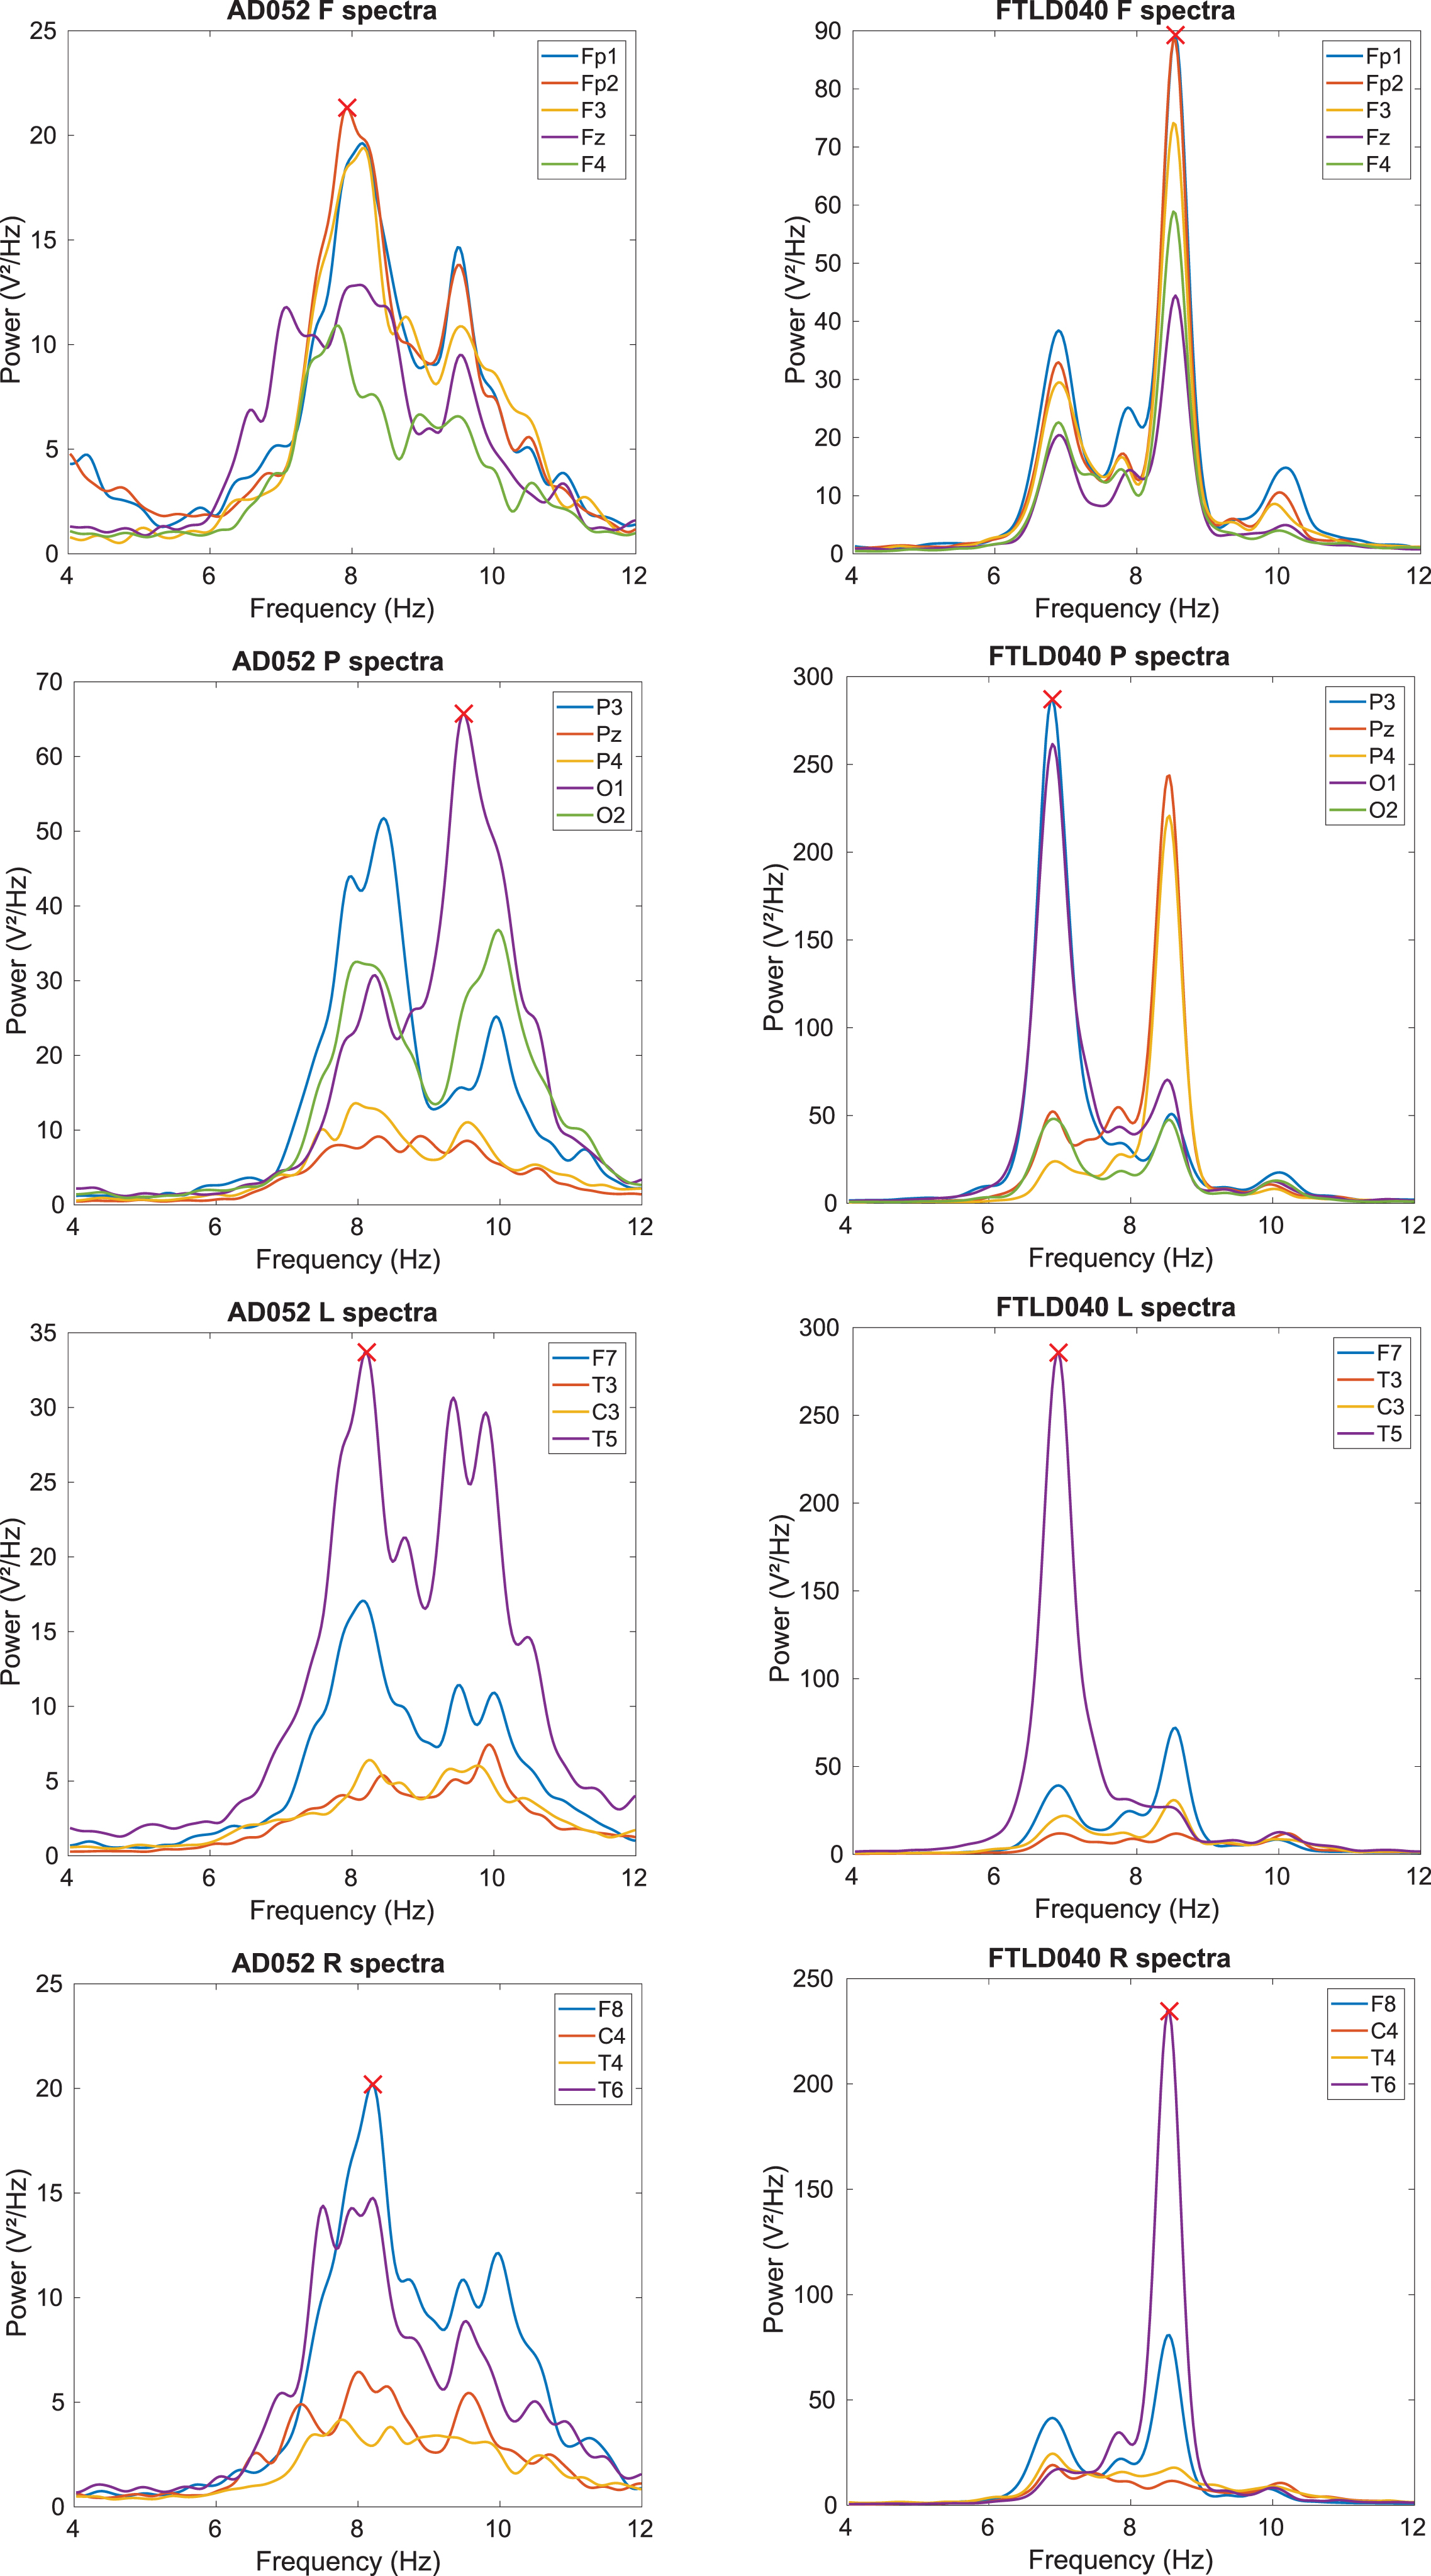
Looking at definite diagnosis only, no FTLD patient with a weak peak spectrum remained, while almost none of the AD patients with a double peak remained. We manually checked the results of our spectral peak algorithm and found that it was robust against these special cases of only a few channels showing a peak, or several channels showing two peaks. In the latter case, the strongest of the two peaks was extracted, which is by our definition the peak of interest.
Classification
Table 3 shows classification results respectively in the complete and the definite group. In the full group, the NCM biomarkers reach a good diagnostic accuracy (79%). The EEG features are behind (at 68%), but still reasonable. Cross-validating on NCM and EEG features together yielded a better accuracy than on NCM or EEG individually, reaching 82% (>79%, p < 10–15 = the decimal precision of a “double”, which is the 64-bit computational representation of a real number).
Table 3
Classification accuracies cross-validating on the complete cohort and on the definite group only
| Group | Features | Acc | Sens | Spec | PPV | NPV | |
| Complete | NCM | AV | 0.787 | 0.831 | 0.733 | 0.794 | 0.780 |
| SD | 0.018 | 0.027 | 0.024 | 0.016 | 0.028 | ||
| EEG | AV | 0.681 | 0.724 | 0.628 | 0.706 | 0.650 | |
| SD | 0.030 | 0.041 | 0.042 | 0.026 | 0.037 | ||
| NCM &EEG | AV | 0.818 | 0.902 | 0.714 | 0.796 | 0.856 | |
| SD | 0.017 | 0.026 | 0.022 | 0.013 | 0.032 | ||
| Definite | NCM | AV | 0.851 | 0.935 | 0.691 | 0.852 | 0.851 |
| SD | 0.030 | 0.024 | 0.070 | 0.030 | 0.050 | ||
| EEG | AV | 0.857 | 0.894 | 0.787 | 0.888 | 0.799 | |
| SD | 0.024 | 0.028 | 0.044 | 0.021 | 0.045 | ||
| NCM &EEG | AV | 0.946 | 0.989 | 0.866 | 0.933 | 0.978 | |
| SD | 0.024 | 0.025 | 0.045 | 0.021 | 0.047 |
AV, average; SD, standard deviation.
Including only the participants with a definite diagnosis greatly increased each of these classification accuracies. NCM and EEG scored between 85 and 86% and their combination obtained an accuracy of almost 95% (>86%, p < 10–15). We observed the same effect of increased accuracy in the definite group in our previous study focusing on EEG [10].
DISCUSSION
We investigated the value of NCM biomarkers and EEG-based markers to distinguish between the two most common causes of dementia that can still not be diagnosed in vivo with 100% accuracy. This was a follow-up study on our previous work focused on the slowed-down dominant EEG rhythm in AD as compared to FTLD [10]. Here, we found that both marker types are able to reveal unique disease properties, which was shown by an improved classification accuracy after combination compared to the accuracy of the separate marker types.
First, we confirmed the value of the established NCM biomarkers. Using Aβ1-42, T-tau, P-tau181, and Nf-L for classification, we achieved a differential AD versus FTLD classification accuracy of 79% in the entire group and 85% in the definite patients. In addition, we found that using the frequency components of the dominant rhythm detected through EEG allowed a classification of 68% in the whole group and 86% in the definite group. These accuracies show that both NCM and EEG markers have a value in distinguishing AD from FTLD and this is a further improvement upon what we found in our previous study on EEG markers only, of which the results were already promising [10]. The overall higher classification accuracy on the definite subgroups suggests that clinical misdiagnosis of AD versus FTLD still occurs, despite clinical follow-up that contributed to clinical diagnostic certainty.
The NCM biomarkers reflect the neuropathology of the neurodegenerative brain disorders under study and are relatively disease specific. A limitation of NCM biomarkers is that they do not include topographic information. EEG can be used to investigate the disruption of brain connectivity that results of neurodegeneration. The regional distribution of brain connectivity disruption heavily relies on the etiology of the dementia, as FTLD merely affects the frontal lobe as from its earlies stages whereas AD affects the temporal lobes in its earliest stages, followed by the parietal and frontal lobes with disease progression. Combining pathology-based (NCM) biomarkers with (EEG) biomarkers that comprise topographical information might improve the differential diagnostic AD versus FTLD accuracy.
When we combined the NCM and the EEG markers, the diagnostic accuracy increased significantly. In the whole group, the accuracy went up from at best 79% (NCM) to almost 82% (p < 10–15), while in the definite group only, it went up from almost 86% (EEG ≈ NCM) to almost 95% (p < 10–15). This suggests the NCM and EEG markers are complementary, revealing different aspects of the disease and therefore confirms again their relevance in developing additional diagnosis tools.
In a number of participants, we detected two dominant EEG peaks. We hypothesize that the mechanism behind the slowing down of the dominant rhythm is not a literal slowing down, but rather a fading out of the normal ground rhythm and the appearance of a new, slower rhythm that starts to dominate the first rhythm. The fact that we only noticed this phenomenon in some of the participants may mean that only they were in a transient state between normal and slowed dominant rhythm. If such a transient state exists, there are only two distinct dominant frequencies in the course of the disease, with a clear transition from the one to the other, i.e., when the slower frequency overtakes the original frequency.
Based on these results, we cannot determine whether everyone goes through this double-peak transition and at what moment in the course of the disease. This would require a longitudinal study, recruiting people who have been diagnosed with AD or FTLD, but who still have a healthy dominant rhythm. If this transition is the true mechanism behind the slowing down of the EEG ground rhythm in AD or FTLD, it probably happens at a specific disease stage and thus might have a prognostic value.
In our population, we noticed a few people with no distinguishable dominant peak in many of the channels, most of whom had definite AD. The majority of people had one clear dominant peak in every region and several people had two peaks. In that last group, the patients with AD and two peaks almost all had a probable diagnosis. In addition, there were more FTLD patients with two peaks than AD, especially in the definite group. Based on our data, this suggests that this phenomenon occurs more often in FTLD, which warrants further research.
A possible explanation for having no dominant EEG rhythm could be that the disease has progressed even further such that even the slow rhythm has started to fade out. This is supported by the fact that almost all the AD patients who lacked a clear peak had a definite diagnosis, indicating that disease had progressed to the severe stage. This seemed only valid in the AD group though, as there were no FTLD patients with a definite, and only two with a probable diagnosis who lacked a clear peak in their spectrum. Together with the higher prevalence of a double peak in FTLD, these are interesting new pointers towards more detailed spectral EEG differences between AD and FTLD.
To conclude, we have shown that both NCM and EEG biomarkers have promising value towards differential diagnosis of AD versus FTLD. Combining both biomarker categories resulted in classification improvement as compared to their own diagnostic accuracies. Furthermore, we found evidence that the slowing down of the dominant EEG rhythm might be a gradual appearance of a slow rhythm and fading out of the healthy ground rhythm, rather than a gradual slowing down of the healthy rhythm. Finally, we have discovered two differences in the occurrence of the dominant frequency: people lacking a clear peak almost all had definite AD, while people with two peaks more often had FTLD. These were unexpected findings that are very interesting to investigate in future studies.
ACKNOWLEDGMENTS
This work was funded in part by the University of Antwerp Research Fund and the Institute Born-Bunge (IBB, www.bornbunge.be). INNOTEST hTau-Ag and INNOTEST Phospho-Tau(181P) ELISA kits were kindly provided by Fujirebio Europe, Belgium and Nf-L ELISA kits were kindly discounted by IBL International GmbH, Germany. WW is a PhD fellow of the Research Foundation Flanders (FWO Vlaanderen, grant no. 11E8620N).
Authors’ disclosures available online (https://www.j-alz.com/manuscript-disclosures/22-0693r1).
SUPPLEMENTARY MATERIAL
[1] The supplementary material is available in the electronic version of this article: https://dx.doi.org/10.3233/JAD-220693.
REFERENCES
[1] | Elahi FM , Miller BL ((2017) ) A clinicopathological approach to the diagnosis of dementia, Nat Rev Neurol 13: , 457–476. |
[2] | Engelborghs S , De Vreese K , Van de Casteele T , Vanderstichele H , Van Everbroeck B , Cras P , Martin JJ , Vanmechelen E , De Deyn PP ((2008) ) Diagnostic performance of a CSF-biomarker panel in autopsy-confirmed dementia. Neurobiol Aging 29: , 1143–1159. |
[3] | Niemantsverdriet E , Valckx S , Bjerke M , Engelborghs S ((2017) ) Alzheimer’s disease CSF biomarkers: Clinical indications and rational use. Acta Neurol Belg 117: , 591–602. |
[4] | Albert MS , DeKosky ST , Dickson D , Dubois B , Feldman HH , Fox NC , Gamst A , Holtzman DM , Jagust WJ , Petersen RC , Snyder PJ , Carrillo MC , Thies B , Phelps CH ((2011) ) The diagnosis of mild cognitive impairment due to Alzheimer’s disease: Recommendations from the National Institute on Aging-Alzheimer’s Association workgroups on diagnostic guidelines for Alzheimer’s disease. Alzheimers Dement 7: , 270–279. |
[5] | Dubois B , Feldman HH , Jacova C , Hampel H , Molinuevo JL , Blennow K , Dekosky ST , Gauthier S , Selkoe D , Bateman R , Cappa S , Crutch S , Engelborghs S , Frisoni GB , Fox NC , Galasko D , Habert MO , Jicha GA , Nordberg A , Pasquier F , Rabinovici G , Robert P , Rowe C , Salloway S , Sarazin M , Epelbaum S , de Souza LC , Vellas B , Visser PJ , Schneider L , Stern Y , Scheltens P , Cummings JL ((2014) ) Advancing research diagnostic criteria for Alzheimer’s disease: The IWG-2 criteria. Lancet Neurol 13: , 614–629. |
[6] | McKhann GM , Knopman DS , Chertkow H , Hyman BT , Jack CR , Kawas CH , Klunk WE , Koroshetz WJ , Manly JJ , Mayeux R , Mohs RC , Morris JC , Rossor MN , Scheltens P , Carrillo MC , Thies B , Weintraub S , Phelps CH ((2011) ) The diagnosis of dementia due to Alzheimer’s disease: Recommendations from the National Institute on Aging-Alzheimer’s Association workgroups on diagnostic guidelines for Alzheimer’s disease. Alzheimers Dement 7: , 263–269. |
[7] | Struyfs H , Niemantsverdriet E , Goossens J , Fransen E , Martin J-J , De Deyn PP , Engelborghs S ((2015) ) Cerebrospinal fluid P-Tau181P: Biomarker for improved differential dementia diagnosis. Front Neurol 6: , 138. |
[8] | Goossens J , Bjerke M , Van Mossevelde S , Van Den Bossche T , Goeman J , De Vil B , Sieben A , Martin JJ , Cras P , De Deyn PP , Van Broeckhoven C , Van Der Zee J , Engelborghs S ((2018) ) Diagnostic value of cerebrospinal fluid tau, neurofilament, and progranulin in definite frontotemporal lobar degeneration. Alzheimers Res Ther 10: , 31. |
[9] | Ferreira D , Jelic V , Cavallin L , Oeksengaard A-R , Snaedal J , Høgh P , Andersen BB , Naik M , Engedal K , Westman E , Wahlund L-O ((2016) ) Electroencephalography is a good complement to currently established dementia biomarkers. Dement Geriatr Cogn Disord 42: , 80–92. |
[10] | Goossens J , Laton J , Van Schependom J , Gielen J , Struyfs H , Van Mossevelde S , Van den Bossche T , Goeman J , De Deyn PP , Sieben A , Martin J-J , Van Broeckhoven C , van der Zee J , Engelborghs S , Nagels G ((2017) ) EEG dominant frequency peak differentiates between Alzheimer’s disease and frontotemporal lobar degeneration. J Alzheimers Dis 55: , 53–58. |
[11] | Engelborghs S , Dermaut B , Goeman J , Saerens J , Mariën P , Pickut BA , Van den Broeck M , Serneels S , Cruts M , Van Broeckhoven C , De Deyn PP ((2003) ) Prospective Belgian study of neurodegenerative and vascular dementia: APOE genotype effects. J Neurol Neurosurg Psychiatry 74: , 1148–1151. |
[12] | Engelborghs S , Dermaut B , Mariën P , Symons A , Vloeberghs E , Maertens K , Somers N , Goeman J , Rademakers R , Van Den Broeck M , Pickut B , Cruts M , Van Broeckhoven C , De Deyn PP ((2006) ) Dose dependent effect of APOE ɛ4 on behavioral symptoms in frontal lobe dementia. Neurobiol Aging 27: , 285–292. |
[13] | Somers C , Struyfs H , Goossens J , Niemantsverdriet E , Luyckx J , De Roeck N , De Roeck E , De Vil B , Cras P , Martin J-J , De Deyn PP , Bjerke M , Engelborghs S ((2016) ) A decade of cerebrospinal fluid biomarkers for Alzheimer’s disease in Belgium. J Alzheimers Dis 54: , 383–395. |
[14] | Neary D , Snowden JS , Gustafson L , Passant U , Stuss D , Black S , Freedman M , Kertesz A , Robert PH , Albert M , Boone K , Miller BL , Cummings J , Benson DF ((1998) ) Frontotemporal lobar degeneration. Neurology 51: , 1546–1554. |
[15] | Mackenzie IRA , Neumann M , Baborie A , Sampathu DM , Du Plessis D , Jaros E , Perry RH , Trojanowski JQ , Mann DMA , Lee VMY ((2011) ) A harmonized classification system for FTLD-TDP pathology. Acta Neuropathol 122: , 111–113. |
[16] | MacKenzie IRA , Neumann M , Bigio EH , Cairns NJ , Alafuzoff I , Kril J , Kovacs GG , Ghetti B , Halliday G , Holm IE , Ince PG , Kamphorst W , Revesz T , Rozemuller AJM , Kumar-Singh S , Akiyama H , Baborie A , Spina S , Dickson DW , Trojanowski JQ , Mann DMA ((2010) ) Nomenclature and nosology for neuropathologic subtypes of frontotemporal lobar degeneration: An update. Acta Neuropathol 119: , 1–4. |
[17] | Montine TJ , Phelps CH , Beach TG , Bigio EH , Cairns NJ , Dickson DW , Duyckaerts C , Frosch MP , Masliah E , Mirra SS , Nelson PT , Schneider JA , Thal DR , Trojanowski JQ , Vinters H V. , Hyman BT ((2012) ) National institute on aging-Alzheimer’s association guidelines for the neuropathologic assessment of Alzheimer’s disease: A practical approach. Acta Neuropathol 123: , 1–11. |
[18] | Engelborghs S , Niemantsverdriet E , Struyfs H , Blennow K , Brouns R , Comabella M , Dujmovic I , van der Flier W , Frölich L , Galimberti D , Gnanapavan S , Hemmer B , Hoff E , Hort J , Iacobaeus E , Ingelsson M , Jan de Jong F , Jonsson M , Khalil M , Kuhle J , Lleó A , de Mendonça A , Molinuevo JL , Nagels G , Paquet C , Parnetti L , Roks G , Rosa-Neto P , Scheltens P , Skårsgard C , Stomrud E , Tumani H , Visser PJ , Wallin A , Winblad B , Zetterberg H , Duits F , Teunissen CE ((2017) ) Consensus guidelines for lumbar puncture in patients with neurological diseases. Alzheimers Dement (Amst) 8: , 111–126. |
[19] | Delorme A , Makeig S ((2004) ) EEGLAB: An open source toolbox for analysis of single-trial EEG dynamics including independent component analysis. J Neurosci Methods 134: , 9–21. |
[20] | Welch PD ((1967) ) The use of fast fourier transform for the estimation of power spectra: A method based on time averaging over short, modified periodograms, IEEE Trans Audio Electroacoust 15: , 70–73. |
[21] | MATLAB (2019) version 9.6 (R2019a). |
[22] | Breiman L ((2001) ) Random forests. {Mach Learn 45: , 5–32. |


