
Concordance of Alzheimer’s Disease-Related Biomarkers Between Intraventricular and Lumbar Cerebrospinal Fluid in Idiopathic Normal Pressure Hydrocephalus
Abstract
Background:
Alzheimer’s disease cerebrospinal fluid (CSF) biomarkers amyloid-β 1–42 (Aβ42), total tau (T-tau), and phosphorylated tau 181 (P-tau181) are widely used. However, concentration gradient of these biomarkers between intraventricular (V-CSF) and lumbar CSF (L-CSF) has been demonstrated in idiopathic normal pressure hydrocephalus (iNPH), potentially affecting clinical utility.
Objective:
Here we aim to provide conversion factors for clinical and research use between V-CSF and L-CSF.
Methods:
Altogether 138 iNPH patients participated. L-CSF samples were obtained prior to shunt surgery. Intraoperative V-CSF samples were obtained from 97 patients. Post-operative follow-up L- and V-CSF (shunt reservoir) samples of 41 patients were obtained 1–73 months after surgery and then after 3, 6, and 18 months. CSF concentrations of Aβ42, T-tau, and P-tau181 were analyzed using commercial ELISA assays.
Results:
Preoperative L-CSF Aβ42, T-tau, and P-tau181 correlated to intraoperative V-CSF (ρ= 0.34–0.55, p < 0.001). Strong correlations were seen between postoperative L- and V-CSF for all biomarkers in every follow-up sampling point (ρs Aβ42: 0.77–0.88, T-tau: 0.91–0.94, P-tau181: 0.94–0.96, p < 0.0001). Regression equations were determined for intraoperative V- and preoperative L-CSF (Aβ42: V-CSF = 185+0.34*L-CSF, T-tau: Ln(V-CSF) = 3.11+0.49*Ln(L-CSF), P-tau181: V-CSF = 8.2+0.51*L-CSF), and for postoperative V- and L-CSF (Aβ42: V-CSF = 86.7+0.75*L-CSF, T-tau: V-CSF = 86.9+0.62*L-CSF, P-tau181: V-CSF = 2.6+0.74*L-CSF).
Conclusion:
Aβ42, T-tau, and P-tau181 correlate linearly in-between V- and L-CSF, even stronger after CSF shunt surgery. Equations presented here, provide a novel tool to use V-CSF for diagnostic and prognostic entities relying on the L-CSF concentrations and can be applicable to clinical use when L-CSF samples are not available or less invasively obtained shunt reservoir samples should be interpreted.
INTRODUCTION
Idiopathic normal pressure hydrocephalus (iNPH) is characterized by a triad of gait disturbance, urinary incontinence, and progressive dementia, together with communicating hydrocephalus [1, 2]. It is observed in geriatric patients with a prevalence of 5.9–8.9% in those aged 80 years and older [3, 4]. The natural course of iNPH includes progressive worsening of the symptoms and delay in treatment leads to meager outcome after cerebrospinal fluid (CSF) shunt surgery [5, 6]. A positive clinical outcome by modified Rankin scale and by iNPH scale is achieved in 69% and 84% cases following surgery [7]. The concomitant neurodegenerative diseases are commonly comorbid to iNPH with the highest prevalence of Alzheimer’s disease (AD) [8].
The CSF based amyloid-β 1-42 (Aβ42), total tau (T-tau), and phosphorylated tau at threonine 181 (P-tau181) have found their standardized role in AD diagnostics. They illustrate the brain parenchyma neurodegenerative processes of amyloid accumulation to extracellular aggregates and intracellular neurofibrillary tangle formation caused by hyperphosphorylated tau. Within iNPH patients, the disease specific pattern of these biomarkers include lower Aβ42, T-tau, and P-tau181 concentration of CSF in comparison to healthy individuals of similar age [9–12]. Moreover, low T-tau and P-tau181 can discriminate iNPH from AD [12, 13]. Furthermore, the increased lumbar CSF (L-CSF) T-tau and P-tau181 are suggested for predictors of shunt-non-responsive iNPH [14, 15].
Despite keen research of CSF biomarkers, the composition of CSF throughout the circulating pathways of brain ventricles, spinal cord, and cortical subarachnoid space, as well as the effect of shunt surgery, is mostly unknown. CSF is not circulating like blood and the composition of CSF proteins is considered to depend on the surrounding tissue [16]. Furthermore, varying biomarker concentrations in CSF of iNPH patients has been reported based on both the timing and location of harvesting of the sample [17]. In addition, the presence of comorbid AD has tendency to alter the composition of CSF biomarkers [17]. The amyloid precursor protein derived proteins Aβ38, Aβ40, Aβ42, and soluble AβPPα has been reported to be lower in ventricular CSF (V-CSF) compared to preoperative L-CSF [9, 18–20]. In contrary, the T-tau and P-tau measured higher in intraoperative V-CSF than preoperative L-CSF [9, 18–20]. With trigeminal neuralgia and tension type headache patients the similar trend for T-tau was seen; higher concentration in cisternal CSF [21]. However, the Aβ42 did not differ significantly rostro-caudally [21]. When concentrations of Aβ42, T-tau, and P-tau181 were compared in post-traumatic hydrocephalus group, no significant rostro-caudal gradient were found [20]. The knowledge regarding post-shunt surgery rostro-caudal gradient with simultaneous samples of L- and V-CSF is sparse, but alterations in biomarker levels have been seen in longitudinal studies [9, 17, 18]. These together challenged the clinical use of intraventricular and postoperativeCSF.
Objective
Here we aim to enhance the knowledge for rostro-caudal gradient of CSF AD core markers and provide a novel tool for interpretation of intraventricular CSF biomarker results within iNPH patients.
MATERIALS AND METHODS
Study population
In all, 138 patients from Kuopio University Hospital (KUH) region, Kuopio, Finland were diagnosed with probable iNPH by the Relkin criteria and using the KUH iNPH protocol [1, 22]. Ventriculoperitoneal CSF shunt system (Ps Medical Strata II or Miethke ProGAV) was received by all participants. The shunt surgeries were performed from 2009 until 2015 for the 41-patient cohort and from 2018 until 2021 for the 97-patient cohort (Fig. 1). The participants were evaluated at baseline and 3 months postoperatively by iNPH grading scale (Kubo scale, 0–12 points) [23]. The positive outcome was determined with 1-point or more decrease and unimproved less than 1-point decrease in the total iNPH grading scale points postoperatively. Furthermore, the 41-patient cohort was assessed repeatedly by iNPH grading scale as presented previously [17]. Prior to the CSF shunt implantation, a brain biopsy was obtained using a previously described protocol [17] and analyzed for Aβ– and tau pathology by neuropathologist.
Fig. 1
Formation of the study cohorts. Flowchart is presenting the formation of the cohorts and cerebrospinal fluid sampling. * Kuopio iNPH protocol of diagnosis is published previously [22]. iNPH, idiopathic normal pressure hydrocephalus; CSF cerebrospinal fluid.
![Formation of the study cohorts. Flowchart is presenting the formation of the cohorts and cerebrospinal fluid sampling. * Kuopio iNPH protocol of diagnosis is published previously [22]. iNPH, idiopathic normal pressure hydrocephalus; CSF cerebrospinal fluid.](https://content.iospress.com:443/media/jad/2023/91-1/jad-91-1-jad220652/jad-91-jad220652-g001.jpg)
CSF sampling and analysis
Lumbar CSF was obtained during the diagnostic tap test (30–40 ml drained) on average 2.7 months prior to shunt surgery for all participants. Furthermore, intraventricular CSF (10 ml) was collected from 97 patients intraoperatively by draining of the CSF catheter immediately after insertion (Fig. 1). Follow-up CSF collection was performed for the cohort of 41 patients with sampling and analysis protocols described previously [17]. Briefly, parallel L- and V-CSF samples (10 ml) were collected 1–73 months post-surgery and thereafter 3, 6, and 18 months later. All lumbar CSF was collected by the L3/L4 or L4/L5 interspace lumbar puncture using 22-gauge needle. Follow-up samples of ventricular CSF were collected by puncturing the CSF shunt reservoir. The samples were retained in 10 ml polypropylene tubes and centrifuged, aliquoted, and frozen in –80°C freezer. Blood contaminated CSF samples were omitted from further analyzing.
The 97-cohort pre- and intraoperative CSF samples were analyzed at the University of Eastern Finland Alzheimer’s disease biomarker laboratory, Kuopio, Finland, using standardized protocols of the laboratory. The CSF concentrations of Aβ42, T-tau, and P-tau181 were measured by fully automated Elecsys immunoassays (Roche Diagnostics GmbH, Penzberg, Germany) according to the manufacturer’s protocols [24, 25]. The same batch of reagents was used in all samples. The Aβ42, T-tau, and P-tau181 levels from the CSF samples of 41-cohort obtained pre- and postoperatively, were analyzed at the Clinical Neurochemistry Laboratory at Sahlgrenska University Hospital, Mölndal, Sweden, using commercial ELISA assays (Innotest) presented previously [17]. All laboratory technicians were board-certified and blinded to the clinical data. Conversion factors established in-house following the methods presented by Willemse et al. [26], were used for Aβ42, T-tau, and P-tau181 values measured by Innotest assays to enable comparison with Elecsys assay results.
Cerebrospinal fluid shunt in vitro experiment protocol
An in vitro experiment was carried to evaluate the effect of CSF shunt system to the CSF Aβ42, T-tau, and P-tau181 concentrations. The detailed protocols are presented in the Supplementary section 1. Briefly, the CSF used in this experiment, was obtained by preoperative lumbar punctures. The samples were mixed to establish three mixtures with different baseline concentrations in both protocols implemented. The preservation and overall sampling of the CSF followed similar protocol as described above.
Protocol 1
All experiments presented here were executed in all three mixtures. At the beginning, two baseline samples were obtained from CSF mixture. In the second phase, CSF mixture was aspirated through the proximal (intracranial) part of the silicon CSF catheter by micropipette (1 ml) and pipetted to the 13 ml polypropene tube (Sarstedt). In the third phase, the CSF shunt (PS Medical Strata II) inflow catheter and valve was filled with CSF mixture and samples (5 ml) were obtained by puncturing the shunt reservoir and aspirating the CSF into the syringe [20 ml, BD Discardit II (Becton Dickinson S.A., Fraga, Spain)] through the 3-way stopcock with 10 cm tubing [Discofix C 10 cm (Braun Medical AG, Escholzmatt, Switzerland)]. Aspirate was then ejected to the 15 ml polypropene tube (Sarstedt). The fourth phase was like third, except the CSF was aspirated (2 ml) directly from the mixture without the CSF shunt in between. All collected samples were further pipetted to the 0.5 ml sampling tubes (Sarstedt).
Protocol 2
All experiments presented here were executed in all three mixtures. The protocol began with 0.5 ml baseline samples and ended to the 0.5 ml endpoint samples. Further, we obtained samples of 2, 5, 10, 15, and 20 ml of CSF by the combination of 3-way stopcock with 10 cm tubing [Discofix C 10 cm (Braun Medical AG, Escholzmatt, Switzerland)] and syringe [20 ml, BD Discardit II (Becton Dickinson S.A., Fraga, Spain)] and ejected the samples to the 15 ml polypropene tubes (Fisherbrand). Further samples of 0.5 ml from all sample sizes were obtained by micropipette to the sampling tubes of 0.5 ml (Sarstedt).
The samples collected were further analyzed for Aβ42, T-tau, and P-tau181 by using the fully automated ELISA’s at the University of Eastern Finland Alzheimer’s disease biomarker laboratory, Kuopio, Finland as described above.
Statistics
The comparison of biomarker concentrations between cohorts and V- and L-CSF were performed by standard t-tests or for the repeated measures by linear mixed effects models. For the comparison of the demographic features between the cohorts, either independent samples t-tests or chi-square tests were used. Spearman’s rank correlation coefficients were used in all correlation analyzes performed. The follow-up samples of 41 patients were pooled per person for correlation analyzes. For supplementary tests, mean concentrations and percentual changes from baseline were calculated.
Furthermore, linear regression model was used for the assessment of the linear dependency between pre- and intraoperative CSF Aβ42, T-tau, and P-tau181 concentrations. In addition, pre- and intraoperative CSF T-tau results were transferred to logarithmic scale (natural logarithm) due to the non-normally distributed results. Similar linear regression analyses were performed for logarithmic T-tau. To further analyze the linear dependency between postoperative L- and V-CSF samples of 41-patient cohort, linear mixed model was performed. In both models, univariate analyses for single biomarkers and multivariate analyses for single biomarkers together with age and sex were computed. In addition, distribution of biomarker values was examined by histograms, boxplots and calculating the kurtosis and skewness of parameters. Over 2.5 standard deviations (SD) data points apart from mean concentrations, were identified as potential outliers. There were two Aβ42, 2 T-tau, and 3 P-tau181 values in the postoperative L- and V-CSF results that diverged from the distribution and exceeded the 2.5 SD criterion and thus were excluded from linear mixed model analyses. Due to the dispersed distribution in the pre- and intraoperative L- and V-CSF results, outliers could not reliably be identified and thus were not excluded. Regression equations were yielded for L- and V-CSF Aβ42, T-tau, and P-tau181 concentrations based on these results. All tests were two-sided and p-values less than 0.05 were considered significant. SPSS software 27.00 (IBM Corp., Amonk, NY, USA) for IOS was used for statistical analyses.
Ethical statement
The study protocol of this study has received the authorization of the regional Ethics Committee of Northern Savo Hospital District, Kuopio, Finland, to proceed. All participants or their caregivers have provided a written informed consent prior to participation. The implementation and governance of this study were performed in accordance with the latest revision of the Declaration of Helsinki.
RESULTS
Patient characteristics and biomarker concentrations of both cohorts are presented in Table 1. Longitudinal changes in CSF biomarkers of the 41-patient cohort have been reported previously [17]. Altogether, baseline NPH grading scale points were similar across the cohorts (Mean 6.0 for cohort 97 and 5.6 for cohort 41, p = 0.41). The only significant difference was seen in gait velocity as the cohort 97 had 0.2 m/s higher baseline gait velocity (p < 0.01). The male sex was more common in both cohorts (57% in cohort 97 and 61% in cohort 41) and the gender distribution was similar between the cohorts (p = 0.071). The preoperative baseline lumbar CSF Aβ42, T-tau, and P-tau181 concentrations were similar in cohorts of 41 and 97 patients (Aβ42 p = 0.86, T-tau p = 0.64, and P-tau181 p = 0.43) (data not shown).
Table 1
Patient’s characteristics and biomarker concentrations presented for both cohorts studied
| Patient characteristics | Cohort 97 | Cohort 41 | ||
| n = 97 | n = 41 | p | ||
| Age (y); mean (SD) | 74.7 (6.4) | 76.4 (5.5) | 0.16 | |
| Male sex; n (%) | 55 (57) | 25 (61) | 0.71 | |
| Amyloid pathology; n (%) | 46 (47) | 28 (68) | 0.08 | |
| Tau pathology; n (%) | 15 (15) | 6 (15) | 0.91 | |
| MMSE Baseline; mean (SD) | 23.3 (3.9) | 23.9 (3.2) | 0.42 | |
| Gait velocity Baseline (m/s); mean (SD) | 0.8 (0.4) | 0.6 (0.3) | <0.01* | |
| APOE ɛ4; n (%) | 29 (30) | 13 (32) | 0.81 | |
| NPHGS Total baseline; mean (SD) | 6.0 (2.8) | 5.6 (2.5) | 0.41 | |
| Biomarkers | Location | Pooled follow-up** | ||
| Aβ42 (ng/l); mean (SD) | V-CSF | 498.2 (245.4) | 720.3 (307.7) | |
| L-CSF | 914.7 (387.0) | 824.6 (290.7) | ||
| T-tau (ng/l); mean (SD) | V-CSF | 325.9 (233.5) | 423.7 (174.3) | |
| L-CSF | 167.6 (63.9) | 539.1 (274.6) | ||
| P-tau181 (ng/l); mean (SD) | V-CSF | 14.8 (7.4) | 37.4 (14.3) | |
| L-CSF | 13.2 (5.9) | 46.9 (19.3) |
Mean and standard deviations or frequencies are presented for each variable. In the cohort 97, V-CSF refers for intraoperative ventricular CSF and L-CSF refers for preoperative lumbar CSF. In the cohort 41, the V-CSF is CSF collected by shunt reservoir puncture and L-CSF is collected by lumbar puncture during the postoperative follow-up. The p-values are calculated to compare main differences between demographic variables. (*) indicating significant difference. (**) Repeated V- and L-CSF samples of the follow-up were pooled per patient. Y, year; SD, standard deviation; n, number; m/s, meters per second; APOE ɛ4, apolipoprotein epsilon 4 allele; NPHGS, NPH symptoms grading scale (Kubo scale); Aβ42, amyloid-β 1–42; T-tau, total tau protein; P-tau181, phosphorylated tau at threonine 181; V-CSF, ventricular cerebrospinal fluid; L-CSF, lumbar cerebrospinal fluid.
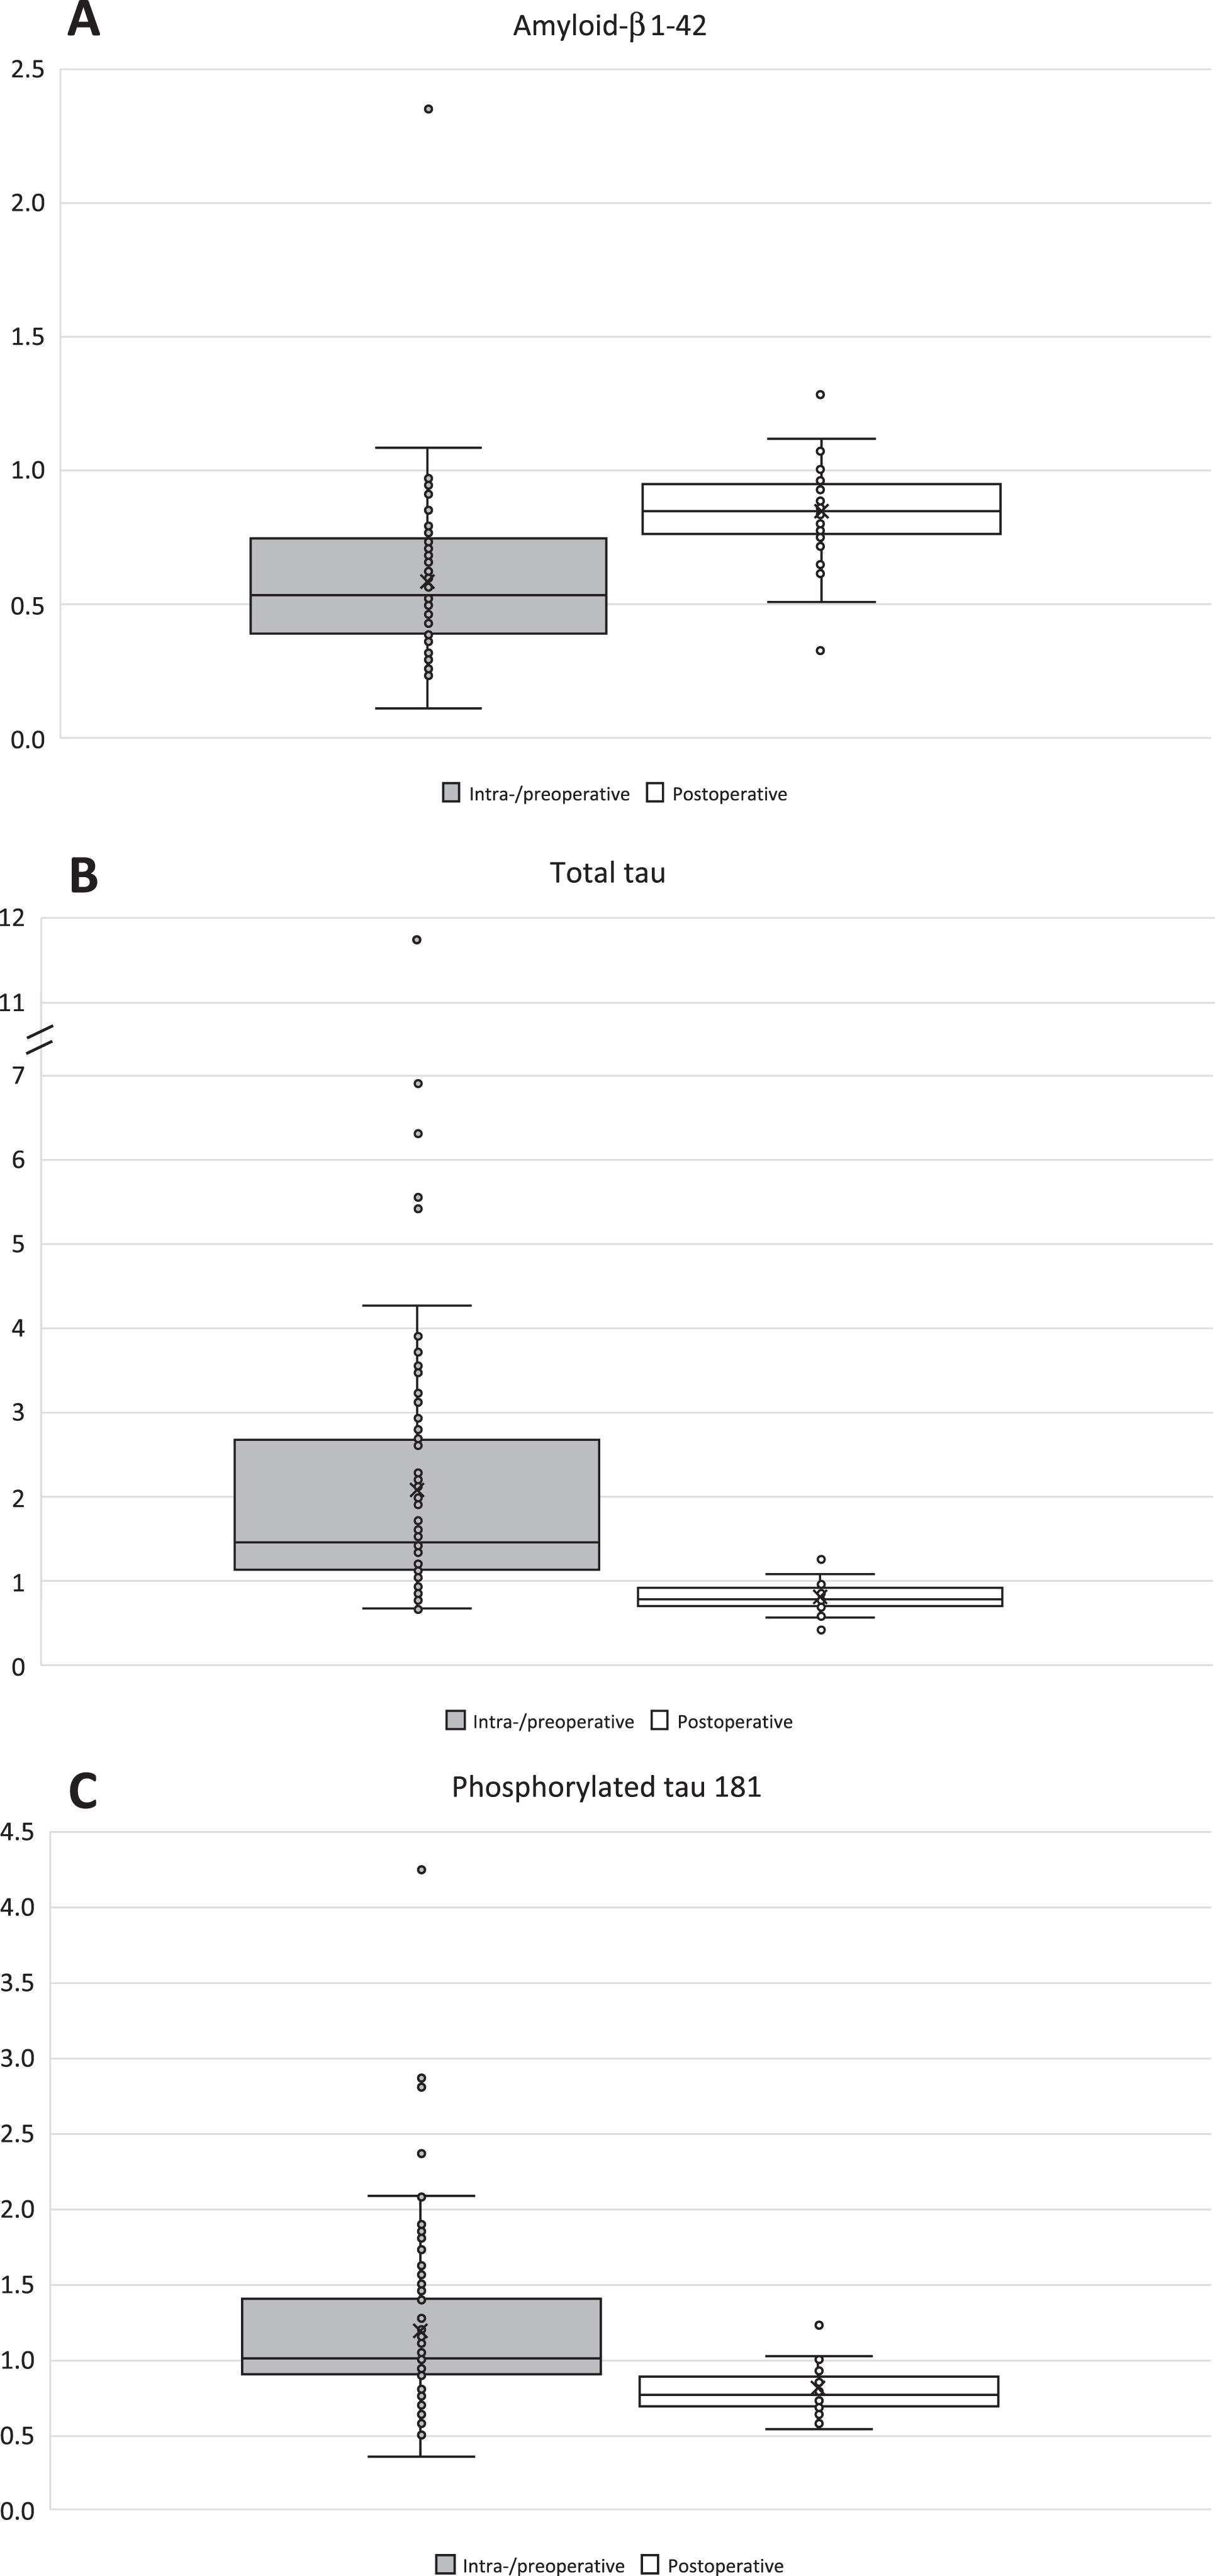
The preoperative lumbar CSF Aβ42 concentrations were 84% higher than intraoperative ventricular CSF (p < 0.0001) and the median V/L-CSF ratios (VLR) were 0.54 (Q1–Q3:0.40–0.75) (Fig. 2, Table 1). On the contrary, T-tau and P-tau181 concentrations in preoperative lumbar CSF were 49% and 11% lower than seen in intraoperative ventricular CSF (T-tau p < 0.001, P-tau p = 0.027) and had median VLRs of 1.47 (Q1–Q3:1.14–2.68) and 1.01 (Q1–Q3:0.90–1.40) (Fig. 2, Table 1). Pooled post-shunt-surgery sample V-CSF concentrations were 12.6% (p < 0.0001), 21.4% (p < 0.0001), and 20.3% (p < 0.0001) lower than in L-CSF for Aβ42, T-tau, and P-tau181 (Table 1). The median VLRs were 0.85 for Aβ42 (Q1–Q3:0.77–0.95), 0.79 for T-tau (Q1–Q3:0.72–0.92), and 0.77 for P-tau181 (Q1–Q3:0.68–0.88) (Fig. 2).
Fig. 2A-C
Boxplots of ventricular-/lumbar CSF ratios. Box and whiskers plots are presenting ventricular-/lumbar CSF ratios of the biomarkers of Aβ42 (A), T-tau (B), and P-tau181 (C). Light gray boxplots are illustrating the ratios of intraoperative V-CSF and preoperative L-CSF. White boxplots are presenting the ratios of postoperative V- and L-CSF. Repeated V- and L-CSF samples of the follow-up were pooled per patient before the calculation of the V-/L-CSF ratios. Aβ42, amyloid-β 1-42; T-tau, total tau protein; P-tau181, phosphorylated tau at threonine 181; V-CSF, ventricular cerebrospinal fluid; L-CSF, lumbar cerebrospinal fluid.
Correlations between ventricular and lumbar CSF were examined by Spearman’s ρ (Table 2). In the cohort of 97 patients, preoperative L-CSF Aβ42 (ρ= 0.54), T-tau (ρ= 0.34), and P-tau181 (ρ= 0.55) (all p < 0.001) correlated to intraoperative V-CSF. Furthermore, strong correlations were seen for Aβ42 (ρ= 0.77–0.88, mean ρ= 0.83), T-tau (ρ= 0.91–0.94, mean ρ= 0.92) and P-tau181 (ρ= 0.94–0.96, mean ρ= 0.94) between simultaneous postoperative L- and V-CSF samples of 41-patient cohort throughout the follow-up (all p < 0.0001). In addition, no correlations were seen between the waiting time for surgery and the intraoperative ventricular CSF Aβ42 (ρ= 0.01, p = 0.89), T-tau (ρ= –0.06, p = 0.60), and P-tau181 (ρ= –0.01, p = 0.90) concentrations (data not shown).
Table 2
Spearman’s rhos (ρ) between intraventricular and lumbar CSF biomarkers
| L- &V-CSF | Aβ42 | T-tau | P-tau181 |
| Cohort 97 | 0.54b | 0.34b | 0.55b |
| Cohort 41a | 0.87c | 0.91c | 0.91c |
Spearman’s rank correlation coefficients between V- and L-CSF were calculated for each biomarker in both cohorts of 97 and 41 patients. The samples of the cohort 97 were collected preoperatively (L-CSF) and intraoperatively (V-CSF), and for the cohort 41, postoperatively (parallel V- and L-CSF samples). aRepeated V- and L-CSF samples of the follow-up were pooled per patient. bp < 0.001 for preoperative L-CSF and intraoperative V-CSF. cp < 0.001 for postoperative L- and V-CSF. Aβ42, amyloid-β 1-42; T-tau, total tau protein; P-tau181, phosphorylated tau at threonine 181; V-CSF, ventricular cerebrospinal fluid; L-CSF, lumbar cerebrospinal fluid.
Linear regression models were carried out to investigate the relationship for intraoperative V-CSF and preoperative L-CSF, patient age and gender (Table 3, Fig. 3A-C). Fitted model functions are yielded and presented in Tables 3 and 4 and Fig. 3. In the univariate model (p < 0.001, F = 38.8, R2 = 0.29) for Aβ42, L-CSF significantly predicted V-CSF (B = 0.34, C.I. 0.23–0.45, p < 0.001) (Fig. 3A). Multivariate model for V-CSF Aβ42, consisted of age, gender, and L-CSF was statistically significant (p < 0.001, F = 13.1) and explained 30% of variance (R2 = 0.30). L-CSF Aβ42 was significant predictor (B = 0.34, C.I. 0.23–0.46, p < 0.001); however, age (B = –3.2, C.I. – 9.8–3.4, p = 0.33) and male gender (B = –0.06, C.I. –86.8–86.7, p = 0.99) were non-significant predictors of V-CSF. Due the non-normally distributed concentrations of preoperative and intraoperative CSF T-tau, logarithmic correction was carried. The univariate linear regression model (R2 = 0.08, F = 7.9, p = 0.006) with Ln(T-tau L-CSF), predicted significantly (B = 0.49, C.I. 0.15–0.84, p = 0.006) Ln(T-tau V-CSF) (Fig. 3B). The multivariate regression model including age, gender, and Ln(T-tau L-CSF), was significant as well (R2 = 0.09, p = 0.01). The L-CSF Ln(T-tau) was significant (B = 0.48, C.I. 0.11–0.84, p = 0.01), and both age (B = 0.00, C.I. –0.02–0.02, p = 0.96) and gender (B = 0.10, C.I. –0.13–0.34, p = 0.38) were non-significant predictors of V-CSF Ln(T-tau). The univariate model (F = 18.8, p < 0.001) of preoperative L-CSF P-tau181 (B = 0.51, C.I. 0.27–0.74, p < 0.001), explained 17% of the V-CSF variance (R2 = 0.17) (Fig. 3C). In multivariate model (R2 = 0.19, F = 7.0, p < 0.001) with predicting variables of age (B = 0.08, C.I. –0.15–0.30, p = 0.51), gender (B = 2.0, C.I. –0.86–4.79, p = 0.17) and L-CSF P-tau181 (B = 0.47, C.I. 0.23–0.71, p < 0.001) only L-CSF P-tau181 was significant predictor for V-CSF P-tau181.
Table 3
Univariate and multivariate linear regression and linear mixed effect models for Aβ42, T-tau, and P-tau181
| Preoperative L-CSF and intraoperative V-CSF | V-CSF = Constant + Slope*L-CSF | ||||||
| Univariate: | Regression coefficient | C.I. (95%) | p | Constant | C.I. (95%) | R2 | Function |
| Aβ42 | 0.34 | 0.23–0.45 | <0.001 | 185.4 | 76.4–294.4 | 0.29 | 185.4+0.34*L-CSF |
| T-tau | 0.36 | –0.39–1.1 | ns. | 268 | 134–402 | 0.01 | |
| P-tau181 | 0.51 | 0.27–0.74 | <0.001 | 8.2 | 4.8–11.6 | 0.17 | 8.2+0.51*L-CSF |
| Ln(T-tau) | 0.49 | 0.15–0.84 | 0.006 | 3.1 | 1.3–4.9 | 0.08 | 3.11+0.49*Ln(L-CSF) |
| Multivariate: Age and Sex included | |||||||
| Aβ42 | 0.34 | 0.23–0.46 | <0.001 | 426.5 | –88.0–941.0 | 0.30 | 426.5+0.34*L-CSF –3.2*Age –0.06*Male |
| Age | –3.2 | –9.8–3.4 | ns. | ||||
| Sex (male) | –0.06 | –86.8–86.6 | ns. | ||||
| Ln(T-tau) | 0.48 | 0.11–0.84 | 0.012 | 3.1 | 1.1–5.1 | 0.09 | 3.1 + 0.48*Ln(L-CSF) + 0.11*Male |
| Age | 0.00 | –0.02–0.02 | ns. | ||||
| Sex (male) | 0.11 | –0.01–0.34 | ns. | ||||
| P-tau181 | 0.47 | 0.23–0.71 | <0.001 | 2.0 | –14.6–18.6 | 0.19 | 2.0 + 0.47*L-CSF + 0.08*Age + 1.97*Male |
| Age | 0.08 | –0.15–0.30 | ns. | ||||
| Sex (male) | 1.97 | –0.86–4.79 | ns. | ||||
| Postoperative L- and V-CSF | |||||||
| Univariate: | Regression coefficient | C.I. (95%) | p | Constant | C.I. (95%) | pseudo R2 | Function |
| Aβ42 | 0.75 | 0.63–0.88 | <0.001 | 86.7 | –20–194 | 0.28 | 86.7+0.75*L-CSF |
| T-tau | 0.62 | 0.55–0.68 | <0.001 | 86.9 | 48.7–125.0 | 0.32 | 86.9+0.62*L-CSF |
| P-tau181 | 0.74 | 0.69–0.78 | <0.001 | 2.64 | –0.06–5.34 | 0.45 | 2.64+0.74*L-CSF |
| Multivariate: Age and Sex included | |||||||
| Aβ42 | 0.71 | 0.58–0.84 | <0.001 | 813.9 | 162.2–1465.6 | 0.29 | 813.9+0.71*L-CSF-9.2*Age+24.3*Male |
| Age | –9.2 | –17.4–(–1.1) | 0.027 | ||||
| Sex (male) | 24.3 | –57.9–106.5 | ns. | ||||
| T-tau | 0.62 | 0.55–0.69 | <0.001 | 40.7 | –264.7–346.1 | 0.33 | 40.7+0.62*L-CSF+0.53*Age+12.5*Male |
| Age | 0.53 | –3.5–4.6 | ns. | ||||
| Sex (male) | 12.5 | –28.9–53.9 | ns. | ||||
| P-tau181 | 0.74 | 0.69–0.78 | <0.001 | 16.3 | –8.8–41.4 | 0.46 | 16.3+0.74*L-CSF-0.17*Age-2.0*Male |
| Age | –0.17 | –0.50–0.16 | ns. | ||||
| Sex (male) | –2.0 | –5.4–1.4 | ns. | ||||
Univariate and multivariate linear regression and linear mixed effect models for Aβ42, T-tau, and P-tau181 V-CSF predicted by L-CSF and in multivariate by L-CSF, age, and gender are presented. Regression coefficients and constants with the confidence intervals of each model are presented on rows. Further, the model coefficient of determinations or pseudo coefficient of determinations are presented. Yielded equations of each significant model are presented in the “Function” column and are formatted as estimating the V-CSF concentrations of the biomarker included into the model. p-value column indicating the significance of each predicting variable in the model. Aβ42, amyloid-β 1–42; T-tau, total tau protein; P-Tau181, hyperphosphorylated tau at threonine 181; V-CSF, ventricular cerebrospinal fluid; L-CSF, lumbar cerebrospinal fluid; B, Regression coefficient; C.I., Confidence interval; R2, Coefficient of determination; Ln, natural logarithm transferred variable; ns., non-significant p-value.
Fig. 3A-C
Scatterplots of pre- and intraoperative Aβ42, T-tau, and P-tau181 in L- and V-CSF. Scatterplots of V- and L-CSF values of the biomarkers Aβ42 (A), T-tau (B), and P-tau181 (C) and linear trendlines are illustrating the linear dependency of intraoperative V- and preoperative L-CSF. Mean confidence intervals (95%) are drawn for linear trendlines. Regression equations of the linear univariate regression models are presented at upper right corner of the figure. T-tau values are presented at natural logarithmic scale due the non-normally distributed values. Aβ42, amyloid-β 1–42; T-tau, total tau protein; P-Tau181, hyperphosphorylated tau at threonine 181; V-CSF, ventricular cerebrospinal fluid; L-CSF lumbar cerebrospinal fluid; Ln, natural logarithm transferred variable; R2, Coefficient of determination.
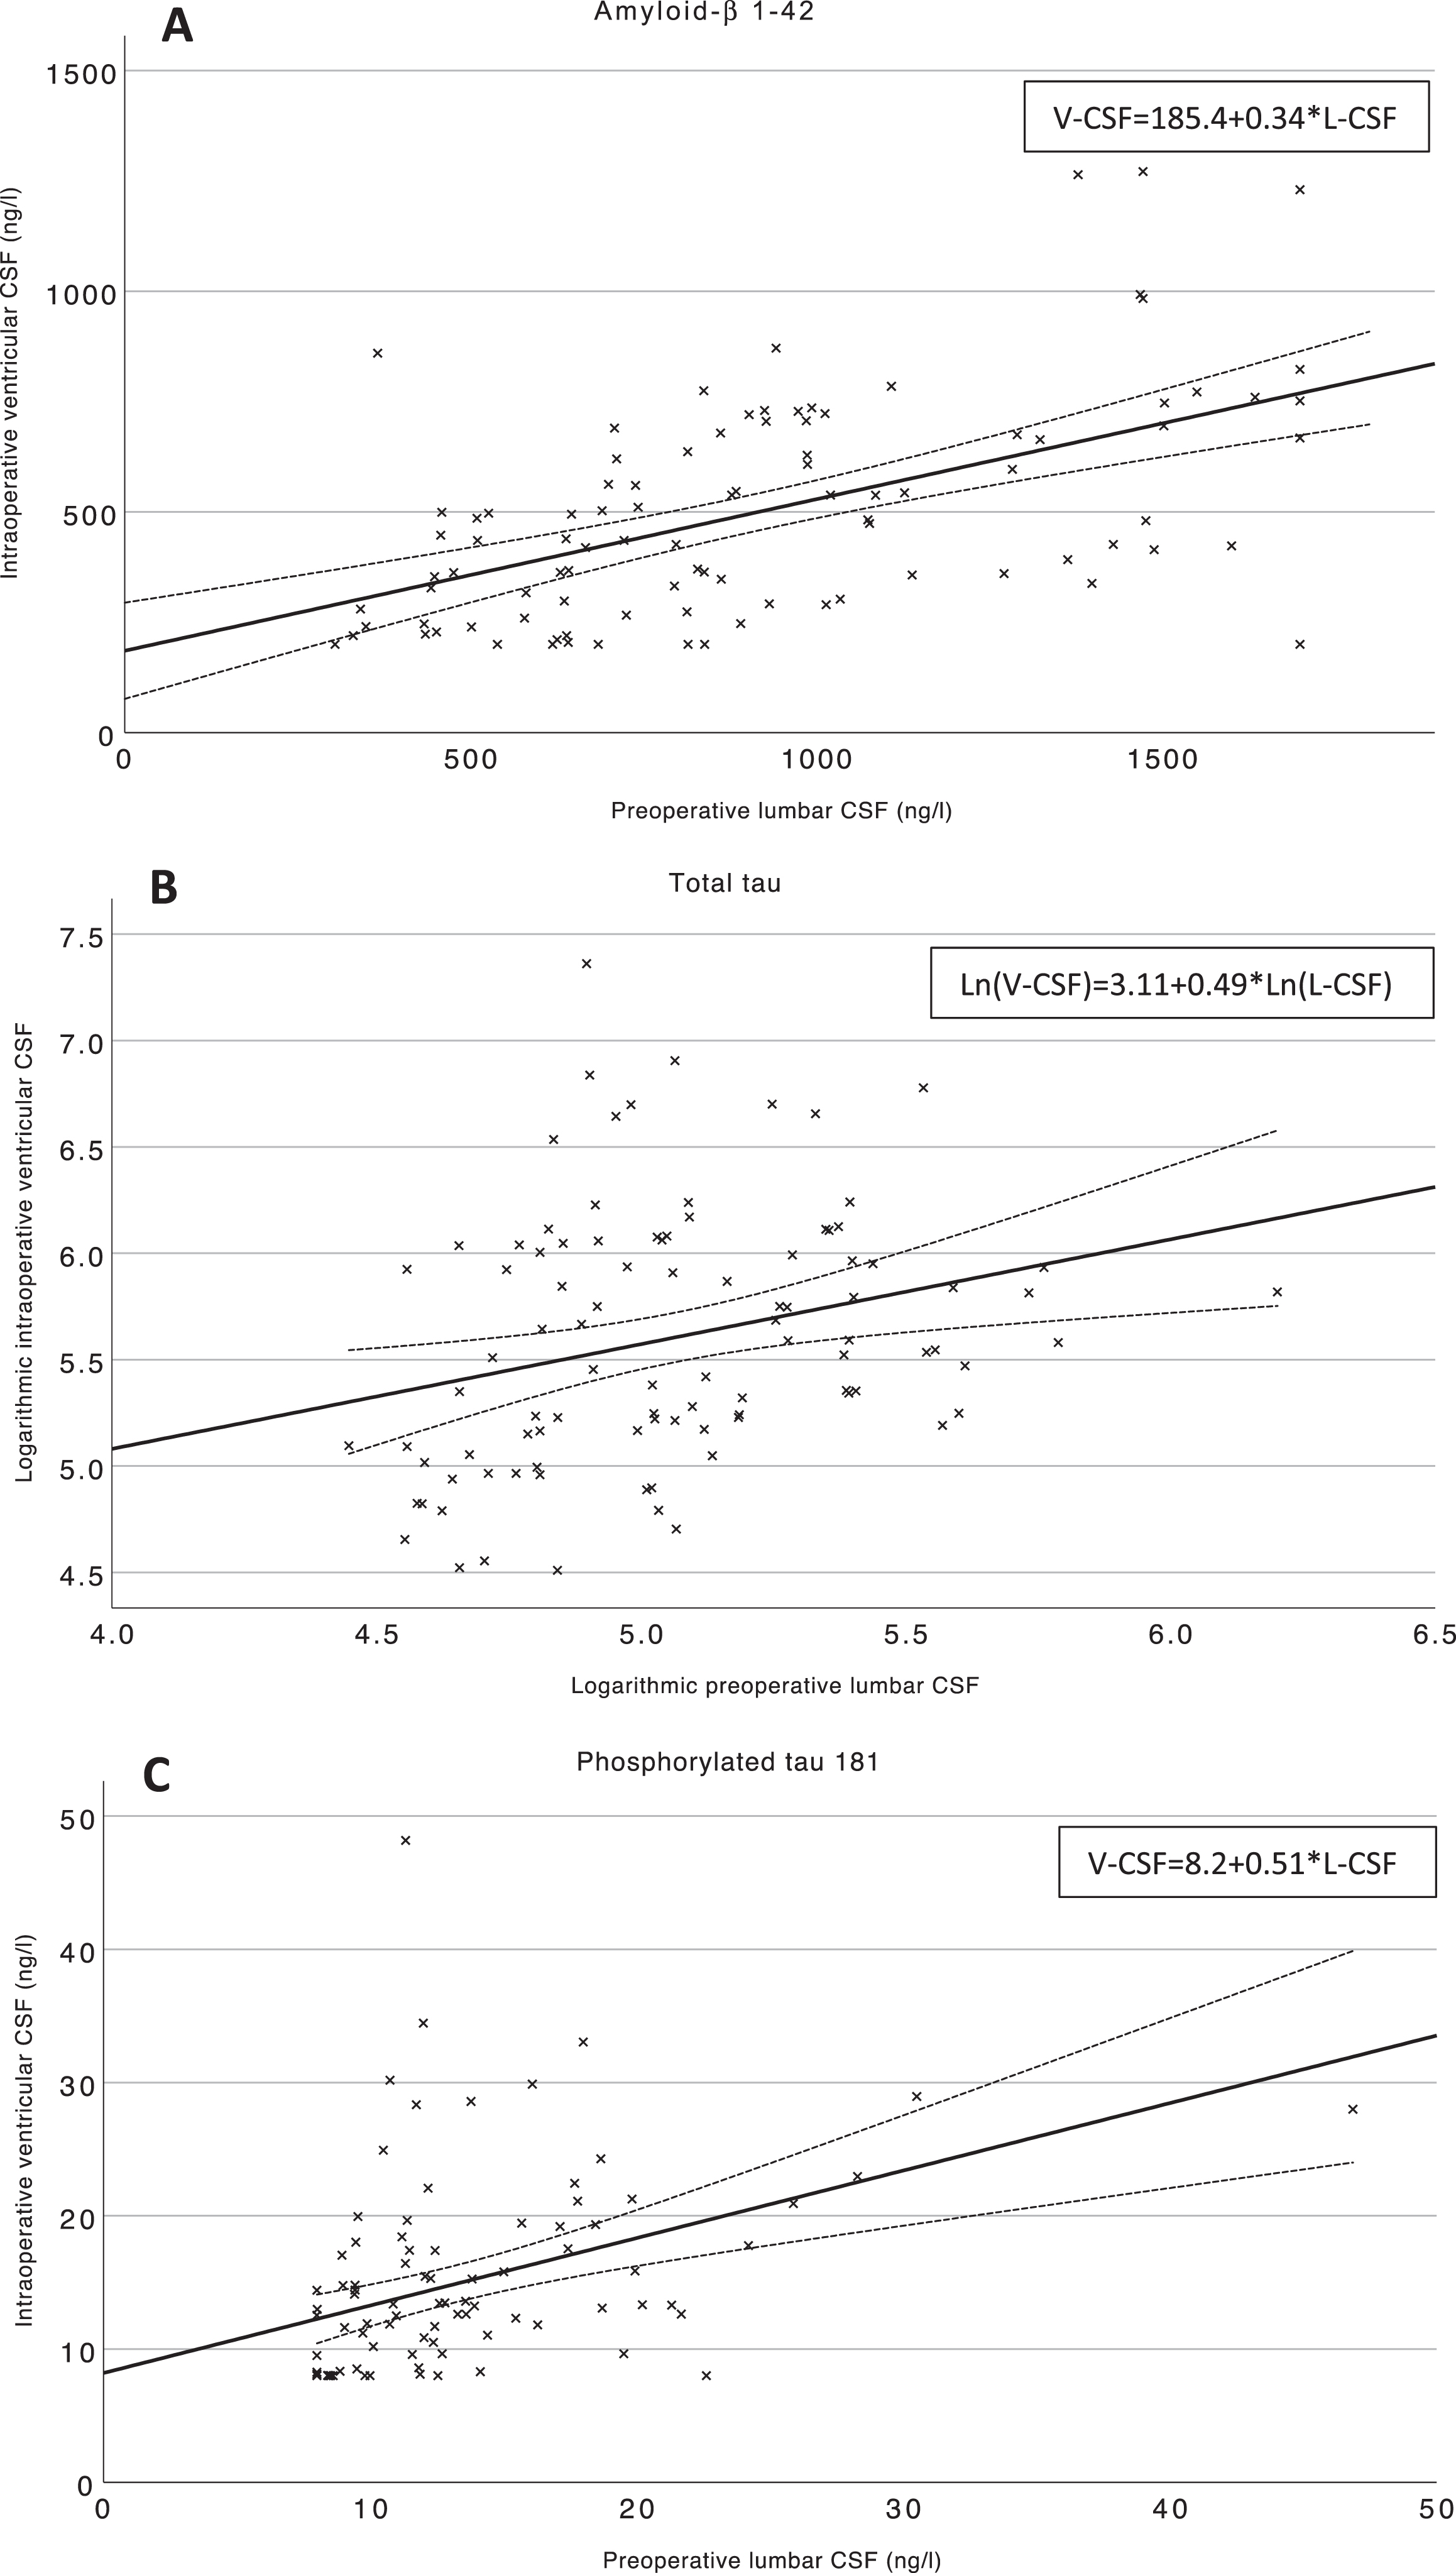
Table 4
Functions for estimated L-CSF Aβ42, T-tau, and P-tau181 by V-CSF
| Preoperative L-CSF and intraoperative V-CSF | |||
| Univariate | Estimated L-CSF= | Multivariate | Estimated L-CSF= |
| Aβ42 | (V-CSF-185.4)/0.34 | Aβ42 | (V-CSF-426.5+3.2*Age+0.06*Male)/0.34 |
| Ln(T-tau) | (Ln(V-CSF)-3.11)/0.49 | Ln(T-tau) | (Ln(V-CSF)-3.1-0.11*Male)/0.48 |
| P-tau181 | (V-CSF-8.2)/0.51 | P-tau181 | (V-CSF-2.0–0.08*Age-1.97*Male)/0.47 |
| Postoperative L- and V-CSF | |||
| Univariate | Estimated L-CSF= | Multivariate | Estimated L-CSF= |
| Aβ42 | (V-CSF-86.7)/0.75 | Aβ42 | (V-CSF-813.9+9.2*Age-24.3*Male)/0.71 |
| T-tau | (V-CSF-86.9)/0.62 | T-tau | (V-CSF-40.7–0.53*Age-12.5*Male)/0.62 |
| P-tau181 | (V-CSF-2.64)/0.74 | P-tau181 | (V-CSF-16.3+0.17*Age+2.0*Male)/0.74 |
The fitted model functions are transferred to estimate L-CSF values of Aβ42, T-tau, and P-tau181, based on the V-CSF values, or V-CSF, age (years) and gender. Different functions are yielded for pre- and intraoperative L- and V-CSF as well as for postoperative V- and L-CSF Aβ42, T-tau, and P-tau181. Aβ42, amyloid-β 1–42; T-tau, total tau protein; P-Tau181, hyperphosphorylated tau at threonine 181; V-CSF, ventricular cerebrospinal fluid; L-CSF, lumbar cerebrospinal fluid; Ln, natural logarithm transferred variable.
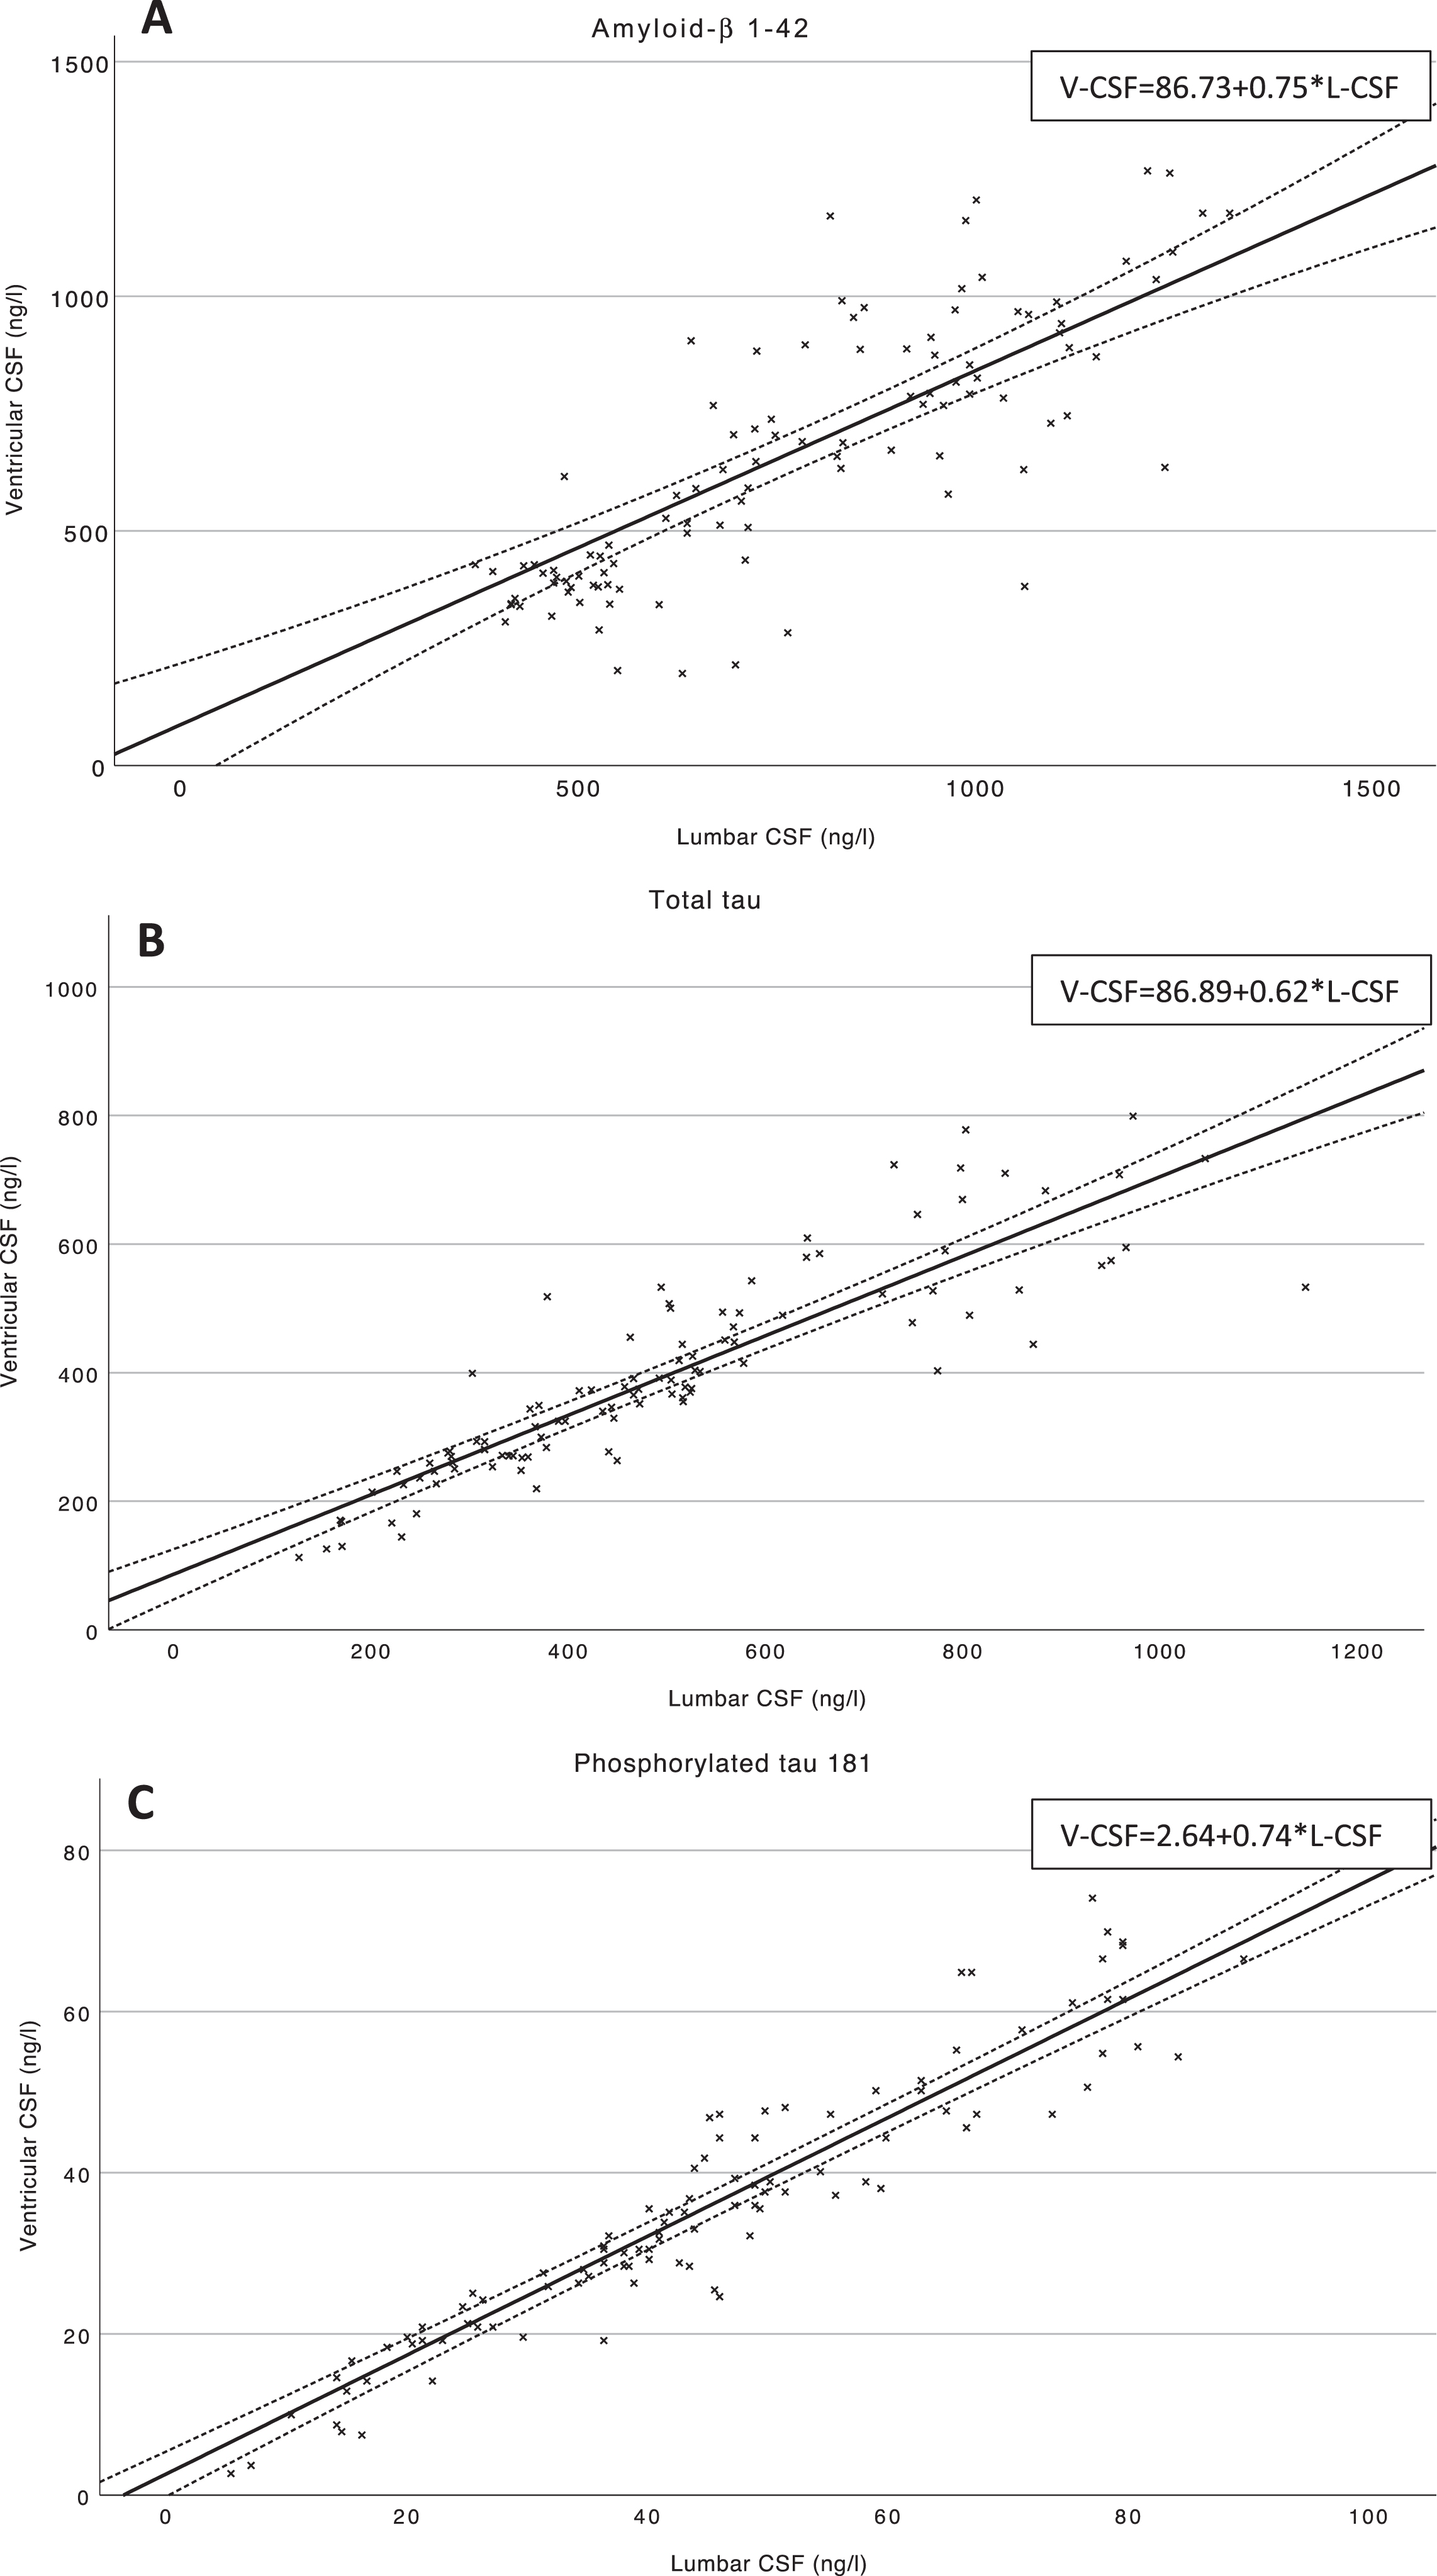
Furthermore, linear mixed effects modelling was performed to determine linear dependency for the postoperative V-CSF and L-CSF (Table 3, Fig. 4A-C). Fitted model equations are presented in Tables 3 and 4. For Aβ42, L-CSF values (B = 0.75, C.I. 0.63–0.88, p < 0.001) predicted V-CSF values significantly (pseudo R2 = 0.28) (Fig. 4A). In the multivariate model (pseudo R2 = 0.29) including L-CSF Aβ42, age, and gender, the regression equation was nearly concordant to univariate model. The L-CSF Aβ42 (B = 0.71, C.I. 0.58–0.84, p < 0.001) and patient age in years (B = –9.2, C.I. –17.4––1.1, p = 0.027) were significant predictors of V-CSF Aβ42 and patient gender was found to be non-significant (B = 24.3, C.I. –57.9–106.5, p = 0.55). With T-tau, postoperative V-CSF values were significantly predicted by postoperative L-CSF T-tau (B = 0.62, C.I. 0.55–0.68, p < 0.001) in the univariate model (pseudo R2 = 0.32) (Fig. 4B). In the multivariate model (pseudo R2 = 0.33), only L-CSF T-tau (B = 0.62, C.I. 0.55–0.69, p < 0.001) was a significant predictor of V-CSF, as the patient age (B = 0.53, C.I. –3.5–4.6, p = 0.79) and gender (B = 12.5, C.I. –28.9–53.9, p = 0.54) were non-significant. Similarly, postoperative L-CSF P-tau181 (B = 0.74, C.I. 0.69–0.78, p < 0.001) predicted simultaneous V-CSF P-tau181 values significantly (pseudo R2 = 0.45) (Fig. 4C). Further, the age (B = –0.17, C.I. –0.50–0.16, p = 0.30) and gender (B = –2.0, C.I. –5.4–1.4, p = 0.24) were non-significant and L-CSF P-tau181 (B = 0.74, C.I. 0.69–0.78, p < 0.001) significant predictors of V-CSF (pseudo R2 = 0.46).
Fig. 4A-C
Scatterplots of postoperative Aβ42, T-tau, and P-tau181 in V- and L-CSF. Scatterplots of V- and L-CSF values of the biomarkers Aβ42 (A), T-tau (B), and P-tau181 (C) and linear trendlines are illustrating the linear dependency of postoperative V- and L-CSF. Mean confidence intervals (95%) are drawn for linear trendlines. Regression equations of the linear mixed effects models are presented at upper right corner of the figure. Aβ42, amyloid-β 1-42; T-tau, total tau protein; P-Tau181, hyperphosphorylated tau at threonine 181; V-CSF, ventricular cerebrospinal fluid; L-CSF, lumbar cerebrospinal fluid.
The in vitro experiment conducted with the protocol 1, revealed minor variation in Aβ42 concentrations (Supplementary Table 1, Supplementary Figure 1A). In phases 3 and 4, the mean Aβ42 values were most decreased in comparison to the baseline (Phase 3:11%, Phase 4:22%). In the protocol 2, the sample size dependent changes were seen in Aβ42 concentrations. Lower concentrations (mean decrease of 2 ml samples: 13%) were seen when sample size was less than 5 ml (Supplementary Table 2, Supplementary Figure 1D). However, in larger sample sizes of 10–20 ml the difference came irrelevant in comparison to the baseline samples. In both protocols implemented, T-tau and P-tau181 were relatively stable and showed no sample size dependent decrease (Supplementary Tables 1 and 2, Supplementary Figure 1B, C, E, F).
DISCUSSION
Here we studied the core AD biomarkers of Aβ42, T-tau, and P-tau181 in the iNPH patients CSF. This study provides a comprehensive insight to the CSF AD-core marker composition dynamics that varies by the location and harvesting moment of the sample. The key findings are the established rostro-caudal gradients and fitted linear models for Aβ42, T-tau, and P-tau181 between [1] pre- and intraoperative L- and V-CSF and [2] postoperative L-CSF and V-CSF.
We consider our results of decreased Aβ42 and somewhat increased T-tau and P-tau181 between pre- and intraoperative CSF to support the findings reported previously (Table 1) [9, 18–20]. However, the linearity between intraoperative V-CSF samples and preoperative L-CSF samples for T-tau and P-tau181 is somewhat weaker than we expected. The reason behind the rather exponential increase of T-tau is probably a immediate trauma caused by surgical insertion of the intraventricular CSF catheter trough brain parenchyma [27, 28]. In the study obtaining brain interstitial fluid by microdialysis [29], similar pattern was seen for T-tau, as the insertion resulted high T-tau concentrations that decreased over the collection period of 24 h. Further, the studies comparing T-tau in preoperative tap-test L-CSF and in intraoperative V-CSF report 2 to 6-fold higher concentration in V-CSF [9, 18, 19]. Other studies comparing the first and last fractions of lumbar tap-test CSF [19, 30], only found significant ratio of 1.2 between the last/first fraction of CSF T-tau [19]. However, these results do not completely exclude the chance that further draining of CSF would result similar gradients as reported in studies comparing L-CSF and intraoperative V-CSF. As expected, our P-tau181 results had similar trend as T-tau. These findings are presenting the potential challenges in the interpretation of CSF T-tau and P-tau181 harvested during surgical procedure.
On the other hand, we assume that a waiting time for shunt surgery can cumulate, e.g., the periventricular ischemic damage, as worse outcomes have been reported with prolonged waiting time [6], and therefore potentially cause discrepancy to interpretation of the intraoperative CSF biomarkers. However, we could not find correlation for shunt surgery waiting time and V-CSF Aβ42, T-tau, or P-tau181 measured intraoperatively. After all, this was not surprising as our median waiting time was rater short (2.0 months, interquartile range 1.1–3.5 months) in the cohort of 97 patients.
Furthermore, simultaneous postoperative V- and L-CSF biomarkers are largely unstudied scheme due to the ethically challenging study implementation. Our results suggest a transition of T-tau and P-tau181 VLRs as the postoperative gradient is 0.77–0.79, respectively (Fig. 2). Somewhat supporting results of T-tau VLR being under 1 between postoperative shunt reservoir V-CSF and L-CSF, have been reported previously [9]. For Aβ42, we observed approximating concentrations in V- and L-CSF as the VLR converted from 0.54 to 0.85, and this was mainly driven by the increased concentration of V-CSF Aβ42 postoperatively. Contrary to Craven et al. [9], our Aβ42 in V-CSF measured lower than in L-CSF. This difference might derive from the rather small number of patients in the postoperative CSF comparison of the previous publication. We consider this Aβ42 change to represent beneficial shunt response and improved homeostasis maintenance of brain parenchyma, driven by increased Aβ42 excretion to CSF. For the reason of the VLR transition to less than 1 postoperatively in T-tau and P-tau181, we suggest the sampling modality of the shunt reservoir puncture. It can be considered as non-traumatic draining of CSF, as no direct harm is caused to brain parenchyma. Therefore, potentially more reliable results are received. Other explanations for this gradient transition seen with T-tau and P-tau181, might be caused either by the altered CSF flow resulting from CSF shunt [31] or inhibition of the fundamental NPH pathology that is not yet completely understood. We have also reported that Aβ42, T-tau, and P-tau181 do not remain stable post-operative [17]. However, the VLRs of the parallel samples in every biomarker do maintain the ratio and rostro-caudal gradient throughout the follow-up.
Reasons behind the rostro-caudal gradient of proteins in CSF are somewhat hypothesized, and the composition of CSF is suggested to alter due the protein origin, molecular mass, and CSF-dynamic disorders. The brain parenchyma derived proteins should be enriched in ventricular, and blood derived in lumbar CSF [16]. The albumin and blood derived IgG, IgA, and IgM quantities have been reported to decrease when further draining lumbar CSF of iNPH patients [32] and in healthy controls [33]. With central nervous system specific proteoglycans, neurocan, and brevican, no significant ventriculo-lumbar gradient were seen pre- or postoperatively [34]. However, this assumption is not met completely in our results with iNPH patients, as the post-operative Aβ42, T-tau, and P-tau181 VLRs are all less than 1. Contrary, the ratios seen between preoperative lumbar and intraoperative ventricular CSF for T-tau and P-tau181 are largely inclined towards high rostral concentration (Fig. 2B, C), which supports the traditional theory about the influence of protein origin.
The role of altered hydrodynamics is also a potential confounding factor for interpretation of biomarker ratios. Naturally, the CSF shunt surgery alters the CSF drainage as well as modifies the hydrostatic pressure affecting the natural CSF flow. Further, unoperated iNPH patients have been found to have different flow pattern of CSF, as re-directed aqueductal flow, and significant extra-cranial CSF productions have been suggested [35, 36]. In addition, the pathophysiology of iNPH itself has been suggested to originate from the malfunction of arachnoid granules, that potentially further modifies the CSF composition. Other iNPH pathological mechanism led from the hydrodynamics is the glymphatic pathway defect. Approximately 20% of CSF drainage to the systemic circulation is derived from the glymphatic system, and for iNPH patients, the glymphatic pathway has been reported to potentially be impaired by decreased aquaporin-4 density and tracer clearance in MRI imaging [37].
Furthermore, the dilution effect of increased ventricular volume or CSF production rate has been discussed as a reason for altered CSF AD biomarker compositions. In the study regarding disproportionately enlarged subarachnoid-space hydrocephalus (DESH) patients, a subset was noted to have low P-tau181 and Aβ42 and to associate for higher DESH-score [38], implying CSF-dynamics disorders to potentially dilute biomarker concentrations. However, a study conducted with healthy volunteers found no correlation between AD core biomarkers and ventricular volume nor the intracranial pressure and CSF production rate [39]. In a recent genome wide meta-analysis, a link between CSF P-tau181, lateral ventricle volume and the genes of GMNC and C16orf95 was established, implying causative relationship for these phenomena [40].
Furthermore, to our knowledge the direct effect of the CSF shunt as such to the biomarker concentrations, has not been studied previously. It can be hypothesized that CSF shunt may affect to the biomarker concentrations, e.g., due to the absorption of CSF shunt material or the different protocol used during the harvesting. Hence, we conducted additional in vitro experiment with two protocols to evaluate these potential confounding factors affecting the usage of ventricular CSF and to fully mimic the sampling procedures of intraventricular CSF (Supplementary Tables 3 and 4). Based on our results the Aβ42 has slight tendency to absorb to polypropene syringe. However, the impact of this phenomenon becomes insignificant in larger sample sizes of over 5 ml. There was also a trend for Aβ42 to decrease between baseline and endpoint samples. Further, the changes of concentrations caused by the sample size and protocol became irrelevant when compared to the endpoint values rather than baseline. For T-tau and P-tau181, no relevant changes were seen neither in shunt system protocol nor in the sample size protocol. This further strengthens the reliability of T-tau and P-tau181 concentrations measured from V-CSF.
Previously, we found several fold increases in T-tau and P-tau181, post-operatively, both in ventricular and lumbar CSF [17]. In Aβ42 there was just a moderate continuous decrease. However, further study is needed to fully understand this longitudinal phenomenon caused by CSF shunt. Understanding more of this could also open a window to find shunt malfunction by biomarkers. In addition, the further information would be crucially important to evaluate value of AD biomarker values taken after surgery when attempt to indicate AD comorbidity. So far, we rely more on to prognostic value of brain biopsy than the post-operative follow-up CSF biomarker values.
A strength of this study was that it was possible to compare a series of parallel samples postoperatively. Additionally, our pre- to intraoperative CSF biomarker comparison had a relatively large number of samples. Furthermore, our samples obtained by shunt reservoir puncture were larger than 5 ml, corroborating the reliability of our results. A challenge, however, was the inability to rigorously confine the magnitude of the error for T-tau and P-tau181 due to the surgical procedure in the intraoperative sampling. This should be considered when interpreting the obtained equations. This kind of sample collection provides a foundation for the subsequent calculation of similar equations for other CSF biomarkers as well.
Conclusions
Aβ42, T-tau, and P-tau181 correlate linearly in-between ventricular and lumbar CSF, correlations that become stronger after CSF shunt surgery. Based on these findings, regression equations of fitted models provide a novel tool to use V-CSF for diagnostic and prognostic entities that rely on lumbar CSF-derived reference limits and/or cut-points. The equations presented here can be applicable to clinical use when lumbar CSF samples are not available or the less invasively obtained shunt reservoir samples should be interpreted.
ACKNOWLEDGMENTS
We would like to acknowledge Marita Parviainen, RN, for assistance and cognitive testing.
The study was funded by Janssen R&D, a division of Janssen Pharmaceutica NV (no specified grant number), Kuopio University Hospital VTR fund (Grant number: 5252614), Academy of Finland (#339767, 338182), Sigrid Juselius Foundation (no specified grant number), the Strategic Neuroscience Funding of the University of Eastern Finland, and the Finnish Cultural Foundation, North Savo Regional Fund (No specified grant number). HL is supported by grants from Maire Taponen Foundation and The Finnish Medical Foundation. HZ is a Wallenberg Scholar supported by grants from the Swedish Research Council (#2018-02532), the European Research Council (#681712 and #101053962), Swedish State Support for Clinical Research (#ALFGBG-71320), the Alzheimer Drug Discovery Foundation (ADDF), USA (#201809-2016862), the AD Strategic Fund and the Alzheimer’s Association (#ADSF-21-831376-C, #ADSF-21-831381-C and #ADSF-21-831377-C), the Olav Thon Foundation, the Erling-Persson Family Foundation, Stiftelsen för Gamla Tjänarinnor, Hjärnfonden, Sweden (#FO2019-0228), the European Union’s Horizon 2020 research and innovation programme under the Marie Skłstrokodowska-Curie grant agreement No 860197 (MIRIADE), the European Union Joint Programme –Neurodegenerative Disease Research (JPND2021-00694), and the UK Dementia Research Institute at UCL (UKDRI-1003). KB is supported by the Swedish Research Council (#2017-00915), the Alzheimer Drug Discovery Foundation (ADDF), USA (#RDAPB-201809-2016615), the Swedish Alzheimer Foundation (#AF-930351, #AF-939721 and #AF-968270), Hjärnfonden, Sweden (#FO2017-0243 and #ALZ2022-0006), the Swedish state under the agreement between the Swedish government and the County Councils, the ALF-agreement (#ALFGBG-715986 and #ALFGBG-965240), and European Union Joint Program for Neurodegenerative Disorders (JPND2019-466-236), and the Alzheimer’s Association 2021 Zenith Award (ZEN-21-848495).
Authors’ disclosures available online (https://www.j-alz.com/manuscript-disclosures/22-0652r1).
SUPPLEMENTARY MATERIAL
[1] The supplementary material is available in the electronic version of this article: https://dx.doi.org/10.3233/JAD-220652.
REFERENCES
[1] | Relkin N , Marmarou A , Klinge P , Bergsneider M , Black PM ((2005) ) Diagnosing idiopathic normal-pressure hydrocephalus. Neurosurgery 57: , S2–4–S2–16. |
[2] | Mori E , Ishikawa M , Kato T , Kazui H , Miyake H , Miyajima M , Nakajima M , Hashimoto M , Kuriyama N , Tokuda T , Ishii K , Kaijima M , Hirata Y , Saito M , Arai H ((2012) ) Guidelines for management of idiopathic normal pressure hydrocephalus: Second edition. Neurol Med Chir (Tokyo) 52: , 775–778. |
[3] | Jaraj D , Rabiei K , Marlow T , Jensen C , Skoog I , Wikkelsø C ((2014) ) Prevalence of idiopathic normal-pressure hydrocephalus. Neurology 82: , 1449–1454. |
[4] | Andersson J , Rosell M , Kockum K , Lilja-Lund O , Söderström L , Laurell K ((2019) ) Prevalence of idiopathic normal pressure hydrocephalus: A prospective, population based study. PLoS One 14: , e0217705. |
[5] | Andrén K , Wikkelsø C , Tisell M , Hellström P ((2014) ) Natural course of idiopathic normal pressure hydrocephalus. J Neurol Neurosurg Psychiatry 85: , 806–810. |
[6] | Andrén K , Wikkelsø C , Hellström P , Tullberg M , Jaraj D ((2021) ) Early shunt surgery improves survival in idiopathic normal pressure hydrocephalus. Eur J Neurol 28: , 1153–1159. |
[7] | Klinge P , Hellström P , Tans J , Wikkelsø C ((2012) ) One-year outcome in the European multicentre study on iNPH. Acta Neurol Scand 126: , 145–153. |
[8] | Leinonen V , Koivisto AM , Alafuzoff I , Pyykk OT , Rummukainen J , Von Und Zu Fraunberg M , Jskelinen JE , Soininen H , Rinne J , Savolainen S ((2012) ) Cortical brain biopsy in long-term prognostication of 468 patients with possible normal pressure hydrocephalus. Neurodegener Dis 10: , 166–169. |
[9] | Craven CL , Baudracco I , Zetterberg H , Lunn MPT , Chapman MD , Lakdawala N , Watkins LD , Toma AK ((2017) ) The predictive value of T-tau and Aβ1-42 levels in idiopathic normal pressure hydrocephalus. Acta Neurochir (Wien) 159: , 2293–2300. |
[10] | Jeppsson A , Wikkelsö C , Blennow K , Zetterberg H , Constantinescu R , Remes AM , Herukka SK , Rauramaa T , Nagga K , Leinonen V , Tullberg M ((2019) ) CSF biomarkers distinguish idiopathic normal pressure hydrocephalus from its mimics. J Neurol Neurosurg Psychiatry 90: , 1117–1123. |
[11] | Chen Z , Liu C , Zhang J , Relkin N , Xing Y , Li Y ((2017) ) Cerebrospinal fluid Aβ42, t-tau, and p-tau levels in the differential diagnosis of idiopathic normal-pressure hydrocephalus: A systematic review and meta-analysis. Fluids Barriers CNS 14: , 1–13. |
[12] | Manniche C , Hejl AM , Hasselbalch SG , Simonsen AH ((2019) ) Cerebrospinal fluid biomarkers in idiopathic normal pressure hydrocephalus versus Alzheimer’s disease and subcortical ischemic vascular disease: A systematic review. J Alzheimers Dis 68: , 267–279. |
[13] | Jingami N , Asada-Utsugi M , Uemura K , Noto R , Takahashi M , Ozaki A , Kihara T , Kageyama T , Takahashi R , Shimohama S , Kinoshita A ((2015) ) Idiopathic normal pressure hydrocephalus has a different cerebrospinal fluid biomarker profile from alzheimer’s disease. J Alzheimers Dis 45: , 109–115. |
[14] | Thavarajasingam SG , El-Khatib M , Vemulapalli KV , Iradukunda HAS , Laleye J , Russo S , Eichhorn C , Eide PK ((2022) ) Cerebrospinal fluid and venous biomarkers of shunt-responsive idiopathic normal pressure hydrocephalus: A systematic review and meta-analysis. Acta Neurochir (Wien) 164: , 1719–1746. |
[15] | Lukkarinen H , Jeppsson A , Wikkelsö C , Blennow K , Zetterberg H ((2022) ) Cerebrospinal fluid biomarkers that reflect clinical symptoms in idiopathic normal pressure hydrocephalus patients. Fluids Barriers CNS 19: , 11. |
[16] | Reiber H ((2001) ) Dynamics of brain-derived proteins in cerebrospinal fluid. Clin Chim Acta 310: , 173–186. |
[17] | Lukkarinen H , Tesseur I , Pemberton D , Van Der Ark P , Timmers M , Slemmon R , Janssens L , Streffer J , Van Nueten L , Bottelbergs A , Rauramaa T , Koivisto AM , Herukka SK , Korhonen VE , Junkkari A , Hiltunen M , Engelborghs S , Blennow K , Zetterberg H , Kolb HC , Leinonen V ((2021) ) Time trends of cerebrospinal fluid biomarkers of neurodegeneration in idiopathic normal pressure hydrocephalus. J Alzheimers Dis 80: , 1629–1642. |
[18] | Jeppsson A , Zetterberg H , Blennow K , Wikkelsø C ((2013) ) Idiopathic normal-pressure hydrocephalus pathophysiology and diagnosis by CSF biomarkers. Neurology 80: , 1385–1392. |
[19] | Jingami N , Uemura K , Asada-Utsugi M , Kuzuya A , Yamada S , Ishikawa M , Kawahara T , Iwasaki T , Atsuchi M , Takahashi R , Kinoshita A ((2019) ) Two-point dynamic observation of Alzheimer’s disease cerebrospinal fluid biomarkers in idiopathic normal pressure hydrocephalus. J Alzheimers Dis 72: , 271–277. |
[20] | Brandner S , Thaler C , Lelental N , Buchfelder M , Kleindienst A , Maler JM , Kornhuber J , Lewczuk P ((2014) ) Ventricular and lumbar cerebrospinal fluid concentrations of Alzheimer’s disease biomarkers in patients with normal pressure hydrocephalus and posttraumatic hydrocephalus. J Alzheimers Dis 41: , 1057–1062. |
[21] | Tarnaris A , Toma AK , Chapman MD , Petzold A , Keir G , Kitchen ND , Watkins LD ((2011) ) Rostrocaudal dynamics of CSF biomarkers. Neurochem Res 36: , 528–532. |
[22] | Junkkari A , Luikku AJ , Danner N , Jyrkkänen HK , Rauramaa T , Korhonen VE , Koivisto AM , Nerg O , Kojoukhova M , Huttunen TJ , Jääskeläinen JE , Leinonen V ((2019) ) The Kuopio idiopathic normal pressure hydrocephalus protocol: Initial outcome of 175 patients. Fluids Barriers CNS 16: , 21. |
[23] | Kubo Y , Kazui H , Yoshida T , Kito Y , Kimura N , Tokunaga H , Ogino A , Miyake H , Ishikawa M , Takeda M ((2007) ) Validation of grading scale for evaluating symptoms of idiopathic normal-pressure hydrocephalus. Dement Geriatr Cogn Disord 25: , 37–45. |
[24] | Bittner T , Zetterberg H , Teunissen CE , Ostlund RE , Militello M , Andreasson U , Hubeek I , Gibson D , Chu DC , Eichenlaub U , Heiss P , Kobold U , Leinenbach A , Madin K , Manuilova E , Rabe C , Blennow K ((2016) ) Technical performance of a novel, fully automated electrochemiluminescence immunoassay for the quantitation of β-amyloid (1-42) in human cerebrospinal fluid. Alzheimers Dement 12: , 517–526. |
[25] | Lifke V , Kollmorgen G , Manuilova E , Oelschlaegel T , Hillringhaus L , Widmann M , von Arnim CAF , Otto M , Christenson RH , Powers JL , Shaw LM , Hansson O , Doecke JD , Li QX , Teunissen C , Tumani H , Blennow K ((2019) ) Elecsys® total-tau and phospho-tau (181P) CSF assays: Analytical performance of the novel, fully automated immunoassays for quantification of tau proteins in human cerebrospinal fluid. Clin Biochem 72: , 30–38. |
[26] | Willemse EAJ , van Maurik IS , Tijms BM , Bouwman FH , Franke A , Hubeek I , Boelaarts L , Claus JJ , Korf ESC , van Marum RJ , Roks G , Schoonenboom N , Verwey N , Zwan MD , Wahl S , van der Flier WM , Teunissen CE ((2018) ) Diagnostic performance of Elecsys immunoassays for cerebrospinal fluid Alzheimer’s disease biomarkers in a nonacademic multicenter memory clinic cohort: The ABIDE project. Alzheimers Dement (Amst) 10: , 563–572. |
[27] | Kruse A , Cesarini KG , Bach FW , Persson L ((1991) ) Increases of neuron-specific enolase, S-100 protein, creatine kinase and creatine kinase BB isoenzyme in CSF following intraventricular catheter implantation. Acta Neurochir (Wien) 110: , 106–109. |
[28] | Pyykkö OT , Lumela M , Rummukainen J , Nerg O , Seppälä TT , Herukka SK , Koivisto AM , Alafuzoff I , Puli L , Savolainen S , Soininen H , Jääskeläinen JE , Hiltunen M , Zetterberg H , Leinonen V ((2014) ) Cerebrospinal fluid biomarker and brain biopsy findings in idiopathic normal pressure hydrocephalus. PLoS One 9: , 3. |
[29] | Herukka SK , Rummukainen J , Ihalainen J , Von Und Zu Fraunberg M , Koivisto AM , Nerg O , Puli LK , Seppälä TT , Zetterberg H , Pyykkö OT , Helisalmi S , Tanila H , Alafuzoff I , Hiltunen M , Rinne J , Soininen H , Jääskeläinen JE , Leinonen V ((2015) ) Amyloid-β and tau dynamics in human brain interstitial fluid in patients with suspected normal pressure hydrocephalus. J Alzheimers Dis 46: , 261–269. |
[30] | Djukic M , Spreer A , Lange P , Bunkowski S , Wiltfang J , Nau R ((2016) ) Small cisterno-lumbar gradient of phosphorylated Tau protein in geriatric patients with suspected normal pressure hydrocephalus. Fluids Barriers CNS 13: , 15. |
[31] | Ringstad G , Emblem KE , Eide PK ((2016) ) Phase-contrast magnetic resonance imaging reveals net retrograde aqueductal flow in idiopathic normal pressure hydrocephalus. J Neurosurg 124: , 1850–1857. |
[32] | Konen FF , Lange P , Wurster U , Jendretzky KF , Gingele S , Möhn N , Sühs K-W , Stangel M , Skripuletz T , Schwenkenbecher P ((2022) ) The influence of the ventricular-lumbar gradient on cerebrospinal fluid analysis in serial samples. Brain Sci 12: , 410. |
[33] | Blennow K , Fredman P , Wallin A , Gottfries CG , Långström G , Svennerholm L ((1993) ) Protein analyses in cerebrospinal fluid. I. Influence of concentration gradients for proteins on cerebrospinal fluid/serum albumin ratio. Eur Neurol 33: , 126–128. |
[34] | Minta K , Jeppsson A , Brinkmalm G , Portelius E , Zetterberg H ((2021) ) Lumbar and ventricular CSF concentrations of extracellular matrix proteins before and after shunt surgery in idiopathic normal pressure hydrocephalus. Fluids Barriers CNS 18: , 23. |
[35] | Eide PK , Valnes LM , Lindstrøm EK , Mardal KA , Ringstad G ((2021) ) Direction and magnitude of cerebrospinal fluid flow vary substantially across central nervous system diseases. Fluids Barriers CNS 18: , 16. |
[36] | Lindstrøm EK , Ringstad G , Mardal KA , Eide PK ((2018) ) Cerebrospinal fluid volumetric net flow rate and direction in idiopathic normal pressure hydrocephalus. Neuroimage Clin 20: , 731–741. |
[37] | Reeves BC , Karimy JK , Kundishora AJ , Mestre H , Cerci HM , Matouk C , Alper SL , Lundgaard I , Nedergaard M , Kahle KT ((2020) ) Glymphatic system impairment in Alzheimer’s disease and idiopathic normal pressure hydrocephalus. Trends Mol Med 26: , 285–295. |
[38] | Graff-Radford J , Jones DT , Wiste HJ , Cogswell PM , Weigand SD , Lowe V , Elder BD , Vemuri P , Van Harten A , Mielke MM , Knopman DS , Graff-Radford NR , Petersen RC , Jack CR , Gunter JL ((2022) ) Cerebrospinal fluid dynamics and discordant amyloid biomarkers. Neurobiol Aging 110: , 27–36. |
[39] | Edsbagge M , Andreasson U , Ambarki K , Wikkelso C , Eklund A , Blennow K , Zetterberg H , Tullberg M ((2017) ) Alzheimer’s disease-associated cerebrospinal fluid (CSF) biomarkers do not correlate with CSF volumes or CSF production rate. J Alzheimers Dis 58: , 821–828. |
[40] | Jansen IE , van der Lee SJ , Gomez-Fonseca D , de Rojas I , Dalmasso MC , Grenier-Boley B , Zettergren A , Mishra A , Ali M , Andrade V , et al. ((2022) ) Genome-wide meta-analysis for Alzheimer’s disease cerebrospinal fluid biomarkers. Acta Neuropathol 144: , 821–842. |


