
Brain 11β-Hydroxysteroid Dehydrogenase Type 1 Occupancy by Xanamem™ Assessed by PET in Alzheimer’s Disease and Cognitively Normal Individuals
Abstract
Background:
11β-hydroxysteroid dehydrogenase type 1 (11β-HSD1) regulates intracellular cortisol and its inhibition by the small molecule inhibitor, Xanamem™, may provide a disease-modifying strategy for Alzheimer’s disease (AD). Animal models suggest a range of 30–60% enzyme inhibition may suffice to provide neuroprotection.
Objective:
To determine the regional brain occupancy of 11β-HSD1 by Xanamem™ in cognitively normal participants (CN) and mild cognitive impairment (MCI)/mild AD patients to investigate potential dosing ranges for future efficacy studies.
Methods:
Seventeen MCI/AD and 23 CN were included. Regional brain time-activity curves (TAC), standardized uptake values (SUV40–60) and volume of distribution (VT) from Logan plot with image derived input function from 11C-TARACT positron emission tomography (PET) were used to assess the degree of 11β-HSD1 occupancy by increasing doses of Xanamem™ (5 mg, 10 mg, 20 mg or 30 mg daily for 7 days).
Results:
All measures showed high 11β-HSD1 occupancy with Xanamem to similar degree in CN and MCI/AD. The dose-response relationship was relatively flat above 5 mg. Respective median (interquartile range [Q1-Q3]) 11β-HSD1 occupancy in the MCI/AD and CN groups after treatment with 10 mg Xanamem were 80% [79–81%] and 75% [71–76%] in the neocortex, 69% [64–70%] and 61% [52–63%] in the medial temporal lobe, 80% [79–80%] and 73% [68–73%] in the basal ganglia, and 71% [67–75%] and 66% [62–68%] in the cerebellum.
Conclusions:
TAC, SUV40–60, and VT measures indicate Xanamem achieves high target occupancy levels with near saturation at 10 mg daily. These data support exploration of doses of≤10 mg daily in future clinical studies.
INTRODUCTION
Dementia affected an estimated 55.2 million people globally in 2020, 60–70% of whom had Alzheimer’s disease (AD) [1, 2]. In tandem with increasing longevity, this number is anticipated to grow to 139 million in 2050, with the greatest increases in low- and middle-income countries [1]. Yet in contrast to other leading life-threatening conditions, there is a paucity of disease-modifying treatments to stem the progression of AD. Indeed, currently widely used AD therapeutics (donepezil, rivastigmine, galantamine, memantine) only provide symptomatic benefit [3–6]. The recently approved antibody therapies, aducanumab and lecanemab, are the first AD drugs with disease-modifying effect but are not without risk of serious adverse effects [7, 8]. While much remains to be elucidated in our understanding of AD, it has been long reported that chronically elevated cortisol levels in the blood and the brain are associated with cognitive impairment, hippocampal atrophy, and amyloid-β plaques, three hallmarks of AD [9–12].
Cortisol levels are regulated by the hypothalamic-pituitary-adrenal (HPA) axis, which responds to physical and environmental stress by increasing cortisol levels in the blood; when the HPA is dysregulated, chronically elevated cortisol may be toxic to brain neurons, as is the case in depression, and with advancing age (≥65 years) [13–15]. The central role of cortisol in AD pathology was first demonstrated in animal models, where chronic hippocampal cortisol exposure in primates or treatment of rodents with glucocorticoids was associated with hippocampal shrinkage and dendritic regression or atrophy; rodents also show a concomitant increase in amyloid-β plaque formation [9, 16, 17]. Healthy elderly people with elevated cortisol levels are significantly more likely to develop AD than those with low cortisol levels, with faster declines in global cognition, episodic memory, and executive function [12, 18, 19]. The level of cortisol elevation also correlates with the degree of observed hippocampal atrophy [11]. Indeed, individuals with Cushing’s disease experience a reversal of hippocampal atrophy following treatment that normalizes their cortisol level [20].
Locally enhanced cortisol in the brain arises from the activity of 11β-HSD1, the enzyme responsible for the regeneration of cortisol via the reduction of inactive cortisone to active cortisol [21–23]. In humans, 11β-HSD1 is expressed in liver, adipose, and brain tissue; it is highly expressed in brain regions associated with cognition and memory, including the hippocampus, frontal cortex, and cerebellum [21–24]. Evidence from studies in both rodents and humans demonstrates that 11β-HSD1 overexpression is causal for cognitive decline, and that regulation of cortisol levels via inhibition of 11β-HSD1 may provide a disease-modifying therapeutic strategy for treating AD and other conditions where cognitive impairment or cortisol excess is a major component of the disease [21, 23, 25–28]. In aged wild-type rodents and young rodents of the Tg2576 model of AD, selective pharmacologic inhibition of 11β-HSD1 improved cognition [26–28]. The direct effects of 11β-HSD1 are shown even more demonstrably in two strains of mice in which the gene for 11β-HSD1 has been removed: knock-out mice are protected against glucocorticoid-associated, age-related cognitive decline, and have enhanced synaptic potentiation in the aged hippocampus [22, 23, 29]. These effects are apparent with only partial inhibition of 11β-HSD1 activity; 30% to 60% reductions in aging mice and the Tg2576 AD mouse model due to selective inhibitors (UE1961 and UE2316) was associated with improvements in cognitive function and prevention of cognitive decline [27, 28]. Similar results were seen in 11β-HSD1+/- heterozygous mice [28].
The original proof-of-concept study for non-selective 11β-HSD inhibition was a small crossover study in 22 people with the enzyme inhibitor carbenoxolone, which improved verbal fluency and memory at 4 to 6 weeks compared to placebo in healthy elderly men and in patients with type 2 diabetes. However, concurrent inhibition of HSD2 by carbenoxolone resulted in commonly observed side effects such as renal sodium retention, limiting its potential as a cognitive therapeutic. Therefore, Xanamem™, a small-molecule selective inhibitor of 11β-HSD1 [21, 24], was developed. It displays high potency and selectivity for human 11β-HSD1 when compared to related hydroxysteroid dehydrogenase enzymes and receptors, is brain-penetrant, and has a promising safety profile [21]. Xanamem has a terminal half-life of 10 to 14 h and would be expected to reach steady state levels with daily dosing after 5 days [21].
In the present study we used PET imaging to determine the degree to which Xanamem blocked binding to 11β-HSD1 of a recently developed radiotracer, 11C-TARACT, that specifically and reversibly binds 11β-HSD1. [11C]-4-(5-(2-chlorophenyl)-4-methyl-4H-1,2,4-triazol-3-yl)-1-methyl-1H-indole (11C-TARACT) was developed by Merck Research Laboratories, Lansdale, Pennsylvania [30]. Saturation binding studies demonstrated that [3H]TARACT binds to a single site with high affinity in rhesus monkey and human brain (Kd 0.6 nM and BMax 25.4 nM in human cerebellar cortex) matching the literature-reported distribution of 11β-HSD1. Baseline PET imaging in rhesus monkeys showed good brain uptake matching the known distribution of 11β-HSD1 and high blockade and displacement by known 11β-HSD1 inhibitors. Lead profile receptor screening carried out by Eurofins Panlabs Taiwan showed only three of the 68 tested assays had greater than 50% inhibition at 10μM and these were Adrenergic α1A, Adrenergic α1B, and Serotonin (5-Hydroxytryptamine) 5-HT2B. However, none showed 100% inhibition at 10μM. A single dose acute safety study of TARACT in male and female Sprague Dawley rats showed no sign of toxicity or concern for safety over 14 days in both male and female rats after allometrically scaling dose levels 100-fold to 1000-fold for a human dose level. Cytotoxicity and mutagenicity tests were negative. Consequently 11C-TARACT was approved for use in this study by the Austin Health Human Research Ethics Committee.
We hypothesized that Xanamem blockade of 11C-TARACT binding to 11β-HSD1 would occur in a dose-dependent manner. As well as providing a detailed understanding of target occupancy of Xanamem in the brain, results from this study could be used to guide dose ranges for future efficacy studies of Xanamem. The primary objective of the study was to characterize 11β-HSD1 occupancy by Xanamem at four dose levels (5 mg, 10 mg, 20 mg, and 30 mg daily for 7 days), before and after Xanamem in different regions of the brain, in AD patients, participants with mild cognitive impairment (MCI) due to AD and in elderly cognitively normal (CN) participants. The primary outcome measure was the difference in brain global and regional 11C-TARACT binding to 11β-HSD1, measured before and after 7 consecutive days of administration of Xanamem.
MATERIALS AND METHODS
Study design
In this cross-sectional, open-label, single-center study conducted at Austin Health, oral Xanamem was administered once daily in the morning (mane) for 7 days at four different dose levels (5 mg, 10 mg, 20 mg, or 30 mg) or once daily at night (nocte) for 7 days at 10 mg (Fig. 1).
Each mane dose-level cohort contained four to five participants who were diagnosed with AD or MCI due to AD (MCI/AD group), and another four to five participants who were cognitively normal (CN group). Prior to beginning treatment with Xanamem, in order to obtain a baseline assessment of 11C-TARACT binding to different regions of the brain, participants underwent a 90-min dynamic PET acquisition after injection of 370 MBq of 11C-TARACT. Participants then received oral Xanamem as a single capsule at the dose to which they had been assigned for the 7-day regimen. The mane dosing was administered in the morning, 30 min post breakfast beginning 1–14 days following the first PET scan. Participants kept a drug intake diary to support monitoring of treatment compliance. On Day 7 of the Xanamem regimen, approximately 4 to 7 h after the final oral dose, participants underwent a second 11C-TARACT PET scan, to assess the degree of 11C-TARACT binding to 11β-HSD1. 11β-HSD1 binding in the second PET scan conducted at the end of the study was compared with the baseline PET scan. Participants received a follow-up phone call within 5 to 7 business days after the 2nd PET scan, to confirm their wellbeing and collect information about any new adverse events (AEs) (Fig. 1).
Fig. 1
Timeline for the study. The study timeline is depicted horizontally, with description of purpose of each study visit and the day of the 8-day study shown above the timeline. Study days are shown based on whether the MRI was conducted at the screening visit, or at a second study visit scheduled for the following day (shown in parentheses). Below the timeline are the study visit number, and cardinal study milestones.
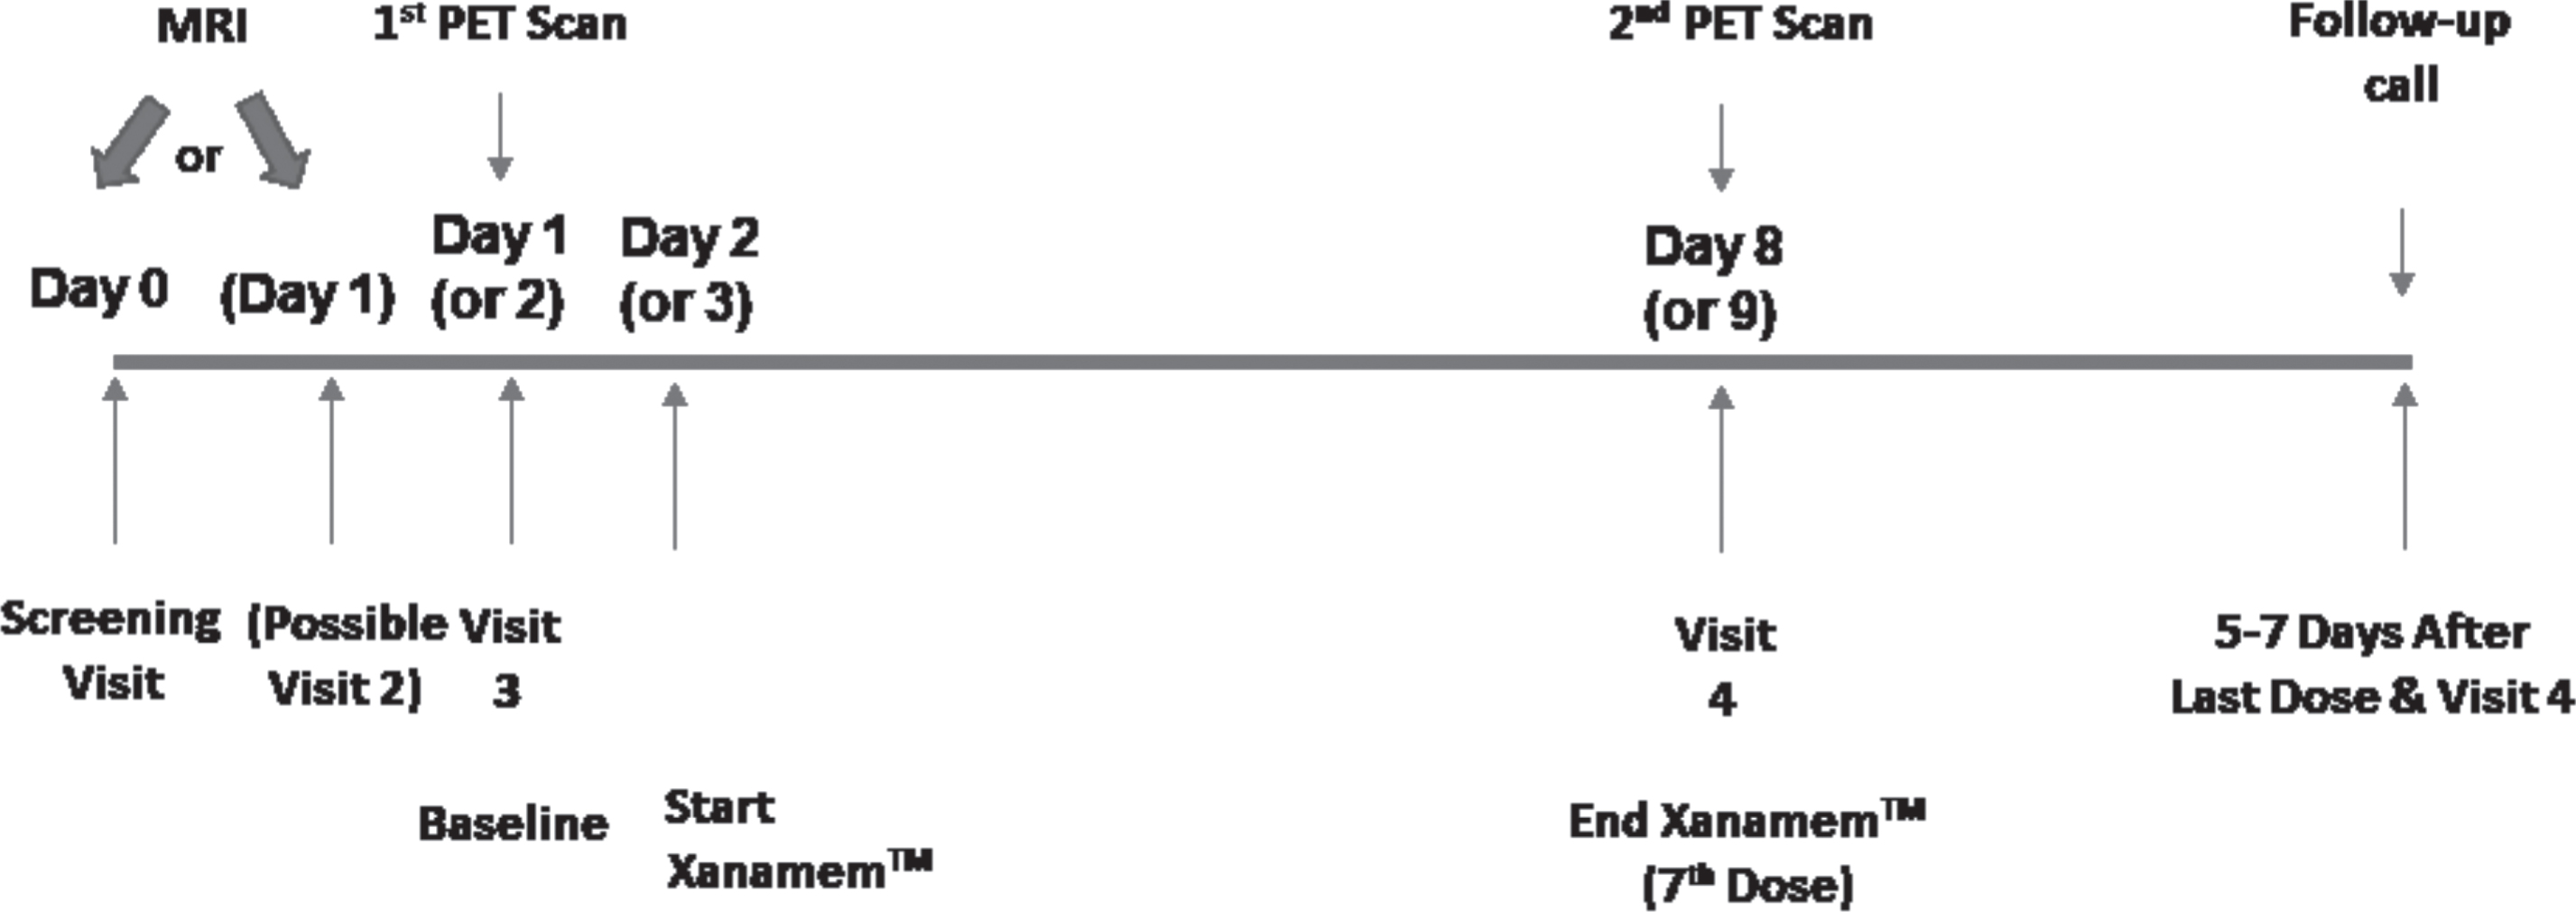
The four CN participants in the 10 mg nocte sub-study were treated identically except dosing was at 8 PM daily; the second PET scan was conducted in the afternoon of the day following the final dose (approximately 16–18 h post dose). All other aspects of the study design were identical except for the timing of drug administration.
11C-TARACT binding blockade by Xanamem was assessed by comparison of the 11C-TARACT time-activity curves (TAC), the standardized uptake value at 40–60 min post-injection (SUV40–60), and volume of distribution (VT) calculated by Logan plot with an image derived input function (IDIF).
Participants
The study enrolled males and females > 60 years old: 23 in the CN group and 17 in the MCI/AD group. MCI due to AD, was determined as by the Second International Working Group (IWG2) criteria (i.e. cognitive decline with abnormal episodic memory and a positive amyloid biomarker) [31]. Participants were screened and enrolled beginning April 17, 2019 until May 18, 2021.
Participants were included if they were had no significant abnormalities in vital signs within 28 days prior to receiving the first dose of Xanamem on Day 1, spoke English, and had > 7 years of formal education. Participants in the MCI/AD group were also required to have a reliable caregiver capable of providing correct information about the patient’s clinical symptoms. Participants were excluded from participating if they were currently drug/alcohol dependent, had a history of cancer (except skin or in situ prostate cancer) within two years of the study start date, had a medical condition that affected clinical assessment (i.e., chronic renal failure, chronic hepatic disease, severe pulmonary disease), were contraindicated for PET or MRI scans, were receiving antidepressants, cold/flu tablets, or opioid agonist medication, or had clinical evidence of peripheral neuropathy or known clinically significant nerve conduction abnormalities.
This study was performed in conformity with the guidelines of the 18th World Medical Assembly in Helsinki (1964) with additions from the 29th, 35th, 41st, and 48th World Medical Assemblies (held in Tokyo 1975, Venice 1983, Hong Kong 1989, and Somerset West 1996). The study protocol was approved by the Austin Health Human Research Ethics Committee, and written informed consent was obtained from each participant included in the study. All demographic and source data were de-identified using a study code that allowed MRI and PET imaging data to be re-identified for purposes of correlating the imaging and demographic data.
Materials
Xanamem was synthesized as described by Webster et al., and in the corresponding patent application WO2011033255 [21, 32]. Xanamem (UE2343) as 5 mg, 10 mg, 20 mg and 30 mg capsules was supplied by Actinogen Medical (Sydney, Australia). 11C-TARACT was radiosynthesized at the Radiochemistry Department at Austin Health (Melbourne, Australia), as described below.
Synthesis of 11C-TARACT
Radiosynthesis of 11C-TARACT [desmethyl indole, 4-(5-(2-chlorophenyl)-4-methyl-4H-1,2,4-triazol-3-yl)-1H-indole] was carried out before each patient session using an iPhase C-11 Pro2 module, an automated radiosynthesizer, using a 2-reactor method with [11C]methyl iodide. Briefly, [11C]CO2 was produced in an IBA 18/9 cyclotron from irradiation of nitrogen-14. [11C]CO2 was trapped on 5Å molecular sieves before being distilled into a reactor vial and reacted with lithium aluminum hydride to produce [11C]CH3OH. The addition of hydroiodic acid produced [11C]CH3I, which was transferred to a second reactor vial containing the precursor TARACT001 (4-(5-(2-chlorophenyl)-4-methyl-4H-1,2,4-triazol-3-yl)-1H-indole 4 mg, 300μL DMF, NaOH (s) ; obtained from Professor M. Kassiou, School of Chemistry, University of Sydney). The reactor was heated to 80°C. After 3 min, 11C-TARACT was purified using preparative high performance liquid chromatography (Phenonenex Gemini C-18 5μ, 40% acetonitrile:60% 0.1 M ammonium formate, 6 mL/min). The radioactive peak corresponding to 11C-TARACT was collected and reformulated for intravenous injection using a C18 Sep Pak cartridge. The product was eluted off the cartridge with ethanol and diluted in saline solution to give the final formulation of the radiotracer as a saline solution with≤10% ethanol. The final solution was transferred through a sterile Millex GV filter into a sterile bulk product vial. Upon completion of the 35-min synthesis process, each dose was analyzed by the Quality Control Department at Austin Health to meet specifications for release prior to participant injection.
PET and MRI procedures
MRI was conducted at the screening session or second study visit. Participants underwent magnetic resonance imaging (MRI) on a Siemens 3-T TIM Trio scanner (Siemens Medical Solutions) to obtain high-resolution T1-weighted anatomical magnetization prepared rapid gradient echo (MPRAGE) and fluid-attenuated inversion recovery (FLAIR) sequences.
During each of the two PET sessions, participants had an indwelling intravenous catheter in each arm, one for administration of 11C-TARACT and one for withdrawing blood for metabolite analysis. Participants were positioned in a Philips TF64 PET/CT camera with a head holder applied to reduce motion. After injection of the 370 MBq of the 11C-TARACT over 30 s, a continuous (dynamic) scan acquisition proceeded for 90 min. Blood samples (10 mL) were obtained between 5–10 and 20–30 min post-injection for TARACT metabolite analysis; samples were immediately centrifuged and analyzed by high pressure liquid chromatography to compare the parent compound peak with that of any potential metabolites at each time point to support image capture and analysis. Volumes of distribution (VT) were computed through Logan graphical analysis [33] using the metabolite-corrected image-derived carotid artery standard uptake value (SUV) as input function. Logan plot linearity was evident from 20 min post injection and the 20 to 60 min scan data was used to calculate VT. For image display, the data acquired from 40 to 60 min post injection, was displayed using a SUV color scale where SUV is the acquired activity normalized by the individual whole-body weight and actual injected dose.
All PET scans and MRI image sets were aligned using an automatic registration algorithm MR-Based CapAIBL. Regions of interest were defined on the MRI images across all MRI slices passing through regions of interest, which included the frontal cortex, anterior and posterior cingulate cortex, sensory-motor cortex, temporo-parietal cortex, visual cortex, caudate, thalamus, medial temporal lobe, centrum semiovale, pons, midbrain and cerebellum. Some of these were grouped into brain regional composites for the 1) neocortex (dorsolateral prefrontal cortex, ventrolateral prefrontal cortex, orbitofrontal cortex, gyrus rectus, sensory-motor cortex, insula, anterior cingulate, posterior cingulate, superior parietal cortex, supramarginal gyrus, primary visual cortex, lateral occipital cortex, gyrus angularis, temporooccipital region, temporal lobe), 2) medial temporal lobe (amygdala, hippocampus, parahippocampus, entorhinal cortex), 3) basal ganglia (caudate, putamen, globus pallidus, thalamus), and 4) cerebellum. In order to avoid arterial blood sampling, the carotid artery time activity curves were used as the input function for the estimation of VT. PET data were not corrected for partial volume effects as correction methods add variance and brain volumes should not differ between baseline scan and the on-drug scan one week later.
Xanamem percent occupancy for each brain regional composite was calculated from the individual brain region VT values at each dose level for the Baseline and following Xanamem treatment PET scans; (ii) the percent occupancy for each brain region at each dose level was determined with the formula [1-(mean VT at scan 2/mean VT at scan 1)]×100; (iii) median percent occupancy and Q1-Q3 intervals for each regional composite was calculated from the percent occupancies of the participants.
The study commenced with the 10 mg mane Xanamen dose series followed by the 20 mg then 30 mg series. A 5 mg and a 10 mg nocte dose series were subsequently added. Due to failure of the high sensitivity blood radiation counter after the first of the 20 mg series participants, metabolite measurements were only obtained for the 10 mg series (i.e., 8 baseline and 7 on 10 mg mane Xanamen) and one participant in the 20 mg dose-level cohort. As a result, the metabolite data obtained was used to create two average population-based metabolite curves from the baseline and the on-treatment studies (Supplementary Figure 1). These were applied to the other participants baseline and post treatment scans respectively with the assumption that rate of metabolism was similar for the 5 mg, 20 mg and 30 mg doses.
Statistical analysis
All statistical analyses were performed with JMP Pro 15.2 for Macintosh (JMP® Pro Version 15, SAS Institute Inc., Cary, NC, 1989–2019). Following 7 days of administration of Xanamem at daily doses of 5 mg, 10 mg, 20 mg, or 30 mg, changes in 11C-TARACT binding were measured and grouped into brain regional composites for the neocortex, medial temporal lobe, basal ganglia, and cerebellum, to determine the degree of Xanamem binding to 11β-HSD1. To create each of the regional composites, data for each region from each participant were averaged. Data are presented as median with interquartile range unless otherwise stated. Statistical evaluations between groups were performed using Tukey HSD followed by a Dunnett’s test against CN. Categorical differences were evaluated using Fisher’s exact test. No correction for multiple comparisons were performed.
Safety assessments
Safety assessments included vital signs measurement on Day 8 and all treatment emergent adverse events (TEAEs) reported following the first dose of Xanamem.
RESULTS
Study participants
There was a total of 40 participants enrolled in the study, 17 with MCI/AD, and 23 of whom were CN. Baseline characteristics are shown in Table 1. Both groups of participants were almost exclusively Caucasian, with an overall mean (SD) age of 76.4 (6.35), while the MCI/AD group was slightly older and predominantly male compared with the CN group.
Table 1
Participant Demographics
| Demographics | MCI/AD (N= 17) | CN (N= 23) |
| Age, mean (SD) | 78.9 (6.8) | 74.6 (5.4) |
| Male N (%) | 13 (76) | 12 (52) |
| Race, N (%) | ||
| Asian | 1 (6) | 0 |
| Caucasian | 16 (94) | 23 (100) |
| Body mass index, mean | 24.9 | 26.2 |
| Common Comorbidities, N (%) | ||
| Hypertension | 7 (41) | 8 (35) |
| Hypercholesterolemia | 5 (29) | 8 (35) |
| Diabetes, Type 2 | 2 (12) | 3 (13) |
| Reflux disease | 3 (18) | 4 (17) |
| Arthritis | 1 (6) | 6 (26) |
MCI/AD, mild cognitive impairment/Alzheimer’s Disease; N, number of participants; SD, standard deviation.
Safety
No serious AEs were reported during the study. Six (6) participants (15%) experienced TEAEs that were possibly related to the study drug (Supplementary Table 2), four of which led to withdrawal from the study prior to the second PET scan. The four participants that withdrew from the study due to TEAEs were: three in the CN group (one each at 5 mg [increasing tremors related to pre-existing Parkinson’s disease], 20 mg [fatigue, memory impairment, and depression], and 30 mg [chest and abdominal pain, tingling in left arm, dizziness]), and one participant in the MCI/AD group (30 mg [hyperactivity, fatigue, hyperventilation, and loss of balance and coordination]). The two TEAEs in participants who remained in the study were due to muscle pain and fatigue that developed in a participant in the CN group who received 30 mg, and nausea and abdominal discomfort in a participant in the MCI/AD group who received 10 mg. Nervous system disorders and general disorders (fatigue) occurred the most frequently due to Xanamem treatment, in 15% and 7.5% of participants, respectively. All treatment-related TEAEs resolved.
Table 2
Percent Occupancy of 11β-HSD1 by Xanamem in Different Brain Regions by dose and group (Median VT [interquartile Q1-Q3])
| MCI/AD (n = 16) Median % Occupancy [IQR] | CN (n = 19) Median % Occupancy [IQR] | ||||||||
| Xanamem Dose (N) | 5 mg (N= 4) (1F, 3M) | 10 mg (N= 4) (0F, 4M) | 20 mg (N= 4) (1F, 3M) | 30 mg (N= 4) (2F, 2M) | 5 mg (N= 4) (3F, 1M) | 10 mg (N= 3) (0F, 3M) | 20 mg (N= 4) (1F, 3M) | 30 mg (N= 4) (3F, 1M) | 10 mg nocte (N= 4) (2F, 2M) |
| Neocortex | 66.1 [59.4–70.7] | 80.1 [79–80.7] | 82.2 [79.9–84.2] | 83.7 [81.0–85.0] | 66.2 [60.6–71.1] | 75.2 [70.6–75.8] | 81.5 [79.7–83.3] | 85.3 [85.3–85.8] | 54.8 [48.4–60.4] |
| Medial Temporal Lobe | 57.6 [53.3–61.0] | 69.3 [64.4–70.4] | 62.2 [60.7–66.0] | 70.4 [66.2–71.2] | 56.2 [48.3–63.5] | 60.8 [51.9–62.6] | 70.2 [67.5–72.8] | 76.2 [71.6–76.3] | 47.7 [42.4–50.3] |
| Basal Ganglia | 64.1 [57.6–68.0] | 79.8 [79.2–79.9] | 80.2 [78.6–82.5] | 82.1 [80.1–82.9] | 61.7 [54.7–67.7] | 72.5 [67.8–73.4] | 80.3 [78.6–80.6] | 83.6 [82.9–84.0] | 52.3 [44.3–58.3] |
| Cerebellum (1 region) | 33.9 [27.1–40.5] | 70.8 [66.6–74.9] | 83.6 [81.8–84.6] | 85.8 [84.2–86.7] | 33.8 [22.1–47.6] | 66.2 [62.4–68.4] | 79.4 [76.1–82.3] | 87.4 [86.2–87.6] | 15.7 [0.0–35.1] |
AD, Alzheimer’s disease; VT, Total Volume of Distribution; F, female; M, male; MCI, mild cognitive impairment; N, group size; n, number of participants; SD, standard deviation.
Xanamem occupancy of 11β-HSD1 in the brain
Of the 40 enrolled participants, baseline and post-treatment imaging was obtained for a total of 35 participants (n = 4 per treatment group (AD and CN) except for the CN 10 mg group where n = 3). Composite images of brain TARACT imaging for each dose group after 7 days treatment are shown in Fig. 2 and composite regional brain and carotid artery time activity curves are shown in Fig. 3. Baseline images show that 11C-TARACT had high entry in the brain that followed the known brain distribution of 11β-HSD1 to cerebellum greater than cortex and hippocampus [24], with a very low degree of non-specific binding. Binding was highest in the cerebellum, followed by a posterior to anterior cortical binding gradient with binding highest in the occipital cortex, thalamus > putamen and lowest in the caudate nuclei, inferomedial frontal lobes and medial temporal regions. VT regional means and coefficients of variation (CoV) of baseline VT for the MCI/AD and CN groups are reported in Supplementary Table 1. Regional percent occupancies of 11β-HSD1 by Xanamem are shown in Table 2 for each dose level for each of the four composite brain regions in both CNs and participants with MCI/AD. Data were not available for the post-treatment scan for one CN participant who received 10 mg Xanamem; therefore, occupancies for this group are calculated based on 3 participants. Occupancy of the 11β-HSD1 TARACT binding site by Xanamem was similar at 10 mg and above doses across most regions, exceeding 75% in neocortex. Occupancy was approximately 15% lower in neocortex and 50% lower in cerebellum for the 5 mg dose compared to 10 mg. The 10 mg nocte occupancy was approximately 25% lower than the 10 mg mane results except the cerebellum that was 75% lower indicating some dissociation of Xanamem from 11β-HSD1 between 6 and 16 h post dose.
Fig. 2
Composite 11C-Taract Images at Baseline and with Increasing Xanamem Dosage. Composite images (n = 8 subjects in each dose group) of standardized uptake value (SUV) taken at 40–60 min post injection of tracer before (top) and after (bottom) 7 days of Xanamem treatment with 5 mg, 10 mg, 20 mg, and 30 mg mane shown in ascending dose order from left to right.
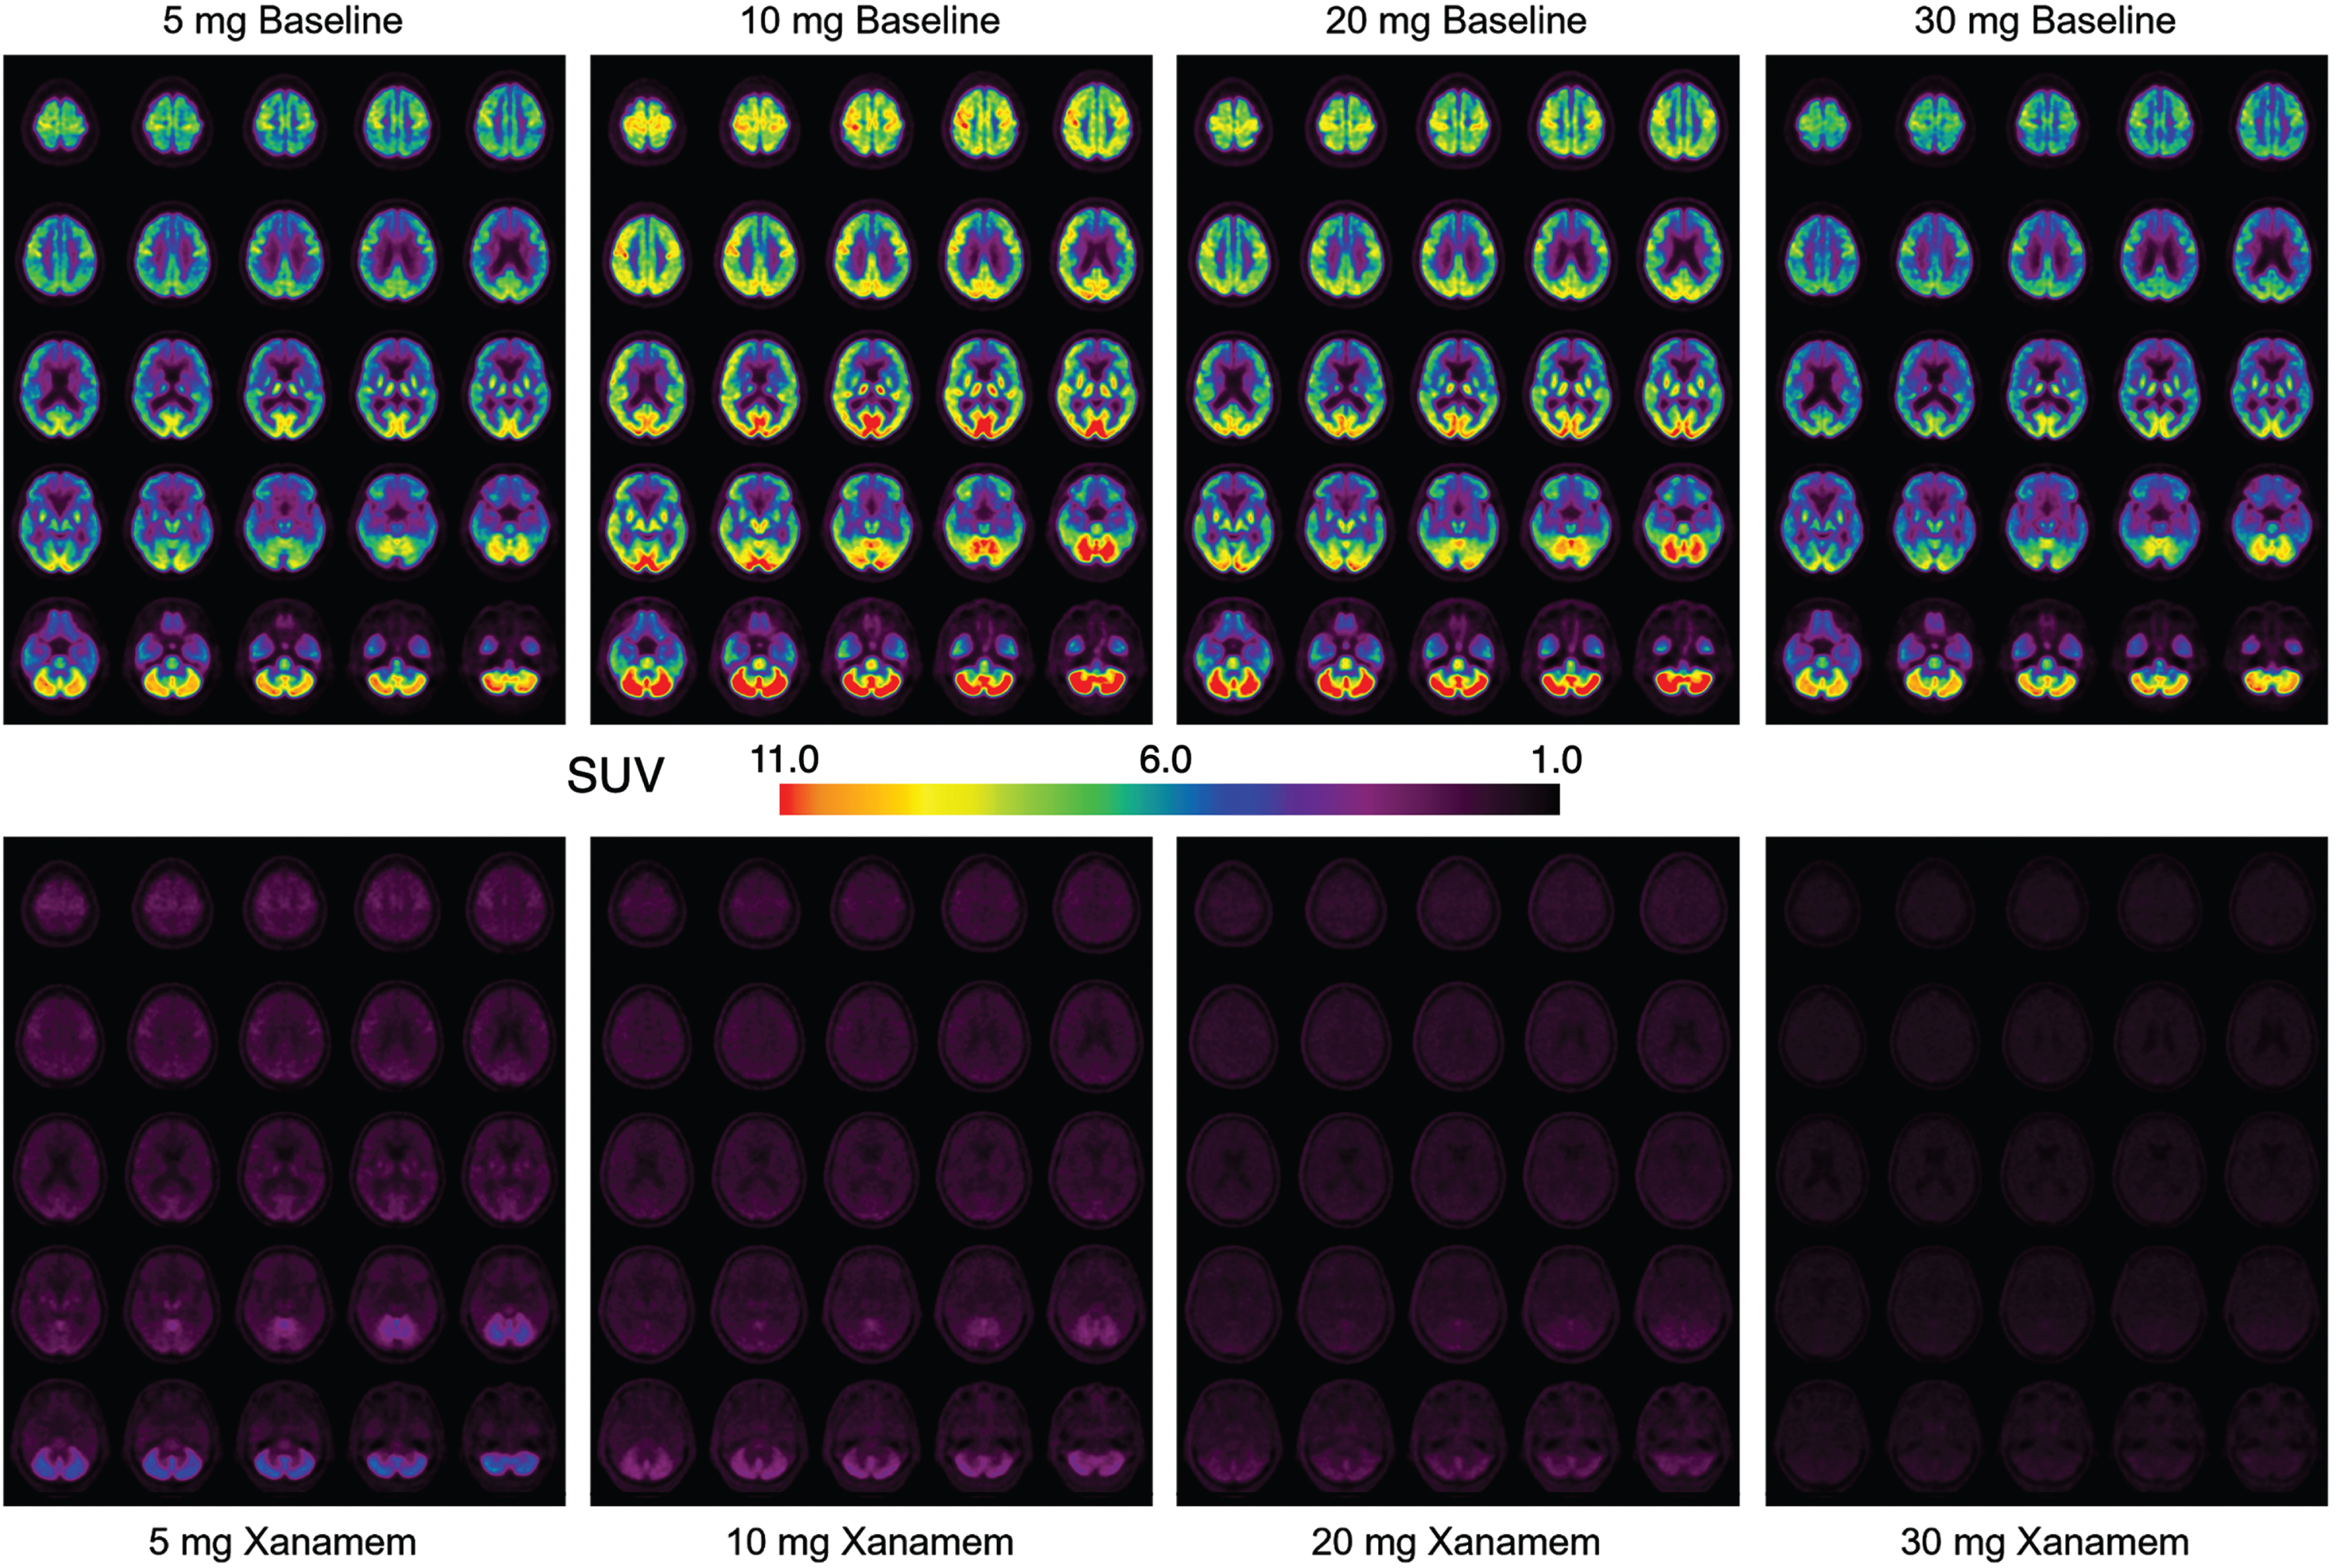
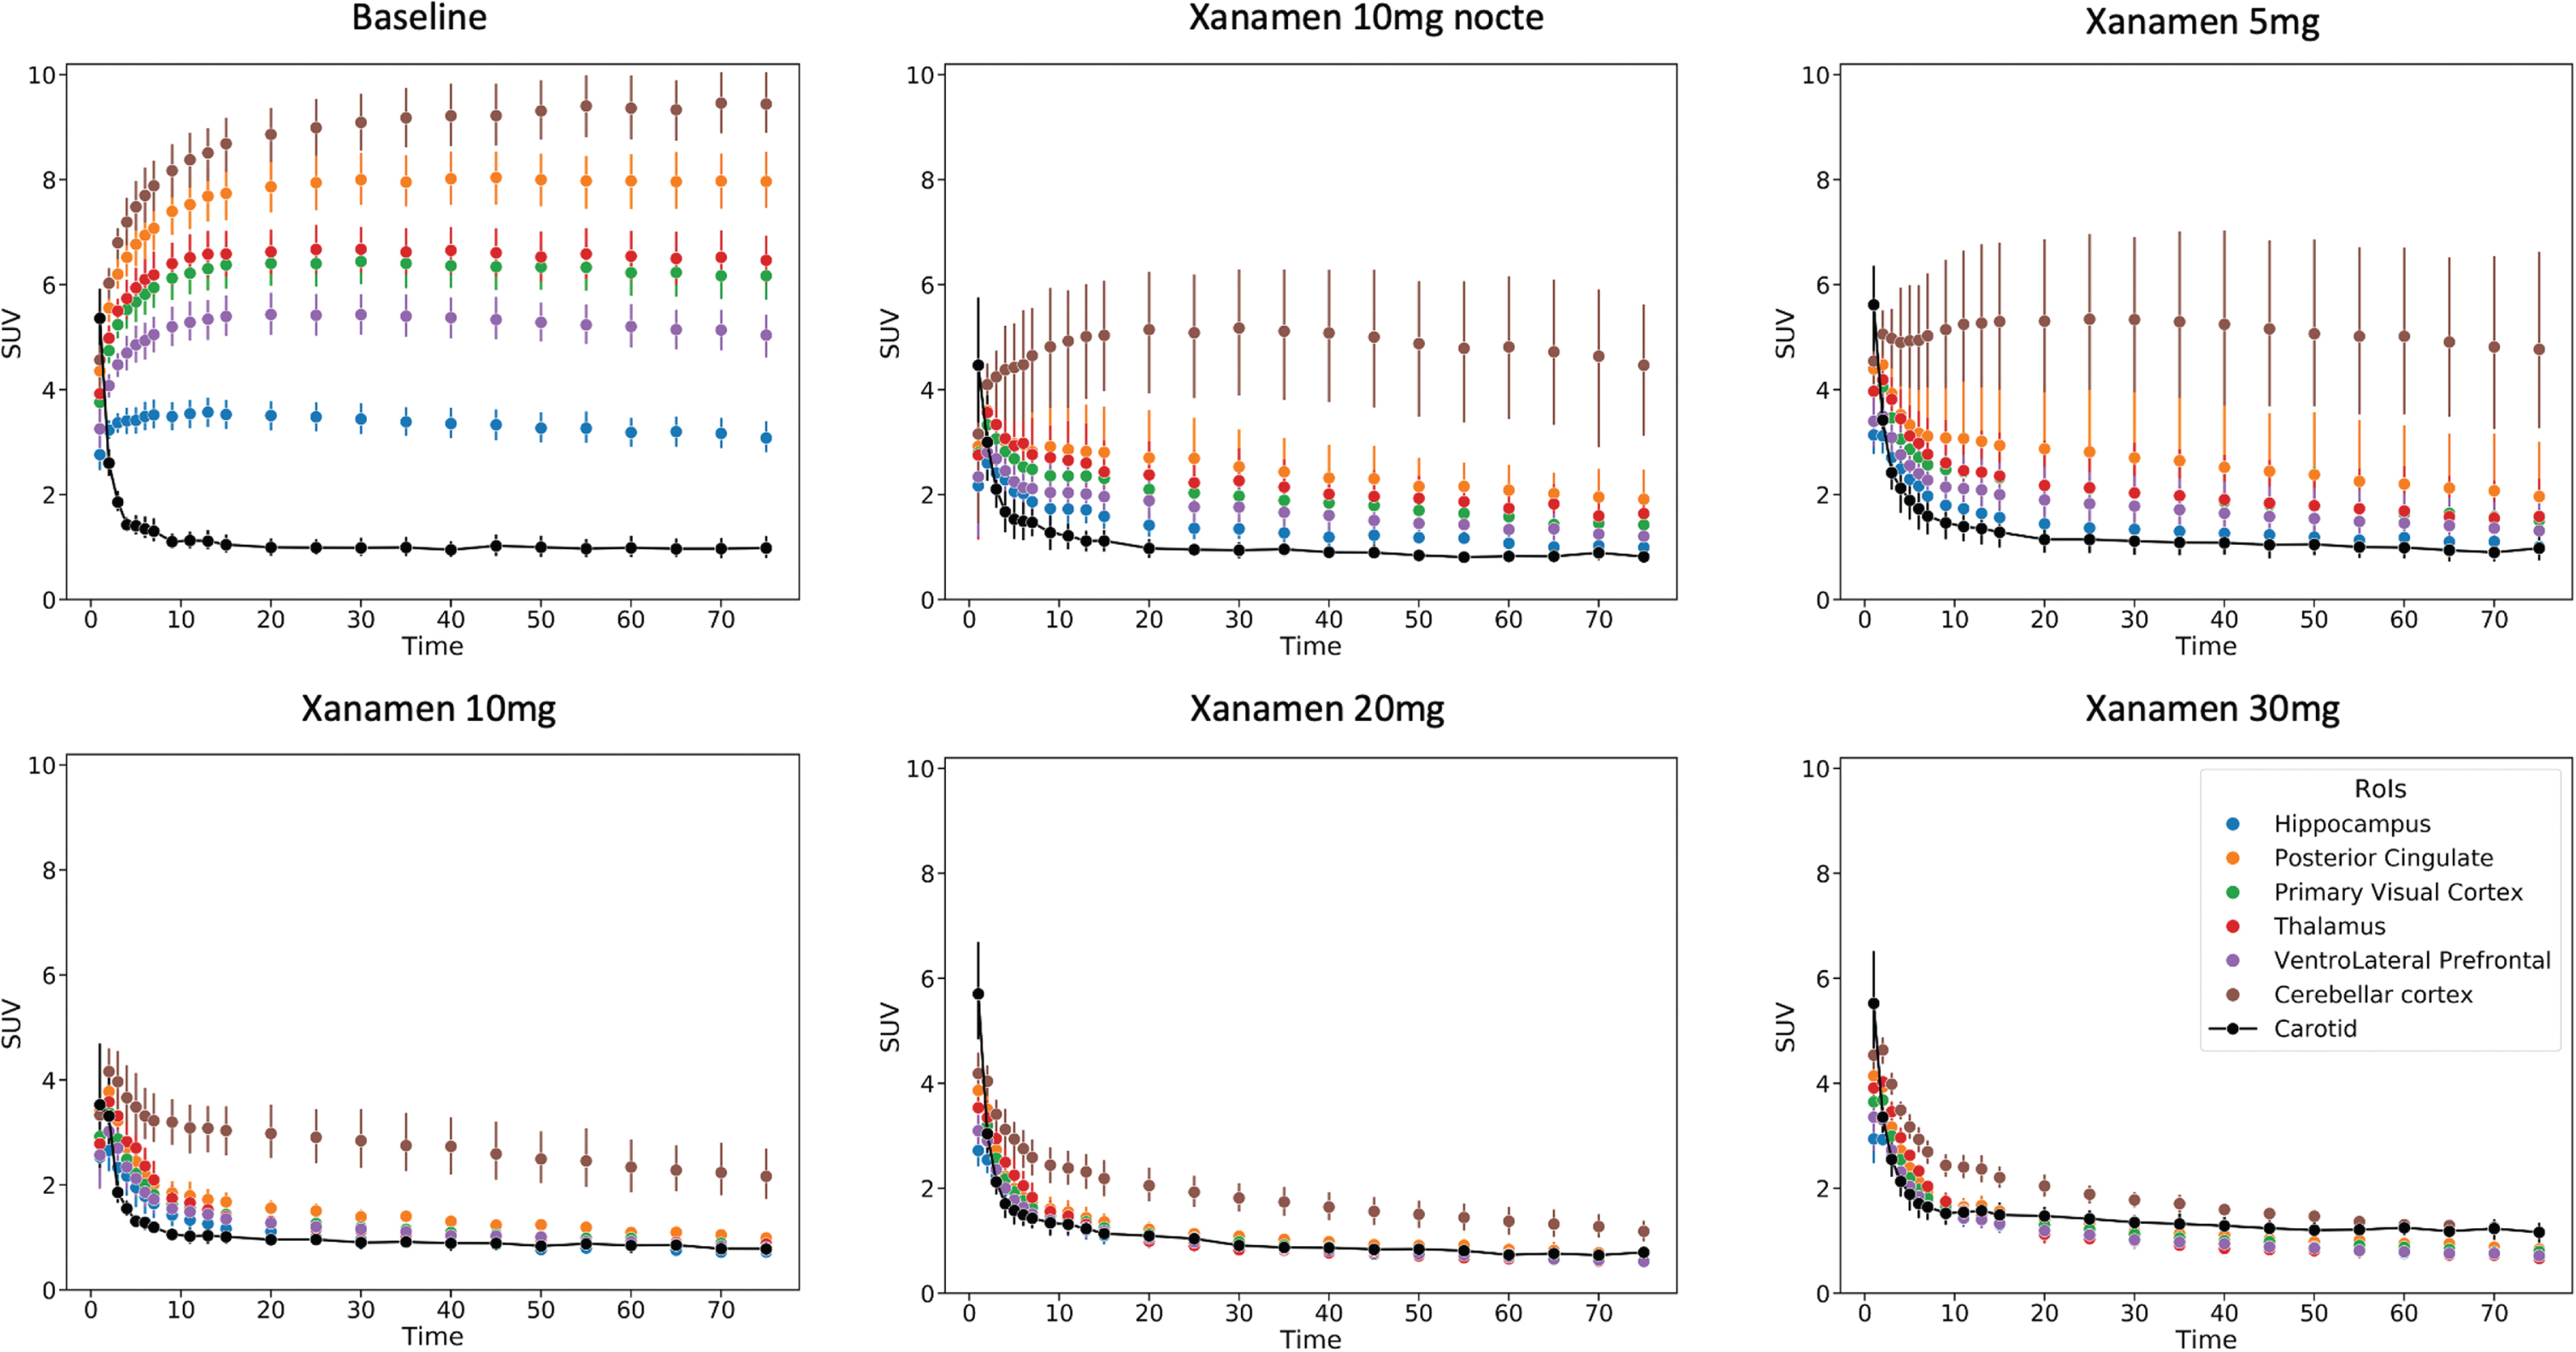
Fig. 3
Regional Brain Time Activity Curves from the baseline and each dose level scans. Dynamic imaging data expressed as composite curves of the regional SUV mean and standard error for each dose vs time post injection. Brain regions shown include hippocampus, posterior cingulate gyrus, primary visual cortex, thalamus, ventrolateral prefrontal cortex and cerebellar cortex. The metabolite corrected carotid SUV curve is also shown that was used for the image derived input function in the calculation of VT.
Similar values were obtained using the SUV40–60 to derive estimates of occupancy (Supplementary Table 3).
Xanamem occupancy of 11β-HSD1 was similar and mildly dose-responsive in all brain regions in both CN and MCI/AD groups except in the cerebellum where a stronger dose-response was present at the lower doses (Fig. 4).
Fig. 4
Dose Dependent Regional Brain Occupancy. Regional percent occupancy of 11β-HSD1 by Xanamem in each of the composite brain regions, the neocortex, medial temporal lobe, basal ganglia, and cerebellum across all four Xanamem mane doses (5 mg, 10 mg, 20 mg, 30 mg) for cognitively normal participants (blue line; N= 15) and participants with MCI/AD (red line; N= 16). Data expressed as median±IQR.
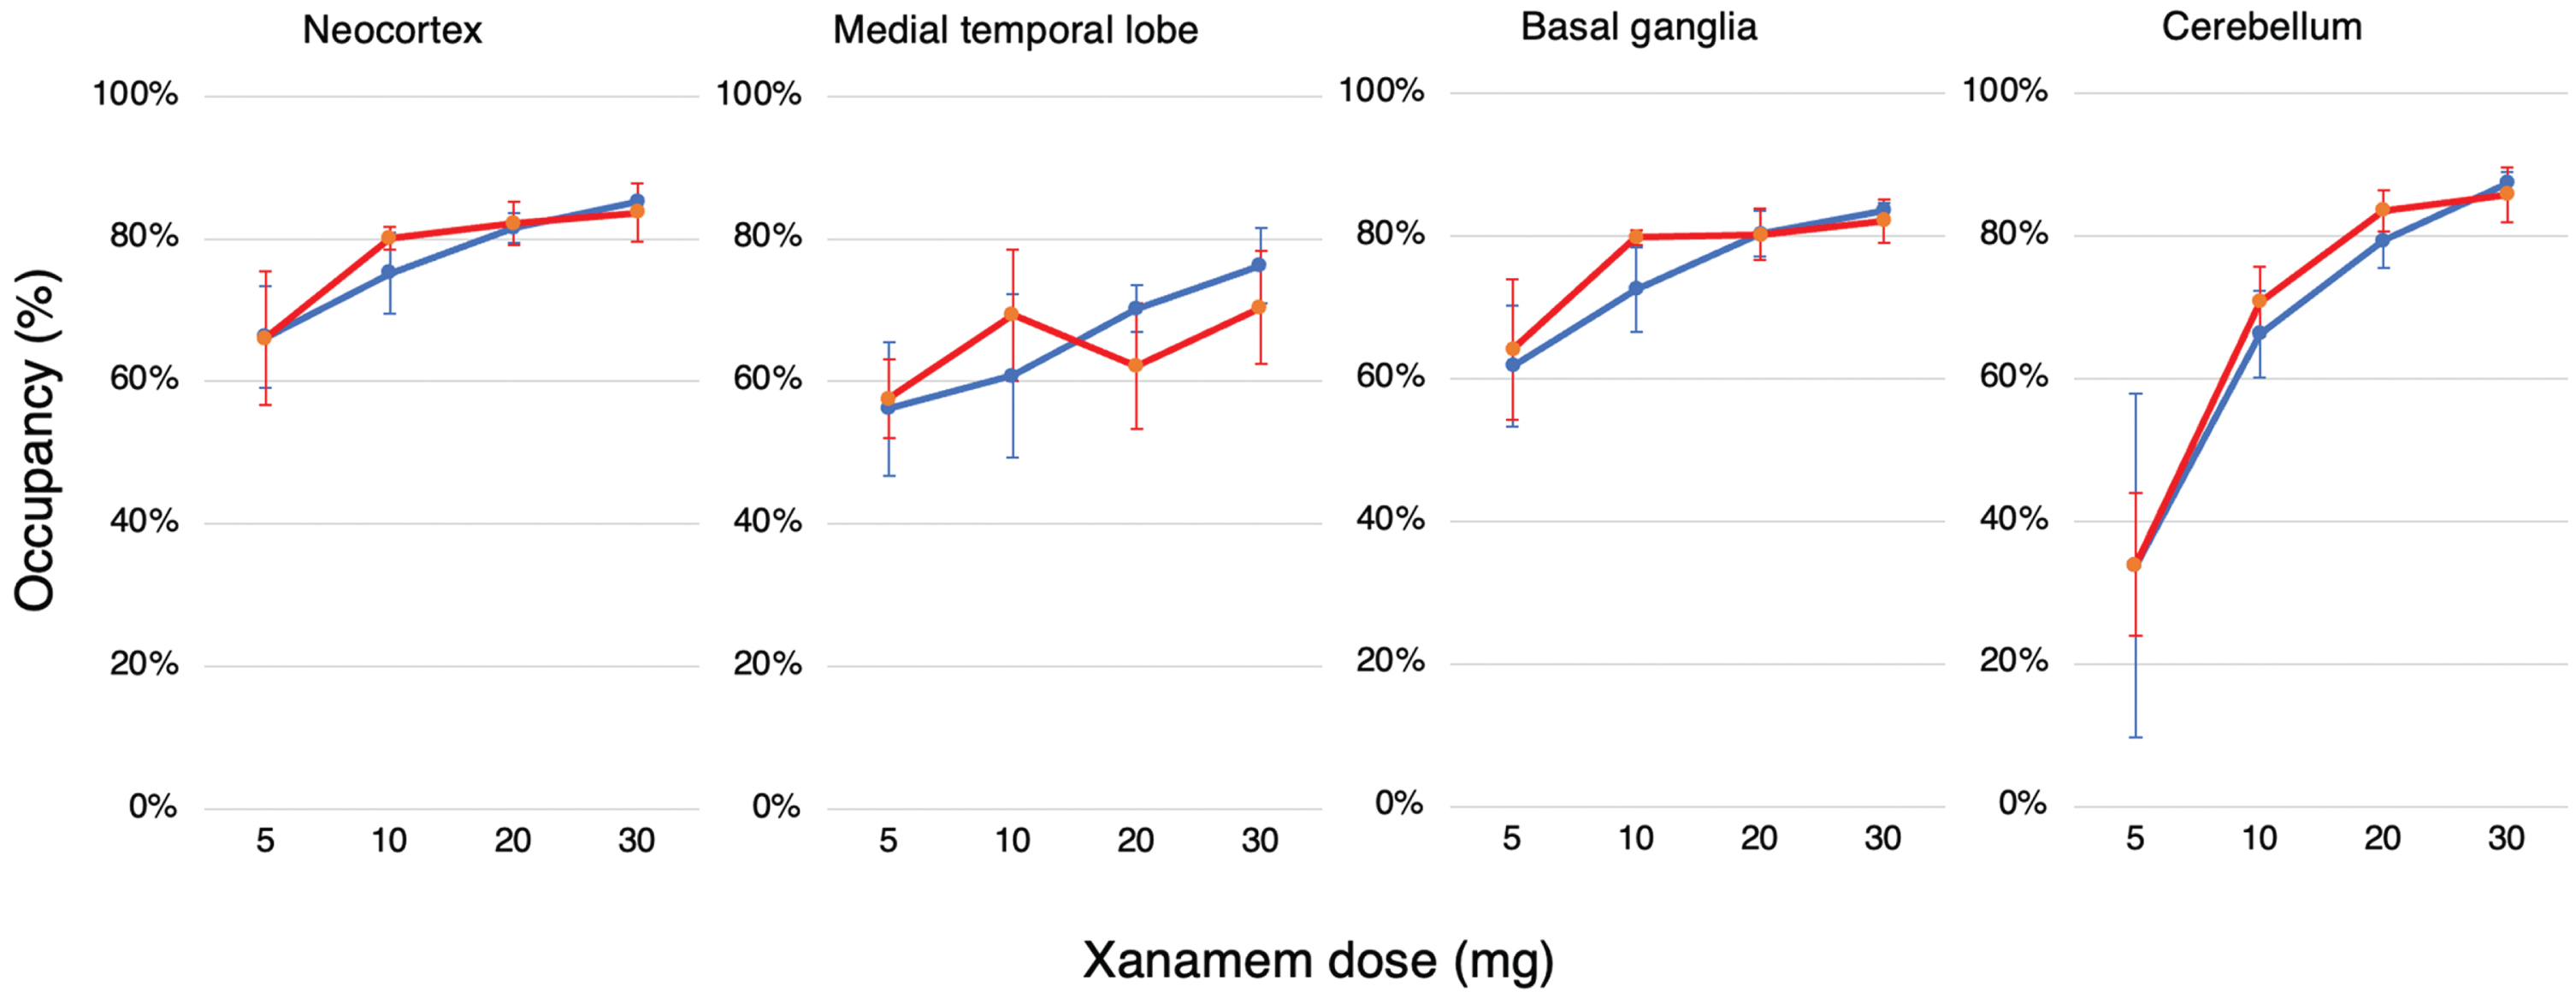
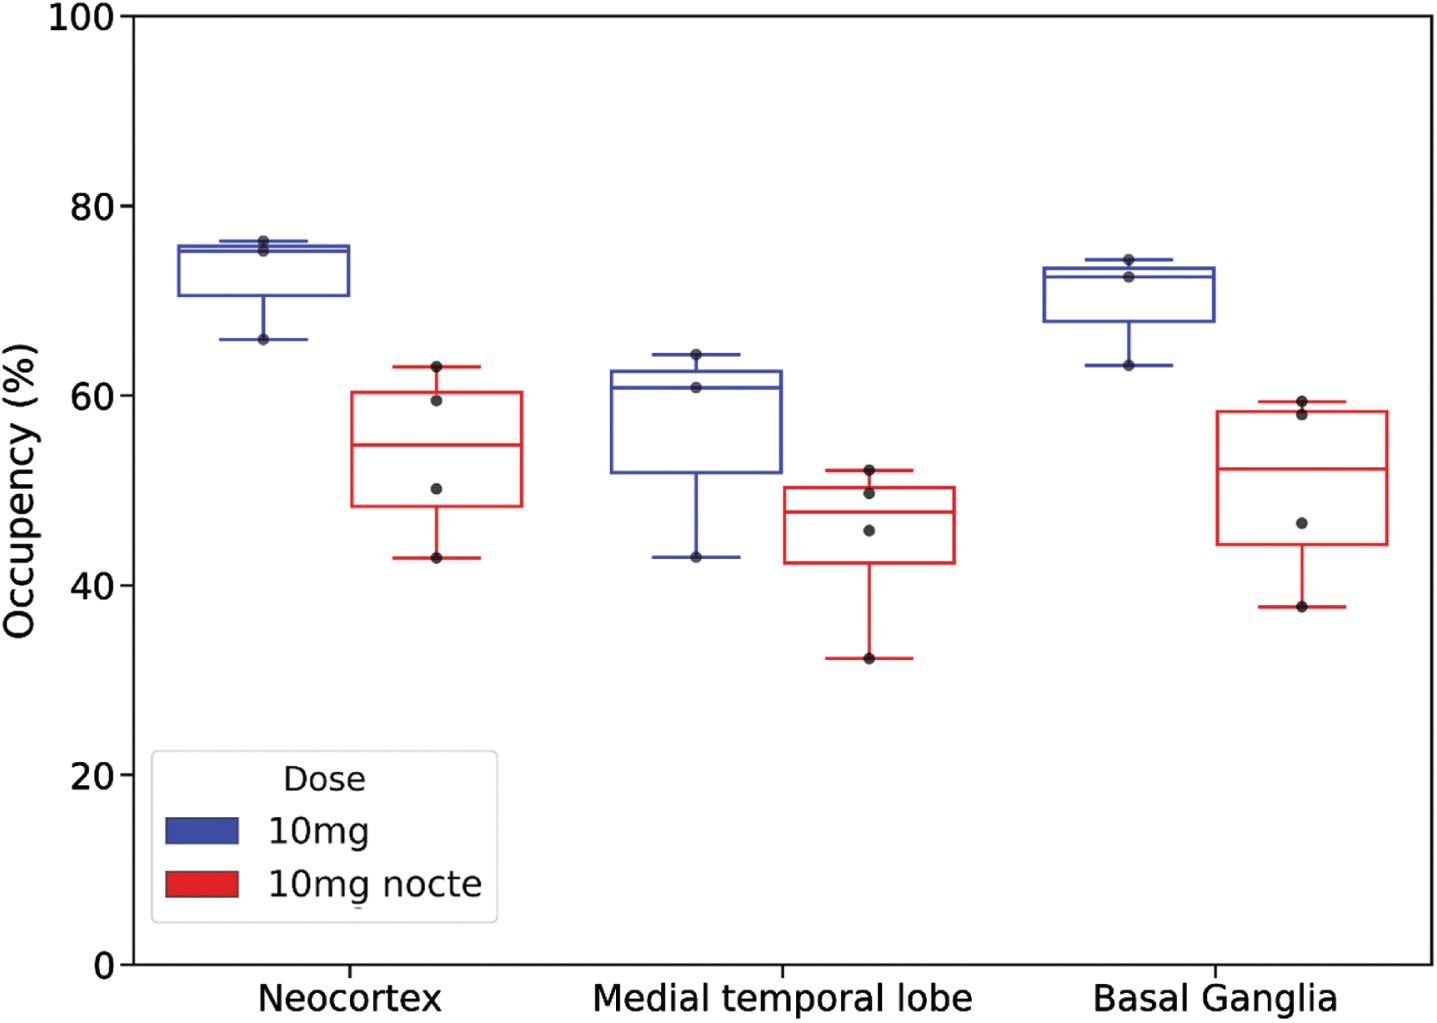
Comparison of the regional occupancies of the 10 mg mane (N = 3) and 10 mg nocte (N = 4) doses in CN participants is shown in Fig. 5. Occupancy levels above 45% in the neocortex, medial temporal lobe and basal ganglia were observed using a nocte dose. Relative to the mane dose, occupancy levels in neocortex, MTL and basal ganglia were in the order of 25% lower with the nocte dose at the time of scanning.
Fig. 5
Comparison of regional percent occupancy of 11β-HSD1 by Xanamem for 10 mg nocte dosing (red; N= 4) (last dose 16 h prior to scan) and 10 mg mane dosing (blue; N= 3) (last dose 4–7 h prior to scan) in cognitively normal participants. Regional percent occupancy is shown for the three different composite brain regions: the neocortex, medial temporal lobe, and basal ganglia.
DISCUSSION
These data represent the first direct insight into the activity of a novel brain-penetrant 11β-HSD1 inhibitor at a central target that is notoriously challenging to examine. Using a specific PET tracer for 11β-HSD1 we have been able to confirm a high level of target engagement by the enzyme inhibitor Xanamem and quantified the effect of a range of doses on the level of target enzyme occupancy. This information will impact the design of future clinical trials for this drug that may maximize cognitive benefits while reducing the risk of adverse effects.
AD has a long presymptomatic period of 15 to 20 years that is clinically silent; during this time cortisol levels are associated with more rapid disease progression and increasing amyloid-β plaques in the brain [12, 34–38]. This remains the case as the disease progresses, particularly for patients with MCI due to AD, in whom cortisol concentrations in the cerebrospinal fluid are higher than in CNs and are predictive of more rapid cognitive decline [38, 39]. The ideal approach to neuroprotection when considering brain cortisol as the target, is to treat in the early stages of disease to prevent progression and preserve quality of life. To do this safely, drug dosage should achieve the reduction in brain cortisol required for benefit without long term excessive disturbance of the HPA axis.
Based on nonclinical models, 30% to 60% inhibition of 11β-HSD1 may be sufficient to improve cognition and be neuroprotective [27, 28]. The study has shown that the dosage in clinical trials of Xanamem, a novel small-molecule, selective inhibitor of the 11β-HSD1 enzyme designed to reduce intracellular cortisol in the brain, likely produced considerably greater inhibition than 30 to 60%. By conducting 11C-TARACT PET scans before and after 7 days of treatment with Xanamem, we examined occupancy of 11β-HSD1 by Xanamem in different regions of the brain at the drug’s steady state. We demonstrated that Xanamem displays high receptor occupancy of 11β-HSD1 in both MCI/AD and CN participants in a relatively flat dose-response fashion from 10 mg mane. Levels of occupancy above 55% were demonstrated at all doses in the neocortex, medial temporal lobe, and basal ganglia. Occupancy levels in the cerebellum increased more steeply from a lower baseline with increasing doses.
Preclinical studies have shown the cerebellar cortex is the region with the highest 11β-HSD1 concentration. Our results suggest that higher Xanamem doses are therefore required to achieve the same degree of occupancy in the cerebellum to that observed in cortical and subcortical regions at lower Xanamem doses. However, as the cerebellum is relatively uninvolved in AD, the need to target intracellular cortisol production in this structure is unclear.
Despite the very high levels of 11β-HSD1 occupancy, Xanamem was generally well tolerated and did not lead to serious AEs over the seven-day study. Those AEs that did arise were mild to moderate in nature and resolved rapidly on cessation of study drug. While the AEs appeared more frequent at the higher dosages, the numbers were too small for meaningful interpretation (Supplementary Table 2).
Results from prior clinical pharmacodynamic studies of the HPA axis are consistent with the high receptor occupancies seen in the current study with Xanamem. Similar target inhibition, measured by increases in adrenocorticotropic hormone, androstenedione, and dehydroepiandrosterone sulfate levels, was achieved by administration of a 10 mg daily dose in a Phase 2 study ACW0002 in participants with AD [40] and with doses of 10 mg to 35 mg twice daily in a Phase 1 multiple ascending dose study [41].
Improved working memory and visual attention in healthy volunteers≥50 years were seen within a few weeks of initiating treatment with a 20 mg daily dose using a Cogstate Neurological Test Battery in a Phase 1 study ACW0003 in healthy elderly volunteers [42, 43]. In contrast, the earlier Phase 2 study ACW0002 with 10 mg daily Xanamem [40] administered for 12 weeks to patients with AD, reported good safety but no improvement on the AD Assessment Scale Cognitive subscale (ADAS-Cog) [44] and AD COMposite Scores (ADCOMs) [45] endpoints compared to placebo. Given the findings of this study showing high levels of target engagement for a 10 mg dose, the negative result is likely due to other factors, such as the endpoints tested, 12-week duration and population studied.
A comparison of 10 mg doses administered mane or nocte indicated occupancy levels 22% to 27% lower at the time of scanning with a nocte dose. This is consistent with the Xanamem half-life of 10 to 14 h resulting in changes in Xanamem concentration and target occupancy throughout the day at steady-state.
The study has a number of limitations. The first of these was the exclusion of functional assessments for cognition, preventing correlation of target engagement and clinical outcomes. However, due to the short duration of treatment, observational design and small sample size, any change in cognition would have had questionable validity. Secondly, as mentioned, there was a technical difficulty with the equipment that resulted in being unable to individualize the metabolite corrections for each participant in the 5 mg, 20 mg, and 30 mg cohorts. Instead, an average metabolite correction was applied based on those samples for which it was available and only the 10 mg dose participants had individual metabolite corrected input curves. While this may have had the effect of under-correcting in the samples for the 20 mg and 30 mg cohorts, this was preferable to the less reliable outcomes that would have resulted from not correcting for metabolites. As occupancy was greater than 60% in all brain regions with 10 mg mane treatment, for which individual metabolite data was available, potential bias in the occupancy calculation for higher doses does not alter the conclusion that Xanamem doses of≤10 mg daily may be the most suitable for therapy trials in AD if the target is 30–60% occupancy. Thirdly, PK and PD were not measured in this study, nor were measures of cortisol and HPA alteration to confirm exposure and correlate with PET occupancies. Lastly, the quantitative methods used in this study have not been validated against full kinetic modelling with arterial sampling metabolite corrected input function. Consequently, the use of image derived input function raises some uncertainty over the accuracy of the VT measures. It has not been demonstrated that the carotid artery image derived input function (IDIF) is valid for this tracer and that Logan graphical analysis is the most appropriate quantitative method. IDIF is affected by partial volume effects that might lead to mis-estimation of the binding parameters. Likewise non-specific tracer retention to the wall of the carotid artery, should it occur, would alter the VT result. These concerns are moderated by the fact that the studies were conducted only a week or two apart on the same person on the same PET scanner so changes in carotid wall retention or partial volume effect between the paired scans in the carotid artery or any brain regions is very unlikely, and while the binding parameters might be slightly biased by a constant partial volume effect, this would be consistent between scan pairs so unlikely to influence the percentage occupancy by Xanamem. Likewise, the metabolite corrected TAC shows no difference in the carotid SUV curves between the baseline and 10 mg studies with the carotid SUV falling rapidly to a plateau of one (Fig. 3) suggesting no retention in the carotid wall or bias between the studies. The VT results are further supported by inspection of the time-activity curves (Fig. 3) and the SUV40–60 calculations (Supplementary Table 3). We did apply other methods to the data including the Ichise Multilinear Reference Tissue Model (MTRM) Binding Potentials non-displaceable (BPND) and obtained very similar occupancy results. Irrespective of these limitations, the study provides valuable pharmacodynamic data to inform future efficacy studies with Xanamem.
In conclusion, this new PET method allows direct estimation of the occupancy of 11β-HSD1 by brain penetrant, small molecule inhibitors. We report the ability of doses from 5 to 30 mg daily of a novel selective inhibitor of 11β-HSD1, Xanamem, to achieve high brain target occupancy levels. Even a low dose such as 5 mg mane daily was sufficient to result in substantial levels of receptor occupancy in the neocortex, medial temporal lobe, and the basal ganglia. This study supports the exploration of Xanamem doses of≤10 mg daily for the treatment of AD, and potentially other conditions where cognitive impairment or glucocorticoid excess is a major component of the disease.
ACKNOWLEDGMENTS
The authors would like to thank the Melbourne Brain Centre, Florey Institute of Neuroscience and Mental Health for support in acquiring the MRI data. We also thank the participants who took part in the study and their families.
FUNDING
The study was supported by a grant to Austin Health from Actinogen Medical, owner of Xanamem.
CONFLICT OF INTEREST
Christopher C. Rowe has received research grants from NHMRC, Enigma Australia, Biogen, Eisai and Abbvie. He is on the scientific advisory board for Cerveau Technologies and consulted for Prothena, Eisai, Roche and Biogen Australia. Victor Villemagne is and has been a consultant or paid speaker at sponsored conference sessions for Eli Lilly, Life Molecular Imaging, GE Healthcare, IXICO, Abbvie, Lundbeck, Shanghai Green Valley Pharmaceutical Co Ltd, and Hoffmann La Roche. Authors JT, MR, and TM are employees of Actinogen Medical, the company that funded this study and own Xanamen. The other authors did not report any conflict of interest.
DATA AVAILABILITY
The data supporting the findings of this study are available on request from the corresponding author.
SUPPLEMENTARY MATERIAL
[1] The supplementary material is available in the electronic version of this article: https://dx.doi.org/10.3233/JAD-220542.
REFERENCES
[1] | Gauthier S , Rosa-Neto P , Morais JA , Webster C (2021) World Alzheimer Report 2021. Journey through the diagnosis of dementia. Alzheimer’s Disease International, London, UK. |
[2] | World Health Organization (2021) Dementia. https://www.who.int/news-room/fact-sheets/detail/dementia, Last updated September 2, 2021, Accessed on September 17, 2021. |
[3] | Novartis Pharmaceuticals Corporation (2018) Revastigmine prescribing information. https://www.accessdata.fda.gov/drugsatfda docs/label/2018/020823s036,021025s024lbl.pdf, Last updated December 2018, Accessed on September 6, 2021. |
[4] | Eisai, Inc. (2012) ARICEPT® (donepezil hydrochloride) prescribing information. https://www.accessdata.fda.gov/drugsatfda docs/label/2012/020690s035,021720s008,022568s005lbl.pdf, Last updated February 2012, Accessed on March 3, 2022. |
[5] | Janssen Pharmaceutica NV (2021) RAZADYNE® (galantamine) prescribing information. https://www.janssenlabels.com/package-insert/product-monograph/prescribing-information/RAZADYNE+ER-pi.pdf, Last updated August 2021, Accessed on March 3, 2022. |
[6] | Abbvie (2020) NAMENDA® (memantine hydrochloride) prescribing information. https://media.allergan.com/actavis/actavis/media/allergan-pdf-documents/productprescribing/Final-Clean-Namenda-USPI.pdf, last updated November 2018, Accessed on March 3, 2022. |
[7] | Budd Haeberlein S , Aisen PS , Barkhof F , Chalkias S , Chen T , Cohen S , Dent G , Hansson O , Harrison K , von Hehn C , Iwatsubo T , Mallinckrodt C , Mummery CJ , Muralidharan KK , Nestorov I , Nisenbaum L , Rajagovindan R , Skordos L , Tian Y , van Dyck CH , Vellas B , Wu S , Zhu Y , Sandrock A. ((2022) ) Two randomized phase 3 studies of aducanumab in early Alzheimer’s disease. J Prev Alzheimers Dis 9: , 197–210. |
[8] | van Dyck CH , Swanson CJ , Aisen P , Bateman RJ , Chen C , Gee M , Kanekiyo M , Li D , Reyderman L , Cohen S , Froelich L , Katayama S , Sabbagh M , Vellas B , Watson D , Dhadda S , Irizarry M , Kramer LD , Iwatsubo T ((2023) ) Lecanemab in early Alzheimer’s disease. N Engl J Med 388: , 9–21. |
[9] | Green KN , Billings LM , Roozendaal , McGaugh JL , LaFerla FM ((2006) ) Glucocorticoids increase amyloid-β and tau pathology in a mouse model of Alzheimer’s disease. J Neurosci 25: , 9047–9056. |
[10] | Hermanowski-Vosatka A , Balkovec JM , Cheng K , Chen HY , Hernandez M , Koo GC , Le Grand CB , Li Z , Metzger JM , Mundt SS , Noonan H , Nunes CN , Olson SH , Pikounis B , Ren N , Robertson N , Schaeffer JM , Shah K , Springer MS , Strack AM , Strowski M , Wu K , Wu T , Xiao J , Zhang BB , Wright SD , Thieringer R ((2005) ) 11beta-HSK1 inhibition ameliorates metabolic syndrome and prevents progression of atherosclerosis in mice. J Exp Med 202: , 517–527. |
[11] | Lupien SJ , de Leon M , de Santi S , Convit A , Tarshish C , Nair NPV , Thakur M , McEwen BS , Hauger RL , Meaney MJ ((1998) ) Cortisol levels during human aging predict hippocampal atrophy and memory deficits. Nat Neurosci 1: , 69–73. |
[12] | Pietrzak RH , Laws SM , Lim YY , Bender SJ , Porter T , Doecke J , Ames D , Fowler C , Masters CL , Milicic L , Rainey-Smith S , Villemagne VL , Rowe CC , Martins RN , Maruff P , for the Australian Imaging Biomarkers and Lifestyle Research Group ((2017) ) Plasma cortisol, brain amyloid-beta, and cognitive decline in preclinical Alzheimer’s disease: A 6-year prospective cohort study. Biol Psychiatry Cogn Neurosci Neuroimaging 2: , 45–52. |
[13] | Ouanes S , Popp J ((2019) ) High cortisol and the risk of dementia and Alzheimer’s disease: A review of the literature. Front Aging Neurosci 11: , 43. |
[14] | Sapolsky RM ((2000) ) Glucocorticoids and hippocampal atrophy in neuropsychiatric disorders. Arch Gen Psychiatry 10: , 925–935. |
[15] | Stuart KE , King AE , Fernandez-Martos CM , Summers MJ , Vickers JC ((2017) ) Environmental novelty exacerbates stress hormones and Aβ pathology in an Alzheimer’s model. Sci Rep 7: , 2764–2771. |
[16] | Sapolsky RM , Uno H , Rebert CS , Finch CE ((1990) ) Hippocampal damage associated with prolonged glucocorticoid exposure in primates. J Neurosci 10: , 2897–2902. |
[17] | Woolley CS , Gould E , McEwen BS ((1990) ) Exposure to excess glucocorticoids alters dendritic morphology of adult hippocampal pyramidal neurons. Brain Res 531: , 225–331. |
[18] | Lupien S , Lecours AR , Lussier I , Schwartz G , Nair NPV , Meaney MJ ((1994) ) Basal cortisol levels and cognitive deficits in human aging. J Neurosci 14: , 2893–2903. |
[19] | MacLullich AMJ , Deary IJ , Starr JM , Ferguson J , Wardlaw JM , Seckl JR ((2005) ) Plasma cortisol levels, brain volumes, and cognition in healthy elderly men. Psychoneuroendocrinology 30: , 505–515. |
[20] | Starkman MN , Giordani B , Gebarski SS , Berent S , Schork MA , Schteingart DE ((1999) ) Decrease in cortisol reverses human hippocampal atrophy following treatment of Cushing’s disease. Biol Psychiatry 46: , 1595–1602. |
[21] | Webster SP , Ward P , Binnie M , Craigie E , McConnell KMM , Sooy K , Vinter A , Seckl JR , Walker BR ((2007) ) Discovery and biological evaluation of adamantyl amide 11β-HSD1 inhibitors. Bioorg Med Chem Lett 17: , 2838–2843. |
[22] | Yau JL , Noble J , KenyonC J , Hibberd C , Kotelevtsev Y , Mullins JJ , Seckl JR ((2001) ) Lack of tissue glucocorticoid reactivation in 11β-hydroxysteroid dehydrogenase type 1 knock-out mice ameliorates age-related learning impairments. Proc Natl Acad Sci U S A 98: , 4716–4721. |
[23] | Yau JLW , Seckl JR ((2012) ) Local amplification of glucocorticoids in the aging brain and impaired spatial memory. Front Aging Neurosci 4: , 24. |
[24] | Sandeep TC , Yau JL , MacLullich AM , Noble J , Deary IJ , Walker BR , Seckl JR ((2004) ) 11β-hydroxysteroid dehydrogenase inhibition improves cognitive function in healthy elderly men and type 2 diabetics. Proc Natl Acad Sci U S A 101: , 6734–6739. |
[25] | Holmes MC , Carter RN , Noble N , Chitnis S , Dutia A , Paterson JM , Mullins JJ , Seckl JR , Yau JLW ((2010) ) 11β-hydroxysteroid dehydrogenase type 1 expression is increased in the aged mouse hippocampus and parietal cortex and causes memory impairments. J Neurosci 30: , 6916–6920. |
[26] | Mohler EG , Browman KE , Roderwald VA , Cronin EA , Markosyan S , Bitner RS , Strakhova MI , Drescher KU , Hornberger W , Rohde JJ , Brune ME , Jacobson PB , Rueter LE ((2011) ) Acute inhibition of 11β-hydroxysteroid dehydrogenase type-1 improves memory in rodent models of cognition. J Neurosci 31: , 5406–5413. |
[27] | Sooy K , Noble J , McBride A , Binnie M , Yau JLW , Seckl JR , Walker BR , Webster SP ((2015) ) Cognitive and disease-modifying effects of 11β-hydroxysteroid dehydrogenase type 1 inhibition in male Tg2576 mice, a model of Alzheimer’s disease. Endocrinology 156: , 4592–4603. |
[28] | Sooy K , Webster SP , Noble J , Binnie M , Walker BR , Seckl JR , Yau JLW ((2010) ) Partial deficiency of short-term inhibition of 11β-hydroxysteroid dehydrogenase type 1 improves cognitive function in aging mice. J Neurosci 30: , 13867–13872. |
[29] | Yau JL , McNair KM , Noble J , Brownstein D , Hibberd C , Morton N , Mullins JJ , Morris RGM , Cobb S , Seckl JR ((2007) ) Enhanced hippocampal long-term potentiation and spatial learning in aged 11β-hydroxysteroid dehydrogenase type 1 knock-out mice. J Neurosci 27: , 10487–10496. |
[30] | Li W , Joshi A , Zeng Z , O’Malley SS , Miller PJ , Riffel K , Purcell ML , Gantert LT , Eng W , Krause S , Williams M , Balkovec JM , Waddell ST , Cook JJ , Hamill TG ((2011) ) Radiosynthesis and evaluation of an 11-beta hydroxysteroid dehydrogenase-1(11β-HSD1) PET ligand in rhesus monkey. J Labelled Comp Radiopharm 54: (S1), S293–S293. |
[31] | Dubois B , Feldman HH , Jacova C , Hampel H , Molinuevo JL , Blennow K , DeKosky ST , Gauthier S , Selkow D , Bateman R , Cappa S , Crutch S , Engelborghs S , Frisoni GB , Fox NC , Galasko D , Habert M-O , Jicha GA , Nordberg A , Pasquier F , Rabinovici G , Robert P , Rowe C , Salloway S , Sarazin M , Epelbaum S , de Souza LC , Vellas B , Visser PJ , Schneider L , Stern Y , Scheltens P , Cummings JL ((2014) ) Advancing research diagnostic criteria for Alzheimer’s disease: The IWG-2 criteria. Lancet Neurol 13: , 614–629. |
[32] | Webster SP , Sickle JR , Walker BR , Ward P , Pallin TD , Dyke HJ (2011) 3,3-Disubstituted-(8-aza-bicyclo[3.2.1]oct-8- yl)-[5-(1 h-pyrazol-4-yl)-thiophen-3-yl]-methanone and related compounds and their use. Int PCT Application W02011135276. |
[33] | Logan J , Fowler JS , Volkow ND , Wolf AP , Dewey SL , Schyler DJ , Macgregor RR , Hitzemann R , Bendriem B , Gatley SJ ((1990) ) Graphical analysis of reversible radioligand binding from time-activity measurements applied to [N11C-methyl]-(-)-cocaine PET studies in human subjects. J Cereb Blood Flow Metab 10: , 740–747. |
[34] | Caselli RJ , Reiman EM ((2013) ) Characterizing the preclinical stages of Alzheimer’s disease and the prospect of presymptomatic intervention. J Alzheimers Dis 33: , S405–S416. |
[35] | Csernansky JG , Dong H , Fagan AM , Wang L , Xiong C , Holtzman DM , Morris JC ((2006) ) Plasma cortisol and progression of dementia in subjects with Alzheimer-type dementia. Am J Psychiatry 163: , 2164–2169. |
[36] | Langbaum JBS , Fleisher AS , Chen K , Ayutyanont N , Lopera F , Quiroz YT , Caselli RJ , Tariot PN , Reiman EM ((2013) ) Ushering in the study and treatment of preclinical Alzheimer disease. Nat Rev Neurol 9: , 371–381. |
[37] | Lehallier B , Essioux L , Gayan J , Alexandridis R , Nikolcheva T , Wyss-Coray T , Britschgi M for the Alzheimer’s Disease Neuroimaging Initiative ((2016) ) Combined plasma and cerebrospinal fluid signature for the prediction of midterm progression from mild cognitive impairment to Alzheimer disease. JAMA Neurol 73: , 203–212. |
[38] | Popp J , Wolfsgruber S , Heuser I , Peters O , Hull M , Schröder J , Möller H-J , Lewczuk P , Schneider A , Holger J , Luckhaus C , Pernecky R , Frölich L , Wagner M , Maier W , Wiltfang J , Kornhuber J , Jessen F ((2015) ) Cerebrospinal fluid cortisol and clinical disease progression in MCI and dementia of Alzheimer’s type. Neurobiol Aging 36: , 601–607. |
[39] | Popp J , Schaper K , Kölsch H , Cvetanovska G , Rommel F , Klingmüller D , Dodel R , Wüllner U , Jessen F ((2009) ) CSF cortisol in Alzheimer’s disease and mild cognitive impairment. Neurobiol Aging 30: , 498–500. |
[40] | ClinicalTrials.gov NCT02727699: A Phase II Study to Assess the Safety, Tolerability and Efficacy of Xanamem™ in Subjects With Mild Dementia Due to AD (XanADu), https://clinicaltrials.gov/ct2/show/NCT02727699?term=X anadu&draw=2&rank=1, Last updated May 6, 2021, Accessed on March 3, 2022. |
[41] | Webster SP , McBride A , Binnie M , Sooy K , Seckl JR , Andrew R , Pallin TD , Hunt HJ , Perror TR , Ruffles VS , Ketelbey JW , Byd A , Walker BR ((2017) ) Selection and early clinical evaluation of the brain-penetrant 11β-hydroxysteroid dehydrogenase type 1 (11β-HSD1) inhibitor UE2343 (Xanamem). Br J Pharmacol 174: , 396–408. |
[42] | ClinicalTrials.gov NCT03830762: Xanamem™ in Healthy Elderly Subjects (XanaHES), https://clinicaltrials.gov/ct2/show/NCT03830762?term=xanamem&draw=2&rank=3,Last updated August 27, 2020, Accessed on September 20, 2021. |
[43] | Cogstate (2022) Computerized Cognitive Assessment. https://www.cogstate.com/, Last updated 2022, Accessed on January 30, 2022. |
[44] | Kueper JK , Speechley M , Montero-Odasso M ((2018) ) The Alzheimer’s Disease Assessment Scale-Cognitive Subscale (ADAS-Cog): Modifications and responsiveness in pre-dementia populations. A narrative review. J Alzheimers Dis 63: , 423–444. |
[45] | Wang J , Logovinsky V , Hendrix SB , Stanworth SH , Perdomo C , Xu L , Dhadda S , Do I , Rabe M , Luthman J , Cummings J , Satlin A ((2016) ) ADCOMS: A composite clinical outcome for prodromal Alzheimer’s disease trials. J Neurol Neurosurg Psychiatry 87: , 993–999. |


