
Obesity-Associated Neurodegeneration Pattern Mimics Alzheimer’s Disease in an Observational Cohort Study
Abstract
Background:
Excess weight in adulthood leads to health complications such as diabetes, hypertension, or dyslipidemia. Recently, excess weight has also been related to brain atrophy and cognitive decline. Reports show that obesity is linked with Alzheimer’s disease (AD)-related changes, such as cerebrovascular damage or amyloid-β accumulation. However, to date no research has conducted a direct comparison between brain atrophy patterns in AD and obesity.
Objective:
Here, we compared patterns of brain atrophy and amyloid-β/tau protein accumulation in obesity and AD using a sample of over 1,300 individuals from four groups: AD patients, healthy controls, obese otherwise healthy individuals, and lean individuals.
Methods:
We age- and sex-matched all groups to the AD-patients group and created cortical thickness maps of AD and obesity. This was done by comparing AD patients with healthy controls, and obese individuals with lean individuals. We then compared the AD and obesity maps using correlation analyses and permutation-based tests that account for spatial autocorrelation. Similarly, we compared obesity brain maps with amyloid-β and tau protein maps from other studies.
Results:
Obesity maps were highly correlated with AD maps but were not correlated with amyloid-β/tau protein maps. This effect was not accounted for by the presence of obesity in the AD group.
Conclusion:
Our research confirms that obesity-related grey matter atrophy resembles that of AD. Excess weight management could lead to improved health outcomes, slow down cognitive decline in aging, and lower the risk for AD.
INTRODUCTION
Obesity is increasingly recognized as a multisystem disease affecting respiratory, gastrointestinal, or cardiovascular systems, among others [1]. Excess weight has been directly linked to a number of metabolic changes, such as type 2 diabetes, hypertension, or dyslipidemia [2]. Only relatively recently has it been shown that, besides these metabolic changes, obesity is also related to changes in the central nervous system, themselves associated to poor cognition [3]. Our recent study of over 20,000 participants from the UK Biobank showed that increased body mass index, body fat percentage, and waist-to-hip ratio were related to worse fluid intelligence and working memory [4], domains also affected in preclinical and clinical Alzheimer’s disease (AD) [5, 6]. This adds to previous findings that identify obesity as a risk factor for AD [7–11].
We postulate that neurodegeneration (as evidenced by cortical thinning) is the main mechanistic pathway subtending these cognitive changes. Consequently, we wanted to investigate our first hypothesis, namely that obese but otherwise healthy individuals tend to show weight-related neurodegeneration, over and above age-related losses. In fact, animal studies provide some evidence, albeit limited, that obesity and type 2 diabetes lead to neuronal death, oxidative stress, and cytoskeleton degradation [12]. Excess weight is also related to cerebrovascular disease and a decrease in cerebral perfusion [13], which, in animals, affect predominantly the hippocampus, caudate, putamen, and the precentral and inferior frontal gyri [14].
These phenomena resemble AD. In fact, the same brain regions seem affected by both AD and obesity in humans [4, 15, 16]. As mentioned, obesity and AD also share several neurocognitive changes, although their severity is much greater in AD. Our second hypothesis is therefore that cortical atrophy patterns in obesity and AD will be spatially similar.
The specific pathologies in the brain that underlie any similarities between AD and obesity are not clear. These could entail white matter integrity changes, cerebrovascular disease and ischemia, grey matter degeneration, or increased accumulation of amyloid-β and tau proteins [12, 17]. In the case of amyloid-β and tau, assessing overlap with adiposity-related brain changes could help determine whether the latter represent a risk factor for AD versus actual prodromal AD. Therefore, a further question to be addressed is whether the pattern of cortical thinning in obesity also resembles distribution of abnormal proteins in AD.
In this study, we focus on cortical thickness from magnetic resonance imaging (MRI) scans, and explore first whether grey matter atrophy in obesity has a distinct pattern; then if that pattern resembles the one displayed in AD. We then investigate the correspondence between obesity-related neurodegeneration and amyloid-β and tau protein accumulation in grey matter of people with AD. If there is an overlap with AD-related atrophy patterns, it could explain the risk for the development of AD in obese individuals. We focus on cortical grey matter because it is an important endpoint of AD-related brain changes [18, 19].
We conducted this study using two large cohorts, the UK Biobank and the Alzheimer’s Disease Neuroimaging Initiative (ADNI), with additional data from a previous study on tau protein imaging in AD [20] and used measures of cortical thickness and amyloid-β/tau protein accumulation to test our hypotheses. First, we investigated a pooled sample of all available AD participants and their age- and sex-matched cognitively healthy controls, as well as obese and lean participants from the UK Biobank. We then followed-up this analysis by dividing AD participants into lean and obese groups to investigate whether the similarities between brain patterns in AD and obesity are influenced by weight status of the AD group. Finally, to investigate specific mechanisms that might drive the similarities between obesity- and AD-related brain atrophy we tested for spatial overlap between obesity and amyloid-β and tau positron emission tomography (PET) brain maps [21, 22]. Our results shed light on neural changes that can drive the risk for AD in obese individuals.
MATERIALS AND METHODS
Participants
Main AD sample
To investigate AD-related brain changes, we obtained data from the ADNI database (http://adni.loni.usc.edu). ADNI was launched in 2003 as a public-private partnership, led by Principal Investigator Michael W. Weiner, MD. The primary goal of ADNI has been to test whether serial MRI, PET, other biological markers, and clinical and neuropsychological assessment can be combined to measure the progression of mild cognitive impairment and early AD. The ADNI study was approved by the institutional review board of all participating sites and written informed consent was obtained from all participants before inclusion in the study.
The ADNI database contains multiple brain imaging data collected at longitudinal time points. We only used MRI collected at entry. Therefore, participants were included in our study provided they had a T1-weighted MRI from timepoint 1 that passed post-processing quality control. We selected two groups of participants:
– The AD group was composed of participants with a diagnosis of mild AD dementia at entry into the study, subjective memory complaints, a Mini-Mental Status Exam score of 20 to 26, evidence of deficits on the Wechsler memory scale (for complete clinical criteria see Petersen et al. [23]), and positive amyloid-β-PET (see: Data processing).
– The cognitively healthy control (HC) group was composed of participants who had no diagnosis of AD, other type of dementia, or any evidence of mild cognitive impairment at any timepoint in the longitudinal ADNI study.
Since the HC group was larger than the AD group, we matched HC participants based on body mass index (BMI), age, and sex to AD participants (see: Matching algorithm).
Follow-up AD samples
For follow-up analyses investigating how weight status of AD individuals influences the correspondence between AD and obesity maps, both AD and HC participants were divided into lean, overweight, and obese sub-groups based on their BMI values (lean 18.5 kg/m2 < BMI <25 kg/m2, overweight 25 kg/m2≤BMI ≤30 kg/m2, obese BMI >30 kg/m2 [24]). The overweight AD group was only included in the main AD sample, and not in follow-up analyses.
Body weight samples
To investigate obesity-related brain changes, we used the UK Biobank dataset, a large scale study with extensive phenotyping and brain imaging data [25, 26]. Details of recruitment, measurement methodologies, and quality control are available at https://www.ukbiobank.ac.uk and in the cited publications. Our study was performed under UK Biobank application ID 35605.
All participants signed informed consent forms prior to participating in the study, which was approved by the North-West Multi-centre Research Ethics Committee. All UK Biobank actions are overseen by the UK Biobank Ethics Advisory Committee.
Our initial sample was composed of all cognitively healthy UK Biobank participants without a diagnosis of neurological illness (see Supplementary Tables 1 and 2) with available MR imaging data that passed post-processing quality control. Because this initial sample was larger than the AD group, we age- and sex-matched UK Biobank individuals to AD participants from ADNI to form our final Obesity sample (see: Matching algorithm). Obesity sample participants were divided into lean, overweight, and obese sub-groups based on BMI (lean 18.5 kg/m2 < BMI <25 kg/m2, overweight 25 kg/m2≤BMI ≤30 kg/m2, obese BMI >30 kg/m2 [24]). The overweight group was not included in any analysis as we created the obesity brain maps by comparing lean and obese individuals. Subsequently, body weight samples were matched to the main AD sample and follow-up AD samples (see: Matching algorithm).
Amyloid-β sample
To investigate similarities between the obesity atrophy brain maps and amyloid-β distribution, we used data from all individuals in the ADNI database with available PET data reflecting amyloid-β concentrations derived using the tracer [18F]florbetapir [27]. The sample consisted of 764 amyloid-positive and 576 amyloid-negative individuals, irrespective of diagnosis [28] and was derived independently of the cortical thickness sample.
Tau sample
To investigate how tau protein accumulation is related to obesity, we obtained PET maps with the tracer [18F]flortaucipir of 447 tau-positive individuals from a previous study [20]. This sample included both cognitively healthy individuals as well as AD and mild cognitive impairment patients. Characteristics of this sample can be found in [20].
Matching algorithm
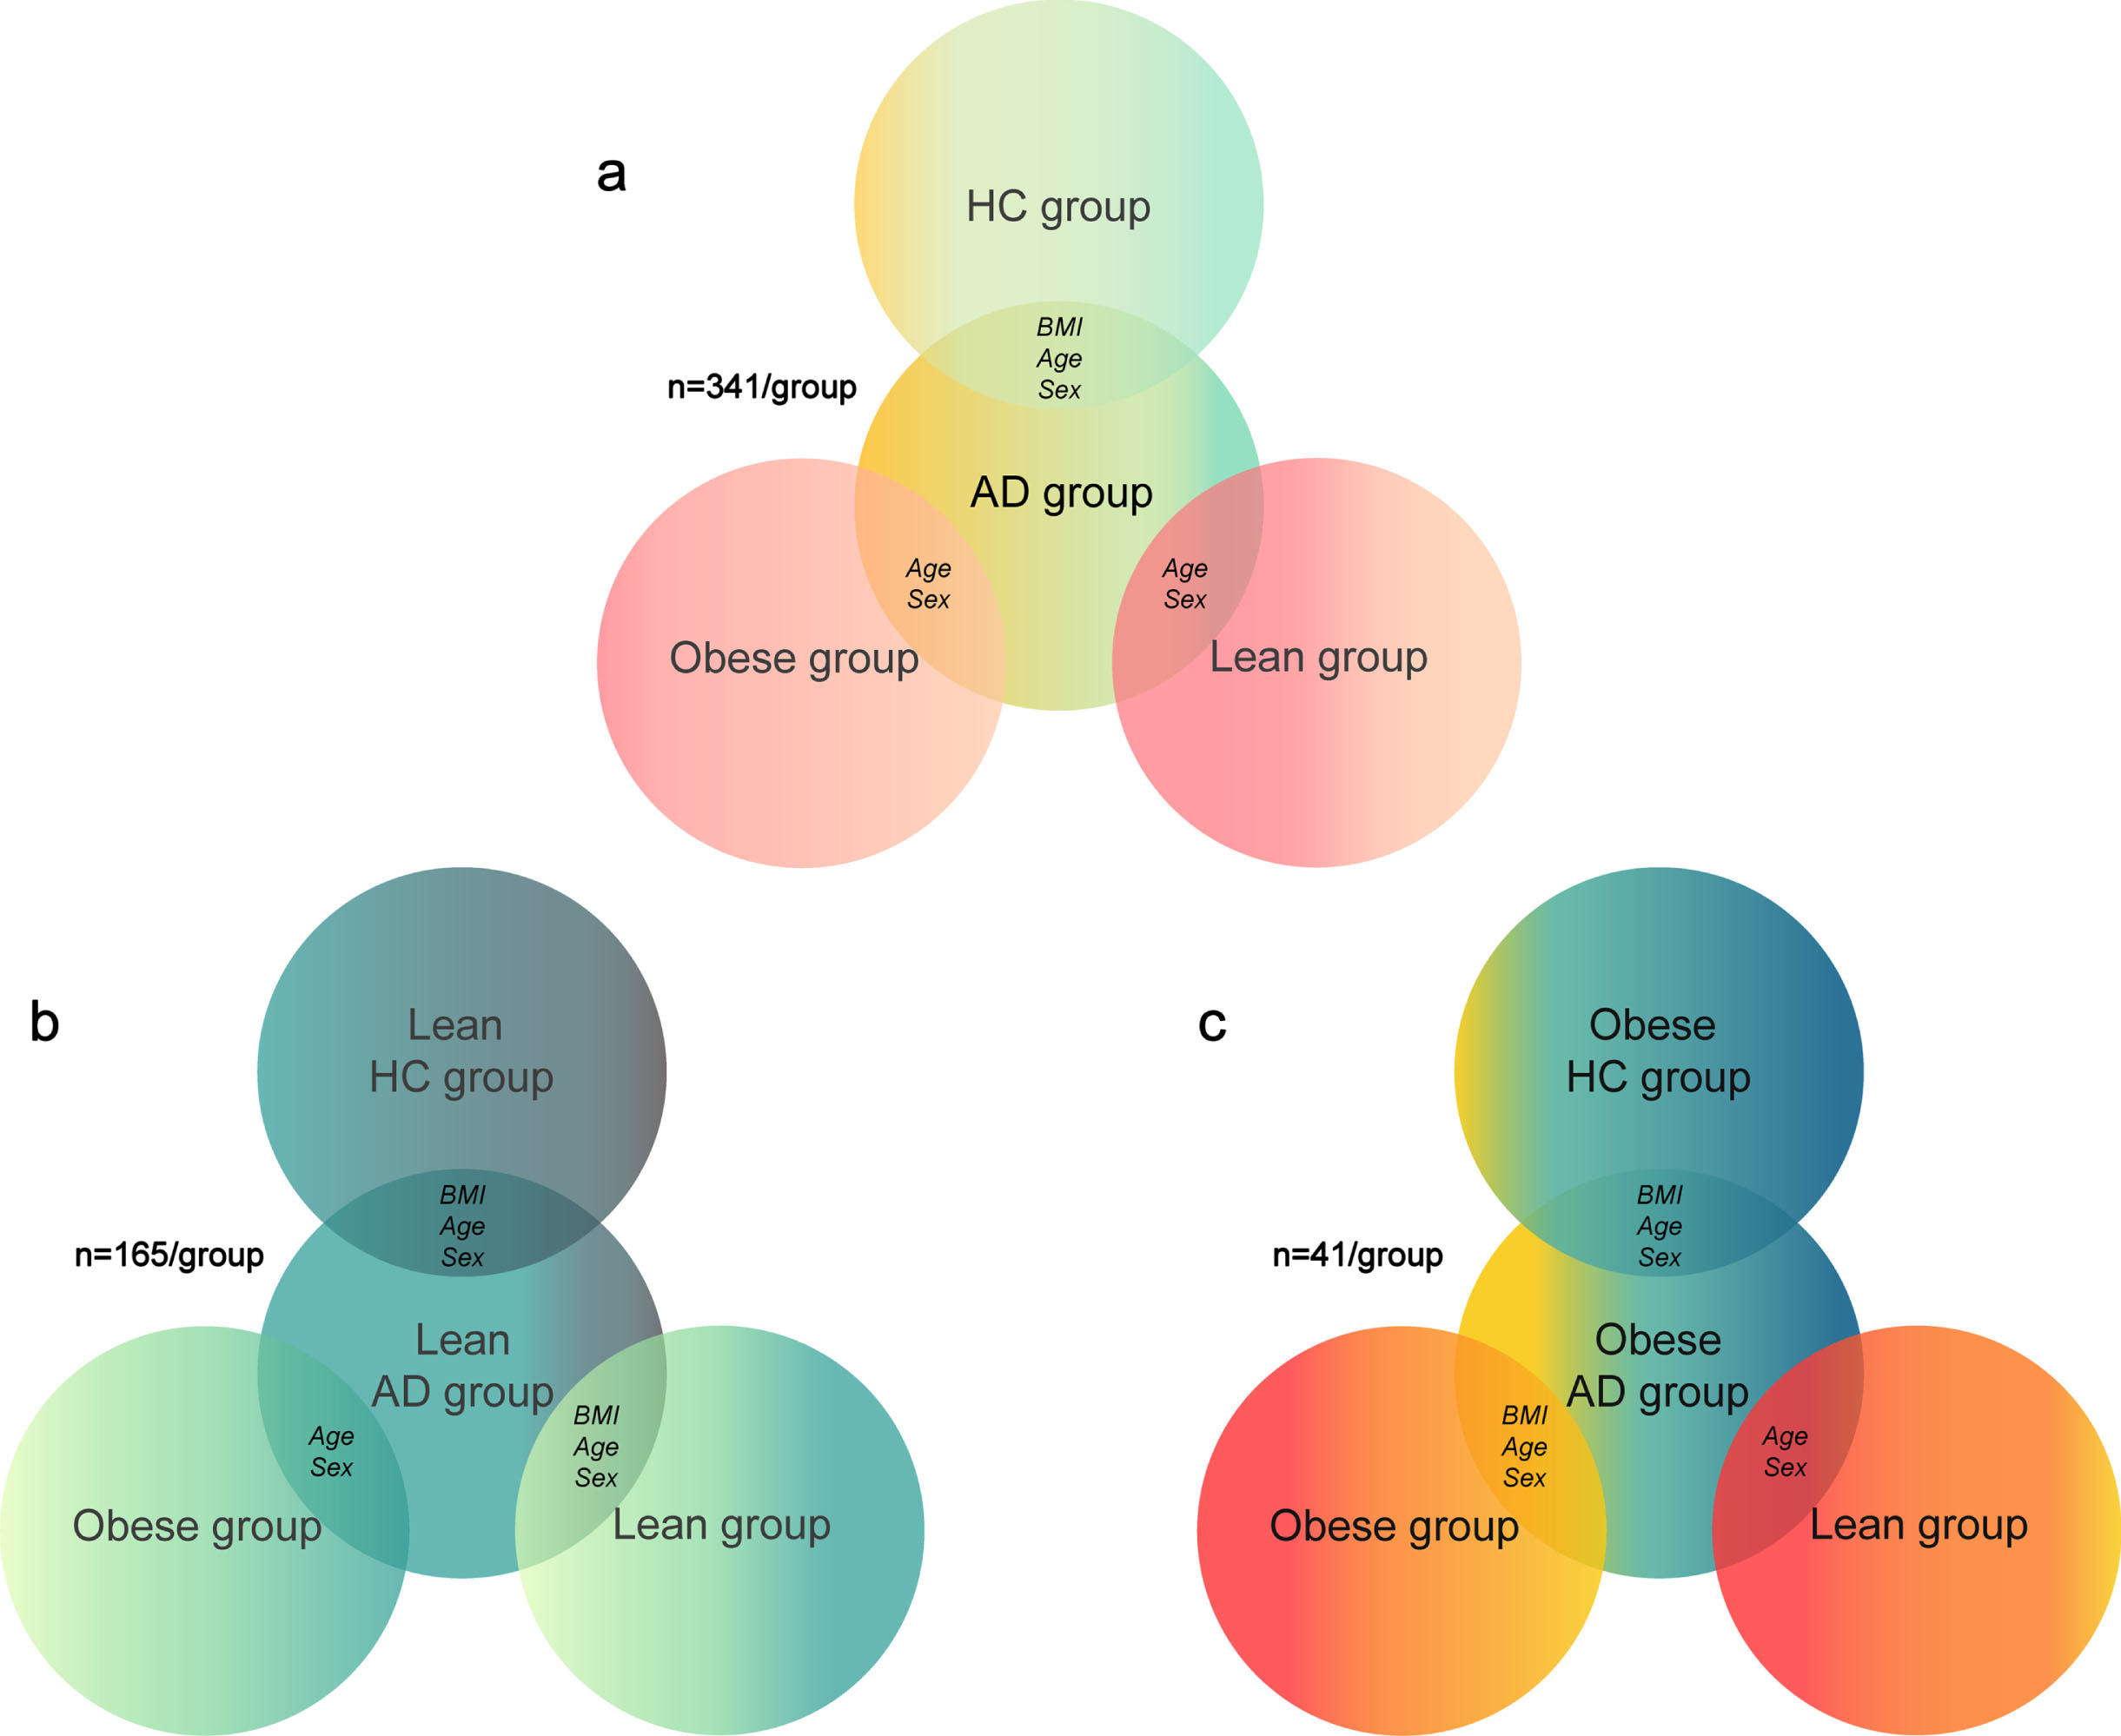
We used the MatchIt package in R [29] with the ‘nearest’ method to derive four equally sized samples of n = 341 participants, namely AD and HC from ADNI, and Obese and Lean from the UK Biobank. Nearest neighbor matching used here is the most popular form of propensity score matching and involves matching based on distance of propensity scores calculated for treatment and control groups [30]. The algorithm chooses the control unit that is closest to the treatment unit in the value of propensity scores.
Even after matching, the standardized mean difference— a coefficient assessing quality of matching— was larger than 0.1 for age and sex, therefore, we included both as covariates in linear regression analyses when deriving AD and obesity brain maps [31].
Main samples
Our main analysis pooled all AD participants and their BMI-, sex-, and age-matched controls from the ADNI database. This way, by comparing AD participants and HC, we were able to obtain AD brain maps that were not confounded by BMI (Fig. 1a). We also age- and sex-matched lean and obese participants from the UK Biobank to AD participants. In this step we did not use BMI to match participants as we wanted to include the full BMI spectrum in the AD sample.
Fig. 1
Matching algorithm for a) full sample; b) sample of lean patients with Alzheimer’s disease (AD); c) sample of obese patients with AD. HC, healthy controls; BMI, body mass index
Follow-up samples
For our follow-up analyses, we divided the AD and HC groups from ADNI into lean and obese sub-groups to investigate how weight status in AD affects similarity between AD and obesity brain patterns. In these secondary analyses we did not include overweight AD individuals as the goal here was to investigate whether lean or obese status of AD patients is differently related to brain changes linked with obesity.
The lean HC groups from ADNI and from the UK Biobank were BMI-, age-, and sex-matched to the lean AD group (n = 165 for each group), while the obese group from the UK Biobank was only age- and sex-matched to the lean AD group (n = 165; Fig. 1b). The obese HC group from ADNI and obese group from the UK Biobank were BMI-, age-, and sex-matched to the obese AD group (n = 41 for each group), while the lean group from the UK Biobank was only age- and sex-matched to the obese AD group (n = 41; Fig. 1c).
Creating AD and obesity brain maps
Data processing
AD sample
Detailed imaging data collection protocols for the ADNI study can be found at http://adni.loni.usc.edu/methods/documents/mri-protocols/. Imaging protocols have been developed specifically to account for differences in MRI hardware and software across study sites [32]. We processed T1 images with FreeSurfer [33] (v. 6.0) using the “recon-all -all” command with the fully-automated directive parameters (no manual intervention or expert flag options) and the longitudinal pipeline to derive cortical thickness measures for each parcel of the Desikan-Killiany-Tourville (DKT) atlas [34]. Segmentations were visually inspected through at least 20 evenly distributed coronal sections and images with segmentation problems were excluded from our study before matching.
PET data collection and quality control protocols can be found at https://adni.loni.usc.edu/methods/pet-analysis-method/pet-analysis/. Scanner-specific preprocessing steps were applied to each dataset to harmonize data analysis between study sites [27]. PET-amyloid-β positivity in AD participants was determined using data provided by ADNI on an average standard uptake value ratio (SUVR) of the florbetapir amyloid-β tracer [27]. The SUVR was calculated using a weighted average of the frontal, temporal, parietal, and cingulate grey matter regions and normalized by the whole cerebellum region [27]. We used an ADNI-recommended threshold of 1.11 to determine amyloid-β positivity and excluded all ADNI participants who were below this threshold from further analyses [28].
Obesity sample
For analyses in the UK Biobank sample, we used imaging derived phenotypes available from the UK Biobank. Imaging pipeline details can be found inAlfaro-Almagro et al. [35]. We used quality-controlled cortical thickness data derived from FreeSurfer [33] (v.6.0) for each parcel of the DKT atlas [34].
Obesity and AD brain maps
We used general linear models (GLM) to create AD and obesity cortical thickness maps to later compare them with each other. To calculate AD brain maps, we input cortical thickness values for each parcel of the DKT atlas in separate GLMs as outcome variables, and group (AD versus HC), age, sex, scanner field strength, and scanning site as explanatory variables. Each parcel of the DKT atlas was assigned a value of a beta estimate of the grouping variable. In other words, we obtained maps of cortical thickness differences between AD and HC groups that should be indicative of the effect of this neurodegenerative pathology.
To calculate obesity cortical thickness maps, we used a similar procedure this time with group (obese versus lean), age, sex, and scanning site as explanatory variables, and UK Biobank Freesurfer data as outcome variables.
All the above procedures were repeated for the lean AD and obese AD samples and their matched counterparts from the HC, obese and lean groups.
Analyses were performed using R (v. 3.6.1). Scripts for all analyses can be found at https://github.com/FilipMorys/AD-Obesity.
Amyloid-β brain maps
Amyloid-β maps were created by averaging ADNI preprocessed florbetapir PET data separately for amyloid-positive and amyloid-negative individuals. Data were available in regions defined using the DKT atlas [27, 34]. We calculated amyloid-β values by subtracting average PET signal of amyloid-negative individuals from that of amyloid-positive individuals for each parcel of the DKT atlas (Supplementary Figure 1).
Tau brain maps
Tau brain maps were obtained from https://neurovault.org/collections/12296/. This dataset represents average tau across 447 individuals determined to be tau-positive based on mixture modeling, where processing details can be found in [20]. Similarly to amyloid-β maps, preprocessed PET images were pooled to create an average tau brain map. SUVR was then calculated for each parcel of the DKT atlas (Supplementary Figure 2).
Spin tests
To test for spatial correspondence (correlation) between AD, obesity, tau, and amyloid-β maps, we used Spearman correlations. Because of a high degree of autocorrelation between neighboring DKT parcels of the brain, classically derived p-values from correlations of two brain maps are not reliable and spatial permutation tests are recommended [36, 37]. These tests are called spin tests because a spherical projection of the brain surface of one of the two brain maps is spun, back-projected onto the brain surface and compared to the other brain map at hand. Such permutation strategy generates null models that preserve spatial relationships between brain parcels. It is repeated n times and each time a new correlation coefficient is calculated, thus creating a null-distribution of said coefficients. This allows the derivation of a permutation-based p-value that takes into account spatial autocorrelation. Here, for all tests, we used n = 10,000 permutations. Functions used to perform spin tests for parcellated brain data can be found at https://github.com/frantisekvasa/rotate_parcellation.
RESULTS
Groups
The initial ADNI sample consisted of 380 AD participants and 597 HC participants. We excluded 22 AD and 17 HC participants with images with segmentation problems before matching. Additionally, 17 AD participants were PET-amyloid-negative and were removed from further analyses. The final AD group was composed of 341 participants, with 165 and 41 in the lean and obese sub-groups, respectively. Remaining participants belonged to the overweight group. After matching, there were equal numbers of HC participants in each group orsub-group.
The final number of participants with available Imaging data in the UK Biobank was 34,110. UK Biobank field IDs used in this study can be found in Supplementary Table 2. Due to matching, there was an equal number of participants from the UK Biobank in the Obese and Lean groups as in the ADgroup.
Ethnicity distribution was significantly different between AD and UK Biobank samples (601 white individuals in the ADNI sample, 668 in the UK Biobank sample; χ2 = 77.251, p < 0.001). Remaining group characteristics can be found in Table 1.
Table 1
Age, body mass index, and sex distribution of all samples used in the study. AD, Alzheimer’s disease; HC, healthy control
| Sample | Characteristic | AD | HC | Obese | Lean |
| group | group | group | group | ||
| Full sample | Age [y] | 75.0 | 75.0 | 74.0 | 73.0 |
| Body mass index [kg/m2] | 25.51 | 25.24 | 33.04 | 22.98 | |
| Number of women | 158 | 119 | 158 | 158 | |
| Lean-AD sample | Age [y] | 72.0 | 74.0 | 74.0 | 73.0 |
| Body mass index [kg/m2] | 22.24 | 22.89 | 32.84 | 21.87 | |
| Number of women | 91 | 128 | 97 | 97 | |
| Obese-AD sample | Age [y] | 74.0 | 71.0 | 71.0 | 72.0 |
| Body mass index [kg/m2] | 33.70 | 34.07 | 33.73 | 23.04 | |
| Number of women | 15 | 9 | 16 | 15 |
Full sample obesity brain maps and correlations with AD brain maps
In line with previous findings, we identified widespread reduced cortical thickness in individuals with obesity, primarily affecting frontal, parietal, and temporal brain areas (Fig. 2). This pattern was only obvious in the full sample and not the reduced lean- or obese-AD-matched samples, which is likely a function of lower size of the latter samples.
Fig. 2
Brain maps of a) Alzheimer’s disease (AD) and obesity in the full sample; b) AD and obesity in the sample of lean AD patients and other matched samples; c) AD and obesity in the sample of obese AD patients and other matched samples. Color bars depict β estimates.
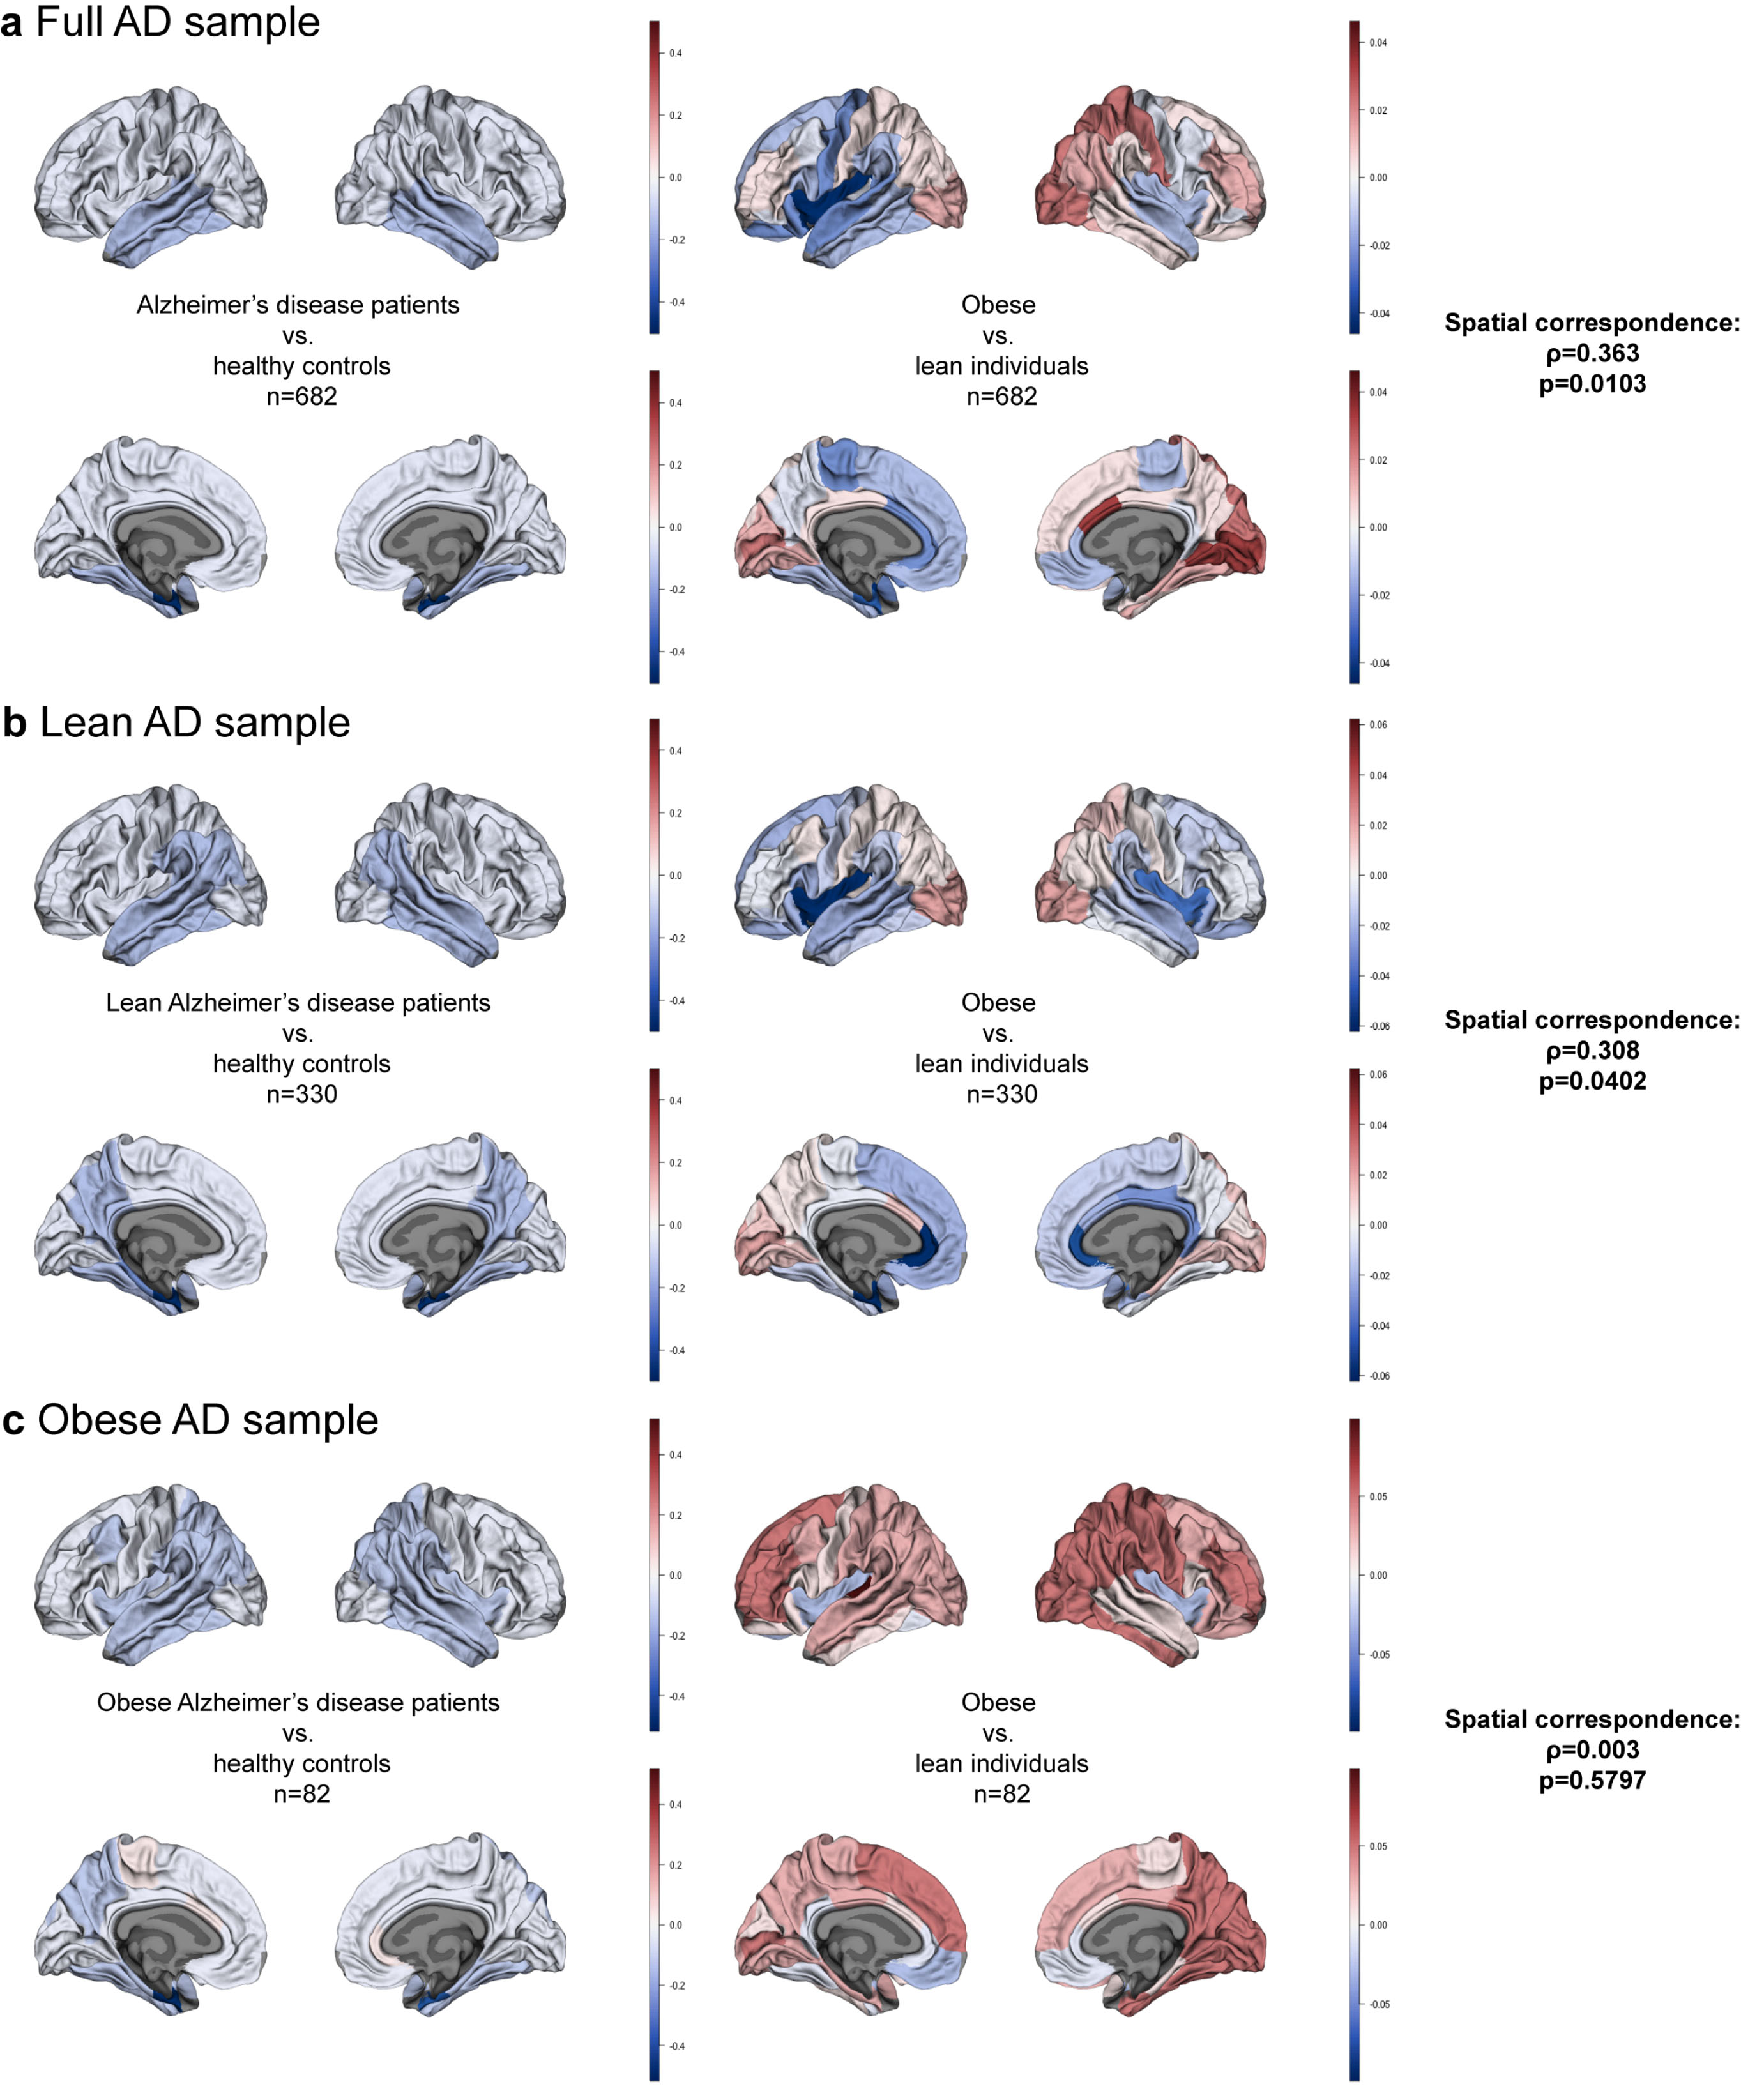
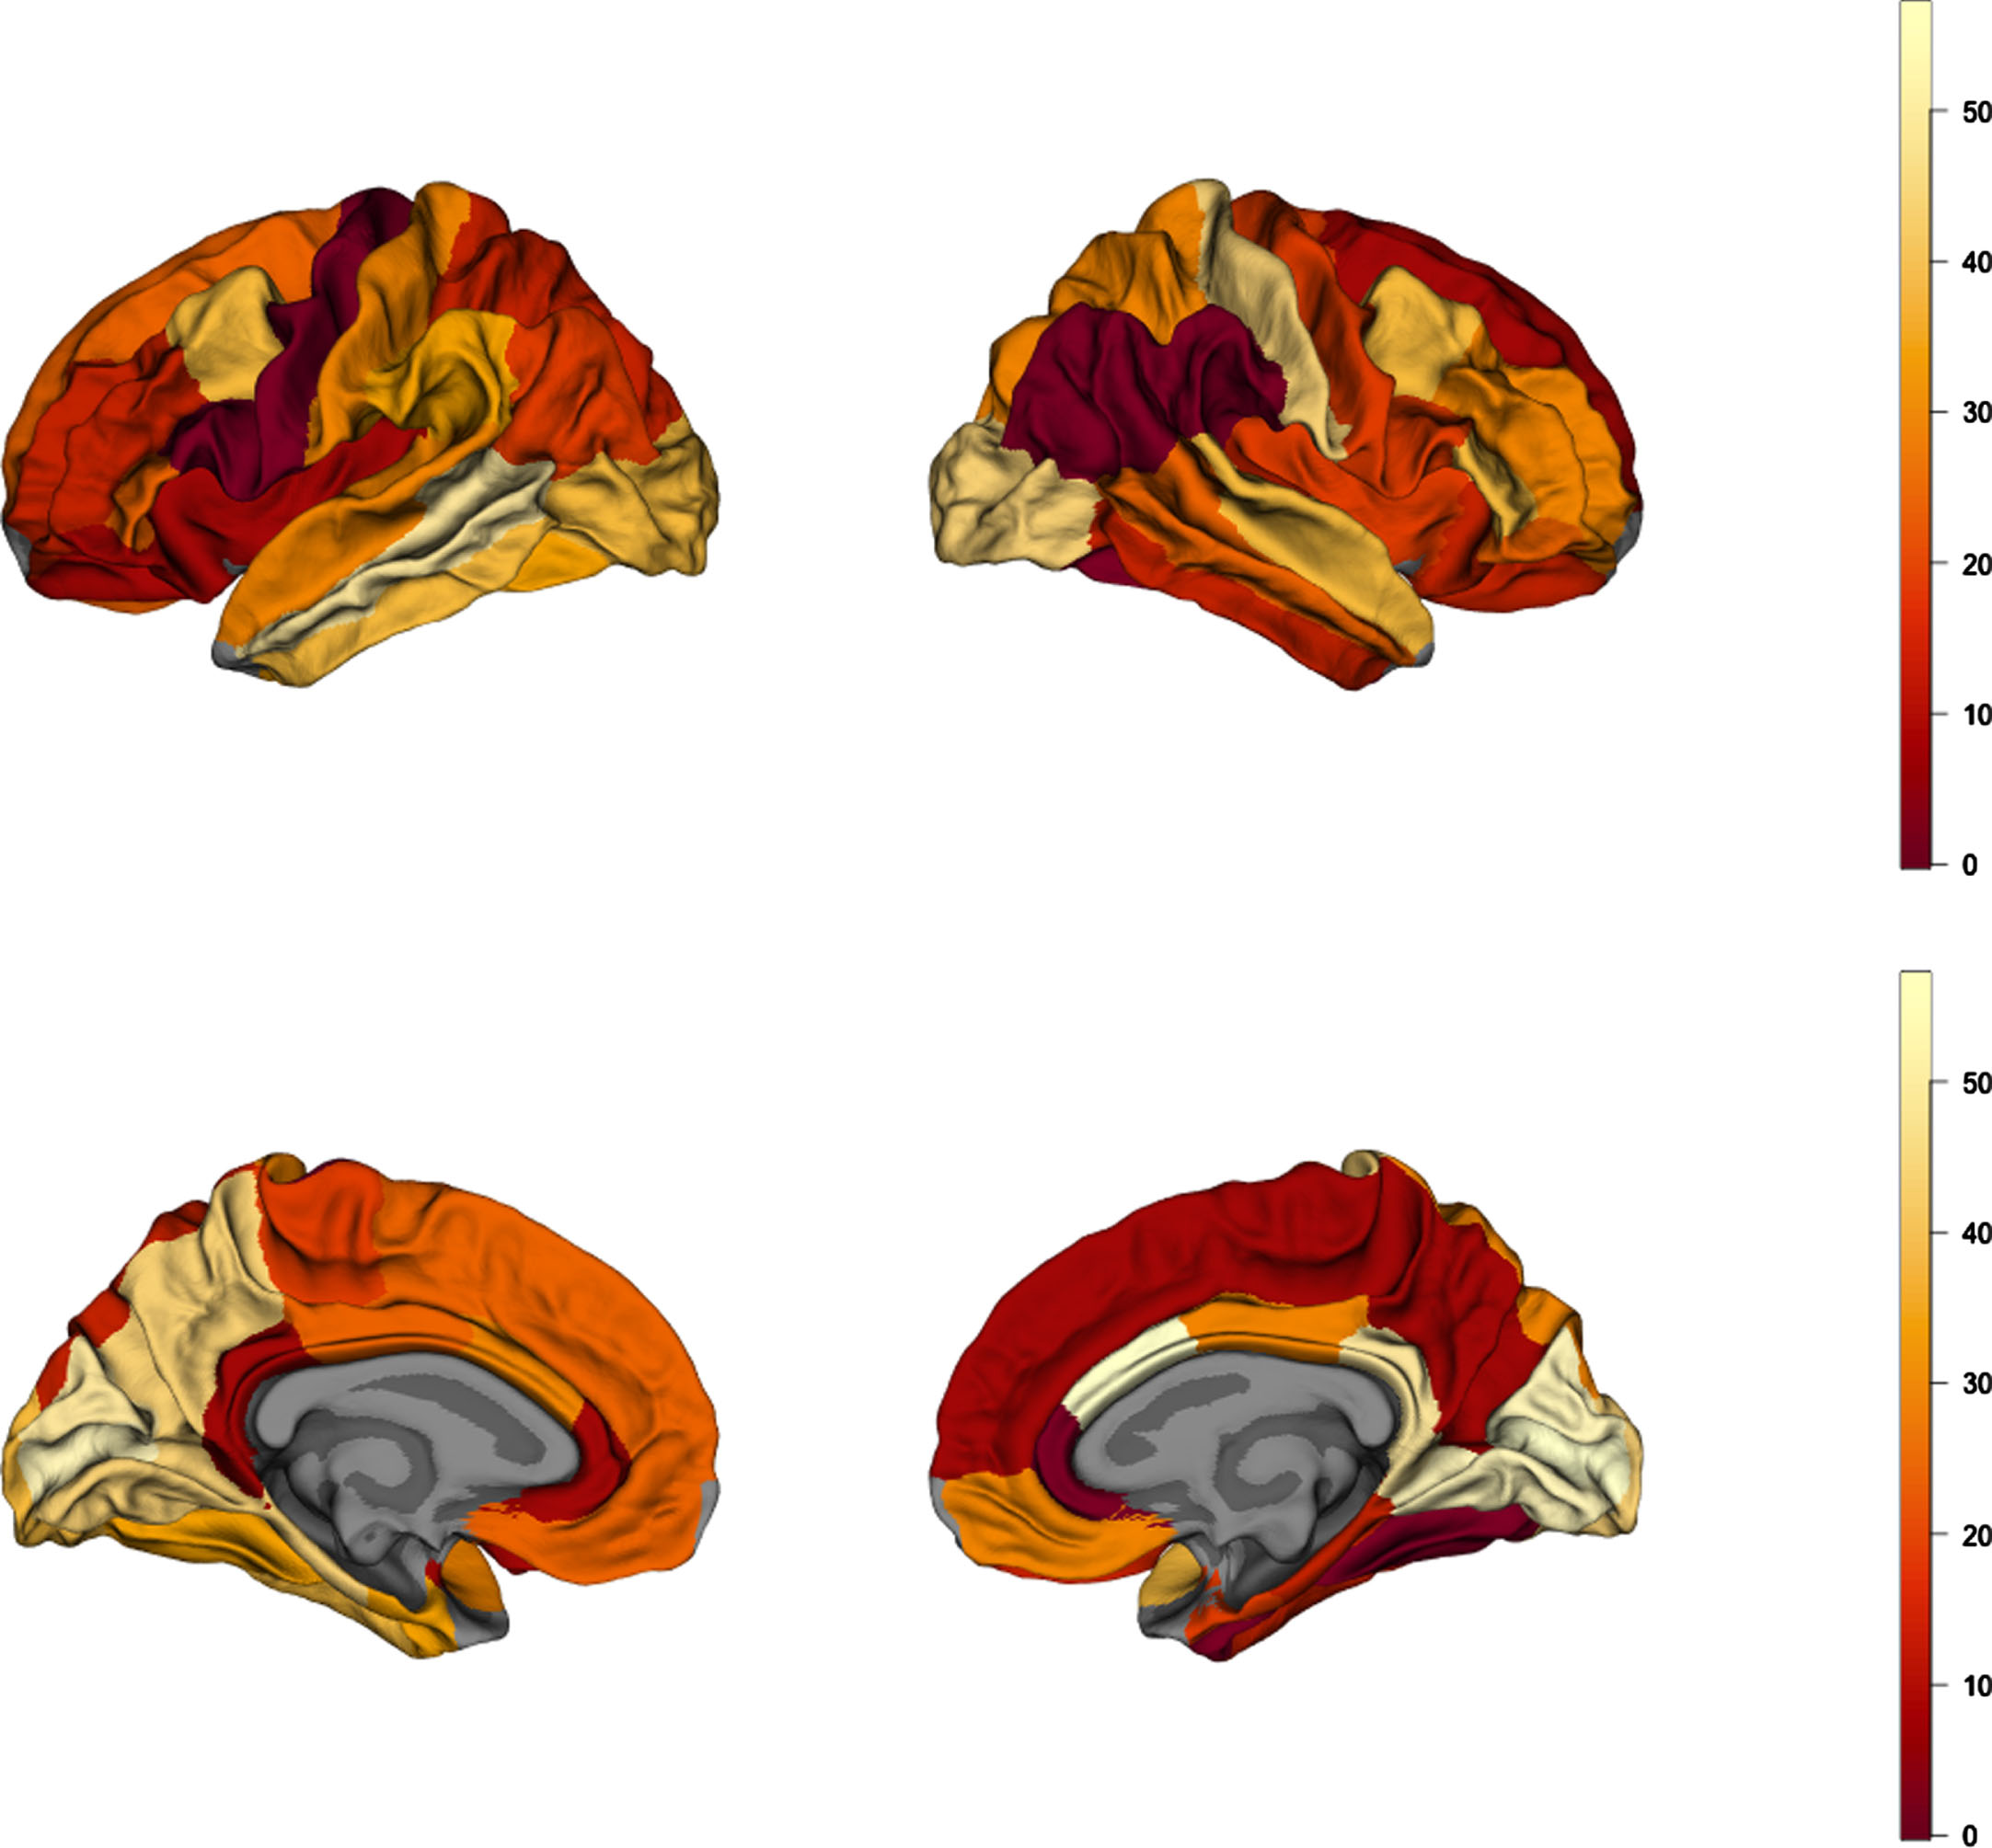
Using Spearman’s correlation and spin tests we established the degree of spatial correspondence between AD and obesity maps for the full sample (n = 341/group; Supplementary Tables 3 and 4). We found a correlation coefficient ρ= 0.363 (pspin = 0.0103) pointing to a positive correlation between cortical thickness patterns in AD and obesity (Fig. 2a). Figure 3 shows a map of absolute values of rank differences between obesity and AD brain maps–it represents which brain regions are most similar and dissimilar between the two full samples in terms of their ranks within each sample. Regions with lowest rank differences were the right inferior parietal cortex, left pars opercularis, right supramarginal gyrus, left precentral gyrus, right rostral anterior cingulate cortex, and the right fusiform gyrus. The right temporo-parietal cortex thickness was overall strongly correlated between AD and obesity, similarly to the left prefrontal cortex. We observed a notable left-right asymmetry in the similarities between AD and obesity cortical thickness maps, where correspondence patterns between hemispheres were different. This is likely driven by asymmetry patterns observed in obesity maps alone; in the full sample for obesity, we found left-right asymmetry, with higher differences between obese and lean participants in the left hemisphere(Fig. 2a).
Fig. 3
Brain map of absolute values of rank differences between AD and obesity cortical-thickness maps. Lower values represent higher rank similarity of the parcels, depicting regions of highest similarity between AD and obesity.
Correlation between AD and obesity brain maps in lean AD patients
Here, we used a subsample of lean AD participants and their BMI-, sex-, and age-matched HC, and compared them to obese and lean samples from the UK Biobank matched to the lean ADNI sample (n = 165/group; Supplementary Tables 5 and 6; Fig. 1b). We found significant correlations between the lean-AD and obesity maps (ρ= 0.308, pspin = 0.0402; Fig. 2b).
Correlation between AD and obesity brain maps in obese AD patients
Here, we only used a subsample of obese AD participants and their BMI-, age-, and sex-matched HC, but also obese and lean individuals from the UK Biobank matched to the obese ADNI sample (n = 41/group; Supplementary Tables 7 and 8; Fig. 1c). We found no spatial correspondence between the obese-AD and obesity maps (ρ= 0.003, pspin = 0.5797; Fig. 2c).
Correlation between obesity and amyloid-β/tau brain maps
We found no significant correlation between the obesity brain map and either the amyloid-β or tau brain maps (amyloid-β: ρ= 0.079, pspin = 0.3128, tau: ρ= 0.170, pspin = 0.1595).
DISCUSSION
This cross-sectional study was designed to investigate the degree of similarity between brain atrophy patterns in obesity and AD. Using a sample of over 1,300 participants, we showed that patterns of cortical thinning related to obesity (’obesity brain maps’), corrected for the effects of age and sex, correlated with similar patterns from AD brain maps. We also showed that this correlation was present when the AD sample was restricted to lean participants. Brain regions whose similarity between AD and obesity was the highest were located predominantly in the right temporal and left prefrontal cortex. Finally, we show that obesity-related atrophy patterns did not overlap with amyloid-β or tau protein distribution in the brain of people with AD. Note that individuals with obesity in this study were cognitively healthy and had no diagnosis of a neurologicaldisorder.
These results are consistent with our hypotheses and support an extensive literature that identifies mid-life obesity as a risk factor for AD [8–10, 38–41]. For example, a study by Hayes and colleagues showed that high BMI was associated with higher cerebrospinal fluid biomarkers of AD independent of genetic risk for AD [42]. In a large prospective study with autopsy data, mid-life obesity was associated with earlier onset of AD and increased AD neuropathology [43]. Those findings are supported by a meta-analysis and review, which also shows that mid-life obesity is related to late-life dementia [44].
It is important to note that not all areas affected by obesity overlap with areas affected by AD, as evidenced by our correlation analyses. AD-vulnerable brain regions which tend to show the first signs of neurodegeneration and cortical thinning are the temporoparietal and frontal lobes [15, 16, 45, 46]. Obesity-related neurodegeneration found in this and other studies also tends to follow this pattern [4, 47]. Of note here is the fact that we observed a left-right hemispheric asymmetry in obesity brain maps when investigating the full sample of 682 individuals. This phenomenon has been described in previous studies [47], albeit with opposite asymmetry patterns. However, findings on the topic are mixed [48]. Given that the asymmetry was not observed in all our samples used to derive obesity brain maps, we believe that it might be an artifact of low sample sizes that may not reflect true asymmetries. This will need to be tested in studies using larger sample sizes.
Some studies show causal associations between obesity and AD. A study in mice showed that high fat diet-induced obesity led to accumulation of amyloid-β in the cortex, which could be reversed with a low-fat diet [49]. This effect was also paralleled by upregulation of receptor for advanced glycation end products (RAGE), a receptor that mediates transport of amyloid-β into the brain [50].
In this context, there are different mechanisms that could link brain changes in obesity and AD. Our analysis utilizing amyloid-β and tau brain maps allows us to speculate on some of them. Although mid-life obesity is a risk factor for AD and dementia, the participants in the UK Biobank study were without a neurological diagnosis. We found that cortical thinning in obesity overlaps with cortical thinning in AD, but not with amyloid-β or tau distribution. Thus, adiposity-related cortical atrophy may, in vulnerable individuals, precede the development of the amyloid– tau cascade before leading to an eventual AD phenotype. Neuronal injury in obesity can occur because of cerebrovascular disease or be directly related to other factors such as inflammation, hypertension, or diabetes, all of which have been linked to AD-related pathology, e.g., increased amyloid-β accumulation, impaired amyloid-β clearance, or tau protein overexpression [51–55]. Other mechanisms of neuronal injury could involve insulin and leptin resistance [4, 51, 53, 55–59]. Normally, insulin and leptin protect neurons from synaptotoxicity caused by amyloid-β and help with its clearance [56, 57]. This function is impaired in individuals with obesity, thus possibly promoting the formation and accumulation of abnormal protein isoforms [7, 56, 57, 60, 61]. The eventual spatial distribution of these isoforms will depend on connectomics and local factors, as shown previously [20, 62, 63]. Thus, the final distribution of phosphorylated tau extends beyond the initial site(s) of origin of the disease process.
It is also possible that neurodegeneration in adiposity and AD are independent processes. An obesity pattern of cortical thinning in AD could merely represent the higher occurrence of obesity and its cerebrovascular complications in AD populations. In favor of this interpretation is the fact that, although significant, the correlation between AD and adiposity-related atrophy patterns was small. Against it, however, is the fact that lean AD patients also displayed the adiposity-related pattern of cortical thinning. This latter finding may suggest another interpretation, namely that certain brain regions are more vulnerable to atrophy from any cause, for example due to local factors such as energy usage. Indeed, regions affected in AD tend to be high degree nodes (with multiple connections) that display high glucose utilization, synaptic remodeling, and aerobic glycolysis [64]. Regions with high energy needs may also exhibit vulnerability to vascular compromise or insulin resistance seen in the metabolic syndrome. We have no way based on the data presented here of ruling out the occurrence of independent atrophy mechanisms in AD and adiposity.
The cross-sectional, correlational, and between-subject design of this study is a major limitation in the interpretation of our findings. A longitudinal and within-subject design would allow us to infer causality in terms of obesity and related dementia. Also, we only investigated whether lean or obese, but not overweight, status of AD patients affects the relationship between AD- and obesity-related brain atrophy patterns. This is because we were not able to match overweight AD patients with individuals from the body weight sample as we generated the obesity brain maps by comparing obese versus lean individuals. However, in our main analyses we have also included overweight AD patients and showed that AD-related brain changes over the entire spectrum of BMI are similar to obesity-related brain changes. Another limitation is the relatively small sample size, so that a replication in larger cohorts is warranted. Relatedly, we did not find a spatial correspondence between obese AD sample brain maps and obesity maps, which could be due to a low sample size in this analysis (n = 41/group). Further, we did not obtain information on participants’ diet, which could help address the role of specific dietary components, such as higher fat intake, in obesity-related brain atrophy. We also did not obtain information on the Apolipoprotein E (APOE) allele status of our participants. It is conceivable that the groups were alike in terms of APOE allele distribution which could account for similarities between obesity- and AD-related brain maps [65]. In the same vein, we found that our groups differed in terms of racial composition, with the ADNI group including more non-white individuals. This could be a potential confounding factor given that genetic distribution of APOE alleles and their influence on cognition differs between white and black individuals [66, 67]. This fact should be accounted for and tested in future studies on the topic. Nevertheless, racial composition of both samples was predominantly white, and it should therefore be noted that our results might not generalize to other populations that often have a different risk factor profile for cerebrovascular disease [68]. Further, in the comparison between cortical thickness maps and amyloid-β/tau brain maps, our samples only partially overlapped with the ADNI sample used for cortical thickness analyses, which could have influenced our results. Finally, our study focused predominantly on cortical thickness. Other measures of brain structure, such as subcortical volumes or deformation-based morphometry would allow investigation of changes in subcortical structures and white matter, which are also known to be affected by AD[63, 69].
In sum, our study shows the similarities between cortical atrophy in obesity and AD. It strengthens the previous body of literature pointing to obesity as a significant risk factor for AD by showing that cortical thinning might be one of the potential risk mechanisms. It is also possible that cortical thinning in an early AD pattern could represent prodromal AD in a proportion of the obese participants. The strength and uniqueness of this study lies in a direct comparison between obesity- and AD-related cortical thickness, but also amyloid and tau brain maps. While more studies in humans are needed to delineate the specific mechanisms through which obesity increases AD risk, we are providing evidence that cortical grey matter atrophy may be a risk factor that ultimately leads to dementia in obese individuals. Together with previous studies summarizing positive effects of healthy diets on risk for AD [70], this study has clinical implications. Our results highlight the importance of interventions aimed at decreasing weight and metabolic risk factors in obese and overweight individuals in mid-life to decrease the subsequent risk of neurodegeneration and dementia in the population.
ACKNOWLEDGMENTS
This work was supported by a Foundation Scheme award to AD from the Canadian Institutes of Health Research, computing resources from Calcul Quebec (http://www.calculquebec.ca) and Compute Canada http://www.computecanada.ca, and by a postdoctoral fellowship from Fonds de Recherche du Québec – Santé to FM.
Data collection and sharing for this project was funded by the Alzheimer’s Disease Neuroimaging Initiative (ADNI) (National Institutes of Health Grant U01 AG024904) and DOD ADNI (Department of Defense award number W81XWH-12-2-0012). ADNI is funded by the National Institute on Aging, the National Institute of Biomedical Imaging and Bioengineering, and through generous contributions from the following: AbbVie, Alzheimer’s Association; Alzheimer’s Drug Discovery Foundation; Araclon Biotech; BioClinica, Inc.; Biogen; Bristol-Myers Squibb Company; CereSpir, Inc.; Cogstate; Eisai Inc.; Elan Pharmaceuticals, Inc.; Eli Lilly and Company; EuroImmun; F. Hoffmann-La Roche Ltd and its affiliated company Genentech, Inc.; Fujirebio; GE Healthcare; IXICO Ltd.; Janssen Alzheimer Immunotherapy Research & Development, LLC.; Johnson & Johnson Pharmaceutical Research & Development LLC.; Lumosity; Lundbeck; Merck & Co., Inc.; Meso Scale Diagnostics, LLC.; NeuroRx Research; Neurotrack Technologies; Novartis Pharmaceuticals Corporation; Pfizer Inc.; Piramal Imaging; Servier; Takeda Pharmaceutical Company; and Transition Therapeutics. The Canadian Institutes of Health Research is providing funds to support ADNI clinical sites in Canada. Private sector contributions are facilitated by the Foundation for the National Institutes of Health (http://www.fnih.org). The grantee organization is the Northern California Institute for Research and Education, and the study is coordinated by the Alzheimer’s Therapeutic Research Institute at the University of Southern California. ADNI data are disseminated by the Laboratory for Neuro Imaging at the University of Southern California.
Authors’ disclosures available online (https://www.j-alz.com/manuscript-disclosures/22-0535r2).
SUPPLEMENTARY MATERIAL
[1] The supplementary material is available in the electronic version of this article: https://dx.doi.org/10.3233/JAD-220535.
REFERENCES
[1] | Sarma S , Sockalingam S , Dash S ((2021) ) Obesity as a multisystem disease: Trends in obesity rates and obesity-related complications. Diabetes Obes Metab 23: , 3–16. |
[2] | Aggoun Y ((2007) ) Obesity, metabolic syndrome, and cardiovascular disease. Pediatr Res 61: , 653–659. |
[3] | Deckers K , van Boxtel MPJ , Verhey FRJ , Köhler S ((2017) ) Obesity and cognitive decline in adults: Effect of methodological choices and confounding by age in a longitudinal study. J Nutr Health Aging 21: , 546–553. |
[4] | Morys F , Dadar M , Dagher A ((2021) ) Association between mid-life obesity, its metabolic consequences, cerebrovascular disease and cognitive decline. J Clin Endocrinol Metab 106: , e4260–e4274. |
[5] | Harrington KD , Dang C , Lim YY , Ames D , Laws SM , Pietrzak RH , Rainey-Smith S , Robertson J , Rowe CC , Salvado O , Villemagne VL , Masters CL , Maruff P ((2018) ) The effect of preclinical Alzheimer’s disease on age-related changes in intelligence in cognitively normal older adults. Intelligence 70: , 22–29. |
[6] | Carlesimo GA , Fadda L , Lorusso S , Caltagirone C ((1994) ) Verbal and spatial memory spans in Alzheimer’s and multi-infarct dementia. Acta Neurol Scand 89: , 132–138. |
[7] | Lloret A , Monllor P , Esteve D , Cervera-Ferri A , Lloret MA ((2019) ) Obesity as a risk factor for Alzheimer’s disease: Implication of leptin and glutamate. Front Neurosci 13: , 508. |
[8] | Alford S , Patel D , Perakakis N , Mantzoros CS ((2018) ) Obesity as a risk factor for Alzheimer’s disease: Weighing the evidence. Obes Rev 19: , 269–280. |
[9] | Whitmer R , Gunderson E , Quesenberry C , Zhou J , Yaffe K ((2007) ) Body mass index in midlife and risk of Alzheimer disease and vascular dementia. Curr Alzheimer Res 4: , 103–109. |
[10] | Naderali EK , Ratcliffe SH , Dale MC ((2009) ) Obesity and Alzheimer’s disease: A link between body weight and cognitive function in old age. Am J Alzheimers Dis Other Demen 24: , 445–449. |
[11] | Ma Y , Ajnakina O , Steptoe A , Cadar D ((2020) ) Higher risk of dementia in English older individuals who are overweight or obese. Int J Epidemiol 49: , 1353–1365. |
[12] | Moroz N , Tong M , Longato L , Xu H , De La Monte SM ((2008) ) Limited Alzheimer-type neurodegeneration in experimental obesity and type 2 diabetes mellitus. J Alzheimers Dis 15: , 29–44. |
[13] | Dorrance A , Matin N , Pires P ((2014) ) The effects of obesity on the cerebral vasculature. Curr Vasc Pharmacol 12: , 462–472. |
[14] | Payabvash S , Souza LCS , Wang Y , Schaefer PW , Furie KL , Halpern EF , Gonzalez RG , Lev MH ((2011) ) Regional ischemic vulnerability of the brain to hypoperfusion: The need for location specific computed tomography perfusion thresholds in acute stroke patients. Stroke 42: , 1255–1260. |
[15] | Fjell AM , Walhovd KB , Fennema-Notestine C , McEvoy LK , Hagler DJ , Holland D , Brewer JB , Dale AM ((2009) ) One-year brain atrophy evident in healthy aging. J Neurosci 29: , 15223–15231. |
[16] | Singh V , Chertkow H , Lerch JP , Evans AC , Dorr AE , Kabani NJ ((2006) ) Spatial patterns of cortical thinning in mild cognitive impairment and Alzheimer’s disease. Brain 129: , 2885–2893. |
[17] | Dake MD , De Marco M , Blackburn DJ , Wilkinson ID , Remes A , Liu Y , Pikkarainen M , Hallikainen M , Soininen H , Venneri A ((2021) ) Obesity and brain vulnerability in normal and abnormal aging: A multimodal MRI study. J Alzheimers Dis Rep 5: , 65–77. |
[18] | Dadar M , Zeighami Y , Yau Y , Fereshtehnejad SM , Maranzano J , Postuma RB , Dagher A , Collins DL ((2018) ) White matter hyperintensities are linked to future cognitive decline in de novo Parkinson’s disease patients. Neuroimage Clin 20: , 892–900. |
[19] | Dadar M , Camicioli R , Duchesne S , Collins DL ((2020) ) The temporal relationships between white matter hyperintensities, neurodegeneration, amyloid beta, and cognition, Alzheimers Dement (Amst) 12: , e12091. |
[20] | Vogel JW , Young AL , Oxtoby NP , Smith R , Ossenkoppele R , Strandberg OT , La Joie R , Aksman LM , Grothe MJ , Iturria-Medina Y , et al. ((2021) ) Four distinct trajectories of tau deposition identified in Alzheimer’s disease. Nat Med 27: , 871–881. |
[21] | Jack CR , Knopman DS , Jagust WJ , Petersen RC , Weiner MW , Aisen PS , Shaw LM , Vemuri P , Wiste HJ , Weigand SD , Lesnick TG , Pankratz VS , Donohue MC , Trojanowski JQ ((2013) ) Tracking pathophysiological processes in Alzheimer’s disease: An updated hypothetical model of dynamic biomarkers. Lancet Neurol 12: , 207–216. |
[22] | La Joie R , Visani AV , Baker SL , Brown JA , Bourakova V , Cha J , Chaudhary K , Edwards L , Iaccarino L , Janabi M , Lesman-Segev OH , Miller ZA , Perry DC , O’Neil JP , Pham J , Rojas JC , Rosen HJ , Seeley WW , Tsai RM , Miller BL , Jagust WJ , Rabinovici GD ((2020) ) Prospective longitudinal atrophy in Alzheimer’s disease correlates with the intensity and topography of baseline tau-PET. Sci Transl Med 12: , 5732. |
[23] | Petersen RC , Aisen PS , Beckett LA , Donohue MC , Gamst AC , Harvey DJ , Jack CR , Jagust WJ , Shaw LM , Toga AW , Trojanowski JQ , Weiner MW ((2010) ) Alzheimer’s Disease Neuroimaging Initiative (ADNI): Clinical characterization. Neurology 74: , 201–209. |
[24] | Defining Adult Overweight & Obesity | Overweight & Obesity | CDC . |
[25] | Sudlow C , Gallacher J , Allen N , Beral V , Burton P , Danesh J , Downey P , Elliott P , Green J , Landray M , Liu B , Matthews P , Ong G , Pell J , Silman A , Young A , Sprosen T , Peakman T , Collins R ((2015) ) UK Biobank: An open access resource for identifying the causes of a wide range of complex diseases of middle and old age. PLoS Med 12: , e1001779. |
[26] | Miller KL , Alfaro-Almagro F , Bangerter NK , Thomas DL , Yacoub E , Xu J , Bartsch AJ , Jbabdi S , Sotiropoulos SN , Andersson JLRR , Griffanti L , Douaud G , Okell TW , Weale P , Dragonu I , Garratt S , Hudson S , Collins R , Jenkinson M , Matthews PM , Smith SM ((2016) ) Multimodal population brain imaging in the UK Biobank prospective epidemiological study. Nat Neurosci 19: , 1523–1536. |
[27] | Jagust WJ , Landau SM , Koeppe RA , Reiman EM , Chen K , Mathis CA , Price JC , Foster NL , Wang AY ((2015) ) The ADNI PET Core: 2015. Alzheimers Dement 11: , 757. |
[28] | Landau SM , Breault C , Joshi AD , Pontecorvo M , Mathis CA , Jagust WJ , Mintun MA ((2013) ) Amyloid-β imaging with Pittsburgh compound B and florbetapir: Comparing radiotracers and quantification methods. J Nucl Med 54: , 70–77. |
[29] | Ho DE , Imai K , King G , Stuart EA ((2011) ) MatchIt: Nonparametric preprocessing for parametric causal inference. J Stat Softw 42: , 1–28. |
[30] | Zakrison TL , Austin PC , McCredie VA ((2018) ) A systematic review of propensity score methods in the acute care surgery literature: Avoiding the pitfalls and proposing a set of reporting guidelines. Eur J Trauma Emerg Surg 44: , 385–395. |
[31] | Zhang Z , Kim HJ , Lonjon G , Zhu Y ((2019) ) Balance diagnostics after propensity score matching. Ann Transl Med 7: , 16–16. |
[32] | Jack CR , Barnes J , Bernstein MA , Borowski BJ , Brewer J , Clegg S , Dale AM , Carmichael O , Ching C , DeCarli C , Desikan RS , Fennema-Notestine C , Fjell AM , Fletcher E , Fox NC , Gunter J , Gutman BA , Holland D , Hua X , Insel P , Kantarci K , Killiany RJ , Krueger G , Leung KK , Mackin S , Maillard P , Malone IB , Mattsson N , McEvoy L , Modat M , Mueller S , Nosheny R , Ourselin S , Schuff N , Senjem ML , Simonson A , Thompson PM , Rettmann D , Vemuri P , Walhovd K , Zhao Y , Zuk S , Weiner M ((2015) ) Magnetic resonance imaging in ADNI. Alzheimers Dement 11: , 740. |
[33] | Fischl B ((2012) ) FreeSurfer. Neuroimage 62: , 774–781. |
[34] | Klein A , Tourville J ((2012) ) 101 labeled brain images and a consistent human cortical labeling protocol. Front Neurosci 6: , 171. |
[35] | Alfaro-Almagro F , Jenkinson M , Bangerter NK , Andersson JLR , Griffanti L , Douaud G , Sotiropoulos SN , Jbabdi S , Hernandez-Fernandez M , Vallee E , Vidaurre D , Webster M , McCarthy P , Rorden C , Daducci A , Alexander DC , Zhang H , Dragonu I , Matthews PM , Miller KL , Smith SM ((2018) ) Image processing and quality control for the first 10,000 brain imaging datasets from UK Biobank. Neuroimage 166: , 400–424. |
[36] | Váša F , Seidlitz J , Romero-Garcia R , Whitaker KJ , Rosenthal G , Vértes PE , Shinn M , Alexander-Bloch A , Fonagy P , Dolan RJ , Jones PB , Goodyer IM , Sporns O , Bullmore ET ((2018) ) Adolescent tuning of association cortex in human structural brain networks. Cereb Cortex 28: , 281–294. |
[37] | Alexander-Bloch AF , Shou H , Liu S , Satterthwaite TD , Glahn DC , Shinohara RT , Vandekar SN , Raznahan A ((2018) ) On testing for spatial correspondence between maps of human brain structure and function. Neuroimage 178: , 540–551. |
[38] | Livingston G , Huntley J , Sommerlad A , Ames D , Ballard C , Banerjee S , Brayne C , Burns A , Cohen-Mansfield J , Cooper C , Costafreda SG , Dias A , Fox N , Gitlin LN , Howard R , Kales HC , Kivimäki M , Larson EB , Ogunniyi A , Orgeta V , Ritchie K , Rockwood K , Sampson EL , Samus Q , Schneider LS , Selbæk G , Teri L , Mukadam N ((2020) ) Dementia prevention, intervention, and care: 2020 report of the Lancet Commission. Lancet 396: , 413–446. |
[39] | Shaw ME , Abhayaratna WP , Anstey KJ , Cherbuin N ((2017) ) Increasing body mass index at midlife is associated with increased cortical thinning in Alzheimer’s disease-vulnerable regions. J Alzheimers Dis 59: , 113–120. |
[40] | Shaw ME , Sachdev PS , Abhayaratna W , Anstey KJ , Cherbuin N ((2018) ) Body mass index is associated with cortical thinning with different patterns in mid- and late-life. Int J Obes 42: , 455–461. |
[41] | Gustafson D , Rothenberg E , Blennow K , Steen B , Skoog I ((2003) ) An 18-year follow-up of overweight and risk of Alzheimer disease. Arch Intern Med 163: , 1524–1528. |
[42] | Hayes JP , Moody JN , Roca JG , Hayes SM ((2020) ) Body mass index is associated with smaller medial temporal lobe volume in those at risk for Alzheimer’s disease. Neuroimage Clin 25: , 102156. |
[43] | Chuang YF , An Y , Bilgel M , Wong DF , Troncoso JC , O’Brien RJ , Breitner JC , Ferruci L , Resnick SM , Thambisetty M ((2015) ) Midlife adiposity predicts earlier onset of Alzheimer’s dementia, neuropathology and presymptomatic cerebral amyloid accumulation. Mol Psychiatry 21: , 910–915. |
[44] | Pedditizi E , Peters R , Beckett N ((2016) ) The risk of overweight/obesity in mid-life and late life for the development of dementia: A systematic review and meta-analysis of longitudinal studies. Age Ageing 45: , 14–21. |
[45] | Fennema-Notestine C , Hagler DJ , McEvoy LK , Fleisher AS , Wu EH , Karow DS , Dale AM ((2009) ) Structural MRI biomarkers for preclinical and mild Alzheimer’s disease. Hum Brain Mapp 30: , 3238–3253. |
[46] | Du AT , Schuff N , Chao LL , Kornak J , Jagust WJ , Kramer JH , Reed BR , Miller BL , Norman D , Chui HC , Weiner MW ((2006) ) Age effects on atrophy rates of entorhinal cortex and hippocampus. Neurobiol Aging 27: , 733–740. |
[47] | Vainik U , Baker TE , Dadar M , Zeighami Y , Michaud A , Zhang Y , García Alanis JC , Misic B , Collins DL , Dagher A , Alanis JCG , Misic B , Collins DL , Dagher A , García Alanis JC , Misic B , Louis Collins D , Dagher A ((2018) ) Neurobehavioral correlates of obesity are largely heritable. Proc Natl Acad Sci U S A 115: , 9312–9317. |
[48] | Morys F , Janssen LK , Cesnaite E , Beyer F , Garcia-Garcia I , Kube J , Kumral D , Liem F , Mehl N , Mahjoory K , Schrimpf A , Gaebler M , Margulies D , Villringer A , Neumann J , Nikulin VV , Horstmann A ((2020) ) Hemispheric asymmetries in resting-state EEG and fMRI are related to approach and avoidance behaviour, but not to eating behaviour or BMI. Hum Brain Mapp 41: , 1136–1152. |
[49] | Walker JM , Dixit S , Saulsberry AC , May JM , Harrison FE ((2017) ) Reversal of high fat diet-induced obesity improves glucose tolerance, inflammatory response, β-amyloid accumulation and cognitive decline in the APP/PSEN1 mouse model of Alzheimer’s disease. Neurobiol Dis 100: , 87–98. |
[50] | Deane R , Yan S Du , Submamaryan RK , LaRue B , Jovanovic S , Hogg E , Welch D , Manness L , Lin C , Yu J , Zhu H , Ghiso J , Frangione B , Stern A , Schmidt AM , Armstrong DL , Arnold B , Liliensiek B , Nawroth P , Hofman F , Kindy M , Stern D , Zlokovic B ((2003) ) RAGE mediates amyloid-β peptide transport across the blood-brain barrier and accumulation in brain. Nat Med 9: , 907–913. |
[51] | Bharadwaj P , Wijesekara N , Liyanapathirana M , Newsholme P , Ittner L , Fraser P , Verdile G ((2017) ) The link between type 2 diabetes and neurodegeneration: Roles for amyloid-β, amylin, and tau proteins. J Alzheimers Dis 59: , 421–432. |
[52] | Hu N , Gao L , Jiang Y , Wei S , Shang S , Chen C , Dang L , Wang J , Huo K , Deng M , Wang J , Qu Q ((2020) ) The relationship between blood lipids and plasma amyloid beta is depend on blood pressure: A population-based cross-sectional study. Lipids Health Dis 19: , 8. |
[53] | Carnevale D , Mascio G , D’Andrea I , Fardella V , Bell RD , Branchi I , Pallante F , Zlokovic B , Yan SS , Lembo G ((2012) ) Hypertension induces brain β-amyloid accumulation, cognitive impairment, and memory deterioration through activation of receptor for advanced glycation end products in brain vasculature. Hypertension 60: , 188–197. |
[54] | Raji CA , Ho AJ , Parikshak NN , Becker JT , Lopez OL , Kuller LH , Hua X , Leow AD , Toga AW , Thompson PM ((2010) ) Brain structure and obesity. Hum Brain Mapp 31: , 353–364. |
[55] | Mrak RE ((2009) ) Alzheimer-type neuropathological changes in morbidly obese elderly individuals. Clin Neuropathol 28: , 40–45. |
[56] | Kellar D , Craft S ((2020) ) Brain insulin resistance in Alzheimer’s disease and related disorders: Mechanisms and therapeutic approaches. Lancet Neurol 19: , 758–766. |
[57] | O’Brien PD , Hinder LM , Callaghan BC , Feldman EL ((2017) ) Neurological consequences of obesity. Lancet Neurol 16: , 465–477. |
[58] | García-García I , Michaud A , Jurado MÁ , Dagher A , Morys F ((2022) ) Mechanisms linking obesity and its metabolic comorbidities with cerebral grey and white matter changes. Rev Endocr Metab Disord 23: , 833–843. |
[59] | Tabassum S , Misrani A , Yang L ((2020) ) Exploiting common aspects of obesity and Alzheimer’s disease. Front Hum Neurosci 14: , 602360. |
[60] | Gratuze M , Joly-Amado A , Vieau D , Buée L , Blum D ((2018) ) Mutual relationship between tau and central insulin signalling: Consequences for AD and tauopathies? Neuroendocrinology 107: , 181–195. |
[61] | Platt TL , Beckett TL , Kohler K , Niedowicz DM , Murphy MP ((2016) ) Obesity, diabetes, and leptin resistance promote tau pathology in a mouse model of disease. Neuroscience 315: , 162. |
[62] | Das SR , Lyu X , Duong MT , Xie L , McCollum L , de Flores R , DiCalogero M , Irwin DJ , Dickerson BC , Nasrallah IM , et al. ((2021) ) Tau-atrophy variability reveals phenotypic heterogeneity in Alzheimer’s disease. Ann Neurol 90: , 751–762. |
[63] | Lee EC , Kang JM , Seo S , Seo HE , Lee SY , Park KH , Na DL , Noh Y , Seong JK ((2020) ) Association of subcortical structural shapes with tau, amyloid, and cortical atrophy in early-onset and late-onset Alzheimer’s disease. Front Aging Neurosci 12: , 366. |
[64] | Vaishnavi SN , Vlassenko AG , Rundle MM , Snyder AZ , Mintun MA , Raichle ME ((2010) ) Regional aerobic glycolysis in the human brain. Proc Natl Acad Sci U S A 107: , 17757–17762. |
[65] | Moser VA , Pike CJ ((2017) ) Obesity accelerates Alzheimer-related pathology in APOE4 but not APOE3 mice, eNeuro 4: , ENEURO.0077-17.2017. |
[66] | Barnes LL , Bennett DA ((2015) ) Cognitive resilience in APOE*ɛ4 carriers— is race important? Nat Rev Neurol 11: , 190. |
[67] | Kaup AR , Nettiksimmons J , Harris TB , Sink KM , Satterfield S , Metti AL , Ayonayon HN , Yaffe K ((2015) ) Cognitive resilience to apolipoprotein E ɛ4: Contributing factors in black and white older adults. JAMA Neurol 72: , 340–348. |
[68] | Klatsky AL , Armstrong MA , Friedman GD ((1991) ) Racial differences in cerebrovascular disease hospitalizations. Stroke 22: , 299–304. |
[69] | Dadar M , Maranzano J , Ducharme S , Collins DL ((2019) ) White matter in different regions evolves differently during progression to dementia. Neurobiol Aging 76: , 71–79. |
[70] | Hu N , Yu JT , Tan L , Wang YL , Sun L , Tan L ((2013) ) Nutrition and the risk of Alzheimer’s disease. Biomed Res Int 2013: , 524820. |


