
Mitochondrial Alterations in Neurons Derived from the Murine AppNL-F Knock-In Model of Alzheimer’s Disease
Abstract
Background:
Alzheimer’s disease (AD) research has relied on mouse models overexpressing human mutant A βPP; however, newer generation knock-in models allow for physiological expression of amyloid-β protein precursor (AβPP) containing familial AD mutations where murine AβPP is edited with a humanized amyloid-β (Aβ) sequence. The AppNL-F mouse model has shown substantial similarities to AD brains developing late onset cognitive impairment.
Objective:
In this study, we aimed to characterize mature primary cortical neurons derived from homozygous AppNL-F embryos, especially to identify early mitochondrial alterations in this model.
Methods:
Primary cultures of AppNL-F neurons kept in culture for 12–15 days were used to measure Aβ levels, secretase activity, mitochondrial functions, mitochondrial-ER contacts, synaptic function, and cell death.
Results:
We detected higher levels of Aβ42 released from AppNL-F neurons as compared to wild-type neurons. AppNL-F neurons, also displayed an increased Aβ42/Aβ40 ratio, similar to adult AppNL-F mouse brain. Interestingly, we found an upregulation in mitochondrial oxygen consumption with concomitant downregulation in glycolytic reserve. Furthermore, AppNL-F neurons were more susceptible to cell death triggered by mitochondrial electron transport chain inhibition. Juxtaposition between ER and mitochondria was found to be substantially upregulated, which may account for upregulated mitochondrial-derived ATP production. However, anterograde mitochondrial movement was severely impaired in this model along with loss in synaptic vesicle protein and impairment in pre- and post-synaptic function.
Conclusion:
We show that widespread mitochondrial alterations can be detected in AppNL-F neurons in vitro, where amyloid plaque deposition does not occur, suggesting soluble and oligomeric Aβ-species being responsible for these alterations.
INTRODUCTION
The formation and deposition of insoluble plaques in brain parenchyma, also known as senile plaques, is one of the hallmarks in AD brains. These plaques consist of amyloid-β (Aβ), a product of amyloid-β protein precursor (AβPP) sequential cleaved by β- and γ-secretases [1]. While the amyloid hypothesis of AD has been challenged [2], overwhelming evidence supports the idea that overproduction of Aβ is a crucial player in AD pathogenesis [3]. AD research has relied on mouse models overexpressing human mutations in the A βPP gene, developing neuropathology that shows similar histopathological hallmarks as found in the human brain, such as amyloid plaque formation and cognitive impairment [4]. A βPP overexpression artifacts are quite common in these first-generation AD models, including increased activation of calpains [5] and endoplasmic reticulum (ER) stress [6], which might lead to assessment of unspecific and unphysiological downstream effects. New generation mouse models use a knock-in approach to tackle these limitations. In the AppNL-F mouse model the endogenous mouse A βPP promoter is used, while a humanized Aβ sequence and the Swedish (NL) together with the Beyreuther/Iberian (F) mutations are introduced into the A βPP gene. This model allows for physiological expression of AβPP while increasing the Aβ42/Aβ40 ratio in the brain [7]. In vivo these mice show several similarities to human AD brains, including progressive amyloid plaque deposition in hippocampus and cortex as well as synaptic loss, particularly evident around nearby plaques [7].
Although many studies have described the importance of the endosome-, lysosome, and -autophagosome systems [8–11], for handling AβPP and its metabolites, other aspects such as impaired metabolism and mitochondrial dysfunction are often overlooked [12]. In the present study, we decided to use primary neurons derived from AppNL-F mouse embryos and focus on the early impact of Aβ on mitochondrial function and mitochondria-ER contacts (MERCS). Cerebral hypometabolism has been reported in patients with mild cognitive impairment (MCI) and AD [13, 14]. Early energy dysfunction has been observed in transgenic AD mouse models, showing decreased membrane potential as well as decreased ATP levels at 3 months of age, when plaques are not yet present [15, 16]. Furthermore, Aβ has been shown to specifically reduce complex IV expression and activity [15, 17, 18].
To maintain optimal effectiveness and physiological role in the cell, mitochondria need to be in contact with other organelles, specifically the ER at specialized contact sites called MERCS [19]. Functionally, MERCS have a significant role in Ca2+-shuttling from ER to mitochondria generating Ca2+-hotspots [20]. Ca2+-import into mitochondria has a crucial bioenergetic function by activating tricarboxylic acid cycle (TCA cycle) dehydrogenases and bosting ATP production [21, 22]. Furthermore, active shuttling of phospholipids between ER and mitochondria takes place at MERCS [23, 24], which also play vital roles in a variety of other cellular processes including apoptosis [25], mitochondrial fission [26], autophagy [27], and inflammasome formation [28]. Interestingly, all these enumerated functions are altered in AD. We and others have shown increased structural connectivity and Ca2+-shuttling between ER and mitochondria in AD models [29–32]. Furthermore, MERCS were identified as important areas of Aβ-production and AβPP processing [30, 31, 33].
In this study we have characterized the AppNL-F model in vitro. Notably, we show that AppNL-F neurons have increased Aβ42/Aβ40 ratio and an increase in secreted Aβ42. We also show for the first time in an AD model a substantial upregulation of mitochondrial function coupled with decreased glycolysis. AppNL-F neurons show structural and functional upregulation of MERCS, accompanied by significant downregulation of synaptic function and changes in mitochondrial mobility. Taken together, our studies identified early mitochondrial compensatory mechanisms along with upregulation of MERCS and synaptic dysfunction in AppNL-F neurons.
MATERIALS AND METHODS
Cell culture and transfection
Primary cortical neurons were derived from mouse embryos at embryonic day 16–17, wild-type (WT) embryos were generated from inbred C57B6/J parent and AppNL-F embryos from homozygous C57B6/J AppNL-F parents (Ethical approval from Etikprövningsmyndigheten Sweden: Dnr 12779-2019, ID407, Dnr 12547-2021). Cortices were dissected in ice-cold Hank’s balanced salt solution (HBSS, ThermoFisher, #14025092) and kept in Hibernate E medium (ThermoFisher, # A1247601) until dissection was started. Cortices were then dissociated in HBSS and suspended cells were then filtered with 40μm cell strainer (Corning, #352340) and plated into 0.1 mg/ml poly-D-lysine (Sigma Aldrich, #P7280) coated plates. Neurons were kept in neurobasal medium supplemented with B27 (Gibco, #17504044) and 2 mM L-glutamine (Sigma, #G7513). Half of the culture medium was replaced every sixth day with freshly supplemented Neurobasal medium. Neuronal transfections were performed at day 7 with lipofectamine 2000 reagent (ThermoFisher, #11668019) following manufacture recommendations. Briefly, 0.25 mg MitoDsRed or SPLICS plasmids were mixed with 0.5 ml lipofectamine diluted in Opti-MEM media and added dropwise to neurons plated in 10 mm glass diameter MatTek dishes. Transfection was performed for 1 h 30 min. pLV-mitoDsRed was a gift from Pantelis Tsoulfas (Addgene, #44386; http://n2t.net/addgene:44386; RRID:Addgene_44386); SPLICS was a gift from Dr Tito Calì (University of Padova, Italy). Neurons were maintained at 37 °C in a humidified incubator with 5% CO2/95% air for 12–15 days.
β-secretase assay activity
β-Secretase Activity Assay Kit (Sigma-Aldrich, # 565785) was used according to the manufacturer's instructions. Active β-Secretase and β-Secretase inhibitors were used as positive and negative control, according to the manufacturer's instructions. Fluorescence emission was measured using a plate reader at 495 nm (FLUOstar galaxy).
γ-secretase assay activity
γ-Secretase activity was measured indirectly through inhibition of its activity by treating neurons with 10μM γ-secretase inhibitor L-685,458 for 24 h or DMSO. Cell media was collected and Aβ40 or Aβ42 levels were detected using ELISA kits, described below in 2.4. Levels of extracellular Aβ40 or Aβ42 (pmol/L) treated with L-685,458 in either WT and AppNL-F cultures were divided by levels of extracellular Aβ40 or Aβ42 with their respective DMSO treated condition in WT and AppNL-F cultures to give us a ratio between γ-secretase inhibited and control conditions. This ratio was then compared between WT and AppNL-F cultures.
Aβ ELISA
Quantification of extracellular Aβ40 and Aβ42 was performed using ELISA kits from Amyloid-β 1–40 (IBL, #16340) and Amyloid-β 1–42 (IBL, #16233) Assay Kit according to the manufacturer’s instructions. Optical density emission was measured using a plate reader at 450 nm (FLUOstar galaxy).
Oxygen consumption rate (OCR) and extracellular acidification rate (ECAR)
Neurons were plated on custom Seahorse XF96 plates at 26,000 cells per well and both experiments run using the XF96 Seahorse flux analyzer (Agilent). OCR was performed in unbuffered DMEM media (Sigma Aldrich, #D5030) supplemented with 10 mM glucose, 0.23 mM pyruvate and 2 mM L-glutamine (pH 7.4), while for ECAR, DMEM media was supplemented with 2 mM L-glutamine (pH 7.4). Three baseline measurements were performed before the sequential injection of oligomycin A (1μM; Sigma Aldrich, #75351), FCCP (1μM; Sigma Aldrich, #C2920), and antimycin A (0.5μM; Sigma Aldrich, #A8674) plus rotenone (0.5μM; Sigma Aldrich, #R8875) for OCR experiments; or glucose (10 mM), oligomycin A (1μM), and 2-deoxy-D-glucose (50 mM) for ECAR experiments. Accordingly, mitochondrial basal respiration, maximal respiration, ATP production and spare respiratory capacity (SRC) were automatically calculated using the Seahorse XF Cell Mito Stress test report generator and the glycolysis, glycolytic capacity and glycolytic reserve were obtained using the Seahorse XF Glycolytic Stress Test summary report from Wave 2.6.1 software (Agilent). For OCR, results are expressed in pmol of O2 per minute per μg protein. For ECAR, results are expressed in mpH/min/μg protein.
Tetramethylrhodamine methyl ester (TMRM) imaging
Neurons were incubated with 150 nM of TMRM dye (quenching conditions) in Na+ medium (140 mM NaCl, 5 mM KCl, 1 mM CaCl2, 1 mM MgCl2, 10 mM Glucose, 10 mM HEPES, pH 7.4) for 30 min at 37°C. Retention of TMRM by mitochondria was studied to estimate changes in mitochondrial membrane potential (Δψm). Basal fluorescence was recorded using a microplate reader equipped with 503 nm excitation and 525 nm emission filter (Fluostar Galaxy, LabVision) for 5 min, followed by the addition of 2.5μM FCCP plus 3.2μM oligomycin A to produce maximal mitochondrial depolarization and mitochondrial probe release. TMRM release was calculated based on the change in fluorescence before and after addition of oligomycin/FCCP. Data was normalized to protein content.
Mitochondrial-derived hydrogen peroxide (H2O2) production
Neurons were incubated with Mitochondria peroxy yellow 1 (MitoPY1) probe (10μM; Tocris Bioscience, Cat. no. 4428) in Na+ medium for 30 min at 37°C. After incubation, MitoPY1 was washed out and neurons were imaged in the same experimental medium every 30 s for 20 min using a LCI PlanNeofluar/1.3NA 20x lens on a Carl Zeiss Axio Observed Z1 inverted confocal microscope with Zen Blue software (Zeiss, Jena, Germany). Fluorescence was recorded at 503 nm excitation and emission at 528 nm. After 10 min of basal recording, Ant A (2μM) was added in the medium and fluorescence recorded for more 10 min. Fluorescence intensity at each time point was analyzed in Fiji using the time series analyzer plugin (v 3.0).
LipidTOX lipid staining
Cells were grown in 10 mm glass-round coverslips fitted petri dishes (Mattek, #P35G-1.5-10-C). WT and AppNL-F neurons were fixed in paraformaldehyde (PFA) 4% solution for 10 min at room temperature. Fixed cells were gently rinsed with PBS (#14190094, Thermofisher) 3 times and stained with 1X HCS LipidTOX™ Red Neutral Lipid Stain (#H34476, Thermofisher) prepared in PBS for 30 min at room temperature. Coverslips were imaged with a Carl Zeiss LSM880 inverted confocal microscope equipped with a Plan-Apo 63X oil immersion lens using Zen Blue software (Zeiss). Single cells per fields were acquired, images were thresholder and grey intensity measured using ImageJ program.
Lactate dehydrogenase (LDH) assay
Cytotox96® assay kit (#G1780, Promega) was used according to the manufacturer’s instructions. LDH absorbance signal was measured at 492 nm with an optical plate reader (FLUOstar galaxy). Cells were incubated with 10μL of Lysis buffer for 30 min prior to elicit maximum LDH release analysis. LDH absorbance was normalized to protein concentration and data presented as a percentage of WT.
Transmission electron microscopy
2.5% (vol/vol) glutaraldehyde in 0.1 M phosphate buffer was used to fix 12-15 DIV neurons at room temperature. Leica Ultracut UCT (Leica) was used for generating ultrathin sections and uranyl acetate and lead citrate were used as contrasting agents. Sections were analyzed with a Tecnai 12 BioTWIN transmission electron microscope (FEI Company) at 100 kV. Digital images were obtained with a Veleta camera (Olympus Soft imaging Solutions, GmbH, Münster, Germany) at 26,500 x magnification. All mitochondria from 5 different cells were imaged per sample. Number of MERCS and mitochondrial profiles, average length of MERCS and mitochondrial perimeter were analyzed using the freehand line tool in ImageJ (NIH, USA). Number of MERCS per mitochondria were obtained by dividing number of MERCS per number of mitochondrial profiles. Percent of mitochondria perimeter in contact with ER was analyzed by multiplying MERCS length per 100 times, divided by mitochondrial perimeter. 30 nm distance between ER and mitochondrial membrane was set as our upper limit to consider distance between the two membranes as MERCS.
Split-GFP-based contact site sensor (SPLICS) analysis
Neurons transfected with SPLICS were fixed with 4% PFA 72 h after transfection. Fixed cells were gently rinsed with PBS 3 times and permeabilized for 2 min with 0.2% Triton in PBS. Neurons were labelled overnight at 4°C with anti-MAP2 primary antibody (1 : 1000; Abcam, #ab5392) diluted in 3% BSA in PBS. After washing, neurons were incubated with Alexa Fluor 594 anti-chicken secondary antibody (1 : 500; Invitrogen, #A32759) for 1 h, at room temperature. Coverslips were mounted using the Antifade mounting media (VectaShield Plus, # H-1900). Z-stack images were acquired using a Plan-Apochromat/1.4NA 63x lens on a Zeiss LSM880 confocal microscope (Zeiss Microscopy, Germany). Z-stack images were processed, and a 3D reconstruction was performed in Fiji software. A selected face of the 3D was thresholded to create a binary image that was further used to analyze SPLICS number. Data was normalized for the area of the neuronal projection.
Mitochondrial Ca2+-measurements
Mitochondrial Ca2+ imaging was performed as previously described with small modifications [34]. Briefly, neurons were loaded with 2μM Rhod2-AM probe (Thermofisher, #R1244) in an imaging solution (145 mM NaCl, 2 mM KCl, 5 mM NaHCO3, 1 mM MgCl2, 2.5 mM CaCl2, 10 mM glucose, 10 mM HEPES, pH 7.25) containing 0.02% Pluronic F-127 (Thermofisher, #P3000MP) for 15 min at 37°C. The de-esterification of the Rhod2-AM was performed by gently removing the Rhod2 solution and replacing it by fresh imaging solution, following by an incubation for 15 min at 37°C protected from light. Rhod2 fluorescence (excitation 559 nm, emission 575–675 nm) was time-lapse recorded at 1-s interval at 37°C using a 40x objective with NA = 1.4 in the LSM710 confocal microscope (Zeiss) at 37°C. After 60-s reading, IP3 receptor-mediated Ca2+-release from ER stores was triggered by application of 0.1 mM ATP plus 0.1μM bradykinin. Mitochondrial Ca2+-levels were then calculated as relative Rhod2 fluorescence compared to baseline fluorescence at the start of the measurement.
Patch-clamp recording
For patch-clamp recordings, cell cultures in their original 35 mm plastic culture dishes were placed on a heated platform at 32°C, under the microscope, at least 10 min prior to the experiments. The culture media was replaced by an extracellular solution, perfused at a rate of 2–3 ml per min and containing (in mM) 110 NaCl, 1 NaH2PO4, 4 KCL, 25 4-(2-hydroxyethyl) piperzine-1-ethanesulfonic acid (HEPES), 100 glucose, 1.2 MgCl2, and 1.5 CaCl2 (pH 7.4). Cells were patched with borosilicate glass pipettes with a tip resistance of 3–7 MOhm that were filled with a solution containing (in mM): 110 K-gluconate, 10 KCl, 4 Mg-ATP, 10 Na2-phosphocreatine, 0.3 Na-GTP, 10 HEPES, and 0.2 ethylene glycol tetra acetic acid (EGTA) (pH 7.2–7.4; 270–290 mOsm). Access resistance was monitored throughout the recordings and data was included only for stable values (<30% variation). Data acquisition was done using an Ag/AgCl electrode using Multiclamp 700B amplifier and Clampex 10.0 (Molecular Devices) digitized with Digidata 1440A (Molecular Devices). Traces were analyzed in the Minianalysis software. Spontaneous activity of neurons was recorded and miniature EPSCs were recorded in the presence of 0.5μM of tetrodotoxin (TTX) in the extracellular solution to block action potentials.
SDS-PAGE and immunoblotting
Cell lysates were processed by homogenization in equal volume and RIPA buffer and benzonase solution (50 mM Tris, 4 mM MgSO4 and 1x benzonase) with 1×proteinase (GBiosciences, St. Louis, MO, USA #786433), 1×phosphatases (Sigma-Aldrich, #P0044) inhibitors. Samples were centrifuges at 10,000 rpm for 10 min and supernatant protein concentration was calculated using the Pierce™ BCA Protein Assay (Thermofisher). A total 10–25μg protein was electrophoretically separated on Novex 4–12% Bis-Tris gels (ThermoFisher) and transferred to a nitrocellulose membrane. 5% powder milk in TBST was used to block unspecific binding to membranes, then probed overnight at 4°C with primary antibody in blocking solution. Primary antibodies used include: ADAM10, AβPP Y188 (Abcam #ab32136 1 : 100), BACE1 (D10E5), Total OXPHOS rodent (Abcam, #110413 1 : 1000), MCU (SigmaAldrich, #HPA016480 1 : 1000), Mfn2 (Abcam, #Ab56889 1 : 1000), Miro (SigmaAldrich, #HPA010687 1 : 750), IP3Rs (Abcam #ab5804 1 : 500), Kif5β (Abcam, #ab167429 1 : 1000), PS1 (Chemicon, #AB5308), PS2 (Oncogene, #PC305T-UG), SNAP25 (Biolegend, #850301 1 : 1000), Synapsin-1 (Cell Signaling Technology, #5297T 1 : 1000), Synaptophysin (Abcam, #Ab14692 1 : 1000), TIM23 (BD Biosciences, #611223 1 : 1000), TOM20 (Santa Cruz Biotechnology, #sc-11415), TOM40 (Acris, AP00350), TOM70 (Santa Cruz Biotechnology, #sc-366282), Trak1 (SigmaAldrich, #HPA005853 1 : 500), β-tubulin (Santa Cruz, #sc-80016), VAPB (gift from Prof. Chris Miller 1 : 1000), VDAC1 (Abcam, #Ab14734 1 : 1000). Blots were washed and incubated with fluorophore-coupled secondary antibodies for 1 hour at room temperature. Proteins were visualized using Odyssey® Infrared Imaging system (Li-Cor Biosciences) and Image Studio Lite 5.2 (Li-Cor Biosciences) was used to analyze band intensity.
Mitochondrial movement
MitoDsRed-transfected neurons were washed and imaged at 37°C in Na+ medium using a 63x objective with NA = 1.4 in the LSM710 confocal microscope (Zeiss). Acquisitions were done with a pinhole aperture of 150μm and images taken every 5 s for a total of 120 frames. All images were corrected to fluorescence variations using Bleach Correction plugin (Fiji), and time lapse-dependent x-y drift applying TurboReg plugin (Fiji). Mitochondrial movement analysis was done using the Kymograph Macro in Fiji (Rietdorf and Seitz, 2004). Segmented line was used to follow mitochondria trajectory across projections. Kymographs generated in a x-y dimension (distance vs time) were used to obtain the slope to calculate mitochondrial velocity in μm/s.
TUNEL assay
Click-iT™ Plus TUNEL Assay for In Situ Apoptosis Detection, Alexa Fluor™ 488 dye (#C10617, ThermoFisher) was used to detect fragmented DNA according to the manufacturer's instruction. Cells were fixed for 10 min with 4% PFA and washes in PBS-T. TUNEL Assay was performed, and cells stained for Hoechst nuclear staining (ThermoFisher 1 : 5000). Cells were imaged in Carl Zeiss LSM880 inverted confocal microscope equipped with a x20 lens using Zen Blue software (Zeiss). Images were analyzed by splitting Tunnel and Hoechst signal, masks were created, and particle tracker ImageJ plugin used for both sets of images. Final data are shown as ratio between Tunnel signal and Hoechst signal.
Statistical analysis
Data was analyzed using GraphPad Prism 8.00 (GraphPad Software). Samples were compared by a non-parametric independent test (Mann–Whitney U-test). When existent outliers were evaluated using the ROUT (Q = 1%) method and eliminated. All values were expressed as mean±standard error of the mean (SEM), n = corresponds to number of independent experiments or number of individual measurements, Values were considered statistically significant when p≤0.05 and shown in graphs as *p≤0.05, **p≤0.01, ***p≤0.001
RESULTS
AppNL-F knock-in mice show increased levels of sAβPPβ and Aβ42, as well as Aβ42/Aβ40 ratio without alterations in β- and γ-secretase activity
Firstly, we determined to which extent AppNL-F primary cortical cultures could recapitulate the molecular changes observed in vivo in AppNL-F adult brains [7].
We assessed protein levels of AβPP and relevant proteases involved in A βPP metabolism. A βPP is a transmembrane protein that is differentially metabolized via two opposing pathways¾the amyloidogenic pathway and the non-amyloidogenic pathway. The amyloidogenic pathway involves cleavage of A βPP by β-secretase, with its catalytic enzyme BACE1, generating soluble A βPP fragments sAβPPβ, and γ-secretases a complex consisting of nicastrin, APH-1, presenilin 1 and 2 (PS1 and PS2), and presenilin enhancer-2. These enzymes cleave on either side of the Aβ sequence of A βPP to yield the Aβ peptide. In the non-amylogenic pathway, A βPP is cleaved in the Aβ sequence by α-secretase, ADAM-10 mediates the proteolysis of A βPP generating sAβPPα, followed by γ-secretase cleavage to generate non-toxic AβPP fragment p3 [35]. Immunoblots of cellular extracts revealed that levels of mature AβPP were decreased in AppNL-F cultures (p = 0.0002, Mann-Whitney test) (Fig. 1A, B). Furthermore, a similar increase in sAβPPβ (p = 0.0007, Mann-Whitney test) and decreased sAβPPα (p = 0.0002, Mann-Whitney test) was observed (Fig. 1A, B), in accordance with previous reports in vivo [7]. Interestingly, no differences were unveiled in the levels of enzymes involved in AβPP proteolytic processing revealed such as ADAM-10, BACE-1 or components of the γ-secretase complex, such as N-terminal fragment (NTF) PS1 and PS2 in our model (Fig. 1A, B).
Fig. 1
Amyloid processing characterization in AppNL-F neurons. A) Representative immunoblots of primary cortical neurons homogenate from WT and AppNL-F neurons. Blots were probed with antibodies against A βPP and sAβPPα/β (Y188), ADAM-10, BACE-1, PS1 NTF, PS2 NTF, and tubulin was used as a loading control. B) Bar graph shows amounts of protein analyzed once standardized to tubulin content in each sample (n = 3–8 independent cultures). C) Bar graph shows quantification of extracellular Aβ40 and Aβ42 concentration (pmol/L) in WT and AppNL-F neurons (n = 4–5 independent cultures). D) Quantification of Aβ42 to Aβ40 ratio extracellular concentration in WT and AppNL-F neurons (n = 4–5 independent cultures). E) Quantification of fluorescent intensity recording of BACE-1 activity; β-secretase substrate and inhibitor were used as positive and negative controls respectively. Values were standardized to protein concentration (n = 3–4). F) Bar graph shows quantification of γ-secretase activity by assessing Aβ (pmol/L) in the media derived from WT or AppNL-F cells with or without γ-secretase inhibitor L685,458. Ratio between L685,458 and DMSO treated cells was used to assess γ-secretase activity (n = 3–4). Data shown as mean±SEM. *p≤0.05, ***p≤0.001.
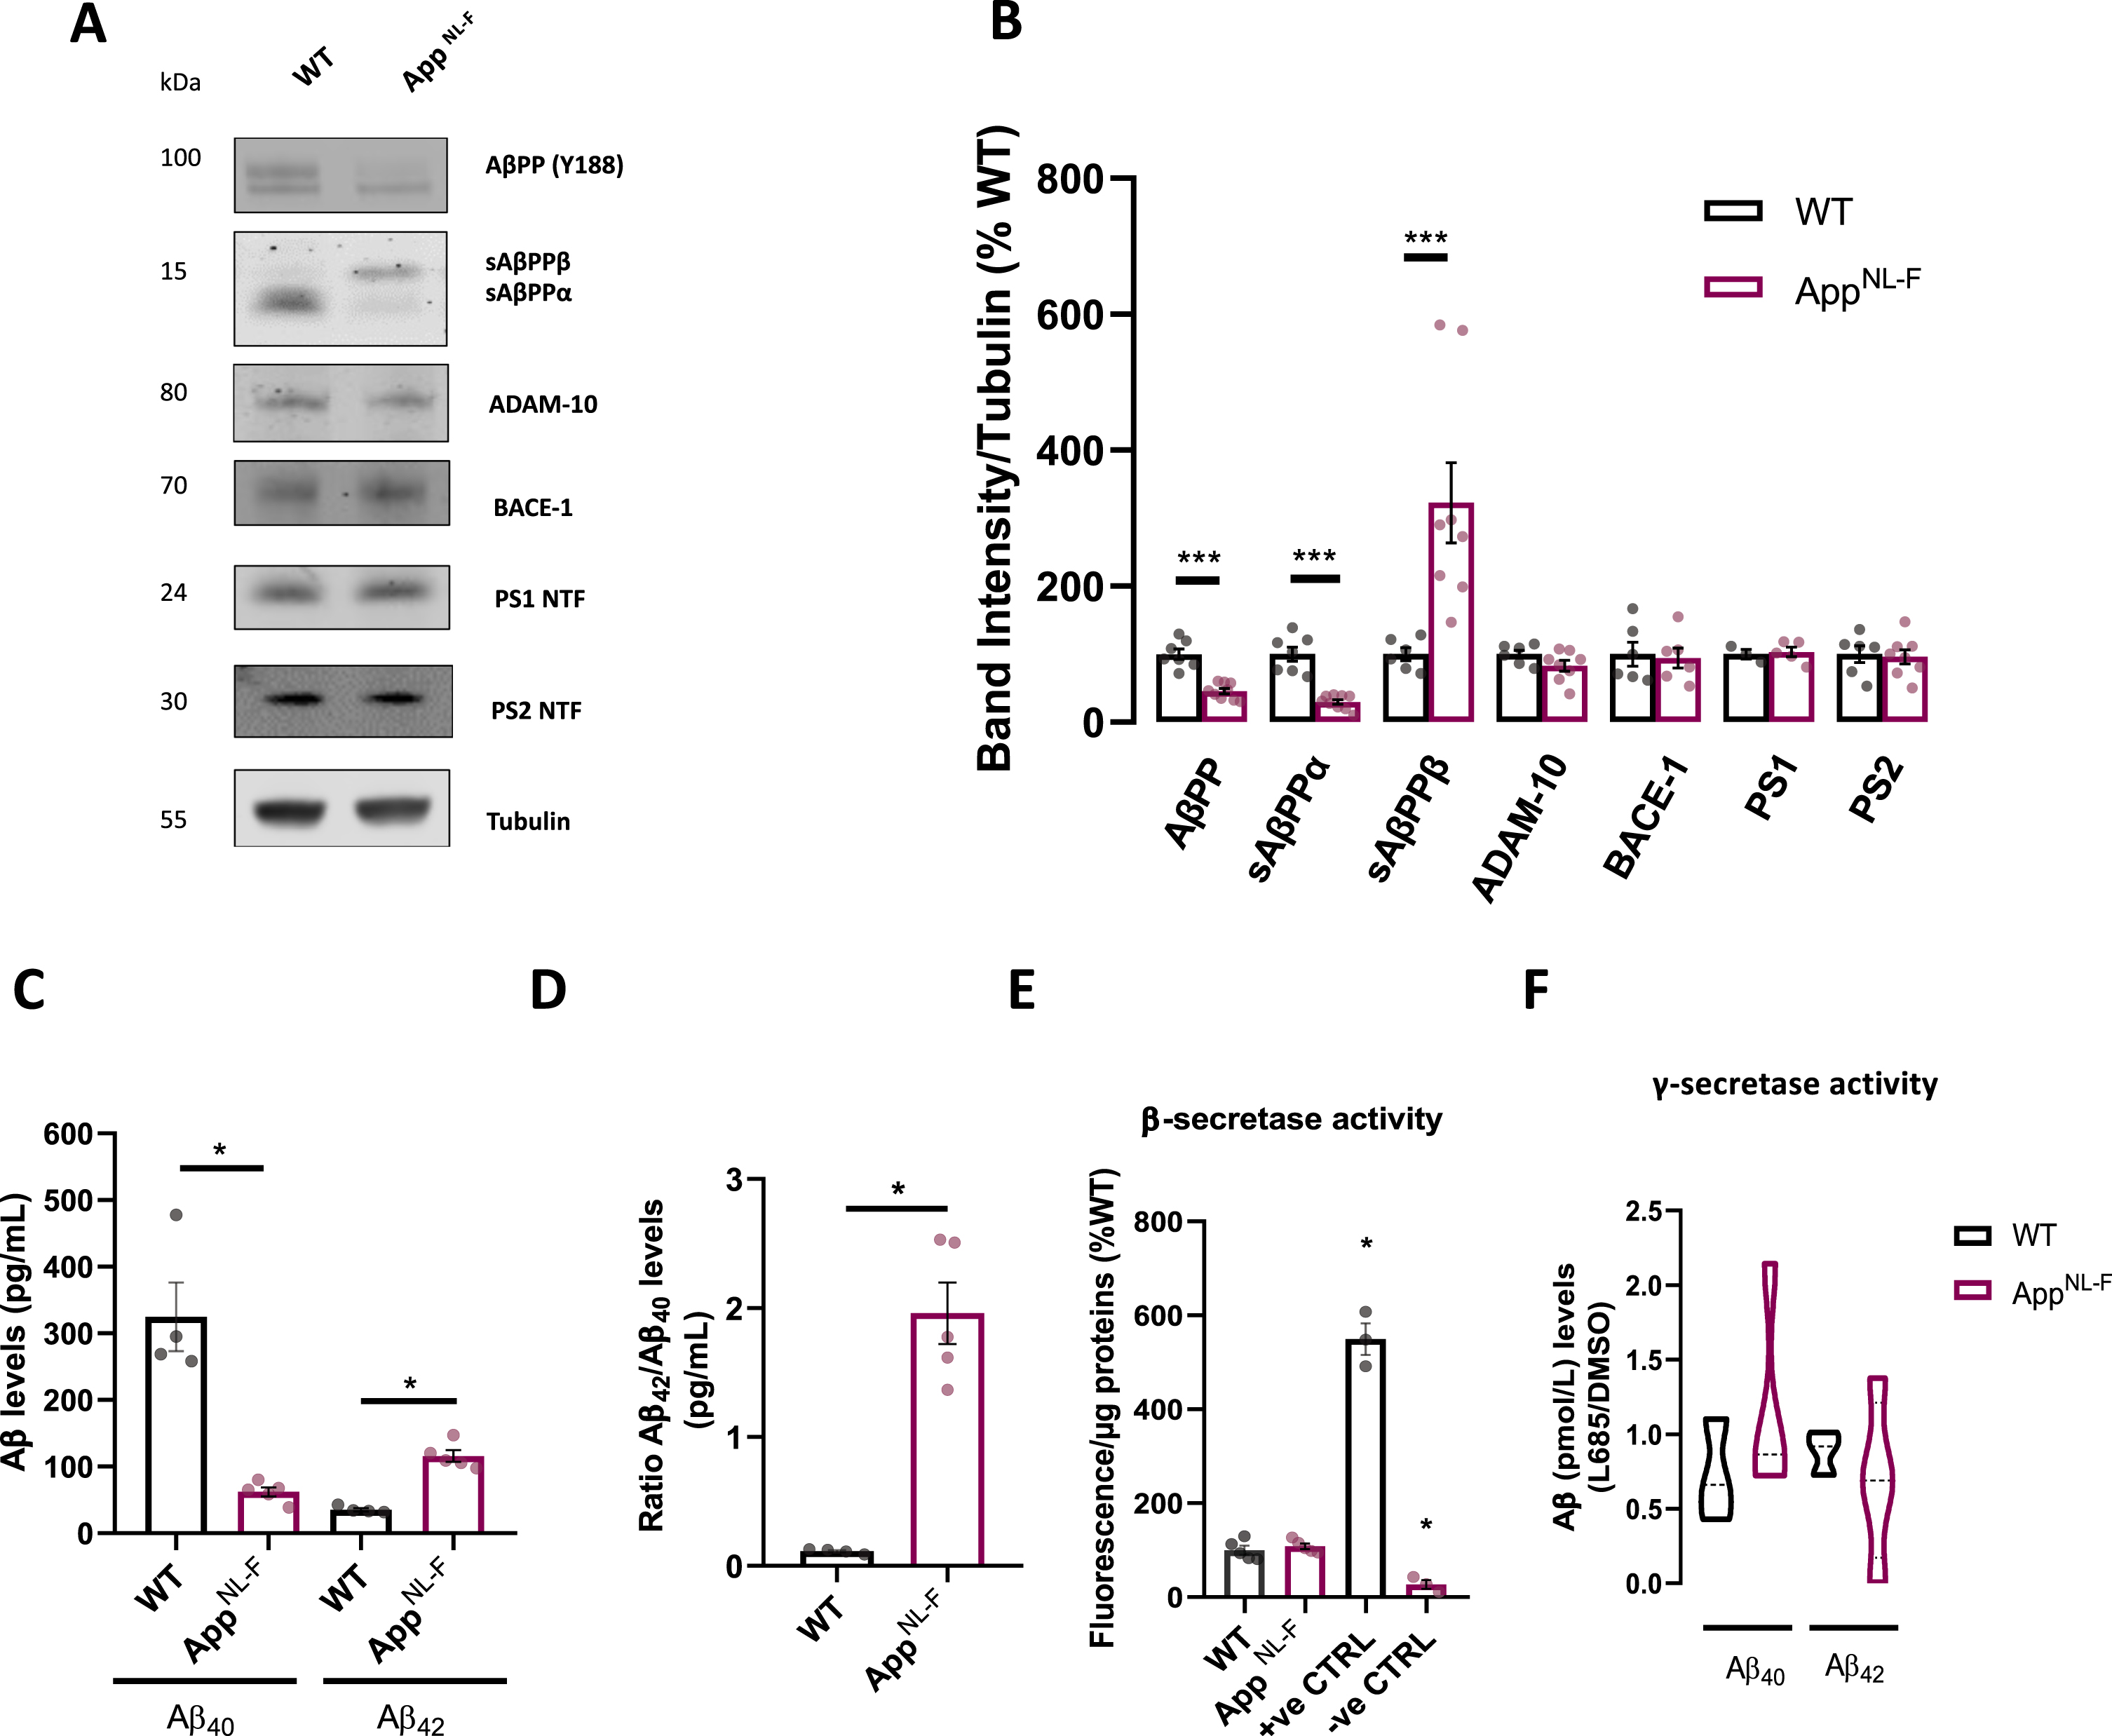
We further evaluated secreted Aβ40 and Aβ42 levels in culture media collected from 12–15 DIV WT and AppNL-F cultures, using an enzyme-linked immunosorbent assay (ELISA). As expected, secreted Aβ40 was decreased in AppNL-F compared to WT media (p = 0.0159, Mann-Whitney test), while Aβ42 levels were substantially upregulated by ∼195% in AppNL-F cultures (p = 0.0159, Mann-Whitney test) (Fig. 1C). Furthermore, a characteristic AD related shift in Aβ42/Aβ40 ratio was observed in AppNL-F cultures (p = 0.0159, Mann-Whitney test) (Fig. 1D).
While no enzymatic activity study has been carried out in vivo in this model, we assessed activity of both β-secretase and γ-secretase (Fig. 1E, F). Unlike studies using overexpressing mouse model such as 3xTg-AD A βPP [36], no differences were detected in secretase activities between the two cultures, hence pointing to physiological activity of enzymes involved in the amylogenic pathway. The NH2-terminal side of A βPP can harbor the K670 N/M671 L (Swedish) mutation, enhancing A βPP susceptibility to cleavage by β-secretase [37]; while likely not affecting the secretase's activity as observed in our model.
Taken together, these data suggest that mature AppNL-F neurons present increased Aβ42/Aβ40 ratio and increased secreted Aβ42, when compared to WT, hence we decided to use them as a model to dissect out early Aβ-mediated mechanism.
Mitochondrial function is increased, and glycolytic reserve is decreased in AppNL-F cultures
Aβ has been shown to mediate a variety of deleterious effects on mitochondria [38], and therefore we decided to characterize mitochondrial function in AppNL-F cells.
AppNL-F cells were monitored for changes in oxidative phosphorylation (OxPHOS) by measuring mitochondrial OCR using the Seahorse XFe96 Analyzer (Fig. 2A). Surprisingly, AppNL-F cell showed a significant increase in basal respiration (p = 0.0177, Mann-Whitney test), maximal respiration (p = 0.0076, Mann-Whitney test), ATP-linked respiration (p = 0.0177, Mann-Whitney test), and almost significant spare respiratory capacity (p = 0.0694) compared to WT cells (Fig. 2B, C), unlike previously reported in A βPP overexpressing models including APPSwe/Lon overexpressing cell lines, APPSwe/Lon transgenic mice whole brains and isolated mitochondria [15, 16]. Importantly, changes observed in mitochondrial respiration were not due to alteration in the expression of any electron transport chain subunit analyzed (Fig. 2D and Supplementary Figure 1A). Reactive oxygen species (ROS) are primarily produced by mitochondria, and increased respiration strengthens electron transport via the electron transport chain, resulting in ROS production. To see if increased ROS could be a consequence of increased OCR in AppNL-F cultures we evaluated changes in mitochondrially derived ROS by assessing namely mitochondrial H2O2 using the MitoPY1 fluorescent probe (Fig. 2E, F). No differences were detected in H2O2 levels under basal or upon complex III Inhibitor Antimycin A1 (AntA) incubation (Fig. 2G), suggesting that increased OxPHOS does not significantly boost electron leakage. To evaluate if increased mitochondrial respiration may result from increased mitochondrial membrane potential (Δψm), we assessed retention of positively charged TMRM dye. On average, TMRM release was found to be increased in knock-in neurons compared to WT neurons, however not reaching statistical significance (Supplementary Figure 1B). No changes were also observed in overall ATP levels, suggesting that increased OCR does not compensate to induce significant upregulation in total cellular ATP (Supplementary Figure 1C).
Fig. 2
Characterization of bioenergetics in AppNL-F neurons. A) Oxygen consumption rate (OCR) representative traces showing cellular respiration in WT and AppNL-F neurons after the sequential injection of oligomycin (oligo, 1μM), FCCP (1μM) and Rotenone + Antimycin A (Rot + AntA, 0.5μM). B) Spider chart lines represent fold-increase in OCR considering the basal respiration of the WT neurons as 1. C) Bar graphs show quantification of OCR parameters extrapolated from Seahorse XFe96 Cell Mito Stress Test and normalized to protein content normalized to WT (n = 7 independent cultures), D) Representative immunoblots of primary cortical neurons homogenate from WT and AppNL-F neurons. Blots were probed with OXPHOS cocktail antibody and tubulin was used as a loading control (n = 7–9 independent cultures). E) Representative fluorescence and brightfield images show MitoPY1 fluorescence in WT and AppNL-F neurons. F) Traces of Mitochondrial MitoPY1 fluorescence upon AntA stimulus. G) Mitochondrial H2O2 levels quantification under basal conditions and upon Ant A (2μM) treatment (n = 35–49 cells, from 4 independent experiments). H) Extracellular acidification rate (ECAR) traces in WT and AppNL-F neurons after the sequential injection of Glucose (Gluc,10 mM), oligomycin (Oligo, 1μM) and 2-DeoxyGluocose (2-DG, 50 mM) (n = 6–7 independent cultures). I) Quantification of ECAR parameters extrapolated from the Seahorse XFe96 glycolytic stress test report and normalized to protein content normalized to WT (n = 6–7 independent cultures). J) Bar graph shows quantification of LDH assay absorbance normalized to protein content in WT or AppNL-F cultures; Lysis buffer was used as a positive control to elicit LDH release and Ant A (24 h, 0.5μM) was used to elicit mitochondrial stress (n = 4–7 independent cultures). K) Quantification of fold increase in absorbance of LDH between Ant A treated and DMSO treated WT and AppNL-F cells (n = 5–7). Data shown as mean±SEM. *p≤0.05, **p≤0.01.
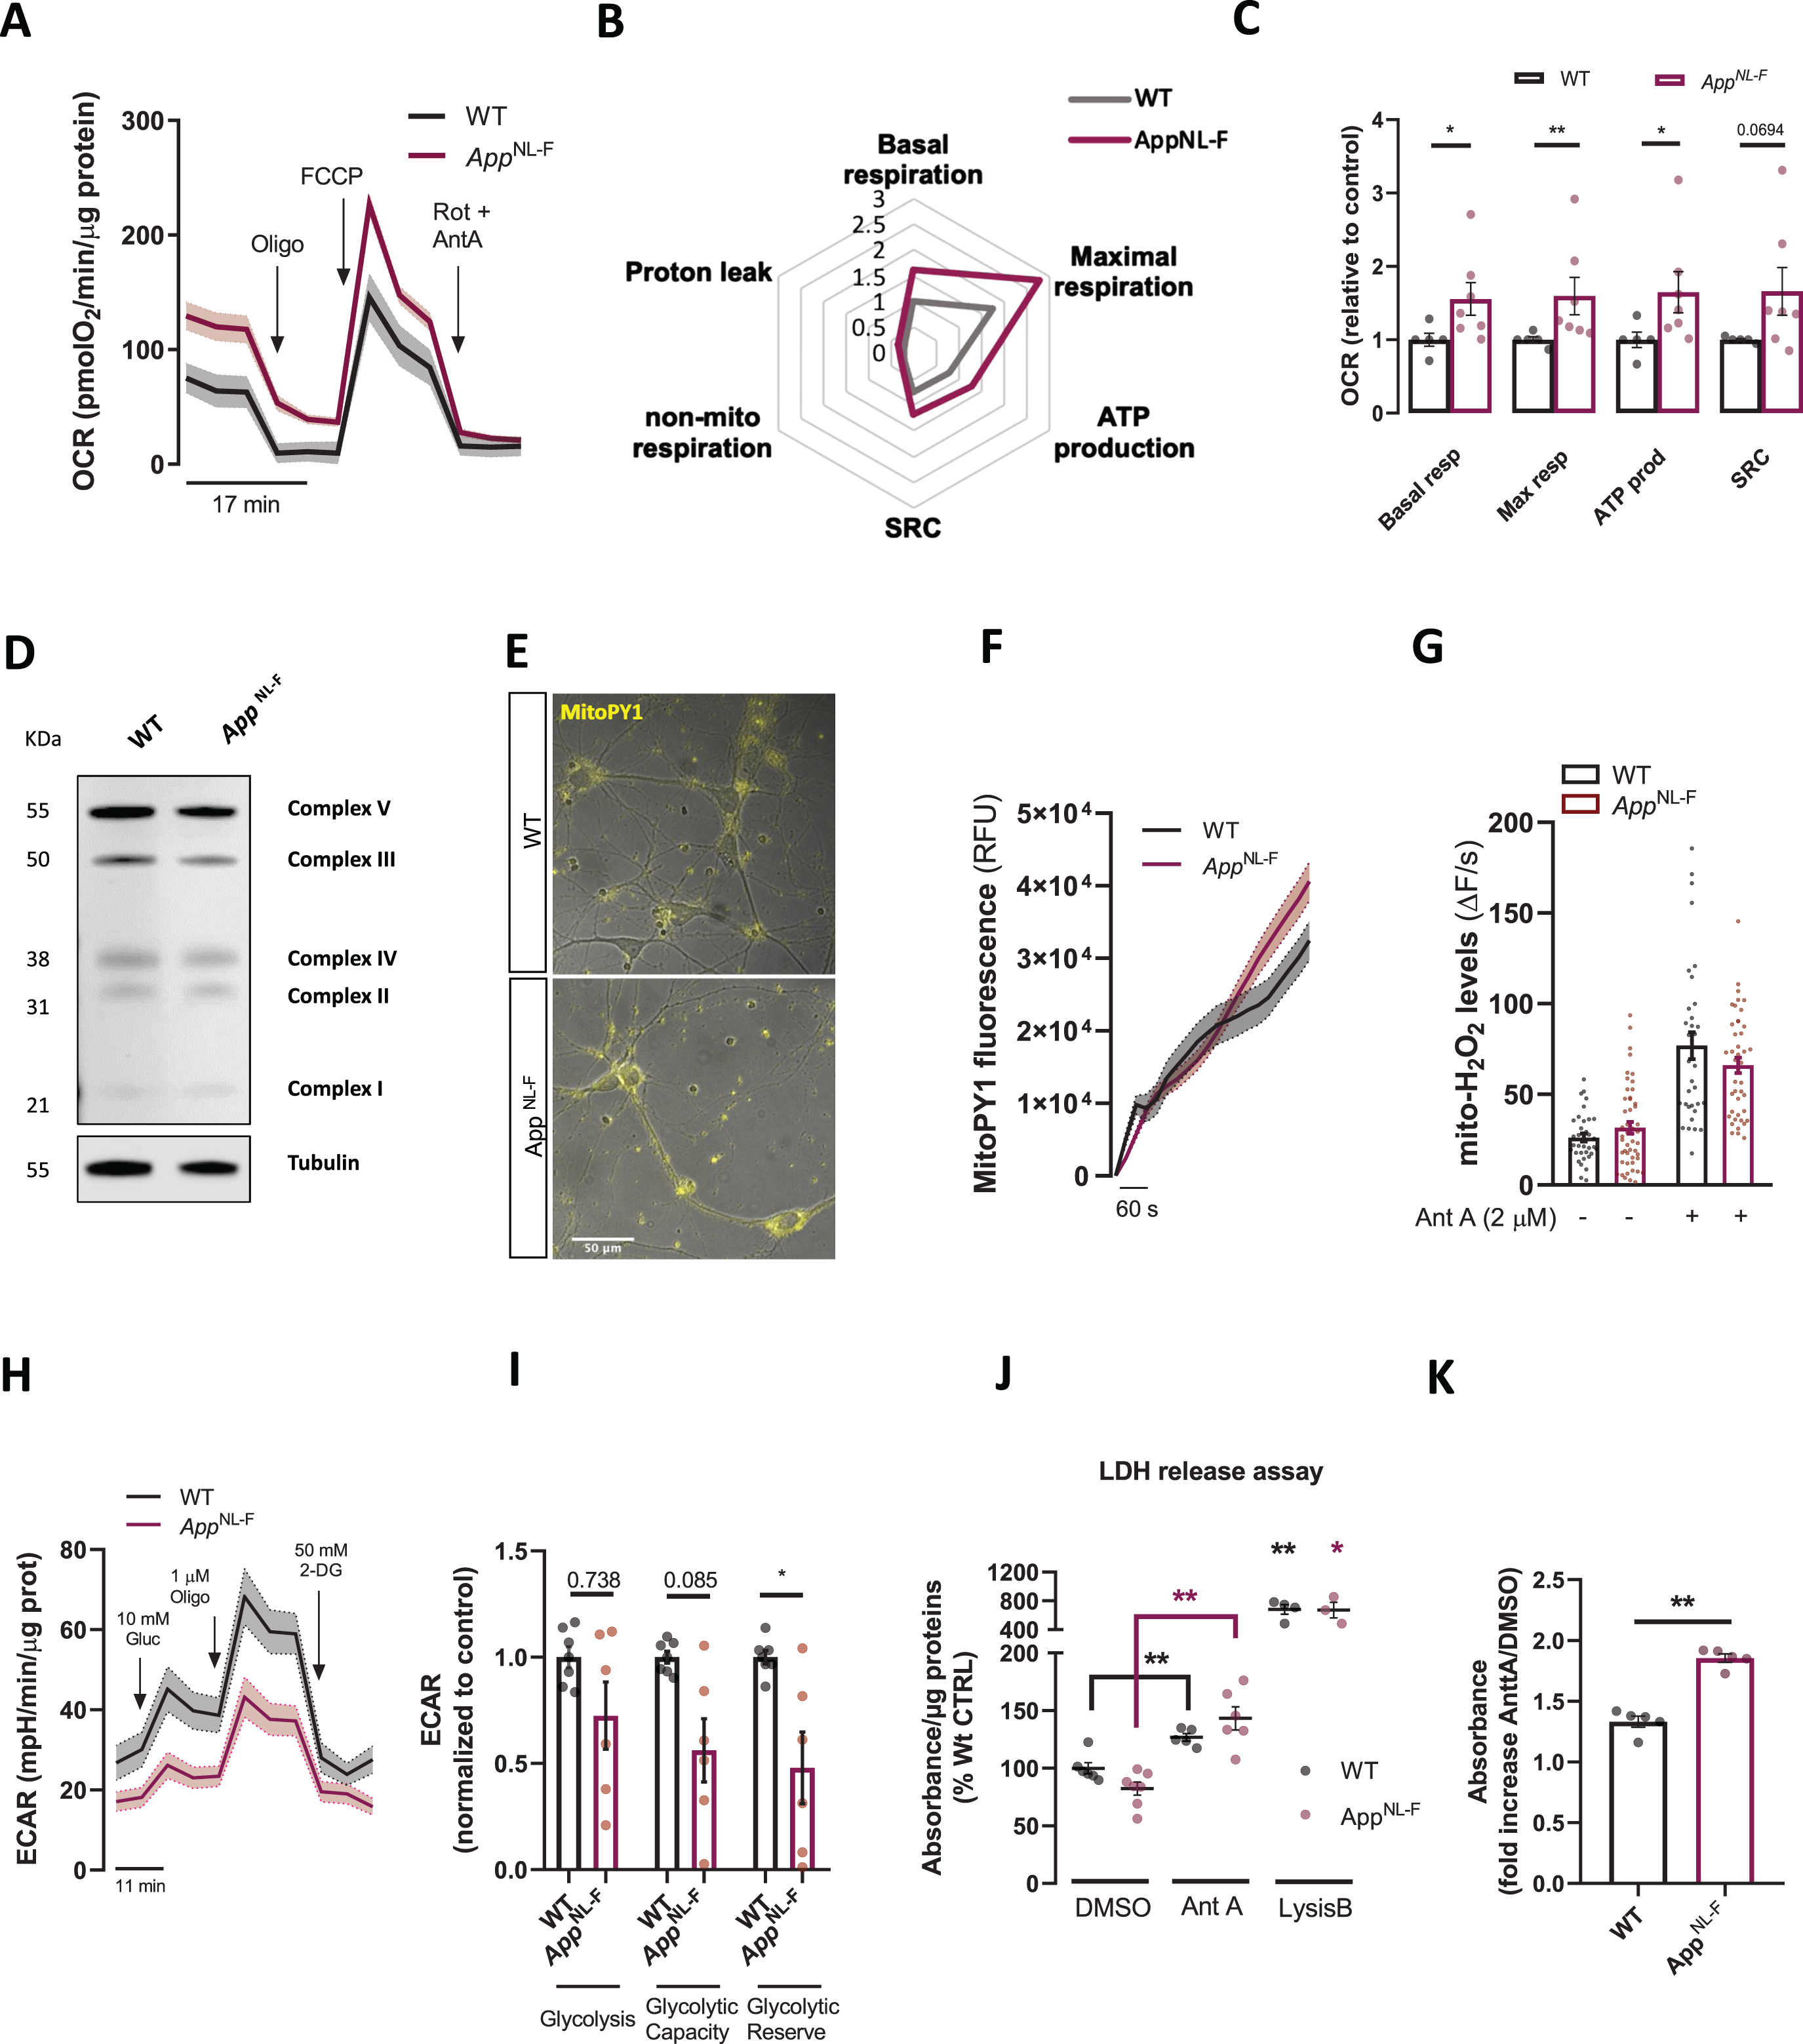
As our findings suggested upregulated mitochondrial respiration but no changes in cellular ATP levels, we sought to assess other forms of cellular ATP provision. Therefore, we measured extracellular acidification rate (ECAR) of the media, a read-out for anaerobic glycolysis. Overall, glycolytic flux was unchanged in AppNL-F cell compared to WT cells (Fig. 2H, I). However, upon mitochondrial complex V inhibition with oligomycin, glycolytic reserve was shown to be significantly lower in AppNL-F neurons (p = 0.035, Mann-Whitney test) (Fig. 2I); similarly, glycolytic capacity was almost significantly downregulated in AppNL-F neurons (p = 0.085) (Fig. 2I). Although these states are unused in basal conditions, cells could utilize them in response to increased ATP demand, predicting glycolysis impairment under stress conditions.
These results made us speculate that AppNL-F neurons might be more susceptible to dyshomeostasis compared to WT cells upon induction of mitochondrial dysfunction. Thus, cells were treated with AntA for 24 h and subsequently plasma membrane rupture (a hallmark of necrosis) was assessed through LDH (lactate dehydrogenase) release in the media. In both WT and knock-in condition AntA significantly increased LDH release (p = 0.0087 for WT and p = 0.0012 for AppNL-F, Mann-Whitney test) (Fig, 2J). Interestingly, while in DMSO treated conditions no differences in LDH were shown, upon AntA incubation the fold increase in LDH release was increased in AppNL-F cells as compared to WT cells (p = 0.0079, Mann-Whitney test) (Fig. 2K). Furthermore, no difference in basal condition in DNA nicks, a hallmark of apoptosis, were reported in the TUNEL assay between the two genotypes (Supplementary Figure 1D, E). These data suggest that knock-in neurons have a lower threshold for cell necrosis induction following mitochondrial impairment in comparison to WT neurons.
Our results so far show that mitochondrial respiration is upregulated, while glycolysis is impaired indicative of early damage in bioenergetics in this cellular model. Indeed, since mitochondrial OCR is upregulated, AppNL-F cells seem to be more susceptible to cell death upon induction of mitochondrial stress and being uncapable of handling mild stressors compared to WT cultures.
MERCS number and function is increased in AppNL-F cultures
Levels of mitochondrial ATP are tightly regulated by Ca2+-shuttling from ER to mitochondria, as activation of some TCA cycle dehydrogenases are Ca2+-dependent [21, 22]. Indeed, interplay of both organelles at MERCS supports mitochondrial physiology by affecting several pathways including lipid and cholesterol metabolism [23], ROS production [39], and provides initiating sites for mitochondrial fission [26]. As basal and maximal respiration, and mitochondrial ATP production were seen to be upregulated in AppNL-F model, we investigated whether this increase could be explained by increased juxtaposition between ER and mitochondria.
Electron micrographs obtained from AppNL-F and WT neurons were analyzed to evaluate MERCS and assess mitochondrial ultrastructure in neurons’ soma (Fig. 3A). Knock-in cultures displayed significant alterations in several parameters including MERCS length (p < 0.0001, Mann-Whitney test), MERCS number per cell (p = 0.0013, Mann-Whitney test) and mitochondria number per cell (p = 0.0331, Mann-Whitney test) compared to WT cultures (Supplementary Figure 2A, B). Furthermore, to account for changes in mitochondrial network and number we normalized number of MERCS to number of mitochondria per cell and detected a substantial upregulation in AppNL-F cells (p = 0.0008, Mann-Whitney test) (Fig. 3B). Furthermore, percent of mitochondria membrane in contact with ER membrane was also shown to be increased in AppNL-F neurons as compared to WT neurons (p = 0.0013, Mann-Whitney test) (Fig. 3C). No changes were detected in mitochondrial number nor perimeter (Supplementary 2 C, D). To complement the EM studies, we transfected neurons with fluorescence-based reporter of ER-mitochondria juxtaposition SPLICS-GFP and assessed number and area of SPLICS-GFP puncta detected in axonal processes, detected through MAPT staining (Fig. 3D, E, Supplementary Figure 1F). Increased accumulation of SPLICS-GFP signal was detected in AppNL-F neurons as compared to WT neurons (p = 0.0227, Mann-Whitney test) (Fig. 3E), further confirming structural increased juxtaposition between ER and mitochondria.
Fig. 3
Characterization of ER to mitochondria juxtaposition in AppNL-F neurons. A) Representative electron micrographs pictures of WT or AppNL-F neurons showing mitochondria (red) and ER (green) in close proximity to each other forming MERCS. Scale bar = 250 nm scale. B) Violin plot shows quantification of number of MERCS per number of mitochondria per cell and C) violin plot shows % of mitochondria in contact with ER (4 independent cultures, 5 cells analyzed per condition). D) Confocal Z-stack rendering of SPLICS-GFP dots in axonal processes in WT and AppNL-F neurons. Pictures on the right display overlay of SPLICS-GFP and MAP2 staining. Scale bar = 10μm. E) Quantification number SLICS-GFP particles per 100μm of axonal process (n = 14–22, from 3 independent experiments). F) Rhod2 fluorescence recording of mitochondria Ca2+ transients upon IP3-generating agonists Ca2+ release; mean shown as solid line, dotted lines display±SEM. G) Quantification of cytosolic Ca2+ peak amplitude and of mitochondrial Ca2+ retention capacity. H) Representative confocal images of WT or AppNL-F neurons incubated with LipidTOX Red. I) Quantification of fluorescence LipidTOX Red per cell in WT or AppNL-F neurons (20-25 cells, from 4 different experiments). Scale bar = 10μm. J) Representative immunoblots of primary cortical neurons homogenate from WT and AppNL-F neurons. Blots were probed with antibodies against MERCS and mitochondrial proteins and tubulin was used as a loading control (n = 7–9 independent cultures). K) Bar graph shows amounts of protein analyzed once standardized to tubulin content in each sample. Data shown as mean±SEM. *p≤0.05, **p≤0.01, ***p≤0.001.
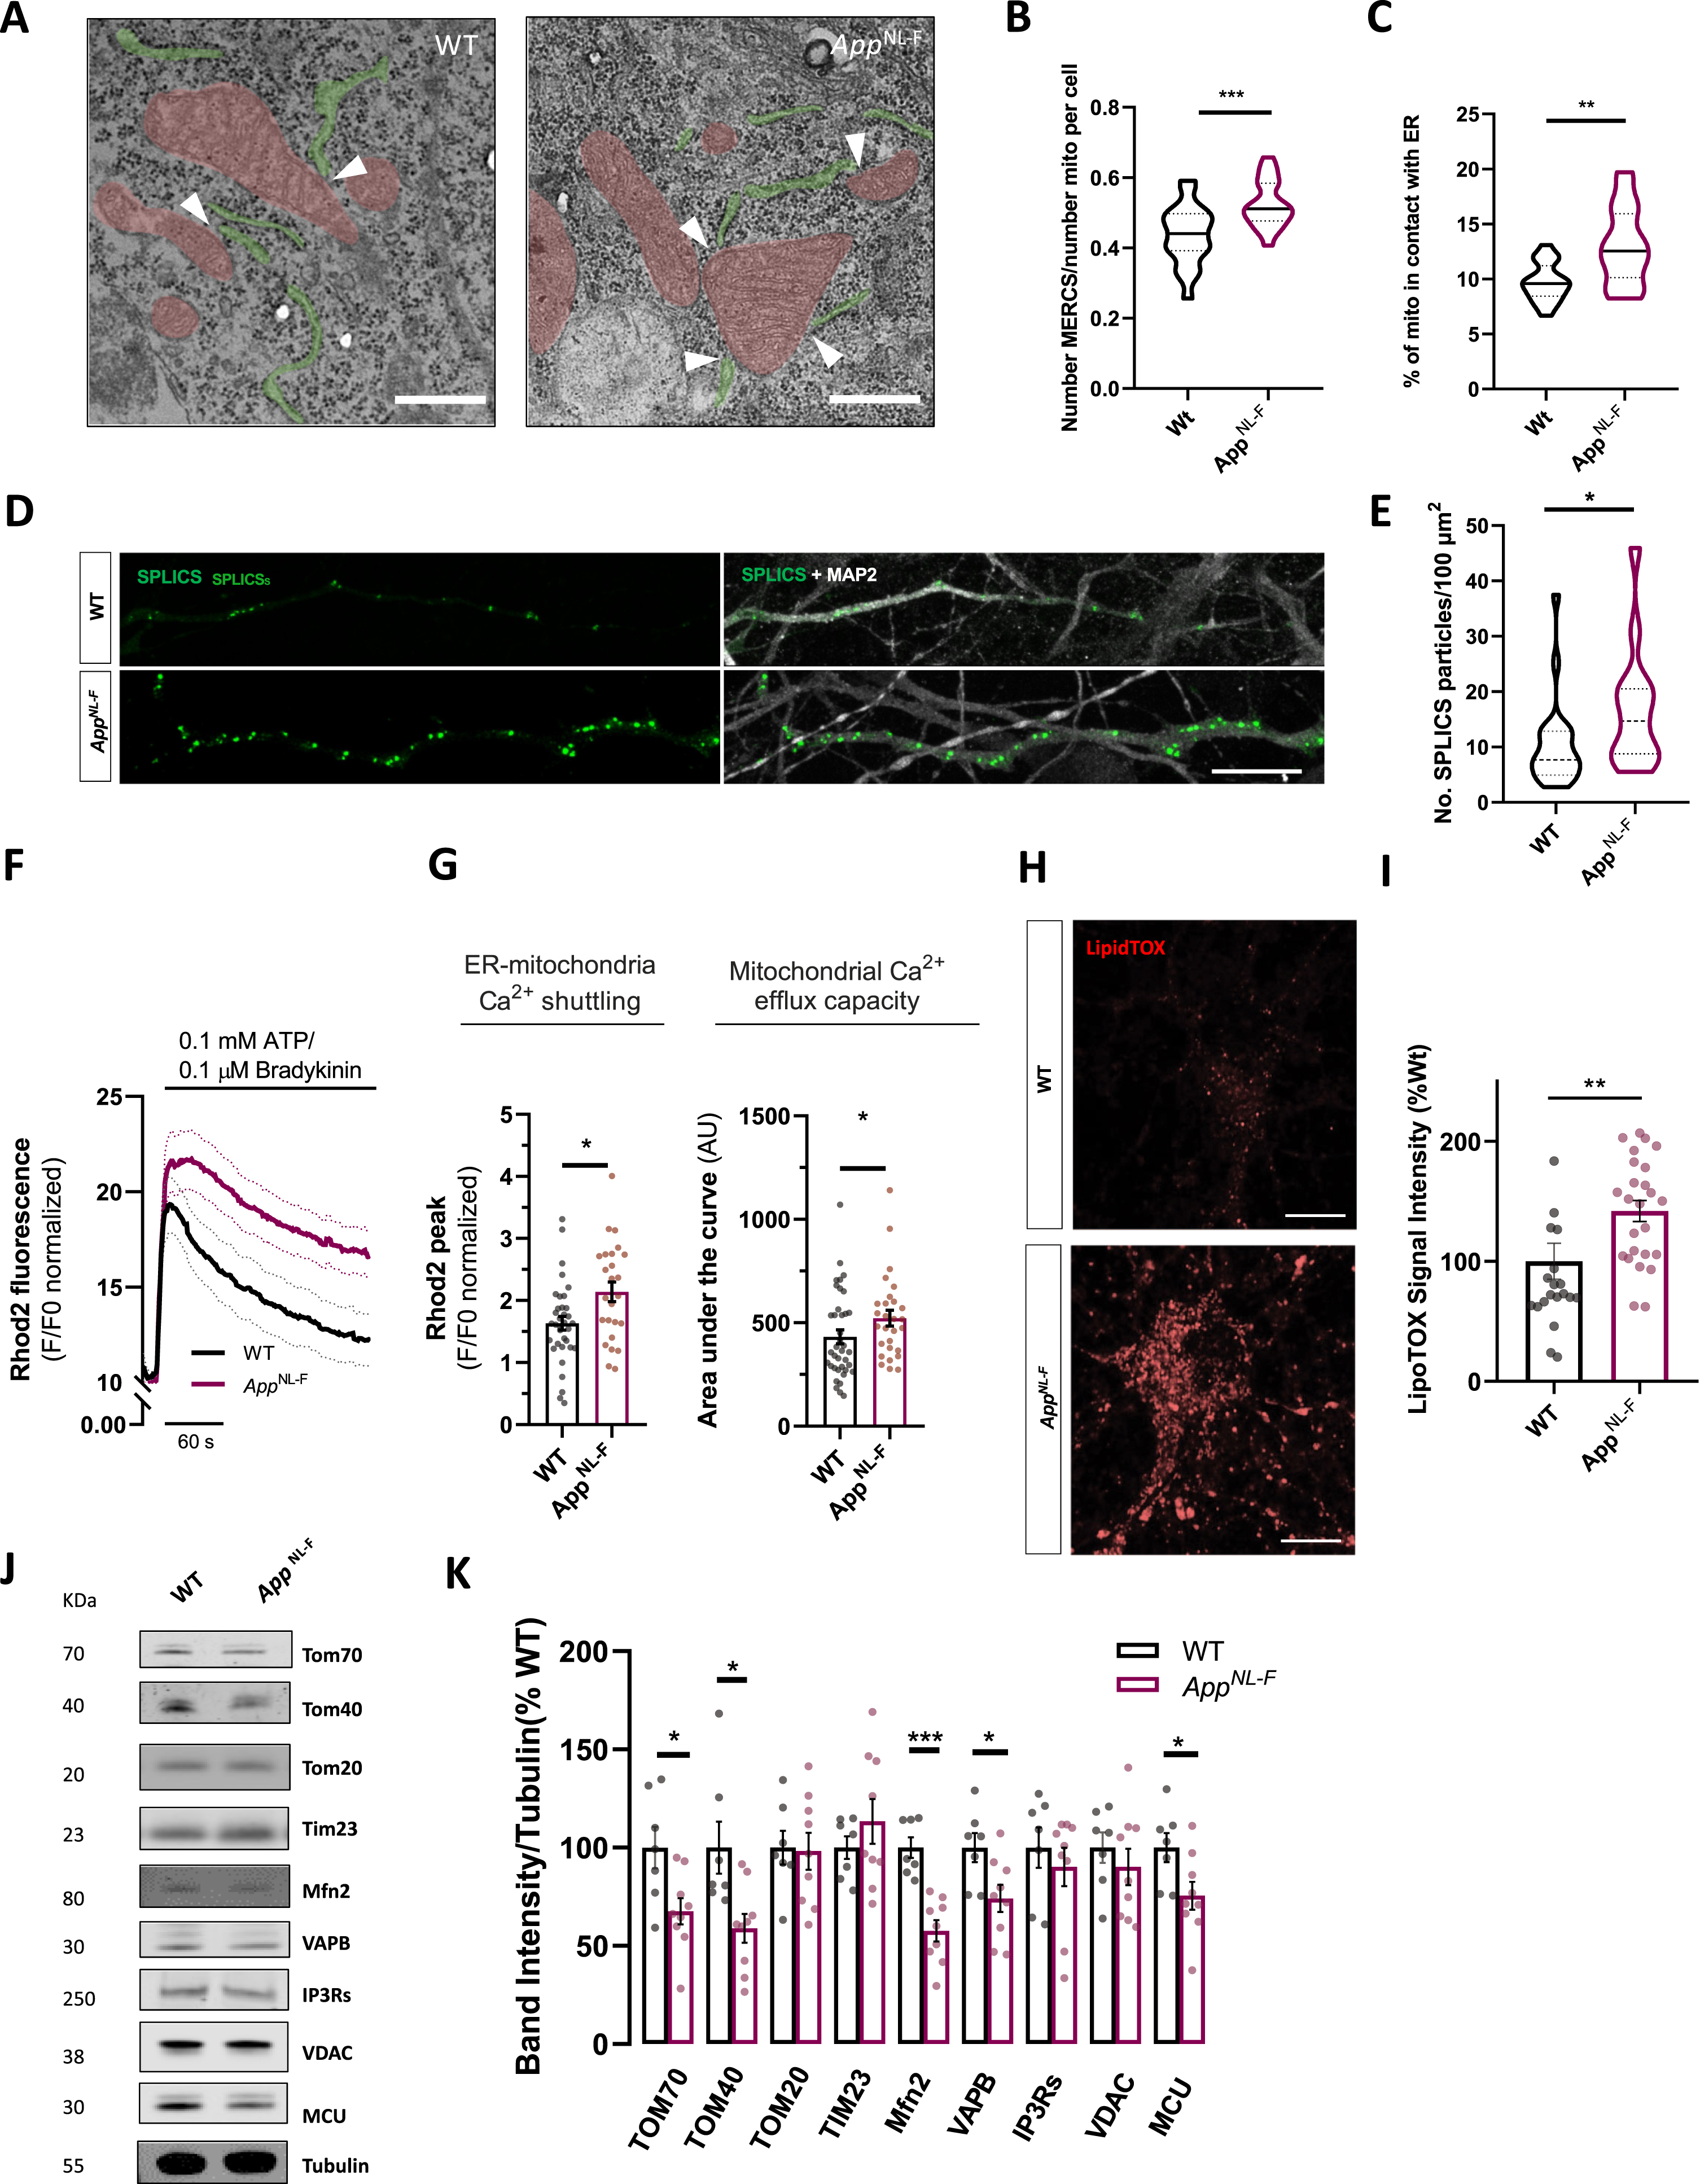
Moreover, we monitored Ca2+-shuttling between ER and mitochondria. We triggered IP3 receptor-mediated Ca2+-release from ER upon stimulation with IP3-generating agonists ATP and bradykinin (Fig. 3F). IP3-receptor stimulation resulted in a significant time-dependent increase in peak mitochondrial Ca2+ in AppNL-F neurons (p = 0.0185, Mann-Whitney test) (Fig. 3G), resulting in more Ca2+-shuttling to mitochondria. Furthermore, compared to controls, AppNL-F neurons show decreased mitochondrial Ca2+-efflux capacity, calculated as an increase in the area under the curve (p = 0.0459, Mann-Whitney test) (Fig. 3G). The observed increase in mitochondrial Ca2+-efflux capacity could further influence previously observed higher propensity to cell death (Fig. 2J, K). Phospholipid shuttling between ER and mitochondria is a major physiological mechanism ascribed to MERCS. Lipid droplets are found in the proximity of MERCS and ER exit sites [40] and lipid droplet accumulation has been used as an indicator to indirectly assess MERCS phospholipid shuttling activity [31, 41]. We used LipidTox REDTM dye to stain and quantify neutral lipid (Fig. 3H), which are major components of lipid droplets. While WT cells showed limited LipidTox fluorescence, AppNL-F cells displayed significant increase in fluorescence resulting in ∼40% increase in neutral lipid fluorescence accumulation (p = 0.0018, Mann-Whitney test) (Fig. 3I).
We also enquired whether changes in MERCS function and structure could be related to changes in MERCS and mitochondrial proteins (Fig. 3J). Several proteins have been identified to play functional and structural roles at MERCS. Indeed, the levels of Mfn2, a negative regulator of contacts [42, 43], were found to be significantly downregulated (p = 0.0002, Mann-Whitney test) (Fig. 3K), corroborating our structural and functional data. Other proteins located at MERCS such as VAPB and TOM70 were found to be substantially downregulated as previously reported in AD models (p = 0.0311 for VAPB and TOM70, Man-Whitney test) (Fig. 3K) [40, 44]. Other outer mitochondrial membrane protein such TOM40 and inner mitochondrial membrane protein MCU were also shown to be substantially downregulated (p = 0.0115 for TOM40 and p = 0.0418 for MCU, Mann-Whitney test) (Fig. 3K). No differences were detected in IP3Rs, TOM20, TIM23, nor VDAC1 levels (Fig. 3K).
This data demonstrates that AppNL-F neurons, similarly to other AD models, present increased ER-mitochondria juxtaposition. Furthermore, knock-in neurons displayed upregulation of Ca2+-shuttling at MERCS and increased neutral lipid accumulation.
AppNL-F cultures display mitochondrial movement and synaptic dysfunction
Several lines of evidence point to synaptic dysfunction being an important contributor in AD pathology [45]. In neurons mitochondrial distribution in cellular areas and their movement plays a critical role in synaptic function, hence we assessed whether mitochondrial transport and synaptic function were affected in vitro.
Firstly, we assessed protein levels of mitochondrial transport mediators. The kinesin family members, particularly KIF5 are the main meditators of neuronal mitochondrial anterograde movement [46]. Other players in mitochondrial movement are adaptor proteins which mediate the attachment of mitochondria to kinesis such as Miro1 and Miro2. These proteins contain a Rho-GTPase comprising two GTPase domains and two Ca2+ binding domains [47]. Other adaptor proteins are Trak1 and Trak2 [48]. In hippocampal neurons mitochondrial transport is mediated by Miro-Trak complex driving anterograde transport [47]. Immunoblot from cellular extracts reveals downregulation in Trak1 levels (p = 0.0216, Mann-Whitney test), while other mitochondrial transport proteins were not affected (Fig. 4A, B). We further assessed mitochondrial movement along neurites (which can be either dendrites or axons) in neurons where mitochondria were labelled with mitochondrial targeting sequence with an RFP tag, MitoDsRed. Kymographs show transport of mitochondria in neurites for 10 min (Fig. 4C). Notably, in AppNL-F knock-in neurons there was a substantial upregulation of stationary mitochondria and concomitant decrease in moving mitochondria, compared to WT cells (p = 0.0006 for stationary and moving mitochondria, Mann-Whitney test) (Fig. 4D). Furthermore, in knock-in neurons anterograde transport was decreased while retrograde mitochondrial transport was significantly upregulated compared to control neurons (p = 0.033, Mann-Whitney test) (Fig. 4E). Mitochondrial speed did not seem to be affected (Supplementary Figure 1G).
Fig. 4
AppNL-F neurons present mitochondrial transport and synaptic dysfunction. A) Representative immunoblots of primary cortical neurons homogenate from WT and AppNL-F neurons. Blots were probed with antibodies against mitochondrial movement protein mediators and tubulin was used as a loading control (n = 5–7 independent cultures). B) Bar graph shows amounts of protein analyzed once standardized to tubulin content in each sample. C) Representative kymographs (xx, distance versus yy, time) of WT and AppNL-F neurons obtained from mitochondrial trafficking recording over 10 min. D) % of stationary mitochondria (vertical lines) versus % of moving mitochondria (diagonal lines). E) Direction of mitochondria from and to cell soma (n = 12–15 neurites from 3 independent cultures). F) Representative immunoblots of primary cortical neurons homogenate from WT and AppNL-F neurons. Blots were probed with antibodies against presynaptic terminal proteins and tubulin was used as a loading control (n = 4–7). G) Bar graph shows amounts of protein analyzed once standardized to tubulin content in each sample. H) Representative electrophysiological traces. Each black arrow-heads shows a mEPSCs. Quantification of I) resting membrane potential, J) frequency of mEPSCs, K) decay time constant (n = 16–20, from 3–4 independent cultures). Data shown as mean±SEM. *p≤0.05, **p≤0.01, ***p≤0.001.
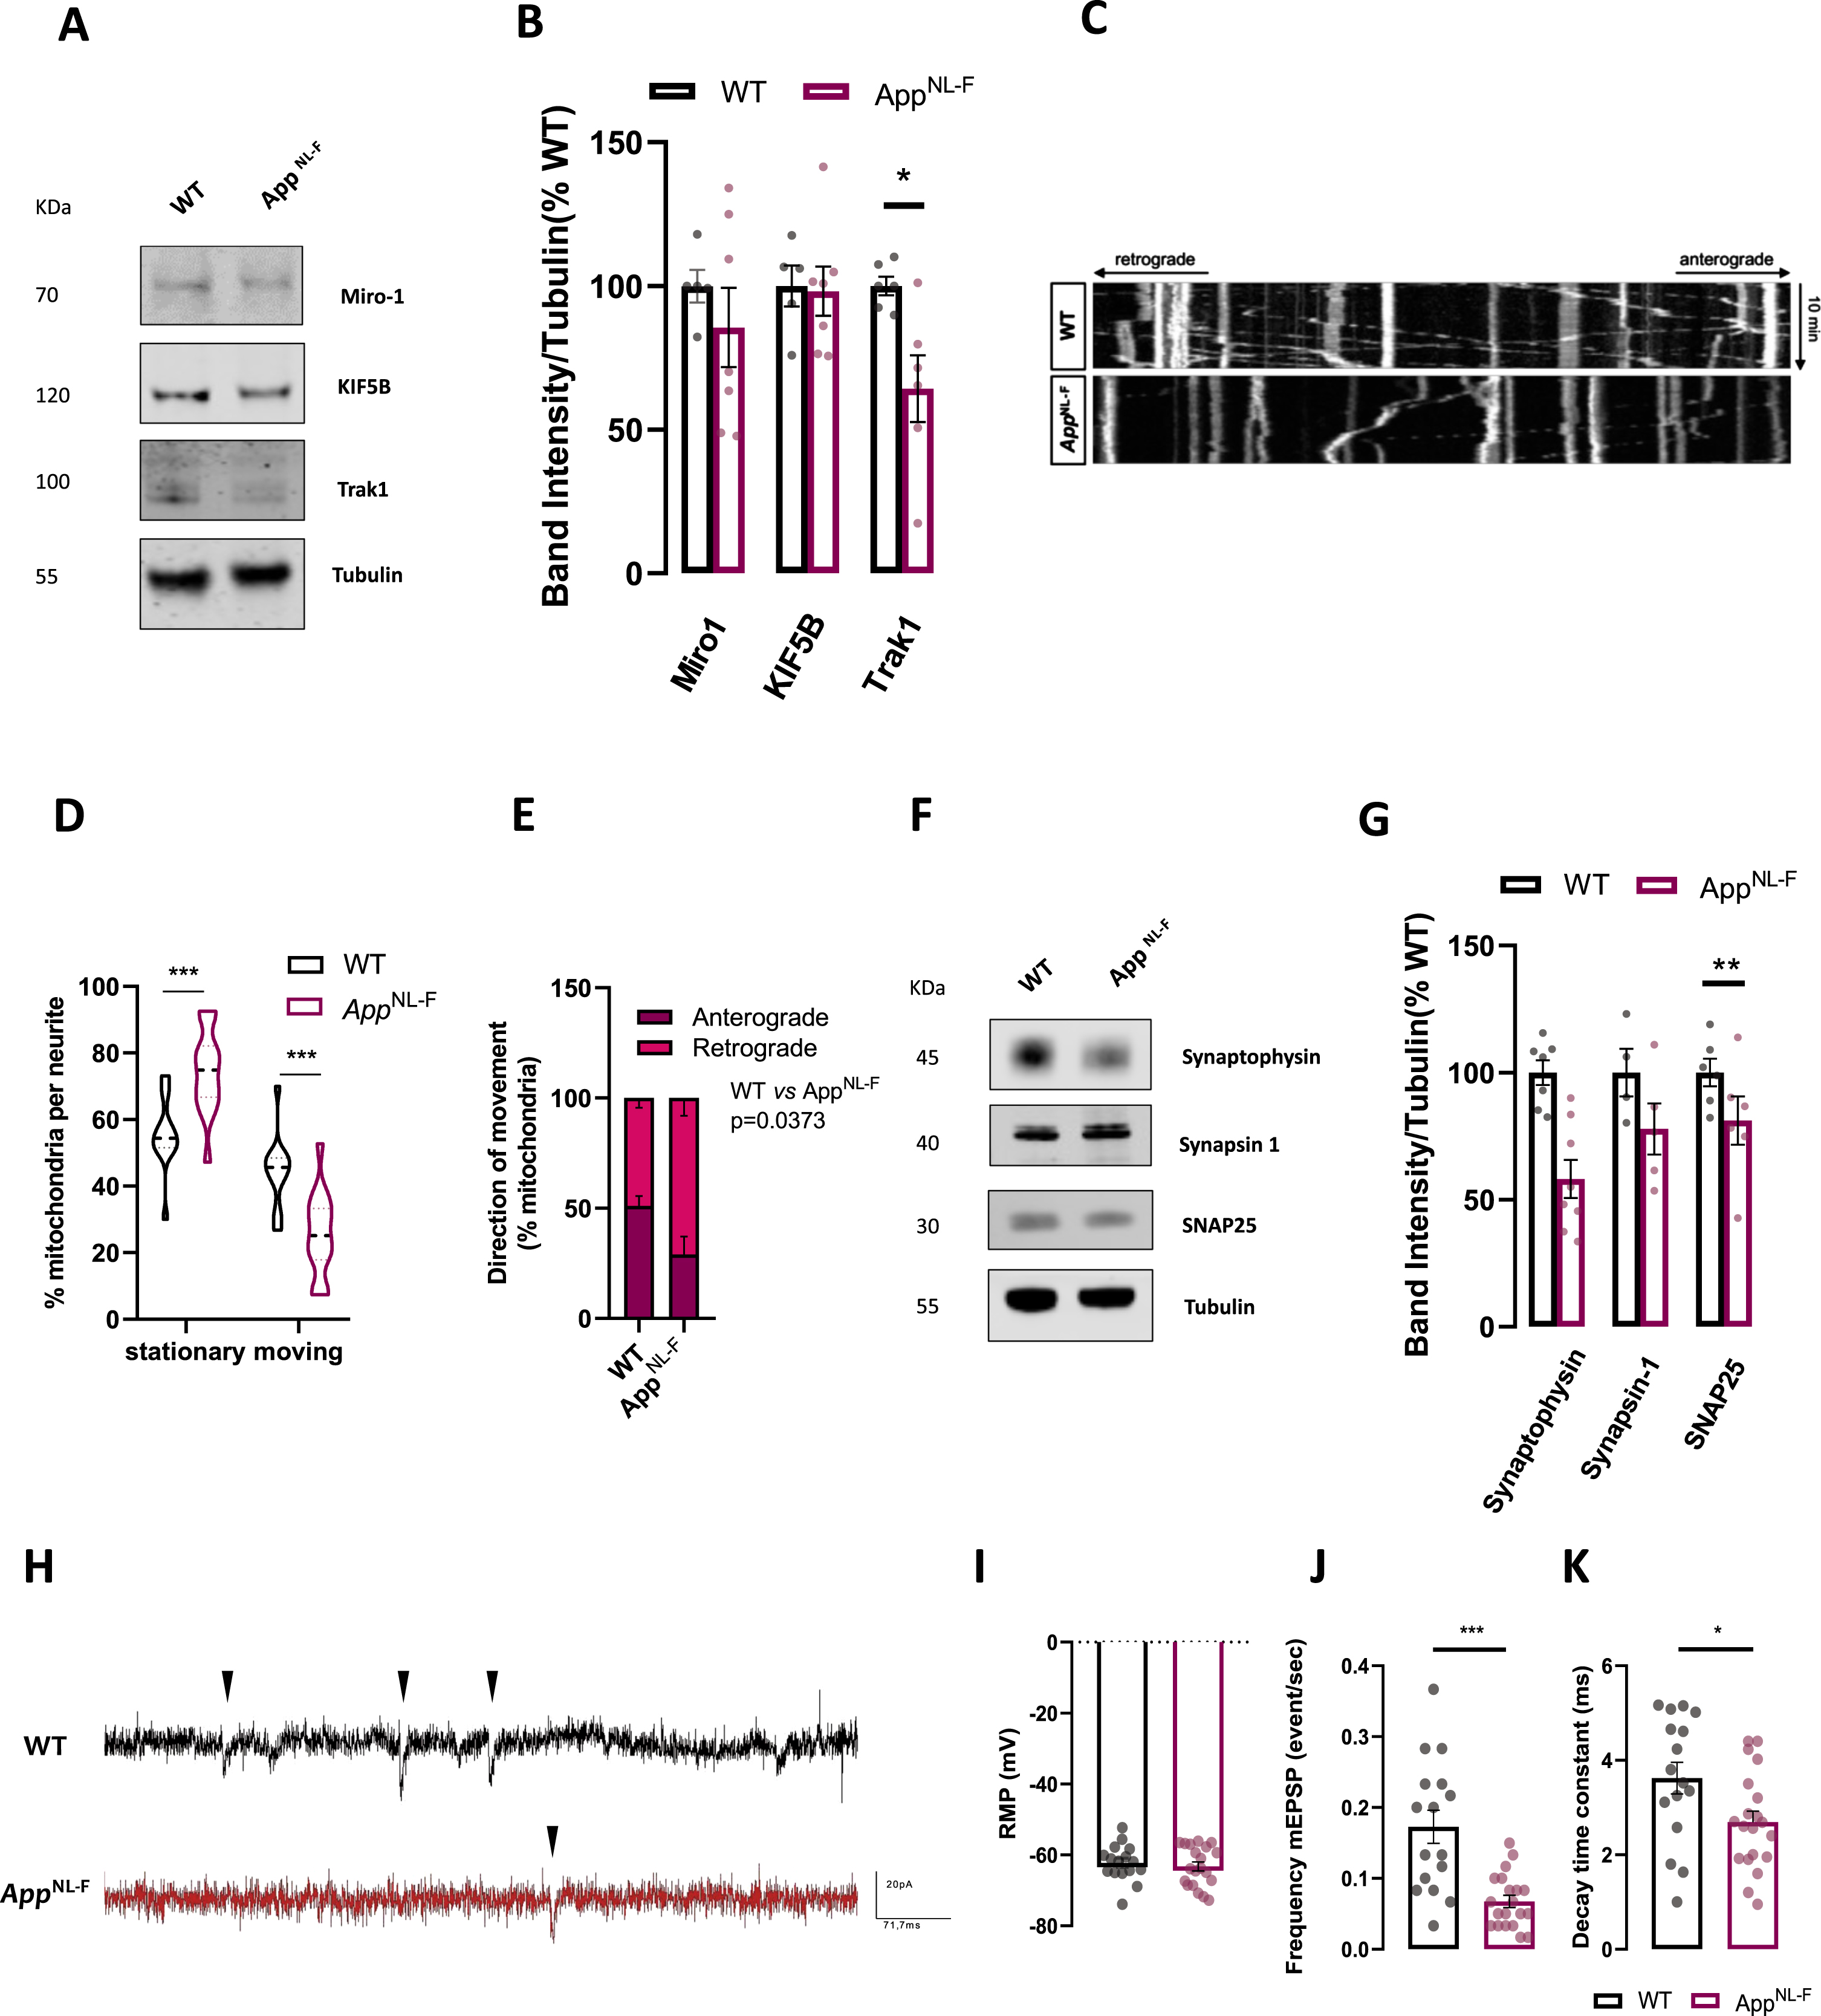
As mitochondria play an important function in presynaptic terminals we checked for alterations in presynaptic markers. We assessed presynaptic vesicle markers synaptophysin and synapsin1 along with SNARE proteins SNAP2.
We found that presynaptic vesicle proteins were mostly unaffected, except for resided synaptic vesicle protein synaptophysin (p = 0.0022, Mann-Whitney test) (Fig. 4F, G), similarly to what has been observed in vivo [7]. To assess synaptic function, cultured cells were patch-clamped. Resting membrane potential of the patched neurons was around –65 mV for WT and AppNL-F with no significant difference between the two groups (Fig. 4H). We then recorded patched cells activity in the presence of tetrodotoxin (TTX) (0.5μM) to block action potential and record spontaneous release events at individual synapses (miniature excitatory synaptic currents, mEPSCs) (Fig. 4I). We observed a significant decrease in the frequency of mEPSCs in AppNL-F cells compared to WT cells (0.1729 events/s versus 0.0675 event/s respectively in WT and AppNL-F, p = 0.0002; Fig. 4J), consistent with a decrease in presynaptic function. No significant differences were detected in mEPSCs amplitude (Supplementary Figure 1H) nor in mEPSCs rise time (Supplementary Figure 1I). However, we observed a significant decrease in the decay time constant in AppNL-F compared to WT (3.623±1.342 ms versus 2.694±1.020 ms respectively for wild-type and AppNL-F, p = 0.025; Fig. 4K) that is typically interpreted as a change in receptor composition at the postsynaptic terminal. Taken together, these results indicate both presynaptic and post-synaptic impairment in AppNL-F cultures.
DISCUSSION
In this study we have characterized for the first time, several mechanisms in mature primary cortical neurons derived from AppNL-F embryos. AppNL-F cells surprisingly exhibited increased respiratory capacity with concomitant downregulation of glycolytic flux, and increased susceptibility to cell death mediated by mitochondrial toxins. These results were associated with changes in structural and functional upregulation of ER to mitochondria juxtaposition. Furthermore, a decrease in mitochondrial anterograde transport and in synaptic activity were detected.
AD research relies on several animal models to assess pathogenic mechanisms; however, these recapitulate most but not all of AD brain features [49]. Overexpression of A βPP transgenes containing FAD-associated mutations results in non-physiological AβPP levels, which can lead to pathologically irrelevant toxicity [5]. On the other hand, App knock-in mouse models overcome this obstacle in AD research by expressing physiological levels of A βPP with FAD mutations. One of the advantages of using the AppNL-F model is that it can recapitulate early dysfunction in AD, as these mice are characterized by slow and progressive deposition of Aβ and can give hints on the effects of intracellular Aβ at earlier stages of pathology [7]. Assessing and understanding earlier stages of the disease has been widely considered as an important therapeutic window prior to development of symptoms [50].
We report that AppNL-F neurons release Aβ42 and present the machinery and mechanisms to develop Aβ pathology, showing a clear increase of toxic Aβ42 species in AppNL-F neurons compared to WT. Indeed, both humanized knock-in A βPP models with or without autosomal dominant mutations display enhanced amyloidogenicity compared to WT murine APP models, with humanized Aβ being sufficient to induce cognitive decline and synaptic dysfunction [51]. We have found several differences in comparison to in vitro and in vivo A βPP overexpressing models. Firstly, AppNL-F cells exhibit lower amounts of sAβPPβ in comparison to A βPP overexpressing models, though the ratio of sAβPPβ/sAβPPα is increased, hence limiting deleterious effects mediated by these Aβ fragments compared to overexpressing models [52]. Furthermore, secretase enzymes levels and activities were found to be unaltered, unlike reported in previous studies using APPSwe overexpressing cell lines [36]. Indeed, increased expression of A βPP might lead to compensatory mechanisms in the cell to increase amyloid pathway enzymes levels and activity to compensate for increase in substrate availability, hence altering cellular physiology.
Oxidative stress and mitochondrial dysfunction are evident in AD postmortem brains [53]. Here we report upregulation in several parameters of mitochondrial OCR in AppNL-F neurons. In accordance with the present study, we have previously seen that OCR was upregulated in WT primary cortical cultures treated with synthetic oligomeric or monomeric Aβ [54]. The upregulation in OCR was not associated with an increase in membrane potential nor H2O2 production in AppNL-F neurons; however, other ROS species were not studied. Interestingly, an increase in expression of genes encoding for respiratory chain complexes was also detected in MCI patients’ brains but not in advanced AD, which was identified as a compensatory-like mechanism in early stages of cognitive impairment [55]. Furthermore, transcriptome analysis of AppNL-F and AppNL-G-F (additionally expressing the Arctic mutation, G) mice performed in our laboratory show that energy metabolism is one of the most affected pathways. Validation of the RNAseq data in mitochondria isolated from young AppNL-G-F mice revealed upregulation of OCR and impaired mitochondrial Ca2+-handling in young mice preceding amyloid plaque deposition (Naia et al., unpublished).
As mitochondrial activity is greatly influenced by Ca2+-influx, we tested whether increased apposition between ER and mitochondria could be responsible for this boost in bioenergetics. Indeed, the present study supports the work in the field of MERCS in AD models [29, 32, 41], as we report a substantial increase in MERCS apposition along with increased Ca2+-shuttling and lipid droplets formation. Regarding protein tethers involved in MERCS apposition, we have shown that similarly to our previous reports in FAD postmortem brains [54], Mfn2 appears to be downregulated in our model, highlighting its role as a negative regulator of contacts. On the other hand, VAPB, another MERCS tethering protein, was shown to be downregulated in AppNL-F neurons and in postmortem cortex in early to mid-AD Braak stages [44]. While these results might appear contradictory, it is not known whether different tethering proteins may be selectively affected in neurodegeneration, generating a diverse phenotypical presentation of diseases. While it has been suggested that different types of MERCS could exist in the cells depending on MERCS distance [56], it is not yet known if specific tethers are involved in specialized MERCS functions or whether MERCS are homogeneous within a cell and mitochondria.
From our data, we can speculate that increased MERCS might be an early compensatory mechanism to offset changes in cellular environment and increase ATP production. This hypothesis is in accordance with a recent study showing that increasing ER to mitochondria apposition restores climbing ability and increase lifespan in Aβ42 overexpressing flies [57]. On the other hand, sustained increase in MERCS can have deleterious effects for the cell, eventually leading to apoptosis [58]. It is interesting to note that in our model under basal conditions, no changes were seen in apoptotic nor necrotic assays. However, upon triggering mitochondrial stress through complex III inhibition, AppNL-F cultures showed increased LDH leakage and higher susceptibility to cell death. Increased retention of Ca2+ was detected in AppNL-F cells, suggesting that high levels of Ca2+ might promote mitochondrial matrix-overload and Ca2+-activated mitochondrial permeability transition pore opening [59]. Concordantly, a recent study has shown that impaired mitochondrial Ca2+-efflux contributes to disease progression, as neuronal deletion of the mitochondrial Na+/Ca2+ exchanger accelerated memory decline and increased amyloidosis in a 3xTg-AD mice [36]. Overall, these studies support the hypothesis that mitochondria and MERCS are affected in AD; however, whether these changes are beneficial or deleterious for the cell remains unanswered. Abrogation of Ca2+-shuttling should be tested to assert whether increased MERCS is detrimental for cellular homeostasis upon mitochondrial stress.
Synaptic terminals contain more active mitochondria than other cellular compartments, where they support presynaptic terminal functions by producing ATP and buffering Ca2+ [60]. Efficient mitochondrial transport along axonal microtubules is essential for recruiting and redistributing mitochondria at synaptic terminals [61]. Altered balance in mitochondrial fusion and fission in AD neurons interferes with mitochondrial motility, thereby hindering mitochondrial trafficking and distribution in synaptic terminals [62–64]. We have shown in this study that changes in mitochondria fusion protein Mfn2 and an increased number of mitochondria in AppNL-F cells could be an indication of impaired mitochondrial dynamics, as previously observed in this model [54]. Furthermore, Aβ-load impacts on presynaptic function by inhibiting mitochondrial anterograde movement in both Drosophila and mouse neurons [62, 65]. In accordance with these studies, we report an upregulation in stationary mitochondria and downregulation in anterograde transport towards peripheral areas of the cell. In primary neurons it is difficult to distinguish axons and neurons and therefore, based on the method used here, we refer to projections as neurites. This impairment in transport might prevent mitochondria from reaching synaptic terminals and lead to synaptic dysfunction. Indeed, we report substantial downregulation of synaptic protein synaptophysin, similarly to what has been shown in vivo [7]. Functionally, we unveiled a decrease in the frequency of mEPSCs and the decay time constant, indicating respectively a pre- and a post-synaptic impairment in AppNL-F cultures. In accordance with the reduction of presynaptic marker synaptophysin, a reduction in both the frequency and the decay time suggests a reduction of active synapses at the pre- and postsynaptic level. In fact, these observations might be the results of a decrease of post-synaptic glutamate transporters or impaired glutamate release. Interestingly, our results are in line with earlier reports, showing a decrease in the number of mushroom hippocampal spines (mature spines) in App NL-F cultures [66]. Similarly, pre- and post-synaptic morphological changes were observed in in a recently established A βPP knock-in rat model. This model displays the typical course of pathology seen in amyloid models as well as tau pathology, neuronal apoptosis and necroptosis, and brain atrophy, characteristics rarely seen in other A βPP models [67]. In a more severe AβPP knock-in model, the AppNL-G-F knock-in mice containing an extra mutation encoding for the Artic mutation, fast-spiking interneurons dynamics were impaired at pre amyloid stages of disease, suggesting that synaptic dysfunctions are pivotal characteristics in these models [68]. On the other hand, some studies have shown upregulation of pre-synaptic components in the early stages of pathology in knock in mice; however, impairment in vesicle release mechanism due to Aβ load was also reported [69]. Further investigations shall concentrate on which components of synaptic release mechanisms are affected and to pinpoint the pathways mediating this dysfunction.
In hippocampal AppNL-F primary cultures mushroom spine loss was observed due to dysregulation of synaptic Ca2+ signaling [66]. This is in line with the impaired Ca2+-handling capacity in mitochondria and increased ER to mitochondria Ca2+-signaling we report in this study, hence suggesting that Ca2+-dysfunction might be a triggering event in synaptic dysfunction in AppNL-F cells. A recent pre-print has shown that artificially increasing MERCS blocks mitochondrial movement in axons, resulting in deformed neuromuscular junctions [70]. Moreover, Ca2+-oscillations are known to regulate mitochondrial trafficking through Miro1, which has been recently described to be located at MERCS [71, 72]. Whether impairment in synaptic terminals and mitochondrial movement are due to increased MERCS apposition in the AppNL-F model remains to be explored. This data further supports the idea that both mitochondrial movement and synaptic dysfunction play an early pathogenic role in AD, and that these events occur prior to plaque formation, likely due to intracellular and extracellular soluble and oligomeric Aβ species.
While the AppNL-F model is a reliable murine model of AD, it presents some limitations. These animals do not exhibit tau pathology nor neurodegeneration, hence they can only recapitulate amyloid-dependent pathways of AD. Furthermore, the anatomy and genetics of the brain in rodents differ significantly from that of the human [73], which might account for some of the failures observed in clinical trials for AD. The use of human induced pluripotent stem cells (iPSCs) is a promising alternative to using murine models, that aims to better mimic human pathophysiology. Several aspects of mitochondrial dysfunction have been recapitulated in iPSCs neurons derived from AD patients. Sporadic AD iPSCs neurons display upregulated expression of oxidative stress response genes [74], while familial APP V717 L iPSCs neurons show impaired mitochondrial homeostasis, increased mitochondrial fragmentation and decreased ATP levels concomitantly with reduced OCR [75]. MERCS dysfunction has been observed in fibroblasts derived from familial AD patients [29, 41] and AD postmortem brains [44]; however, studies using iPSCs derived neurons from AD patients are lacking. Using these neuronal models will give fundamental information to understand MERCS dynamics in human derived neurons.
Conclusions
Presently only symptomatic therapies are available to AD patients. These drugs do not alter the progression of the disease, meaning the condition ultimately results in worsening of life quality for patients and their families. This limitation is due to our lack of knowledge of this multifactorial disorder and usage of models that do not appropriately mimic the disease. AppNL-F cultures allow for detection of early changes in the amyloid cascade which is fundamental for discovery of cellular pathways that can be tackled pharmacologically. In this model we have found bioenergetics changes and increased susceptibility to mitochondrial stress, increased MERCS, impairment in mitochondrial movement and impaired pre and postsynaptic activity which suggests that these pathogenic changes might be observed early in AD pathogenesis. This study suggests that early pathogenic changes could be assessed thoroughly for preclinical drug testing in AppNL-F neurons and shows that a variety of mitochondria related parameters are altered in vitro.
ACKNOWLEDGMENTS
This study was funded by the European Union’s Horizon 2020 research and innovation programme under the Marie Skłodowska-Curie grant agreement No. 676,144 (Synaptic Dysfunction in Alzheimer Disease, SyDAD), The Swedish Brain Foundation (Hjärnfonden, No FO2019–0145), The Swedish Research Council (No 2018–03102), the Swedish Alzheimer Foundation (Alzheimerfonden), Gamla Tjänarinnor Foundation and Gun och Bertil Stohnes Foundation. L.N. is funded by the Strategic Research Program in Neuroscience (StratNeuro) funding for postdoctoral researchers at Karolinska Institutet and Alzheimerfonden (No AF-940133).
Authors’ disclosures available online (https://www.j-alz.com/manuscript-disclosures/22-0383r2).
SUPPLEMENTARY MATERIAL
[1] The supplementary material is available in the electronic version of this article: https://dx.doi.org/10.3233/JAD-220383.
REFERENCES
[1] | Hardy J , Allsop D ((1991) ) Amyloid deposition as the central event in the aetiology of Alzheimer’s disease. Trends Pharmacol Sci 12: , 383–388. |
[2] | Kametani F , Hasegawa M ((2018) ) Reconsideration of amyloid hypothesis and tau hypothesis in Alzheimer’s disease. Front Neurosci 12: , 25–25. |
[3] | Selkoe DJ , Hardy J ((2016) ) The amyloid hypothesis of Alzheimer’s disease at 25 years. EMBO Mol Med 8: , 595–608. |
[4] | LaFerla FM , Green KN ((2012) ) Animal models of Alzheimer disease. Cold Spring Harb Perspect Med 2: , a006320. |
[5] | Saito T , Matsuba Y , Yamazaki N , Hashimoto S , Saido TC ((2016) ) Calpain activation in Alzheimer’s model mice is an artifact of APP and presenilin overexpression. J Neurosci 36: , 9933. |
[6] | Hashimoto S , Ishii A , Kamano N , Watamura N , Saito T , Ohshima T , Yokosuka M , Saido TC ((2018) ) Endoplasmic reticulum stress responses in mouse models of Alzheimer’s disease: Overexpression paradigm versus knockin paradigm. J Biol Chem 293: , 3118–3125. |
[7] | Saito T , Matsuba Y , Mihira N , Takano J , Nilsson P , Itohara S , Iwata N , Saido TC ((2014) ) Single App knock-in mouse models of Alzheimer’s disease. Nat Neurosci 17: , 661–663. |
[8] | Evrard C , Kienlen-Campard P , Coevoet M , Opsomer R , Tasiaux B , Melnyk P , Octave JN , Buee L , Sergeant N , Vingtdeux V ((2018) ) Contribution of the endosomal-lysosomal and proteasomal systems in amyloid-beta precursor protein derived fragments processing. Front Cell Neurosci 12: , 435. |
[9] | Tate BA , Mathews PM ((2006) ) Targeting the role of the endosome in the pathophysiology of Alzheimer’s disease: A strategy for treatment. Sci Aging Knowledge Environ 2006: , re2. |
[10] | Nilsson P , Saido TC ((2014) ) Dual roles for autophagy: Degradation and secretion of Alzheimer’s disease Abeta peptide. Bioessays 36: , 570–578. |
[11] | Zhang Z , Yang X , Song YQ , Tu J ((2021) ) Autophagy in Alzheimer’s disease pathogenesis: Therapeutic potential and future perspectives. Ageing Res Rev 72: , 101464. |
[12] | Baloyannis SJ , Costa V , Michmizos D ((2004) ) Mitochondrial alterations in Alzheimer’s disease. Am J Alzheimers Dis Other Demen 19: , 89–93. |
[13] | Mosconi L , Brys M , Switalski R , Mistur R , Glodzik L , Pirraglia E , Tsui W , De Santi S , de Leon MJ ((2007) ) Maternal family history of Alzheimer’s disease predisposes to reduced brain glucose metabolism. Proc Natl Acad Sci U S A 104: , 19067–19072. |
[14] | Murray J , Tsui WH , Li Y , McHugh P , Williams S , Cummings M , Pirraglia E , Solnes L , Osorio R , Glodzik L , Vallabhajosula S , Drzezga A , Minoshima S , de Leon MJ , Mosconi L ((2014) ) FDG and amyloid PET in cognitively normal individuals at risk for late-onset Alzheimer’s disease. Adv J Mol Imaging 4: , 15–26. |
[15] | Keil U , Bonert A , Marques CA , Scherping I , Weyermann J , Strosznajder JB , Muller-Spahn F , Haass C , Czech C , Pradier L , Muller WE , Eckert A ((2004) ) Amyloid beta-induced changes in nitric oxide production and mitochondrial activity lead to apoptosis. J Biol Chem 279: , 50310–50320. |
[16] | Hauptmann S , Scherping I , Dröse S , Brandt U , Schulz KL , Jendrach M , Leuner K , Eckert A , Müller WE ((2009) ) Mitochondrial dysfunction: An early event in Alzheimer pathology accumulates with age in AD transgenic mice. Neurobiol Aging 30: , 1574–1586. |
[17] | Rhein V , Song X , Wiesner A , Ittner LM , Baysang G , Meier F , Ozmen L , Bluethmann H , Dröse S , Brandt U , Savaskan E , Czech C , Götz J , Eckert A ((2009) ) Amyloid-β and tau synergistically impair the oxidative phosphorylation system in triple transgenic Alzheimer’s disease mice. Proc Natl Acad Sci U S A 106: , 20057–20062. |
[18] | Casley CS , Canevari L , Land JM , Clark JB , Sharpe MA ((2002) ) Beta-amyloid inhibits integrated mitochondrial respiration and key enzyme activities. J Neurochem 80: , 91–100. |
[19] | Rowland AA , Voeltz GK ((2012) ) Endoplasmic reticulum–mitochondria contacts: Function of the junction. Nat Rev Mol Cell Biol 13: , 607–615. |
[20] | Rizzuto R , Pinton P , Carrington W , Fay FS , Fogarty KE , Lifshitz LM , Tuft RA , Pozzan T ((1998) ) Close contacts with the endoplasmic reticulum as determinants of mitochondrial Ca2+ responses. Science 280: , 1763–1766. |
[21] | Jouaville LS , Pinton P , Bastianutto C , Rutter GA , Rizzuto R ((1999) ) Regulation of mitochondrial ATP synthesis by calcium: Evidence for a long-term metabolic priming. Proc Natl Acad Sci U S A 96: , 13807–13812. |
[22] | Cardenas C , Miller RA , Smith I , Bui T , Molgo J , Muller M , Vais H , Cheung KH , Yang J , Parker I , Thompson CB , Birnbaum MJ , Hallows KR , Foskett JK ((2010) ) Essential regulation of cell bioenergetics by constitutive InsP3 receptor Ca2+transfer to mitochondria. Cell 142: , 270–283. |
[23] | Vance JE ((1990) ) Phospholipid-synthesis in a membrane-fraction associated with mitochondria. J Biol Chem 265: , 7248–7256. |
[24] | Vance JE ((1991) ) Newly made phosphatidylserine and phosphatidylethanolamine are preferentially translocated between rat-liver mitochondria and endoplasmic-reticulum. J Biol Chem 266: , 89–97. |
[25] | Iwasawa R , Mahul-Mellier AL , Datler C , Pazarentzos E , Grimm S ((2011) ) Fis1 and Bap31 bridge the mitochondria-ER interface to establish a platform for apoptosis induction. EMBO J 30: , 556–568. |
[26] | Friedman JR , Lackner LL , West M , DiBenedetto JR , Nunnari J , Voeltz GK ((2011) ) ER tubules mark sites of mitochondrial division. Science 334: , 358–362. |
[27] | Hamasaki M , Furuta N , Matsuda A , Nezu A , Yamamoto A , Fujita N , Oomori H , Noda T , Haraguchi T , Hiraoka Y , Amano A , Yoshimori T ((2013) ) Autophagosomes form at ER-mitochondria contact sites. Nature 495: , 389–393. |
[28] | Zhou R , Yazdi AS , Menu P , Tschopp J ((2011) ) A role for mitochondria in NLRP3 inflammasome activation. Nature 469: , 221–225. |
[29] | Hedskog L , Pinho CM , Filadi R , Ronnback A , Hertwig L , Wiehager B , Larssen P , Gellhaar S , Sandebring A , Westerlund M , Graff C , Winblad B , Galter D , Behbahani H , Pizzo P , Glaser E , Ankarcrona M ((2013) ) Modulation of the endoplasmic reticulum-mitochondria interface in Alzheimer’s disease and related models. Proc Natl Acad Sci U S A 110: , 7916–7921. |
[30] | Area-Gomez E , de Groof AJ , Boldogh I , Bird TD , Gibson GE , Koehler CM , Yu WH , Duff KE , Yaffe MP , Pon LA , Schon EA ((2009) ) Presenilins are enriched in endoplasmic reticulum membranes associated with mitochondria. Am J Pathol 175: , 1810–1816. |
[31] | Del Prete D , Suski JM , Oules B , Debayle D , Gay AS , Lacas-Gervais S , Bussiere R , Bauer C , Pinton P , Paterlini-Brechot P , Wieckowski MR , Checler F , Chami M ((2017) ) Localization and processing of the amyloid-beta protein precursor in mitochondria-associated membranes. J Alzheimers Dis 55: , 1549–1570. |
[32] | Leal NS , Dentoni G , Schreiner B , Naia L , Piras A , Graff C , Cattaneo A , Meli G , Hamasaki M , Nilsson P , Ankarcrona M ((2020) ) Amyloid β-peptide increases mitochondria-endoplasmic reticulum contact altering mitochondrial function and autophagosome formation in Alzheimer’s disease-related models. Cells 9: , 2552. |
[33] | Schreiner B , Hedskog L , Wiehager B , Ankarcrona M ((2015) ) Amyloid-beta peptides are generated in mitochondria-associated endoplasmic reticulum membranes. J Alzheimers Dis 43: , 369–374. |
[34] | Gomez-Suaga P , Paillusson S , Stoica R , Noble W , Hanger DP , Miller CCJ ((2017) ) The ER-mitochondria tethering complex VAPB-PTPIP51 regulates autophagy. Curr Biol 27: , 371–385. |
[35] | Haass C , Kaether C , Thinakaran G , Sisodia S ((2012) ) Trafficking and proteolytic processing of APP. Cold Spring Harb Perspect Med 2: , a006270. |
[36] | Jadiya P , Kolmetzky DW , Tomar D , Di Meco A , Lombardi AA , Lambert JP , Luongo TS , Ludtmann MH , Praticò D , Elrod JW ((2019) ) Impaired mitochondrial calcium efflux contributes to disease progression in models of Alzheimer’s disease. Nat Commun 10: , 3885. |
[37] | Citron M , Oltersdorf T , Haass C , McConlogue L , Hung AY , Seubert P , Vigo-Pelfrey C , Lieberburg I , Selkoe DJ ((1992) ) Mutation of the β-amyloid precursor protein in familial Alzheimer’s disease increases β-protein production. Nature 360: , 672–674. |
[38] | Baloyannis SI , Baloyannis SI ((2004) ) Mitochondrial alterations in Alzheimer’s disease. Neurobiol Aging 25: , S405–S406. |
[39] | Booth DM , Enyedi B , Geiszt M , Varnai P , Hajnoczky G ((2016) ) Redox nanodomains are induced by and control calcium signaling at the ER-mitochondrial interface. Mol Cell 63: , 240–248. |
[40] | Murphy S , Martin S , Parton RG ((2009) ) Lipid droplet-organelle interactions; sharing the fats. Biochim Biophys Acta 1791: , 441–447. |
[41] | Area-Gomez E , Del Carmen Lara Castillo M , Tambini MD , Guardia-Laguarta C , de Groof AJ , Madra M , Ikenouchi J , Umeda M , Bird TD , Sturley SL , Schon EA ((2012) ) Upregulated function of mitochondria-associated ER membranes in Alzheimer disease. EMBO J 31: , 4106–4123. |
[42] | Leal NS , Schreiner B , Pinho CM , Filadi R , Wiehager B , Karlstrom H , Pizzo P , Ankarcrona M ((2016) ) Mitofusin-2 knockdown increases ER-mitochondria contact and decreases amyloid beta-peptide production. J Cell Mol Med 20: , 1686–1695. |
[43] | Filadi R , Greotti E , Turacchio G , Luini A , Pozzan T , Pizzo P ((2015) ) Mitofusin 2 ablation increases endoplasmic reticulum-mitochondria coupling. , E. Proc Natl Acad Sci U S A 112: , 2174–2181. |
[44] | Lau DHW , Paillusson S , Hartopp N , Rupawala H , Mórotz GM , Gomez-Suaga P , Greig J , Troakes C , Noble W , Miller CCJ ((2020) ) Disruption of endoplasmic reticulum-mitochondria tethering proteins in post-mortem Alzheimer’s disease brain. Neurobiol Dis 143: , 105020. |
[45] | Selkoe DJ ((2002) ) Alzheimer’s disease is a synaptic failure. Science 298: , 789–791. |
[46] | Tanaka Y , Kanai Y , Okada Y , Nonaka S , Takeda S , Harada A , Hirokawa N ((1998) ) Targeted disruption of mouse conventional kinesin heavy chain, kif5B, results in abnormal perinuclear clustering of mitochondria. Cell 93: , 1147–1158. |
[47] | MacAskill AF , Brickley K , Stephenson FA , Kittler JT ((2009) ) GTPase dependent recruitment of Grif-1 by Miro1 regulates mitochondrial trafficking in hippocampal neurons. Mol Cell Neurosci 40: , 301–312. |
[48] | Brickley K , Stephenson FA ((2011) ) Trafficking kinesin protein (TRAK)-mediated transport of mitochondria in axons of hippocampal neurons. J Biol Chem 286: , 18079–18092. |
[49] | Elder GA , Gama Sosa MA , De Gasperi R ((2010) ) Transgenic mouse models of Alzheimer’s disease. Mt Sinai J Med 77: , 69–81. |
[50] | Sasaguri H , Nilsson P , Hashimoto S , Nagata K , Saito T , De Strooper B , Hardy J , Vassar R , Winblad B , Saido TC ((2017) ) APP mouse models for Alzheimer’s disease preclinical studies. EMBO J 36: , 2473–2487. |
[51] | Baglietto-Vargas D , Forner S , Cai L , Martini AC , Trujillo-Estrada L , Swarup V , Nguyen MMT , Do Huynh K , Javonillo DI , Tran KM , Phan J , Jiang S , Kramar EA , Nuñez-Diaz C , Balderrama-Gutierrez G , Garcia F , Childs J , Rodriguez-Ortiz CJ , Garcia-Leon JA , Kitazawa M , Shahnawaz M , Matheos DP , Ma X , Da Cunha C , Walls KC , Ager RR , Soto C , Gutierrez A , Moreno-Gonzalez I , Mortazavi A , Tenner AJ , MacGregor GR , Wood M , Green KN , LaFerla FM ((2021) ) Generation of a humanized Aβ expressing mouse demonstrating aspects of Alzheimer’s disease-like pathology. Nat Commun 12: , 2421. |
[52] | Lauritzen I , Pardossi-Piquard R , Bourgeois A , Pagnotta S , Biferi M-G , Barkats M , Lacor P , Klein W , Bauer C , Checler F ((2016) ) Intraneuronal aggregation of the β-CTF fragment of APP (C99) induces Aβ-independent lysosomal-autophagic pathology. Acta Neuropathol 132: , 257–276. |
[53] | Wang X , Wang W , Li L , Perry G , Lee HG , Zhu X ((2014) ) Oxidative stress and mitochondrial dysfunction in Alzheimer’s disease. Biochim Biophys Acta 1842: , 1240–1247. |
[54] | Leal NS , Dentoni G , Schreiner B , Naia L , Piras A , Graff C , Cattaneo A , Meli G , Hamasaki M , Nilsson P , Ankarcrona M ((2020) ) Amyloid β-peptide increases mitochondria-endoplasmic reticulum contact altering mitochondrial function and autophagosome formation in Alzheimer’s disease-related models. Cells 9: , 2552. |
[55] | Mastroeni D , Khdour OM , Delvaux E , Nolz J , Olsen G , Berchtold N , Cotman C , Hecht SM , Coleman PD ((2017) ) Nuclear but not mitochondrial-encoded oxidative phosphorylation genes are altered in aging, mild cognitive impairment, and Alzheimer’s disease. Alzheimers Dement 13: , 510–519. |
[56] | Giacomello M , Pellegrini L ((2016) ) The coming of age of the mitochondria-ER contact: A matter of thickness. Cell Death Diff 23: , 1417–1427. |
[57] | Garrido-Maraver J , Loh SHY , Martins LM ((2020) ) Forcing contacts between mitochondria and the endoplasmic reticulum extends lifespan in a Drosophila model of Alzheimer’s disease. Biol Open 9: , bio047530. |
[58] | Csordas G , Renken C , Varnai P , Walter L , Weaver D , Buttle KF , Balla T , Mannella CA , Hajnoczky G ((2006) ) Structural and functional features and significance of the physical linkage between ER and mitochondria. J Cell Biol 174: , 915–921. |
[59] | Baumgartner HK , Gerasimenko JV , Thorne C , Ferdek P , Pozzan T , Tepikin AV , Petersen OH , Sutton R , Watson AJM , Gerasimenko OV ((2009) ) Calcium elevation in mitochondria is the main Ca2+ requirement formitochondrial permeability transition pore (mPTP) opening. JBiol Chem 284: , 20796–20803. |
[60] | Attwell D , Laughlin SB ((2001) ) An energy budget for signaling in the grey matter of the brain. J Cereb Blood Flow Metab 21: , 1133–1145. |
[61] | Kang J-S , Tian J-H , Pan P-Y , Zald P , Li C , Deng C , Sheng Z-H ((2008) ) Docking of axonal mitochondria by syntaphilin controls their mobility and affects short-term facilitation. Cell 132: , 137–148. |
[62] | Calkins MJ , Manczak M , Mao P , Shirendeb U , Reddy PH ((2011) ) Impaired mitochondrial biogenesis, defective axonal transport of mitochondria, abnormal mitochondrial dynamics and synaptic degeneration in a mouse model of Alzheimer’s disease. Hum Mol Genet 20: , 4515–4529. |
[63] | Manczak M , Calkins MJ , Reddy PH ((2011) ) Impaired mitochondrial dynamics and abnormal interaction of amyloid beta with mitochondrial protein Drp1 in neurons from patients with Alzheimer’s disease: Implications for neuronal damage. Hum Mol Genet 20: , 2495–2509. |
[64] | Kandimalla R , Reddy PH ((2016) ) Multiple faces of dynamin-related protein 1 and its role in Alzheimer’s disease pathogenesis. Biochim Biophys Acta 1862: , 814–828. |
[65] | Wang X , Su B , Lee HG , Li X , Perry G , Smith MA , Zhu X ((2009) ) Impaired balance of mitochondrial fission and fusion in Alzheimer’s disease. J Neurosci 29: , 9090–9103. |
[66] | Zhang H , Wu L , Pchitskaya E , Zakharova O , Saito T , Saido T , Bezprozvanny I ((2015) ) Neuronal store-operated calcium entry and mushroom spine loss in amyloid precursor protein knock-in mouse model of Alzheimer’s disease. J Neurosci 35: , 13275–13286. |
[67] | Pang K , Jiang R , Zhang W , Yang Z , Li L-L , Shimozawa M , Tambaro S , Mayer J , Zhang B , Li M , Wang J , Liu H , Yang A , Chen X , Liu J , Winblad B , Han H , Jiang T , Wang W , Nilsson P , Guo W , Lu B ((2022) ) An App knock-in rat model for Alzheimer’s disease exhibiting Aβ and tau pathologies, neuronal death and cognitive impairments. Cell Res 32: , 157–175. |
[68] | Arroyo-García LE , Isla AG , Andrade-Talavera Y , Balleza-Tapia H , Loera-Valencia R , Alvarez-Jimenez L , Pizzirusso G , Tambaro S , Nilsson P , Fisahn A ((2021) ) Impaired spike-gamma coupling of area CA3fast-spiking interneurons as the earliest functional impairment inthe AppNL-G-F mouse model of Alzheimer’s disease. MolPsychiatry 26: , 5557–5567. |
[69] | Hark TJ , Rao NR , Castillon C , Basta T , Smukowski S , Bao H , Upadhyay A , Bomba-Warczak E , Nomura T , O’Toole ET , Morgan GP , Ali L , Saito T , Guillermier C , Saido TC , Steinhauser ML , Stowell MHB , Chapman ER , Contractor A , Savas JN ((2021) ) Pulse-chase proteomics of the App knockin mouse models of Alzheimer’s disease reveals that synaptic dysfunction originates in presynaptic terminals. Cell Syst 12: , 141–158.e149. |
[70] | Hewitt VL , Miller-Fleming L , Andreazza S , Mattedi F , Prudent J , Polleux F , Vagnoni A , Whitworth AJ (2020) Decreasing pdzd8-mediated mitochondrial-ER contacts in neurons improves fitness by increasing mitophagy. bioRxiv, 2020.2011.2014.382861. |
[71] | Modi S , López-Domenech G , Halff EF , Covill-Cooke C , Ivankovic D , Melandri D , Arancibia-Carcamo IL , Burden JJ , Lowe AR , Kittler JT ((2019) ) Miro clusters regulate ER-mitochondria contact sites and link cristae organization to the mitochondrial transport machinery. Nat Commun 10: , 4399–4399. |
[72] | Yi M , Weaver D , Hajnóczky G ((2004) ) Control of mitochondrial motility and distribution by the calcium signal: A homeostatic circuit. J Cell Biol 167: , 661–672. |
[73] | Sullivan SE , Young-Pearse TL ((2017) ) Induced pluripotent stem cells as a discovery tool for Alzheimer’s disease. Brain Res 1656: , 98–106. |
[74] | Hossini AM , Megges M , Prigione A , Lichtner B , Toliat MR , Wruck W , Schröter F , Nuernberg P , Kroll H , Makrantonaki E , Zoubouliss CC , Adjaye J ((2015) ) Induced pluripotent stem cell-derived neuronal cells from a sporadic Alzheimer’s disease donor as a model for investigating AD-associated gene regulatory networks. BMC Genomics 16: , 84. |
[75] | Fang EF , Hou Y , Palikaras K , Adriaanse BA , Kerr JS , Yang B , Lautrup S , Hasan-Olive MM , Caponio D , Dan X , Rocktäschel P , Croteau DL , Akbari M , Greig NH , Fladby T , Nilsen H , Cader MZ , Mattson MP , Tavernarakis N , Bohr VA ((2019) ) Mitophagy inhibits amyloid-β and tau pathology and reverses cognitive deficits in models of Alzheimer’s disease. Nat Neurosci 22: , 401–412. |

