
Phosphatidylethanolamine Binding Protein 1 (PEBP1) in Alzheimer’s Disease: ELISA Development and Clinical Validation
Abstract
Background:
Phosphatidylethanolamine binding protein 1 (PEBP1) is a multifunctional protein, mainly known for its specific binding of phosphatidylethanolamine and the ability to suppress the Raf1-MAPK pathway. Its potential role as an Alzheimer’s disease (AD) biomarker has been proposed in several studies. However, evaluation of its discriminative value in clinical cohorts is missing.
Objective:
We aimed to develop a new immunoassay for the measurement of PEBP1 in cerebrospinal fluid (CSF) and assess the possible role of this protein as AD biomarker.
Methods:
We developed a sandwich enzyme-linked immunosorbent assay (ELISA) for detection of PEBP1 in CSF and performed a technical and a clinical validation on two well-characterized cohorts. The first cohort included 14 mild cognitive impairment due to AD (MCI-AD) and 11 other neurological diseases (OND) patients. The second, larger cohort, included 25 MCI-AD, 29 AD dementia (AD-dem), and 21 OND patients.
Results:
PEBP1 is highly sensitive to pre-analytical conditions, especially to prolonged storage at room temperature or 4°C. Analysis of the first cohort showed a trend of an increase of PEBP1 level in MCI-AD patients versus OND subjects. Analysis of the second cohort did not show significant differences among diagnostic groups. Weak, positive correlation was found between CSF PEBP1 and t-tau, p-tau, and Aβ40 in the AD-dem group.
Conclusion:
A novel ELISA for the detection of PEBP1 in CSF was developed. Further research is needed to assess the potential of PEBP1 in AD diagnostics. The observed dependence of the PEBP1 signal on operating procedures encourages its potential application as CSF quality control.
INTRODUCTION
Alzheimer’s disease (AD) is a global problem, which affects a constantly growing part of the society and represents the most common cause of dementia, accounting for 60% to 80% of all the cases [1]. AD is a progressive neurodegenerative disease, characterized by the accumulation of extracellular amyloid plaques, intraneuronal neurofibrillary tangles, and brain atrophy caused by neuronal and synaptic/axonal degeneration [2]. It is currently well established that pathologic brain changes leading to the development of AD, start years before onset of the clinical symptoms [3, 4]. Nevertheless, AD is often diagnosed at the late stages of the disease, when neuronal damage reaches an advanced and not reversible phase. Considerable efforts have been made to better characterize the early phases of the disease (such as mild cognitive impairment, MCI), to understand where the window of opportunity for effective treatments lies [5].
Biomarkers implemented in a clinical practice include imaging and fluid biomarkers. Although accuracy offered by both types is similar [6], cerebrospinal fluid (CSF) biomarkers positivity precedes the abnormalities revealed by PET and MRI imaging [7]. Concurrently, the use of imaging biomarkers is limited by a significantly higher cost of a single test, as expensive radioactive tracers and specialized equipment are required. CSF AD biomarkers currently used in the clinical routine include amyloid-β peptides (Aβ42, Aβ40, and Aβ42/Aβ40 ratio), total tau (t-tau), and tau phosphorylated at threonine 181 (p-tau) [8]. An indisputable turning point in the field of AD diagnosis became the implementation of the AT(N) system, clearly defining three core features of the disease— brain amyloidosis, tauopathy, and neurodegeneration occurring over the disease progression [9].
While the specificity and sensitivity of the biomarkers already implemented in the clinical practice is high [10], these CSF biomarkers do not fully describe the complexity of AD pathology. Impairment of other pathways, like those involving inflammation processes or synaptic dysfunction, is proposed to play a crucial role in the disease onset and progression [11, 12]. Establishment of novel biomarkers, enabling the detection of pathological changes related to these pathways, would significantly support the diagnostic process, allowing for an earlier diagnosis, precise disease staging, and targeted therapeutic approaches [13]. Principles of the AT(N) system presume its flexibility, leaving the door open for new biomarkers, both fitting into existing categories as well as defining new ones [9].
The urgent need to discover novel AD biomarkers to be integrated in a diagnostic panel together with the core AD biomarkers, is one of the aims of the MIRIADE project (Multi-omics Interdisciplinary Research Integration to Address Dementia diagnosis), the Marie Curie training network that includes several academic and private partners (Mavrina et al., unpublished data).
Within the consortium an integrated dataset of candidate biomarkers for dementia disorders was produced through the combination of several omics data sources. In this work, we focused on a single candidate for AD coming from the bioinformatic analysis of the MIRIADE integrated dataset, the phosphatidylethanolamine binding protein 1 (PEBP1). PEBP1, also known as the Raf kinase inhibitor protein (RKIP1) or hippocampus cholinergic neurostimulatory peptide precursor protein (HCNPpp), is a 21 kDa protein which acts as a precursor of hippocampus cholinergic neurostimulatory peptide (HCNP) [14, 15]. Physiological presence of PEBP1 in CSF has been confirmed by mass spectrometry studies [16]. Changes in PEBP1 level were observed in human brain tissue [17] as well as in CSF of AD patients [18, 19]. Additionally, potential connection of PEBP1 with various dementias was reported in animal studies [15, 20].
Based on this evidence, we developed a sandwich enzyme-linked immunosorbent assay (ELISA) for detection of PEBP1 in CSF. We also evaluated preanalytical factors influencing PEBP1 measurement in CSF. Subsequently, the diagnostic performance of the CSF PEBP1 ELISA was evaluated on well-defined cohorts of AD dementia (AD-dem), MCI due to AD (MCI-AD) patients, and control subjects.
MATERIALS AND METHODS
Selection of candidate AD biomarker
The list of dementia biomarker candidates available within the MIRIADE consortium was thoroughly analyzed by means of bioinformatic online tools such as UniProt [14], CSF Proteome Resource [16], Human Protein Atlas [21], STRING [22], and Reactome [23]. A holistic process leading to selection of PEBP1 as candidate AD biomarker is described in detail by (Mavrina et al., unpublished data).
Human CSF samples
All the CSF samples used in this study were collected and biobanked at the Section of Neurology, Department of Medicine and Surgery, University of Perugia (Perugia, Italy).
CSF samples were collected following the same standard operating procedures (SOP) throughout the study and international guidelines [24]. LP was performed between 8:00 and 10:00 a.m. CSF was collected into sterile polypropylene tubes and centrifuged for 10 min at 2000× g (RT). 0.5 mL aliquots (72.730.007, Sarstedt, Germany) were immediately frozen at –80°C pending analysis. Demographic and clinical data of each patient were confidentially stored in an online electronic database.
All patients and neurological controls underwent a comprehensive clinical and neuropsychological evaluation. Diagnosis of AD was made according to the NIA-AA criteria [9] and supported by the analysis of core CSF AD biomarkers (Aβ42, Aβ40, Aβ42/Aβ40 ratio, t-tau, p-tau) measured with the Lumipulse® G600II (Fujirebio, Japan). According to their cognitive performance and to the Clinical Dementia Rate (CDR) scale, patients were stratified in MCI-AD (0.5≤CDR < 1.0) or AD-dem (CDR ≥1.0) groups. Patients qualified as OND (other neurological disorders) were adult patients, diagnosed with minor neurological diseases, other than inflammatory or degenerative disease of the CNS or of the peripheral nervous system. Only properly stored and unthawed CSF aliquots were used for the analysis.
Two CSF pools were generated as unified testing material for the assay development. One pool consisted of selected CSF samples collected from AD patients at the stage of dementia (“CSF AD pool”). The other pool (“CSF Control pool”) consisted of CSF samples collected from patients cognitively intact, but affected by neurological, not neurodegenerative disorders (i.e., headache, peripheral neuropathy, etc.), showing no cognitive impairment after at least a 2-year follow-up.
For the clinical validation, CSF samples collected between 2016 and 2021 were selected from the CSF Biobank (age, gender, and the CSF levels of the classical AD biomarkers of the patients included in the selected cohorts are reported in the Supplementary Table 1).
The study was approved by the local Ethical Committees; written informed consent was obtained from all the subjects included in this study. All the procedures were performed following the Helsinki Declaration.
Antibody testing by immunoblot
The ability of three human anti-PEBP1 antibodies (sc-376925, monoclonal, mouse, Santa Cruz Biotechnology, USA; 372100 monoclonal, mouse, Invitrogen, USA; HPA063904, polyclonal, rabbit, Sigma-Aldrich, USA) to detect the target protein was tested by western blot (WB) on different matrices (i.e., neat and 5x-concentrated CSF pools, human brain homogenate, and human recombinant PEBP1).
Part of each pool described above, underwent 5x concentration with use of the Vivaspin® (Sartorius, Germany) filter (4 mL, 5 kDa). The total protein concentration of neat and concentrated CSF pools was estimated based on the Bradford assay.
A human brain homogenate sample (HBH) of an AD patient (frontal lobe) [25] was resuspended in 1:5 weight/volume ratio with RIPA lysis buffer. The sample underwent a manual homogenization and then, sonication (3×15 s). The sample was incubated on ice for 30 min and then centrifuged for 10 min at 16,000× g. Supernatant was collected and the total protein concentration was measured by the Bradford assay.
Finally, 100 ng human recombinant protein PEBP1 (AR09265PU-N, OriGene, USA) was prepared by diluting it in 20 mM Tris-HCl (pH 8), 150 mM NaCl.
For each anti-PEBP1 antibody (sc-376925/372100/HPA063904) the WB experiment was performed separately. A 12% polyacrylamide gel was prepared and CSF samples, HBH and recombinant protein samples were run in reducing conditions. The samples were transferred from the gel to a nitrocellulose blotting membrane (SF110B, Himedia, India). The quality of the transfer was evaluated by a reversible Ponceau S staining. The membrane was blocked and subsequently probed overnight at 4°C (shaker) with the selected primary antibodies (sc-376925/372100/HPA063904, 1:1000) diluted in 5% bovine serum albumin (BSA), 0.02% NaN3 in Tris-buffered saline with 0.1% Tween®20 (Sigma-Aldrich, USA) (TBST) with addition of a phenol red as a pH indicator. After the incubation, the membrane was washed with TBST and the secondary antibodies diluted 1:5000 in a blocking buffer were applied for 1 h at RT. Depending on the used primary antibodies, goat anti-mouse (170–6516, Bio-Rad, USA) (for sc-376925 and 372100) or goat anti-rabbit IgG-HRP (170–6515, Bio-Rad, USA) (for HPA063904) were added. Signal development was performed with use of the enhanced chemiluminescence (ECL) solution (SuperSignaltrademark West Pico Plus, ThermoFisher Scientifictrademark, USA) and the radiographic film (Amershamtrademark Hyperfilmtrademark, GEhealthcare, USA).
For each anti-PEBP1 antibody (sc-376925/372100/HPA063904), dot blot analysis was performed to evaluate the potential unspecific binding of human serum albumin (HSA), the most abundant CSF protein. Four types of samples, 50 ng of PEBP1 recombinant protein (AR09265PU-N), 50 ng HSA, 100 ng HSA, and blank (Phosphate-buffered saline, PBS), were applied on the nitrocellulose membrane. The membrane was left for drying and then blocked with 5% milk powder in TBST. The membrane was incubated with the selected primary antibodies (sc-376925/372100/HPA063904, 1:1000) for 1 h at RT. After the incubation with the appropriate secondary antibodies (170–6516/170–6515, Bio-Rad 1:5000 in the blocking buffer), the signal was developed on the radiographic film with use of the ECL solution.
PEBP1 sandwich ELISA development
The ELISA assay was developed and validated following recommendations provided by [26, 27].
In addition to the WB experiments, evaluating performance of the antibodies in reducing conditions, all the antibodies were tested for the ability to recognize PEBP1 in native conditions. To perform this test, PEBP1 recombinant protein (AR09265PU-N) was coated in 96-wells plate (655061, Microlon®, high binding, Greiner Bio-One, Austria) at final concentration of 2μg/mL and 0.2μg/mL.
Six different antibody pairs were tested as the capture and detection antibody (see Supplementary Table 2). The best concentration of both capture and detection antibody was estimated by testing range of different concentrations of each antibody (2μg/mL, 1μg/mL, and 0.5μg/mL) and by comparison of the obtained signal-to-noise ratio.
To improve the performance of the assay, we compared signal obtained with use of PBS-based versus TBS-based buffers as well as different blocking buffers (1% milk powder, 3% milk powder, 1% BSA, 3% BSA). To decrease the background signal, we tested assay diluents and blocking buffers prepared with use of three different BSA reagents (03117332001, Roche, Switzerland, A9647-100G, Sigma-Aldrich, USA, P6154-100GR, Biowest, France). Diverse sample incubation times, various concentrations of the secondary antibody (goat anti-mouse-HRP, Bio-Rad, 170–6516), as well as addition of a detergent (Tween®20) were tested for the ability to increase the CSF signal.
PEBP1 ELISA protocol
The polyclonal rabbit HPA063904 antibody was selected as the most suitable capture antibody. The 96-wells plate was coated with the capture antibody at the final concentration of 1μg/mL (100μL/well) in a 100 mM bicarbonate buffer, pH 9.5, overnight, at 23°C. Empty wells, not predestined for the further use, were coated with 100μL of the 100 mM bicarbonate buffer, pH 9.5. The plate was sealed and incubated overnight at 23°C.
After the overnight incubation, the plate underwent a single wash with 300μL of an in-house prepared PBS buffer, pH 7.4 and subsequently was blocked with 1% BSA-PBS (BSA –Roche, 03117332001) for 1.5 h at 23°C. After blocking, the plate was washed three times with 300μL of PBST buffer (PBS with 0.05% Tween®20). The 7-point standard curve, ranging from 100 ng/mL to 1.56 ng/mL was prepared by diluting the human PEBP1 recombinant protein in 0.1% BSA-PBS-0.05% Tween®20 (see Supplementary Table 3). Blank sample consisted of 0.1% BSA-PBS-0.05% Tween®20. Undiluted CSF samples, standard curve dilutions, and blank were added to the plate (100μL/well) and underwent 2 h incubation at 23°C and 400 rpm. Subsequently, the samples were removed, and all the wells were washed three times with 300μL of PBST buffer. 100μL of the detection antibody sc-376925 at the final concentration of 1μg/mL was added to each well and underwent 1 h incubation at 23°C and 400 rpm. After the incubation, the wells were washed three times with 300μL of PBST buffer. Goat anti-mouse-HRP antibody (Bio-Rad, 170–6516) diluted 1:3000 in 0.1% BSA-PBS-0.05% Tween®20 was added to each well (100μL/well) and the plate was incubated for 1 h at 23°C and 400 rpm. Finally, the plate was washed four times with 300μL of PBST buffer and 100μL of tetramethylbenzidine (TMB; T2885, Sigma-Aldrich, USA) solution was added to each well and incubated for 10 min at 23°C and 400 rpm in the dark.
The reaction was stopped by addition of 100μL of 1 M H2SO4 to each well. The plate was briefly mixed on the shaker for approximately 1 min and the optical density (OD) was read at 450 nm (reference wavelength 630 nm) in the Clariostar (BMG Labtech, Germany) plate reader. The 4-parameter logistic model was applied to generate a standard curve. Concentrations of CSF samples were interpolated based on the blank subtracted ODs related to the standard curve. Graphs were generated with use of the GraphPad Prism software (USA).
Technical validation of the developed assay
The ELISA assay underwent thorough technical validation. This consisted in the estimation of the assay range, intermediate precision (inter-assay reproducibility within the laboratory), repeatability (intra-assay), sensitivity (Lower Limit of Quantification, LLOQ; Upper Limit of Quantification, ULOQ), and sample stability (freeze-thaw, prolonged incubation at diverse conditions). Range of the standard curve was established, and the intra- and inter-assay variabilities were assessed based on % coefficient of variation (CV%) of the replicates. In order to monitor performance of the subsequent measurements, an internal control was included in each run.
Evaluation of the preanalytical factors influencing PEBP1 stability
A freeze-thaw experiment was conducted using five consecutively collected CSF samples. Each sample was divided into four 250μl aliquots. One aliquot of each freshly collected sample was immediately stored at –80°C pending analysis, while remaining aliquots of each sample underwent 2, 3, or 4 freeze (30 min at –80°C) and thaw (30 min at RT) cycles. Subsequently, all the samples were measured by the developed ELISA assay.
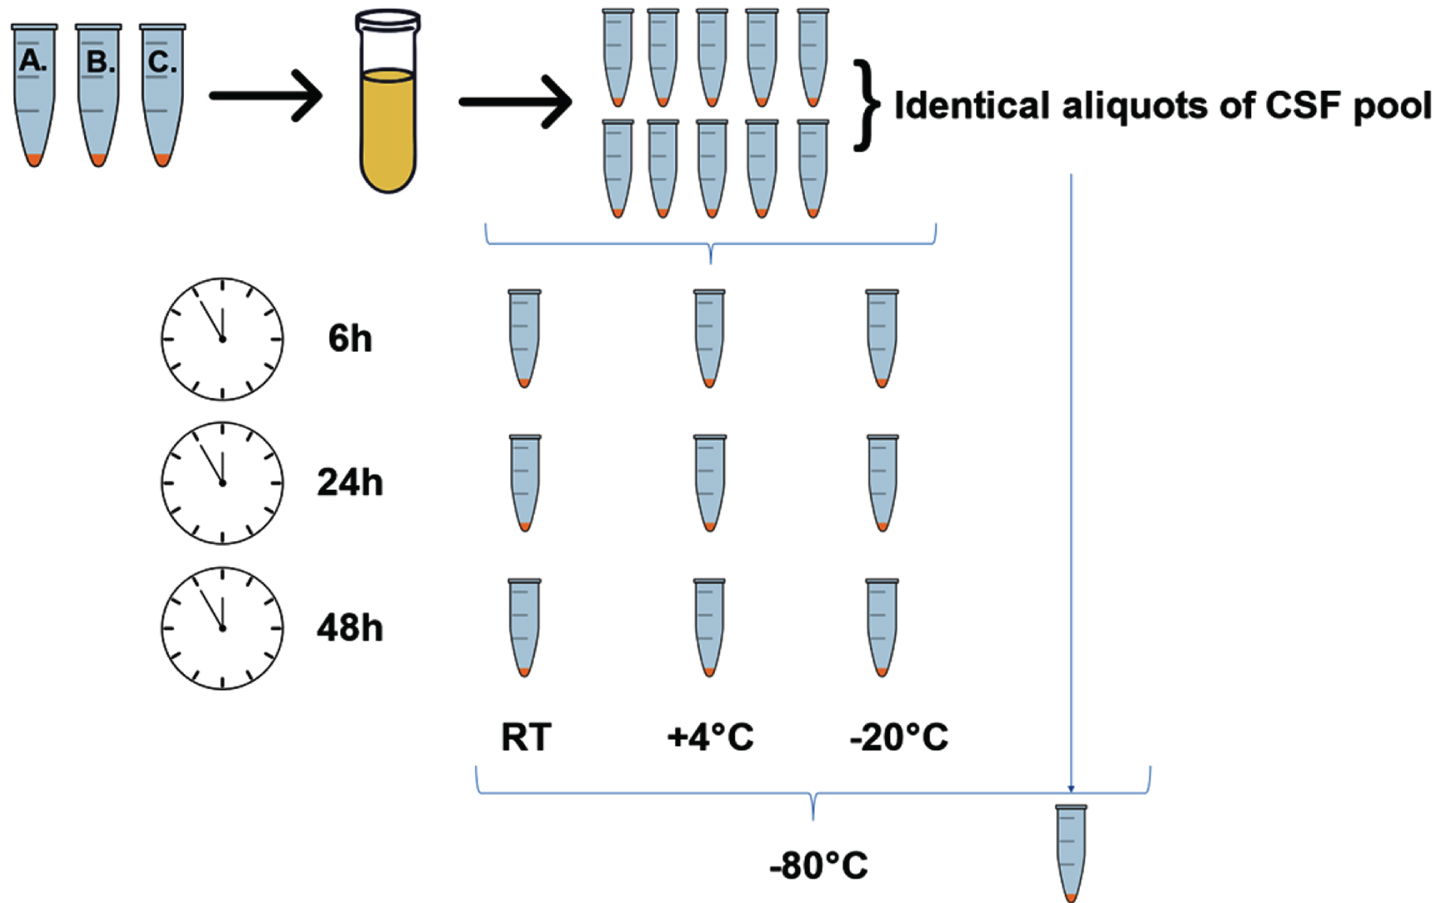
Sample stability was controlled in a dedicated experiment, employing a CSF pool generated from three individual patients’ samples. CSF pool was divided into ten identical 250μl aliquots. One of the aliquots was stored at –80°C immediately after generation of the pool and served as a reference. Remaining aliquots were subjected to incubation at RT, +4°C or –20°C for 6 h, 24 h, and 48 h (Fig. 1), after which were stored at –80°C pending analyses. Upon completion of the incubation of all the samples, the PEBP1 concentration was measured by the ELISA assay.
Fig. 1
A schematic illustration presenting the workflow of the sample-stability experiment.
Statistical analysis
Continuous variables are represented as the mean±standard deviation (SD). Statistical analysis was performed with use of the GraphPad Prism software (USA). Shapiro-Wilk test was applied to assess data normality. The data did not exhibit normal distribution, hence non-parametric tests were applied. We implemented Mann-Whitney test for two-group comparisons (OND and MCI-AD) and Kruskal-Wallis test for multiple group comparisons (OND, MCI-AD, AD-dem) followed by Dunn’s test for multiple comparisons correction. When non-parametric tests were not applicable, data were log-transformed and analyzed with parametric two-way ANOVA test, followed by Dunnet’s test for multiple comparisons. Correlations between PEBP1 concentration in CSF and core AD biomarkers or PEBP1 concentration and age were assessed by Spearman’s correlation coefficients. A p-value < 0.05 was considered statistically significant.
RESULTS
Assay development
To evaluate the diagnostic performance of PEBP1 we developed an in-house ELISA.
Three different antibodies recognizing different regions of the PEBP1 were selected. All the antibodies exhibited specific recognition of the protein of interest both in reducing conditions (WB) and in native conditions (direct ELISA), while no cross-reactivity with HSA was observed for any of the antibodies (dot blot) (data not shown).
Once the assay was developed (capture antibody HPA063904, detection antibody sc-376925), we conducted several experiments aimed at its optimization. Comparison of PBS-based versus TBS-based assay buffers resulted in a similar reading of the background signal. While the initial premises pointed to possible dependence of CSF signal on Tween®20 addition, the experiments designed to evaluate such effect did not confirm influence of detergent addition on the intensity of CSF signal. Assessment of the assay performance with use of four different blocking buffers (1% milk powder/3% milk powder/1% BSA/3% BSA in PBS buffer) pointed to 1% BSA-PBS as the most effective blocking solution. No difference in blocking effectiveness was observed among buffers prepared with BSA reagent provided by three different vendors (03117332001, Roche, Switzerland, A9647-100G, Sigma-Aldrich, USA, P6154-100GR, Biowest, France) (data not shown).
The range of the standard curve extended from 100 ng/mL to 1.56 ng/mL. LLOQ and ULOQ of PEBP1 detection in CSF were, respectively, 4.7 ng/mL and 100 ng/mL. The CV% for the inter- and intra-assay variability were, respectively, 13.54% and 3.38%.
Analysis of pre-analytical factors for PEBP1 measurement in CSF
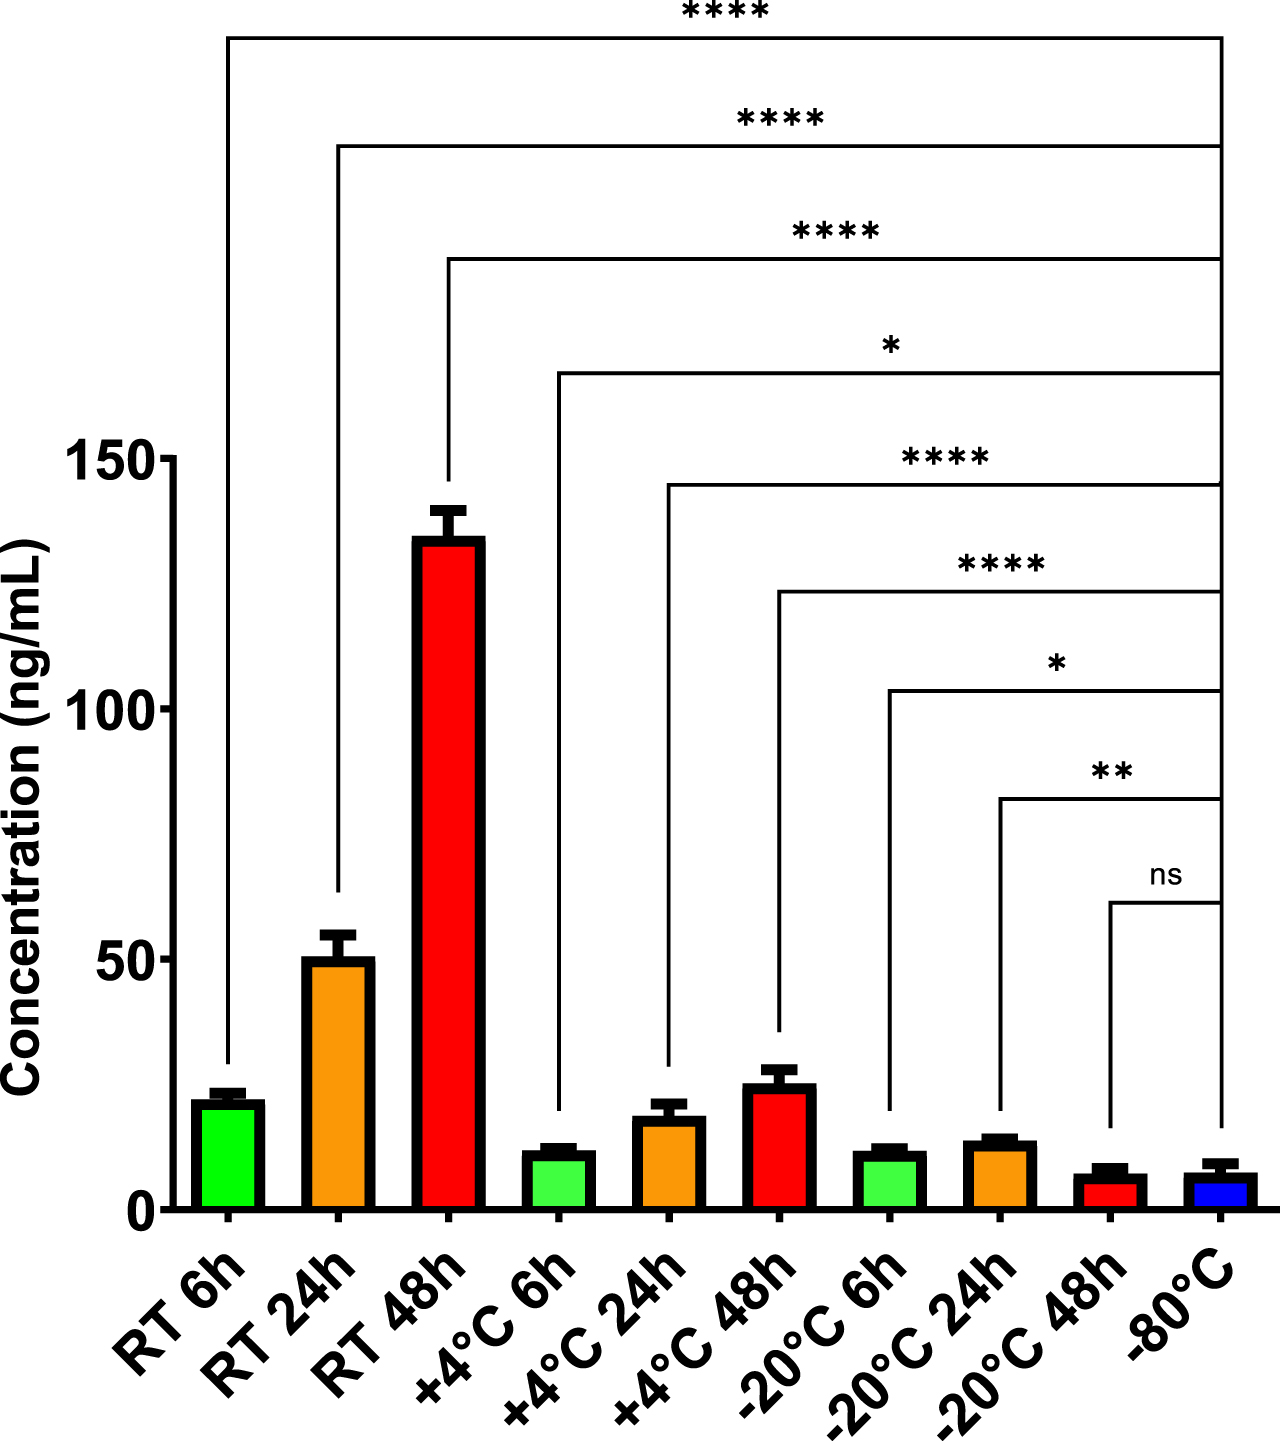
To analyze pre-analytical factors which may influence PEBP1 levels in CSF, we performed an experiment evaluating PEPB1 concentration of the consecutively collected CSF samples, subjected to a number of freeze-thaw cycles. We observed a significant increase (p < 0.01 at 4th cycle) of PEBP1 concentration, dependent on the number of freeze-thaw cycles (see Supplementary Figure 1). Such observation led us to perform another experiment, evaluating concentration of PEBP1 in CSF samples being subject to diverse incubation times and conditions. We observed that the samples subjected to prolonged incubation at RT, +4°C or –20°C instead of –80°C, exhibited a visibly elevated concentration of PEBP1 (Fig. 2), while compared to the reference sample (p≤0.0001 for –80°C (7.38 ng/mL) versus RT 6 h (22.03 ng/mL), p≤0.05 for –80°C (7.38 ng/mL) versus +4°C 6 h (11.82 ng/mL), p≤0.05 for –80°C (7.38 ng/mL) versus –20°C 6 h (11.75 ng/mL), p≤0.0001 for –80°C (7.38 ng/mL) versus RT 24 h (50.58 ng/mL), p≤0.0001 for –80°C (7.38 ng/mL) versus +4°C 24 h (18.71 ng/mL), p≤0.01 for –80°C (7.38 ng/mL) versus –20°C 24 h (13.78 ng/mL), p≤0.0001 for –80°C (7.38 ng/mL) versus RT 48 h (134.58 ng/mL), p≤0.0001 for –80°C (7.38 ng/mL) versus +4°C 48 h (25.23 ng/mL), non-significant for –80°C (7.38 ng/mL) versus –20°C 48 h (7.18 ng/mL)).
Fig. 2
PEBP1 concentration in CSF pool sample undergoing incubation at different conditions. Change related to concentration of the CSF pool sample properly stored at –80°C. Two-way ANOVA test, followed by Dunnet’s test for multiple comparisons were applied after log transformation of the data. Actual values in pg/mL are reported in the figure. *p≤0.05, **p≤0.01, ***p≤0.001, ****p≤0.0001 versus reference sample (–80°C).
Diagnostic performance of PEBP1 for AD diagnosis
The first validation included a cohort of 25 patients consisting of 14 MCI-AD subjects (50% female, age (Mean±SD) = 68±6.1) and 11 OND subjects (45.5% female, age (Mean±SD) = 67±9.9). Although a strong trend was visible, no statistically significant difference was observed when comparing both groups (p = 0.137) (Fig. 3A). The MCI-AD group exhibited higher level of PEBP1 concentration in CSF (MCI-AD = 32.47±12.6 ng/mL, OND = 27.5±15.03 ng/mL).
Fig. 3
A) PEBP1 concentration (ng/mL) in CSF of OND and MCI-AD groups included in the first clinical validation (p = 0.137, assessed by Mann-Whitney test). B) PEBP1 concentration (ng/mL) in CSF of OND, MCI-AD, and AD-dem groups included in the second clinical validation (p = 0.644, assessed by Kruskal-Wallis test, followed by Dunn’s test). In boxplots, heights of boxes represent the interquartile range (from 25th to 75th percentile). The line in the middle of the box represents the median. Whiskers and outliers are plotted according to the Tukey’s method.
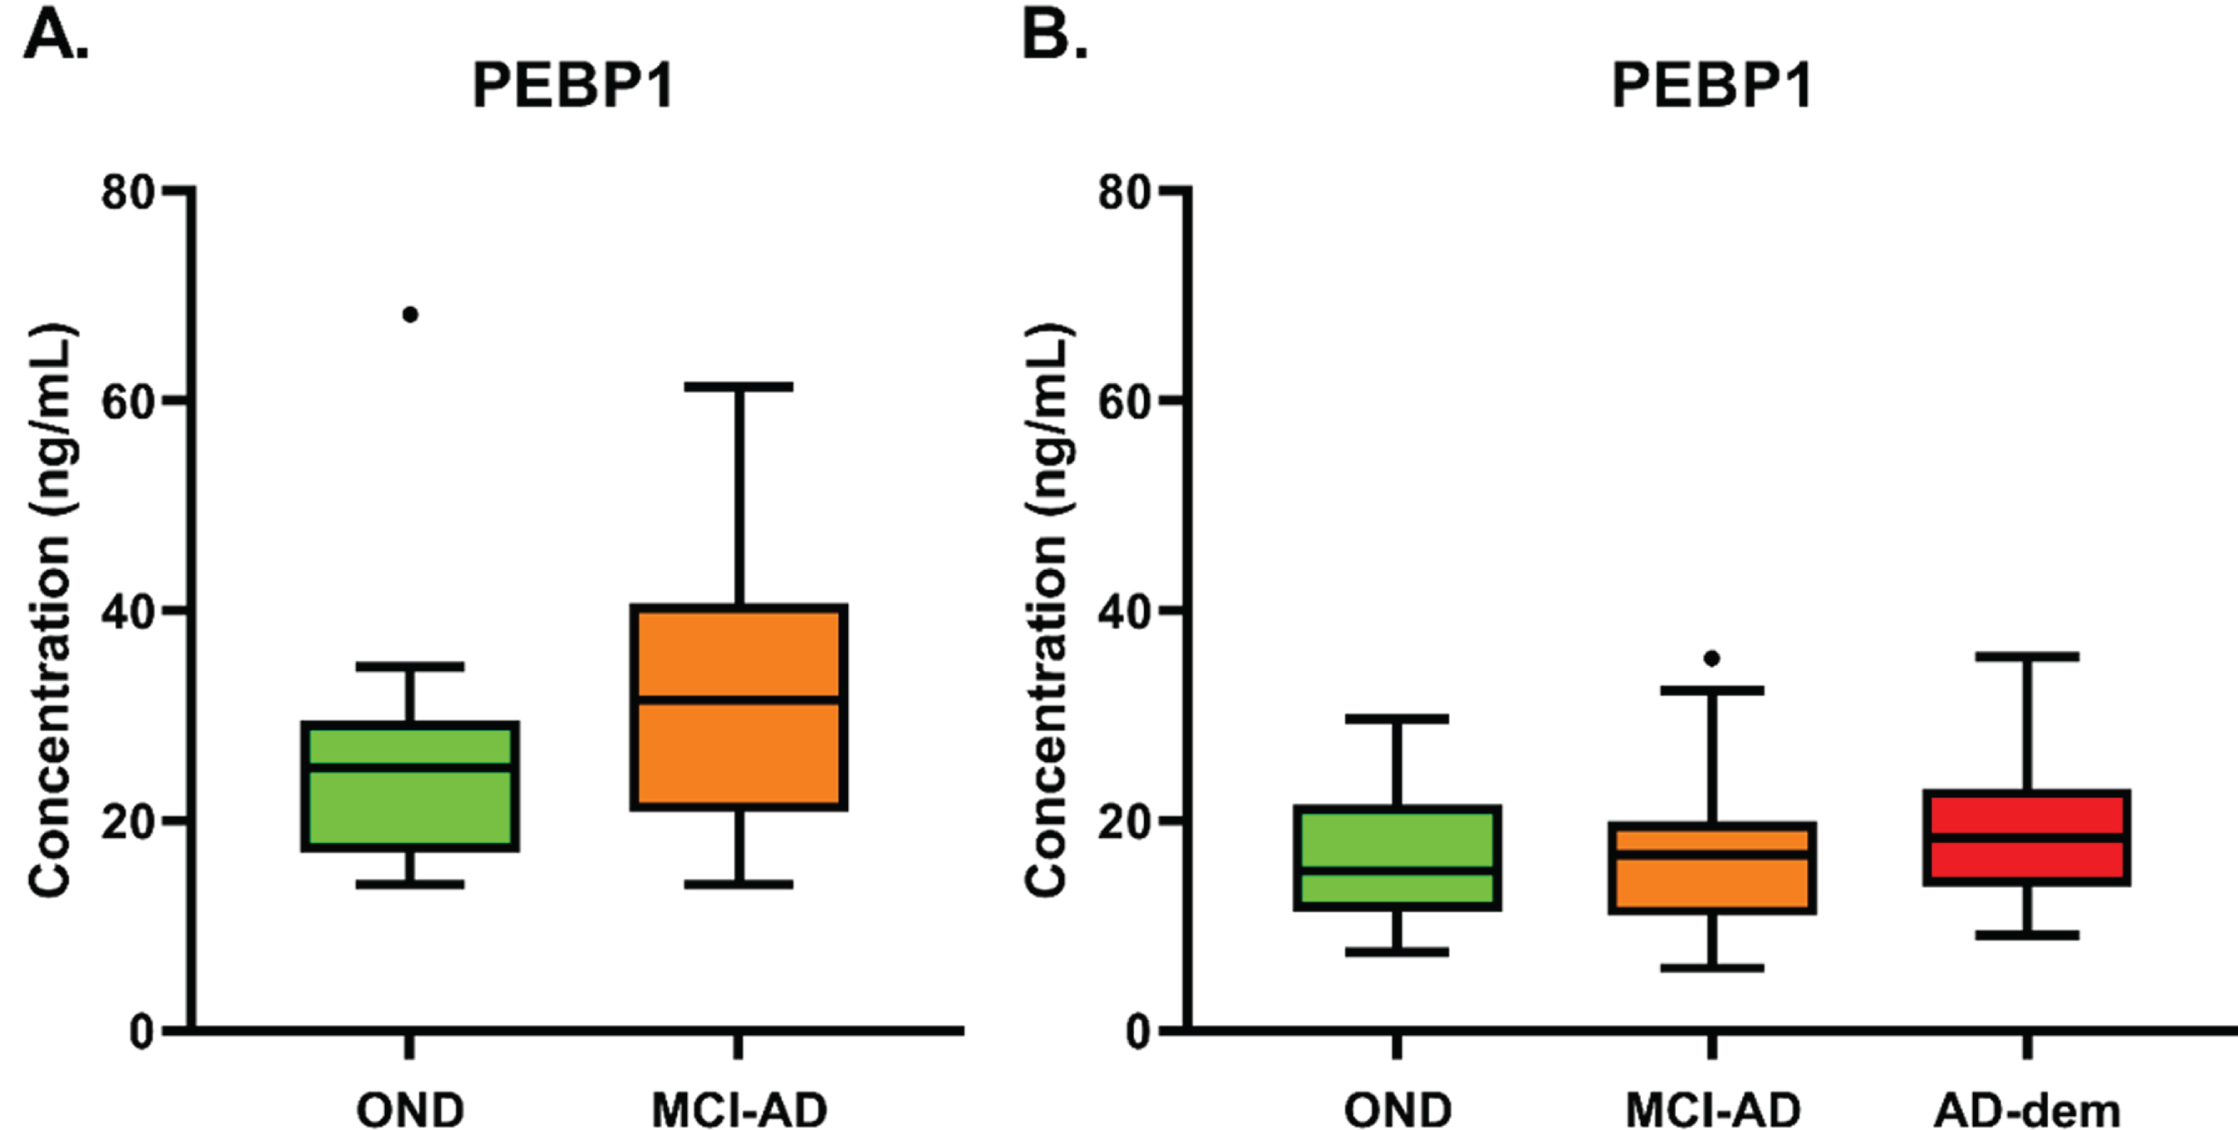
To confirm these results, a second validation was performed, with a larger cohort encompassing three diagnostic groups. For this analysis, 25 MCI-AD subjects (56% female, age (Mean±SD) = 73±5.5), 29 AD-dem subjects (72% female, age (Mean±SD) = 74±6.7), and 21 OND subjects (48% female, age (Mean±SD) = 56±15.7; 5 samples measured also in the first validation) were included. No statistically significant difference was observed among the groups (p = 0.644) (MCI-AD 22.41±12.17 ng/mL, AD-dem 19.10±7.29 ng/mL, OND 20.38±11.19ng/mL) (Fig. 3B).
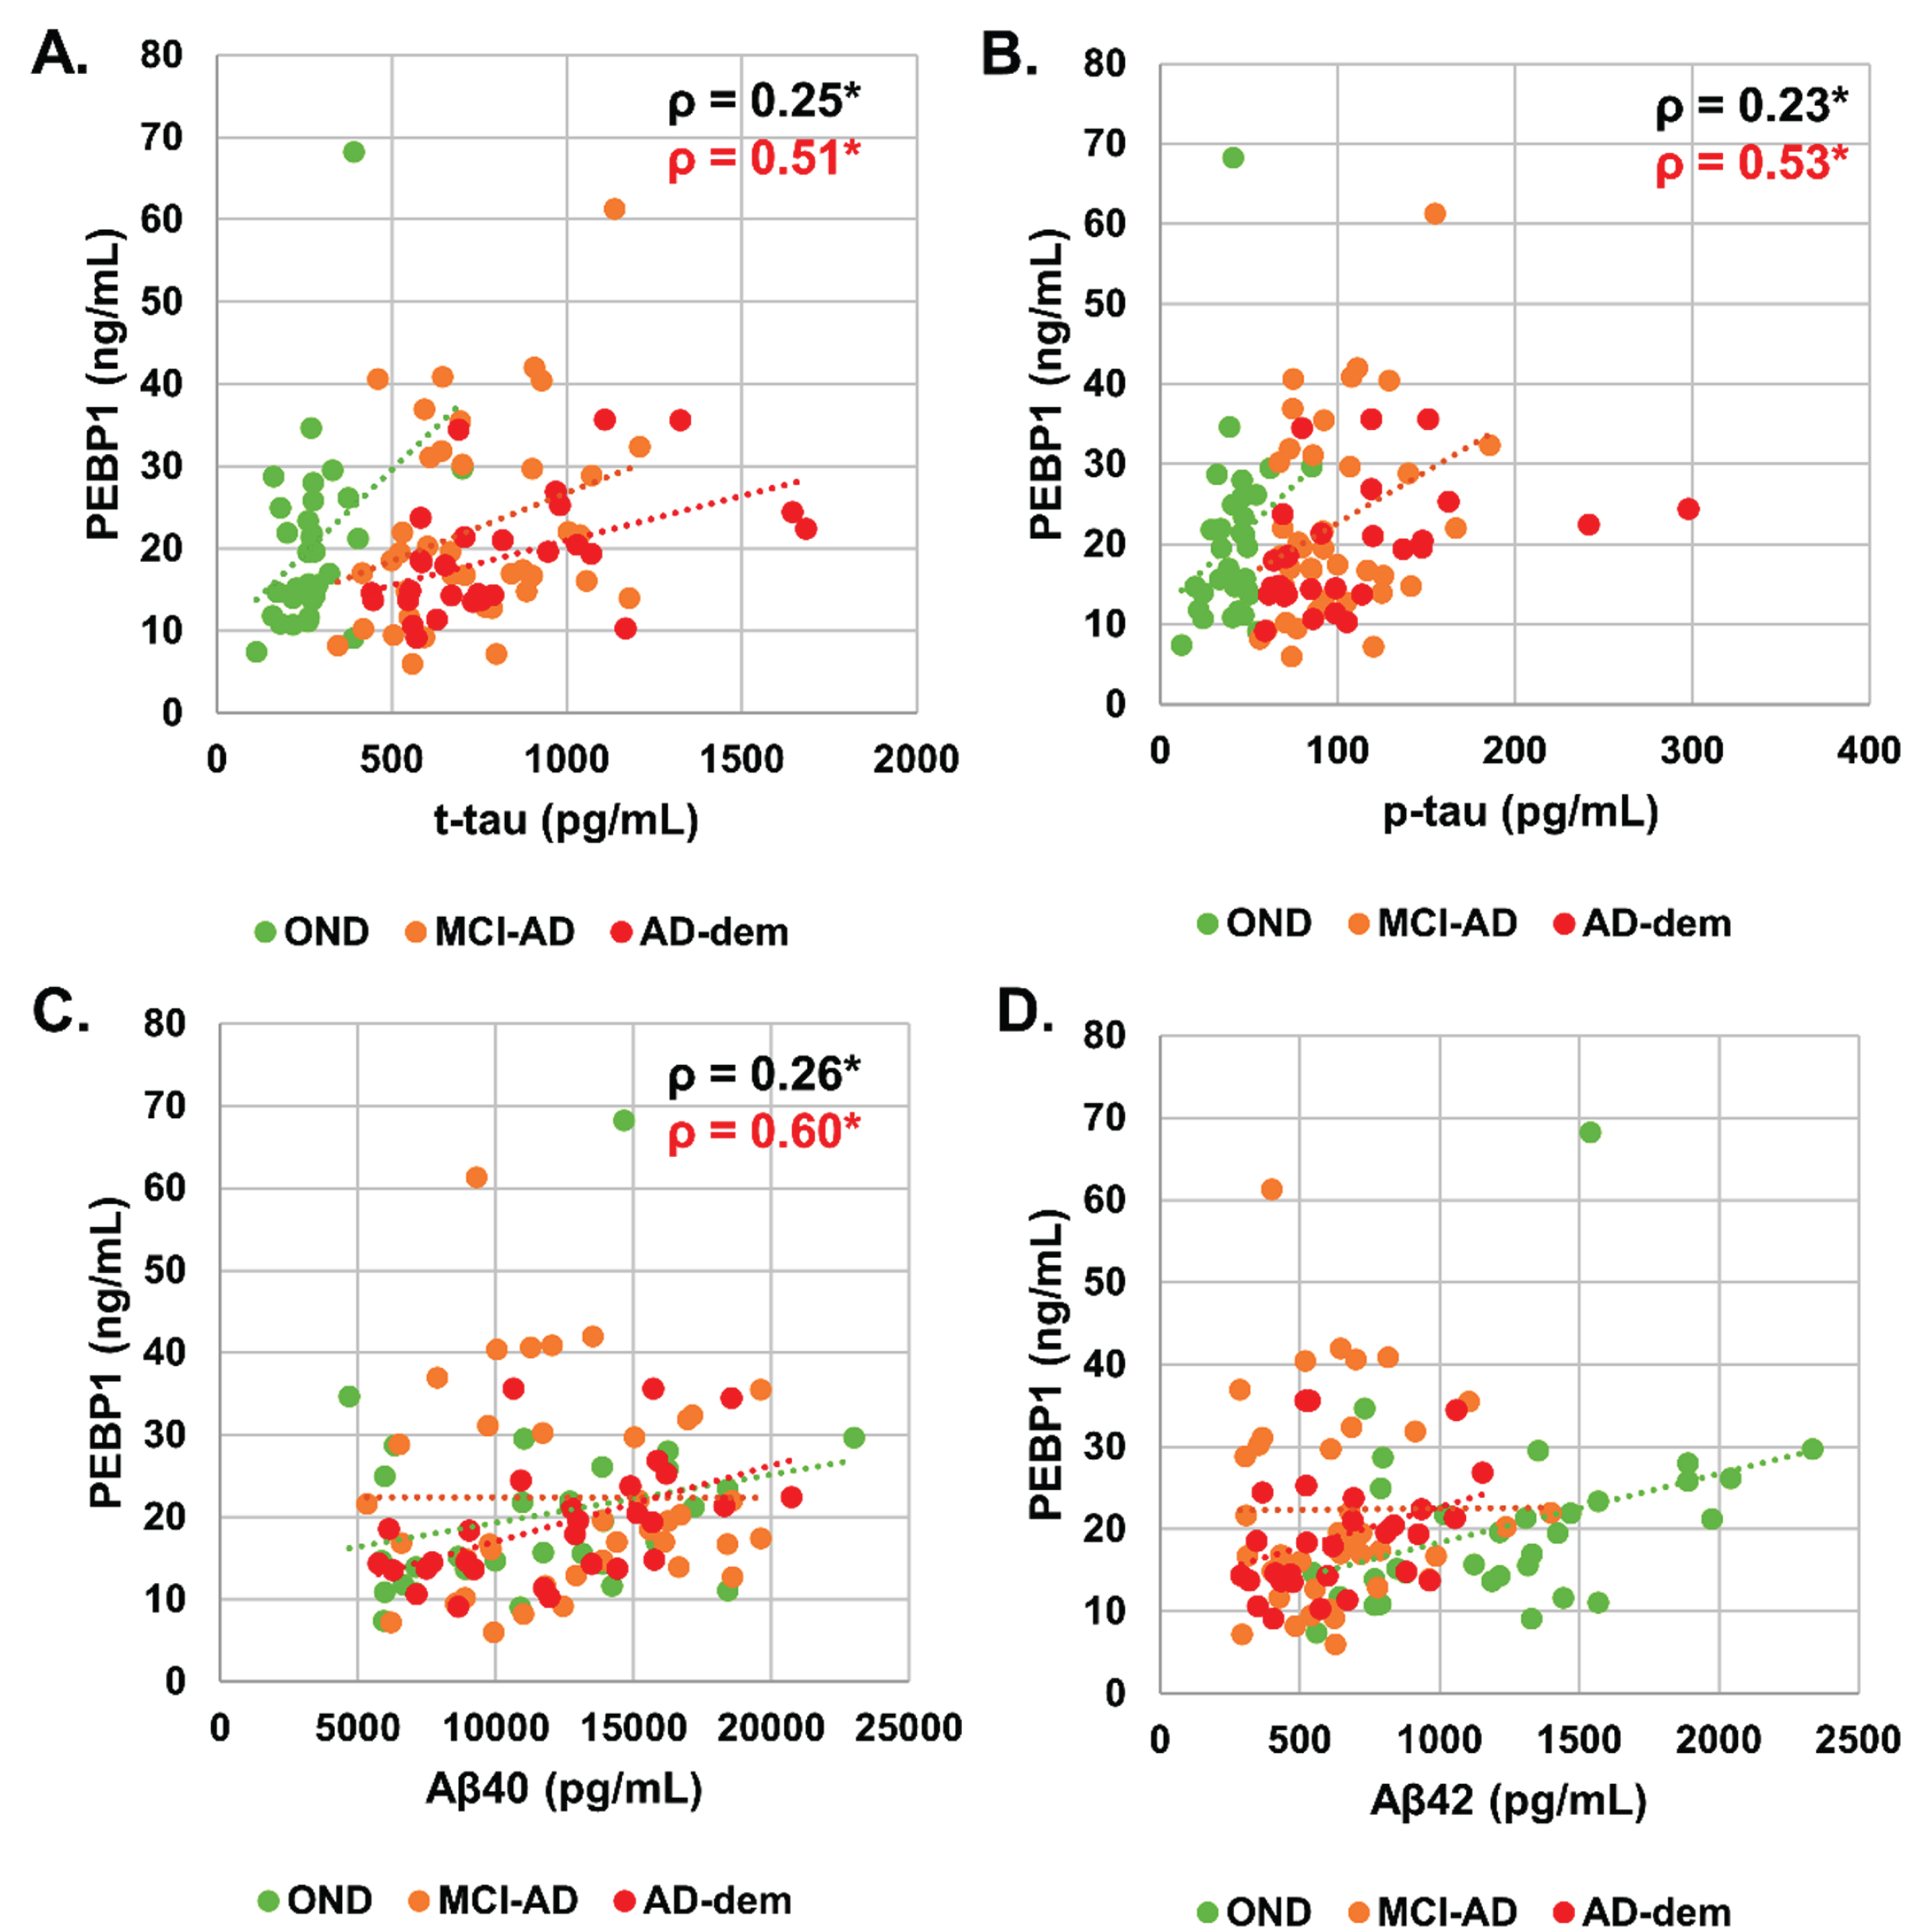
Correlation analysis between CSF PEBP1 level and AD biomarkers (Aβ42, Aβ40, Aβ42/Aβ40, p-tau, t-tau) was then performed. CSF PEBP1 concentration had a significant, though weak, positive correlation with t-tau (ρ= 0.25, p < 0.05), p-tau (ρ= 0.23, p < 0.05), and Aβ40 (ρ= 0.26, p < 0.05) when evaluated in the whole cohort (Fig. 4). Analysis of the individual groups showed that correlations were driven by the AD dementia group (PEBP1 versus t-tau ρ= 0.51, p < 0.05, PEBP1 versus p-tau ρ= 0.53, p < 0.05 and PEBP1 versus Aβ40 ρ= 0.60, p < 0.01). Correlation between CSF PEBP1 and age, Aβ42 or Aβ42/Aβ40 was not significant.
Fig. 4
Scatterplot of (A) CSF PEBP1 (ng/mL) versus t-tau (pg/mL) in the whole cohort, (B) CSF PEBP1 (ng/mL) versus p-tau (pg/mL) in the whole cohort, (C) CSF PEBP1 (ng/mL) versus Aβ40 (pg/mL) in the whole cohort, (D) CSF PEBP1 (ng/mL) versus Aβ42 (pg/mL) in the whole cohort. Correlations assessed by Spearman’s correlation coefficients. Lines are added only for the visualization purposes. Statistically significant correlation coefficients are reported for the whole cohort (in black) and subgroups (with the relative color).
DISCUSSION
In the current study, we report the development of an ELISA assay for detection of PEBP1 level in CSF. We performed several experiments aimed at a technical validation of the assay. Additionally, a clinical validation involving two well-characterized cohorts of MCI-AD, AD-dem and OND patients was performed.
Previous studies showed that PEBP1 might be strongly linked to AD pathogenesis [17–20]. Cholinergic hypothesis of AD suggests that a loss of cholinergic innervation in the cerebral cortex of patients with AD and the subsequent deficiency in the synthesis of acetylcholine are early pathogenic events correlated with cognitive impairment [28]. Interestingly, PEBP1 takes part in the positive regulation of acetylcholine metabolic processes and shows a decreased expression of its mRNA in the hippocampal CA1 field, but not in CA3 field or dentate gyrus of late-onset AD patients [17]. Remarkably, the early-onset AD patients showed a wide range of expression levels in the hippocampal sub-regions [17]. Evidence of PEBP1 role in AD has also been reported in some animal studies [20]. The authors found a significant correlation between decreased PEBP1 expression and accumulation of Aβ in the Tg2576 murine model of AD [20].
Despite the evidence of possible involvement of PEBP1 in the pathogenic processes of AD, our retrospective analysis in two different cohorts did not confirm PEBP1 diagnostic utility as a biomarker for differentiation between MCI-AD, AD-dem, and OND groups.
Although the level of the statistical significance was not reached, it is noteworthy that the observed trend of increased CSF PEBP1 in MCI-AD group versus control group, is consistent with recent findings [19]. The authors of the study used a parallel reaction monitoring mass spectrometry to quantify a panel of synaptic proteins in CSF, including PEBP1, in two cohorts involving, in total, 52 AD subjects and 37 controls. As the authors report, a significant increase in AD compared to neurological controls was observed for CSF PEBP1 (p≤0.001) [19]. As the method used by authors does not rely on a native protein but on tryptic peptides derived from it, the results may differ from those obtained when using ELISA. Assessing the levels of PEBP1 using two orthogonal techniques, such as immunoassay and mass spectrometry, could contribute to clarifying the biomarker value of PEBP1 for AD diagnosis. The biomarker potential of PEBP1 is also confirmed by our correlation analysis, in which the significant positive correlation between PEBP1 levels and core CSF AD biomarkers was mainly driven by the AD dementia group.
It is worth mentioning that full-length PEBP1 in CNS is processed into physiologically active peptides that are present in CSF and may have biomarker potential. Indeed, a previous study [18] showed that HCNP, a PEBP1-derived peptide, can be measured in CSF by a radioimmunoassay method. The study found a statistically significant increase of the PEBP1-derived peptide in a subgroup of early-onset AD compared to late-onset AD and control groups. Therefore, further studies using techniques able to measure PEBP1-derived peptides in CSF may contribute to the characterization of the PEBP1 profile in CSF of AD patients.
Our experimental data show that PEBP1 is sensitive to pre-analytical conditions. In particular, storage before freezing at either 4°C or room temperature significantly increased the signal obtained by our ELISA. If this sensitivity to pre-storage conditions is confirmed, our PEBP1 assay might also be used for monitoring CSF sample quality, an issue that is fundamental for both research and routine applications of AD biochemical diagnostics. In the past years, several guidelines and standard operating procedures have been developed to assess and ensure CSF sample quality [29–31] for dementia diagnostics. A simple tool that can detect CSF samples stored improperly would support decision making on sample inclusion in large multicenter studies and ongoing clinical trials. The reasons behind the variability of PEBP1 levels upon improper storage are currently unknown and might depend on several factors, including antibodies used in the assays or partial unfolding of the epitopes recognized by the antibody pair. For this reason, we assume that only samples with a short interval before deep freezing and not being subject to freeze-thaw cycles (unthawed) can be used to measure PEBP1 with our assay in the current format. A separate study should be planned to fully evaluate the “quality control” potential of CSF PEBP1 measured with our ELISA assay, to define cut-offs able to distinguish properly stored CSF samples.
In conclusion, we have developed a new ELISA assay to measure PEBP1 levels in CSF. Further studies are needed to assess the biomarker potential of PEBP1 in AD and other neurodegenerative diseases. At the same time, we believe that routine measurement of PEBP1 in CSF samples may be a useful tool to perform quality control of samples, which can be a crucial factor in large multicenter studies and clinical trials.
ACKNOWLEDGMENTS
This project has received funding from the European Union’s Horizon 2020 research and innovation program under the Marie Skłodowska-Curie grant agreement No. 86019 –MIRIADE (LP, ALW). SP is funded by the Associazione Italiana Ricerca Alzheimer Onlus (Airalzh) grant AGYR2020. GB is currently supported by the JPND bPRIDE (blood Proteins for early Discrimination of dEmentias) project. The Project leading this result has received funding under the call “JPco-fuND-2: Multinational research projects on Personalised Medicine for Neurodegenerative Diseases” (CUP number J99C18000210005).
Authors’ disclosures available online https://www.j-alz.com/manuscript-disclosures/22-0323r1).
SUPPLEMENTARY MATERIAL
[1] The supplementary material is available in the electronic version of this article: https://dx.doi.org/10.3233/JAD-220323.
REFERENCES
[1] | Alzheimer’s Association ((2020) ) Alzheimer’s Association 2020 facts and figures. Alzheimers Dement 16: , 391–460. |
[2] | Blennow K , de Leon MJ , Zetterberg H ((2006) ) Alzheimer’s disease. Lancet 368: , 387–403. |
[3] | Jack CR Jr , Knopman DS , Jagust WJ , Shaw LM , Aisen PS , Weiner MW , Petersen RC , Trojanowski JQ ((2010) ) Hypothetical model of dynamic biomarkers of the Alzheimer’s pathological cascade. Lancet Neurol 9: , 119–128. |
[4] | Jack CR Jr , Knopman DS , Jagust WJ , Petersen RC , Weiner MW , Aisen PS , Shaw LM , Vemuri P , Wiste HJ , Weigand SD , Lesnick TG , Pankratz VS , Donohue MC , Trojanowski JQ ((2013) ) Tracking pathophysiological processes in Alzheimer’s disease: An updated hypothetical model of dynamic biomarkers. Lancet Neurol 12: , 207–216. |
[5] | Hane FT , Robinson M , Lee BY , Bai O , Leonenko Z , Albert MS ((2017) ) Recent progress in Alzheimer’s disease research, part 3: Diagnosis and treatment. J Alzheimers Dis 57: , 645–665. |
[6] | Henriques AD , Benedet AL , Camargos EF , Rosa-Neto P , Nóbrega OT ((2018) ) Fluid and imaging biomarkers for Alzheimer’s disease: Where we stand and where to head to. Exp Gerontol 107: , 169–177. |
[7] | Mattsson-Carlgren N , Andersson E , Janelidze S , Ossenkoppele R , Insel P , Strandberg O , Zetterberg H , Rosen HJ , Rabinovici G , Chai X , Blennow K , Dage JL , Stomrud E , Smith R , Palmqvist S , Hansson O ((2020) ) Aβ deposition is associated with increases in soluble and phosphorylated tau that precede a positive Tau PET in Alzheimer’s disease. Sci Adv 6: , eaaz2387. |
[8] | Blennow K , Zetterberg H ((2018) ) The past and the future of Alzheimer’s disease fluid biomarkers. J Alzheimers Dis 62: , 1125–1140. |
[9] | Jack CR Jr , Bennett DA , Blennow K , Carrillo MC , Dunn B , Haeberlein SB , Holtzman DM , Jagust W , Jessen F , Karlawish J , Liu E , Molinuevo JL , Montine T , Phelps C , Rankin KP , Rowe CC , Scheltens P , Siemers E , Snyder HM , Sperling R , Elliott C , Masliah E , Ryan L , Silverberg N ((2018) ) NIA-AA Research Framework: Toward a biological definition of Alzheimer’s disease. Alzheimers Dement 14: , 535–562. |
[10] | Hu WT , Chen-Plotkin A , Arnold SE , Grossman M , Clark CM , Shaw LM , Pickering E , Kuhn M , Chen Y , Mccluskey L , Elman L , Karlawish J , Hurtig HI , Siderowf A , Lee VMY , Soares H , Trojanowski JQ ((2010) ) Novel CSF biomarkers for Alzheimer’s disease and mild cognitive impairment. Acta Neuropathol 119: , 669–678. |
[11] | Wyss-Coray T , Rogers J ((2012) ) Inflammation in Alzheimer disease–a brief review of the basic science and clinical literature. Cold Spring Harb Perspect Med 2: , a006346. |
[12] | Kinney JW , Bemiller SM , Murtishaw AS , Leisgang AM , Salazar AM , Lamb BT ((2018) ) Inflammation as a central mechanism in Alzheimer’s disease. Alzheimers Dement (N Y) 4: , 575–590. |
[13] | Bjerke M , Engelborghs S ((2018) ) Cerebrospinal fluid biomarkers for early and differential Alzheimer’s disease diagnosis. J Alzheimers Dis 62: , 1199–1209. |
[14] | UniProt Consortium ((2021) ) UniProt: The universal protein knowledgebase in 2021. Nucleic Acids Res 49: , D480–D489. |
[15] | Burgula S , Medisetty R , Jammulamadaka N , Musturi S , Ilavazhagan G , Singh SS ((2010) ) Downregulation of PEBP1 in rat brain cortex in hypoxia. J Mol Neurosci 41: , 36–47. |
[16] | Guldbrandsen A , Farag Y , Kroksveen AC , Oveland E , Lereim RR , Opsahl JA , Myhr KM , Berven FS , Barsnes H ((2017) ) CSF-PR 2.0: An interactive literature guide to quantitative cerebrospinal fluid mass spectrometry data from neurodegenerative disorders. Mol Cell Proteomics 16: , 300–309. |
[17] | Maki M , Matsukawa N , Yuasa H , Otsuka Y , Yamamoto T , Akatsu H , Okamoto T , Ueda R , Ojika K ((2002) ) Decreased expression of hippocampal cholinergic neurostimulating peptide precursor protein mRNA in the hippocampus in Alzheimer disease. J Neuropathol Exp Neurol 61: , 176–185. |
[18] | Tsugu Y , Ojika K , Matsukawa N , Iwase T , Otsuka Y , Katada E , Mitake S ((1998) ) High levels of hippocampal cholinergic neurostimulating peptide (HDNP >in the CSF of some patients with Alzhemer’s disease. Eur J Neurol 5: , 561–569. |
[19] | Nilsson J , Gobom J , Sjödin S , Brinkmalm G , Ashton NJ , Svensson J , Johansson P , Portelius E , Zetterberg H , Blennow K , Brinkmalm A ((2021) ) Cerebrospinal fluid biomarker panel for synaptic dysfunction in Alzheimer’s disease. Alzheimers Dement (Amst) 13: , e12179. |
[20] | George AJ , Holsinger RMD , McLean CA , Tan SS , Scott HS , Cardamone T , Cappai R , Masters CL , Li QX ((2006) ) Decreased phosphatidylethanolamine binding protein expression correlates with Aβ accumulation in the Tg2576 mouse model of Alzheimer’s disease. Neurobiol Aging 27: , 614–623. |
[21] | Uhlén M , Fagerberg L , Hallström BM , Lindskog C , Oksvold P , Mardinoglu A , Sivertsson Å , Kampf C , Sjöstedt E , Asplund A , Olsson IM , Edlund K , Lundberg E , Navani S , Szigyarto CA , Odeberg J , Djureinovic D , Takanen JO , Hober S , Alm T , Edqvist PH , Berling H , Tegel H , Mulder J , Rockberg J , Nilsson P , Schwenk JM , Hamsten M , Von Feilitzen K , Forsberg M , Persson L , Johansson F , Zwahlen M , Von Heijne G , Nielsen J , Pontén F ((2015) ) Tissue-based map of the human proteome. Science 347: , 1260419. |
[22] | Szklarczyk D , Gable AL , Nastou KC , Lyon D , Kirsch R , Pyysalo S , Doncheva NT , Legeay M , Fang T , Bork P , Jensen LJ , von Mering C ((2021) ) The STRING database in 2021: Customizable protein-protein networks, and functional characterization of user-uploaded gene/measurement sets. Nucleic Acids Res 49: , D605–D612. |
[23] | Jassal B , Matthews L , Viteri G , Gong C , Lorente P , Fabregat A , Sidiropoulos K , Cook J , Gillespie M , Haw R , Loney F , May B , Milacic M , Rothfels K , Sevilla C , Shamovsky V , Shorser S , Varusai T , Weiser J , Wu G , Stein L , Hermjakob H , D’Eustachio P ((2020) ) The reactome pathway knowledgebase. Nucleic Acids Res 48: , D498–D503. |
[24] | Teunissen CE , Petzold A , Bennett JL , Berven FS , Brundin L , Comabella M , Franciotta D , Frederiksen JL , Fleming JO , Furlan R , Hintzen MD RQ , Hughes SG , Johnson MH , Krasulova E , Kuhle J , Magnone MC , Rajda C , Rejdak K , Schmidt HK , van Pesch V , Waubant E , Wolf C , Giovannoni G , Hemmer B , Tumani H , Deisenhammer F ((2009) ) A consensus protocol for the standardization of cerebrospinal fluid collection and biobanking. Neurology 73: , 1914–1922. |
[25] | Chiasserini D , Paciotti S , Eusebi P , Persichetti E , Tasegian A , Kurzawa-Akanbi M , Chinnery PF , Morris CM , Calabresi P , Parnetti L , Beccari T ((2015) ) Selective loss of glucocerebrosidase activity in sporadic Parkinson’s disease and dementia with Lewy bodies. Mol Neurodegener 10: , 15. |
[26] | Andreasson U , Perret-Liaudet A , van Waalwijk van Doorn LJC , Blennow K , Chiasserini D , Engelborghs S , Fladby T , Genc S , Kruse N , Kuiperij HB , Kulic L , Lewczuk P , Mollenhauer B , Mroczko B , Parnetti L , Vanmechelen E , Verbeek MM , Winblad B , Zetterberg H , Koel-Simmelink M , Teunissen CE ((2015) ) A practical guide to immunoassay method validation. Front Neurol 6: , 179. |
[27] | del Campo M , Jongbloed W , Twaalfhoven HAM , Veerhuis R , Blankenstein MA , Teunissen CE ((2015) ) Facilitating the validation of novel protein biomarkers for dementia: An optimal workflow for the development of sandwich immunoassays. Front Neurol 6: , 202. |
[28] | Hampel H , Mesulam MM , Cuello AC , Khachaturian AS , Vergallo A , Farlow MR , Snyder PJ , Giacobini E , Khachaturian ZS ((2018) ) Revisiting the cholinergic hypothesis in Alzheimer’s disease: Emerging evidence from translational and clinical research. J Prev Alzheimers Dis 6: , 2–15. |
[29] | Simonsen AH , Bahl JMC , Danborg PB , Lindstrom V , Larsen SO , Grubb A , Heegaard NHH , Waldemar G ((2013) ) Pre-analytical factors influencing the stability of cerebrospinal fluid proteins. J Neurosci Methods 215: , 234–240. |
[30] | Bellomo G , Cataldi S , Paciotti S , Paolini Paoletti F , Chiasserini D , Parnetti L ((2020) ) Measurement of CSF core Alzheimer disease biomarkers for routine clinical diagnosis: Do fresh vs frozen samples differ? Alzheimers Res Ther 12: , 121. |
[31] | Hansson O , Rutz S , Zetterberg H , Bauer E , Hähl T , Manuilova E , Mert MC , Wahl S , Blennow K , Stomrud E ((2020) ) Pre-analytical protocol for measuring Alzheimer’s disease biomarkers in fresh CSF. Alzheimers Dement (Amst) 12: , e12137. |


