
Genome-Wide Association Study of Incident Dementia in a Community-Based Sample of Older Subjects
Abstract
Background:
Alzheimer’s disease (AD) is a complex disease influenced by the environment and genetics; however, much of the genetic component remains unaccounted for.
Objective:
The purpose of this work was to use genome-wide association analyses to detect genetic associations with incident AD in a sample of older adults aged 75 and above.
Methods:
We performed a genome-wide association study (GWAS) on genome-wide genotyped and imputed data (14,072,053 variants) on the Gingko Evaluation of Memory (GEM) study sample consisting of 424 incident dementia (mean age = 84.46±3.91) and 2,206 non-demented (mean age = 84.55±3.23) subjects.
Results:
The established association of APOE*4 carriers with AD was confirmed in this community-based sample of older subjects (odds ratio (OR) = 2.22; p = 9.36E-14) and was stronger in females (OR = 2.72; p = 1.74E-10) than in males (OR = 1.88; p = 2.43E-05). We observed a novel genome-wide significant (GWS) locus on chromosome 12 near ncRNA LOC105369711/rs148377161 (OR = 3.31; p = 1.66E-08). In addition, sex-stratified analyses identified two novel associations in males: one near ncRNA LOC729987/rs140076909 on chromosome 1 (OR = 4.51; p = 3.72E-08) and the other approaching GWS near ncRNA LOC105375138/rs117803234 on chromosome 7 (OR = 3.76; p = 6.93E-08).
Conclusion:
The use of community-based samples of older individuals and incident dementia as a phenotype may be a helpful approach for the identification of novel genes for AD, which may not be detected in standard case-control studies. Replication of these signals and further studies of these regions and genes will help to provide a clearer picture for their role in AD.
INTRODUCTION
Dementia is a broad term describing conditions that affect a person’s ability to remember and make decisions, and can affect behavior and personality. Alzheimer’s disease (AD) is the most common form of dementia, making up 60–80% of dementia cases and predominantly affecting the elderly [1]. In the United States, an estimated 6.2 million people 65 or older were affected in 2021, and due to demographic changes this number is estimated to rise to approximately 14 million by 2060 [1]. AD is a complex disease influenced by genetics as well as the environment, with heritability estimated to be between 58–70% [2, 3]. Currently, about 31% of genetic variance is explained by common single-nucleotide polymorphisms (SNPs) from genome-wide association studies (GWAS) [4]. Further studies are needed to account for this unexplained genetic component to gain better understanding of the disease. Most AD genetic studies have been done on highly selected cases derived from AD research centers having moderate to severe AD [5]. On the other hand, community-based cohorts generally have cases with mild dementias, which may help to identify novel genes not detectable in standard case-control studies. Thus, the objective of this work was to use genome-wide association analyses to detect novel genetic associations with incident AD in a community-based sample of older adults (age range 75 to 99 years) derived from the Gingko Evaluation of Memory (GEM) study.
METHODS
The study subjects were derived from the GEM study, the purpose of which was to test the effect of Ginkgo biloba on the development of incident dementia in community populations which were cognitively normal or had mild cognitive impairment (MCI) [6]. Subjects were recruited from nearby communities at four clinical sites: University of Pittsburgh, University of California-Davis, John Hopkins University, and Wake Forest University [6]. The study participants were screened to determine if they met inclusion or exclusion criteria. Cognitive assessment was done initially with a telephone interview that if passed would result in a scheduled screening visit. The Modified Mini-Mental State Examination (3MSE) [7] was used to further assess cognitive function before administering a more detailed neuropsychological battery. The neuropsychological battery consisted of multiple tests designed to assess the following cognitive domains: estimated verbal IQ, memory, construction, language, psychomotor speed, attention, and executive function [8].
Individuals who already showed signs of dementia or those who had other neurological conditions were excluded from the study; those who showed no signs of dementia or showed signs of MCI were included. Subjects who were taking over-the-counter cognitive enhancers, cholinesterase inhibitors, were not willing to restrict their vitamin E intake, or who were taking over-the-counter G. biloba were excluded. Those with an increased risk of bleeding either due to a disorder, low platelets, or use of anticoagulant medication were excluded due to potential increased bleeding risk from use of G. biloba. Details of other exclusion criteria are found in DeKosky et al. [9].
A total of 3,069 subjects (95.5% Whites and 4.5% non-Whites) were recruited. DNA was available on 2,737 subjects (96.1% White and 3.9% non-White), who were genotyped using the Illumina Infinium Multi-Ethnic Global-8 v1.0 chip containing 1,748,250 single-nucleotide polymorphisms (SNPs). Fifteen samples were excluded for having a call rate below 95%. One sample failed in the genotyping chip analysis. Imputation was done using the Haplotype Reference Consortium (HRC) panel on the Michigan Imputation Server (https://imputationserver.sph.umich.edu/). After imputation, the total number of SNPs increased to 14,072,053. Genotypes for the APOE/rs429358 (APOE*4) and APOE/rs7412 (APOE*2) SNPs were determined using TaqMan genotyping assays. Because of the strong linkage disequilibrium (LD) between the two sites, this is also treated as a three-allele APOE polymorphism: APOE*2, APOE*3, and APOE*4, resulting in six genotypes (2/2, 2/3, 2/4, 3/3, 3/4, 4/4) [5].
Principal components (PCs) of ancestry were calculated using variants with minor allele frequency (MAF) of > 0.50. A sliding window approach was used with a 2,000 bp window size shifted every 200 variants to estimate correlation. This was done to avoid using highly correlated variants to estimate ethnicity structure of the cohort. Variants were identified and removed from principal component analysis with maximum likelihood phasing based r2 > 0.05. The first four principal components generated from this analysis were used as covariates in the GWAS analyses.
Because of the small number of non-Whites, only White individuals (n = 2,630; age range 75 to 99 years) were used for genetic analyses (Table 1). Logistic regression was used to associate SNPs with dementia risk. Two association analyses were done based on the inclusion of: 1) all incident cases including any form of dementia, and 2) incident cases including only AD Dementia. The Any Dementia analysis used 424 incident cases (386 AD Dementia and 38 non-AD Dementia) and 2,206 controls with a total of 2,630 individuals (Table 1). The AD Dementia analysis used 386 incident AD cases and 2,206 controls for a total of 2,592 individuals (Table 1). Both analyses used sex, education, and age-at-onset (AAO) for cases, age at last follow-up for controls, and the first four PCs of ancestry as covariates.
Table 1
Descriptive statistics of white subjects used in GWAS analyses
| Non-demented controls | AD Dementia | Non-AD Dementia | Any Dementia (AD + Non-AD Dementia) | |
| N | 2,206 | 386 | 38 | 424 |
| Male | 1,228 (55.67%) | 204 (52.85%) | 17 (44.74%) | 221 (52.12%) |
| Female | 978 (44.33%) | 182 (47.15%) | 21 (55.26%) | 203 (47.88%) |
| Mean Age (SD) | 84.55 (3.23) | 84.64 (3.91) | 82.56 (3.52) | 84.46 (3.91) |
| Male | 84.50 (3.23) | 84.74 (3.78) | 82.35 (2.96) | 84.55 (3.77) |
| Female | 84.61 (3.24) | 84.54 (4.05) | 82.74 (3.97) | 84.35 (4.07) |
Gender-stratified (male and female) and APOE genotype-stratified (E*4 and non-E*4 carriers) analyses were done separately for Any Dementia and AD Dementia. The analysis of males with Any Dementia consisted of 204 with AD Dementia, 17 with other dementia and 1,228 controls. The analysis of females with Any Dementia consisted of 182 with AD Dementia, 21 with other dementia, and 978 controls. The analysis of males with AD Dementia included 204 with AD and 1,228 controls. The analysis of females with AD Dementia consisted of 182 with AD and 978 controls. Covariates used for this sex-stratified analysis included the first four PCs of ancestry, AAO for cases, age at last follow-up for controls, and education. APOE genotype-stratified analyses were carried out among APOE*4 and non-APOE*4 carriers. The analysis of APOE*4 carriers with Any Dementia consisted of 150 with AD Dementia and 9 with other dementia and 458 controls. The analysis of non-APOE*4 carriers with Any Dementia consisted of 232 with AD Dementia and 29 with other dementia and 1,739 controls. The analysis of APOE*4 carriers with AD consisted of 150 with AD Dementia and 458 controls. The analysis of non-APOE*4 carriers with AD Dementia consisted of 232 with AD and 1,739 controls. Covariates used for these analyses were the first four PCs of ancestry, sex, AAO for cases, age at last follow-up for controls, and education.
These association analyses were done using Plink [10]. Manhattan and QQ plots were generated in R using the qqman package [11]. SNPs that did not meet Hardy-Weinberg Equilibrium (HWE test p≤1E-06) were removed. The genome-wide significance threshold was set at p < 5E-08, while the suggestive significance threshold was set at p < 1E-05. Regional association plots were generated using LocusZoom [12] based on GRCh37 assembly.
Functional annotation for newly identified SNPs and for those in LD was done by looking at those SNPs in the Genotype-Tissue Expression project (GTEx) v8 database to check for any single-tissue expression quantitative trait loci (eQTLs). These SNPs were also checked in the RegulomeDB database to assess their potential regulatory function. Combined Annotation Dependent Depletion (CADD) scores designed to predict the deleteriousness of a variant were also obtained for these SNPs.
RESULTS
APOE genotype distribution
Of the 2,617 White samples successfully genotyped for APOE/rs429358 (APOE*4) and APOE/rs7412 (APOE*2) SNPs, 2,579 were used in the AD Dementia case-control analysis and 2,617 individuals in the Any Dementia case-control analysis. The distribution of the six APOE genotypes derived from the two SNPs was in HWE in both the AD Dementia and Any Dementia case-control analyses (Table 2; Supplementary Table 1). As expected, the overall distribution of APOE genotypes was significantly different between AD Dementia and cognitively normal groups (p = 1E-05). The frequency of APOE*4 carriers (39% versus 21%) and APOE*4 allele (21% versus 11%) was almost double in cases than in controls (Table 2). The odds ratios (ORs) with one and two copies of APOE*4 were 2.22 (95% CI: 1.80–2.73) and 4.92 (95% CI: 3.99–6.06), respectively. On the other hand, the frequency of the APOE*2 allele was similar in AD Dementia and non-dementia groups (6.94% versus 8.15%) with a non-significant OR of 0.863 (95% CI: 0.73–1.01; p = 0.3245). Similar results were obtained in the Any Dementia analysis (Table 1).
Table 2
APOE genotype distribution
| Genotype | AD Dementia (n = 382) | Cognitively normal (n = 2,197) | Total (n = 2,579) |
| E2/2 | 3 (0.79%) | 18 (0.82%) | 21 (0.81%) |
| E2/3 | 30 (7.85%) | 279 (12.70%) | 309 (11.98%) |
| E2/4 | 17 (4.45%) | 43 (1.96%) | 60 (2.33%) |
| E3/3 | 199 (52.09%) | 1,442 (65.64%) | 1,641 (63.63%) |
| E3/4 | 124 (32.46%) | 391 (17.80%) | 515 (19.97%) |
| E4/4 | 9 (2.36%) | 24 (1.09%) | 33 (1.28%) |
| Hardy-Weinberg p | 0.079 | 0.878 | 0.402 |
| Allele frequency | |||
| APOE*2 | 0.0694 | 0.0815 | 0.0797 |
| APOE*3 | 0.7225 | 0.8089 | 0.7961 |
| APOE*4 | 0.2082 | 0.1097 | 0.1243 |
3.2Association analysis of known AD-loci
Of the reported AD-associated top SNPs in 93 loci among Whites [5], 76 SNPs passed QC in the GEM sample (Supplementary Table 2). In addition to APOE, ten reported top SNPs achieved nominal significance in the GEM sample in the following loci: OR2B2/rs1497525 (p = 5.16E-03), HS3ST5/rs785129 (p = 1.64E-02), GPR141/rs2718058 (p =4.14E-04), CTSB/rs1065712 (p = 5.53E-02), CCDC6/rs1171814 (p = 1.80E-03), PICALM/rs867611 (p = 1.85E-02), MS4A6A/rs7933202 (p = 4.25E-02), APH1B/rs117618017 (p = 1.90E-02), PLCG2/rs12444183 (p = 4.76E-02), and ABCA7/rs3752246 (p =1.49E-02). Although top SNPs at an additional 47 loci showed the same directional effects in the GEM sample as the ones reported in very large data sets, they did not achieve statistically significance, perhaps due to the relatively small sample size of the dementia group in this study.
Genome-wide association analyses
The quantile-quantile plots in the AD and Any Dementia analyses showed that the observed p-values largely adhered to the p-values of the null distribution until the deviation at the tail (Fig. 1a; Supplementary Figure 1). This indicated some associations and a low likelihood of false positives results.
Fig. 1
a) Quantile-quantile plot showing observed versus expected p-values for the AD Dementia analysis. b) Manhattan plot showing genome-wide p-values for the association with AD. The threshold for genome-wide significance (p < 5E-08) is indicated by the red line and the threshold for suggestive significance (p < 1E-05) is indicated by the blue line.
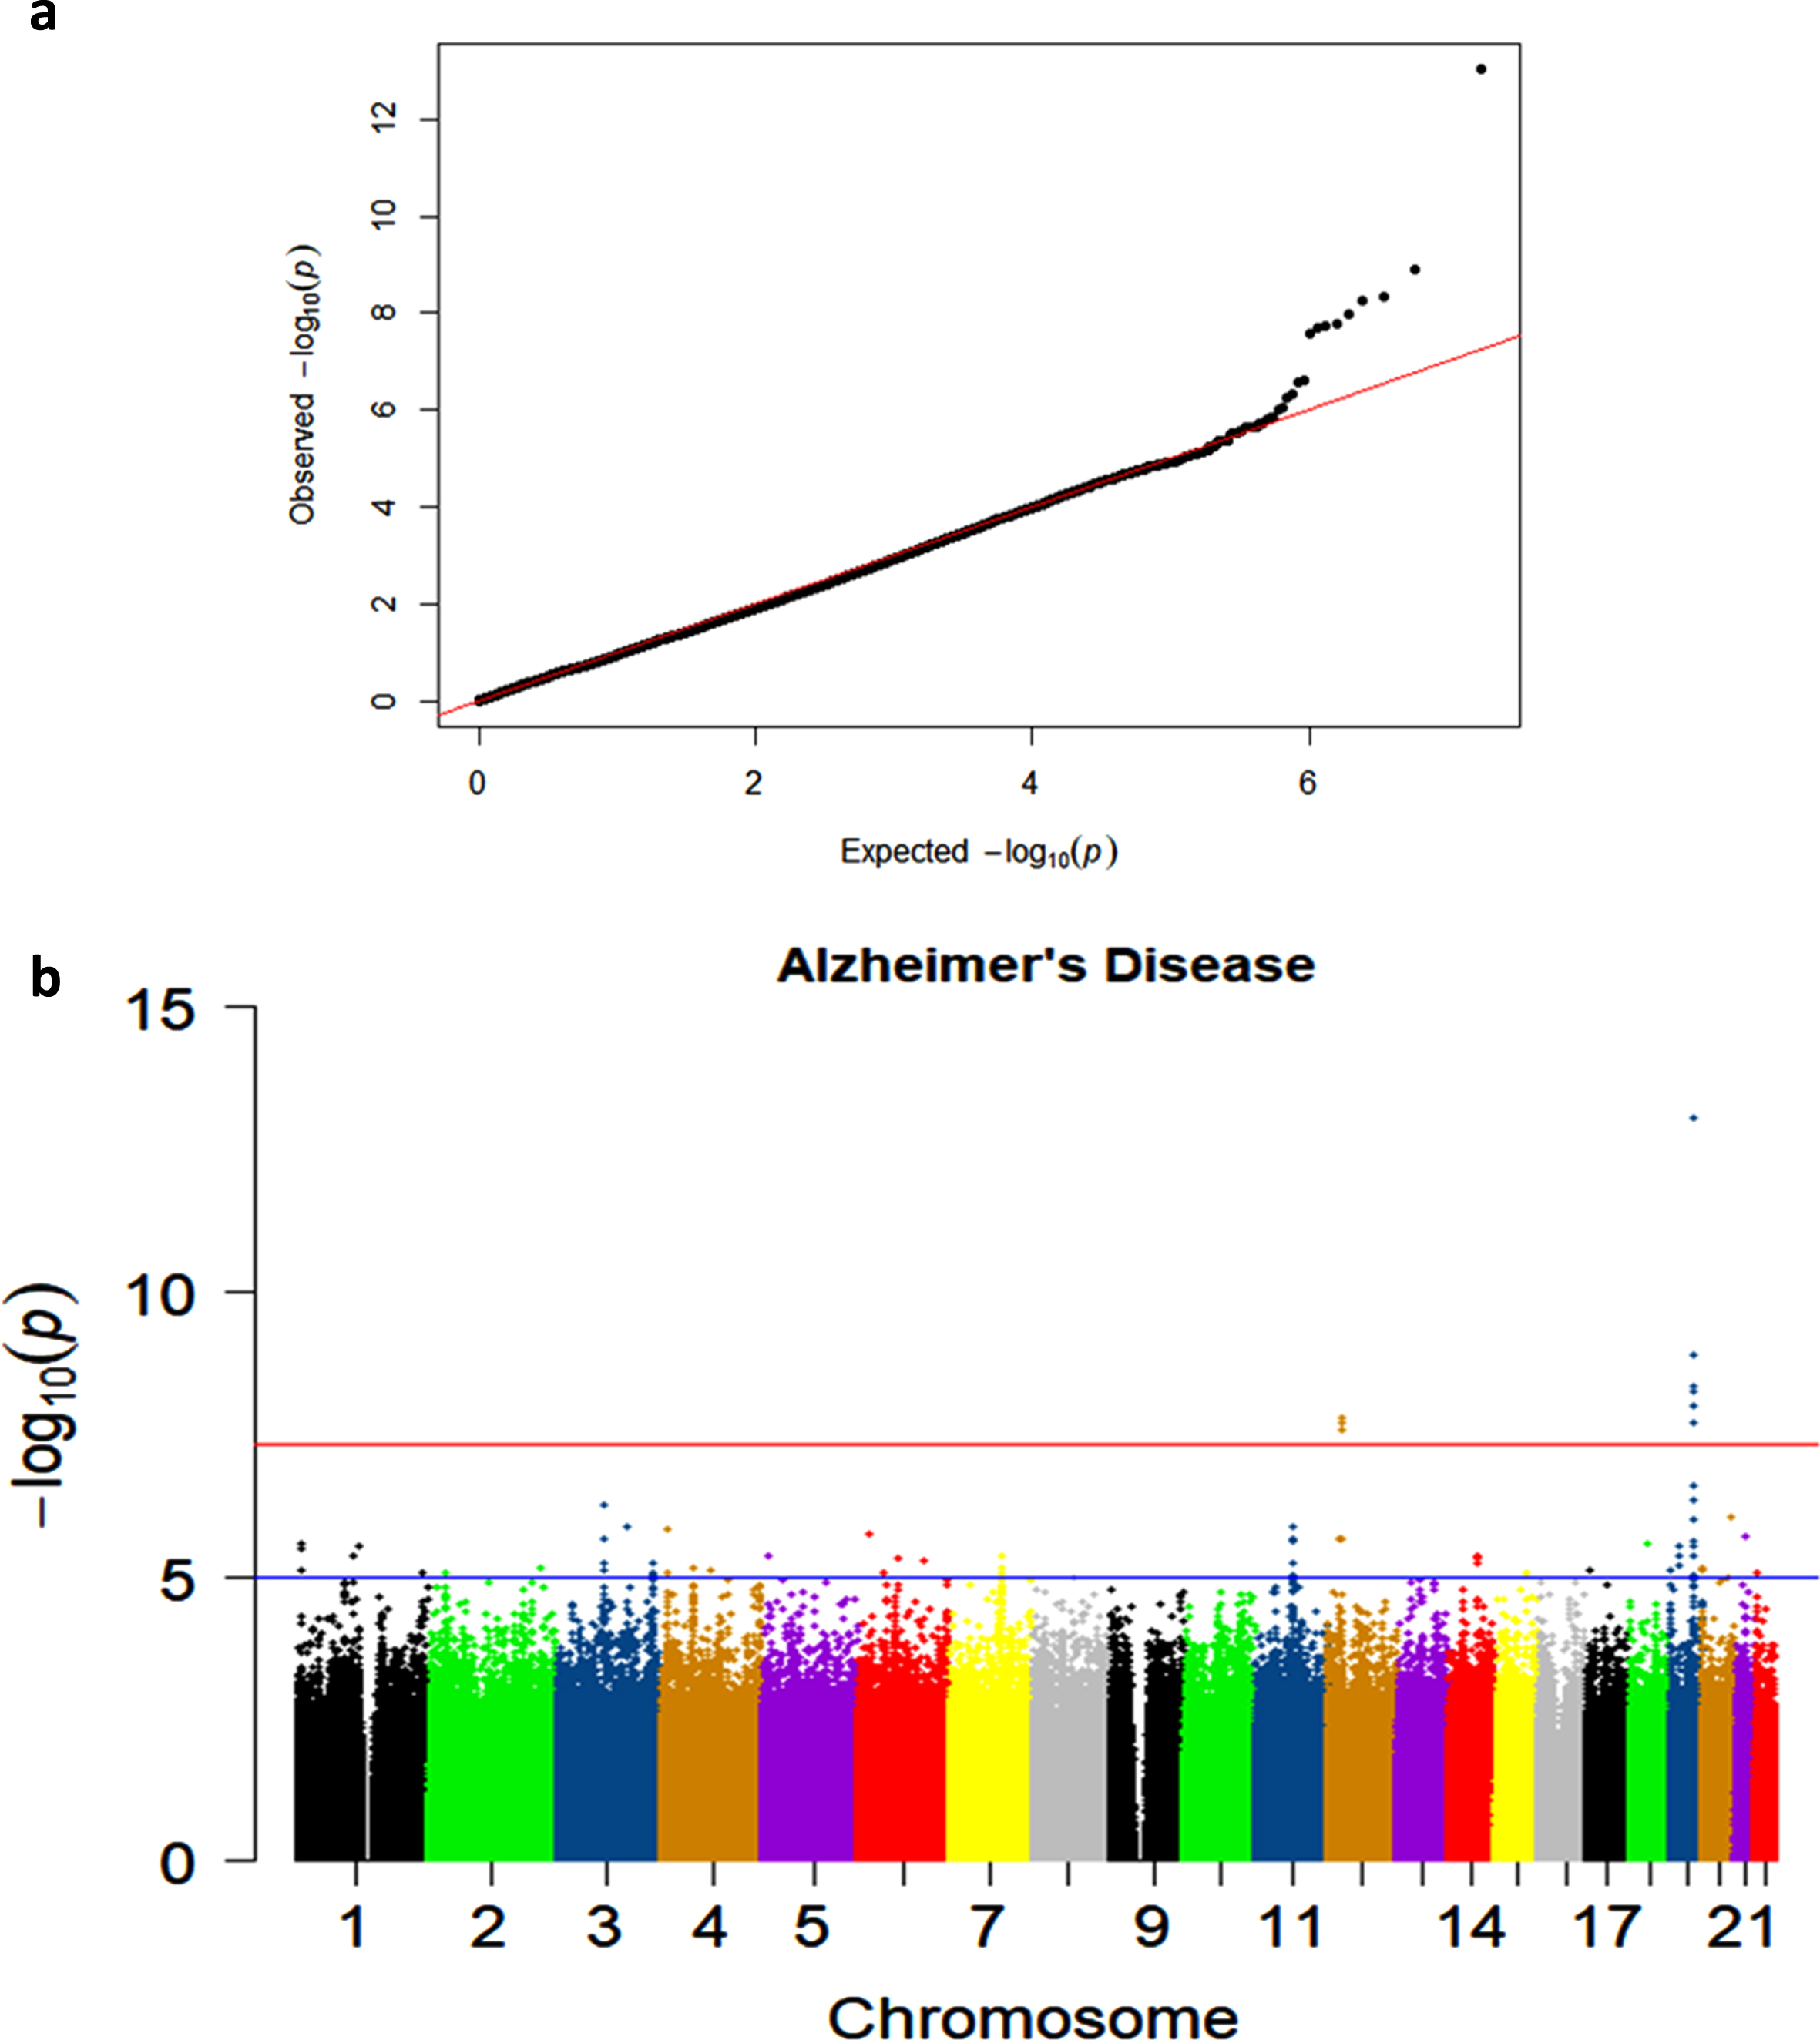
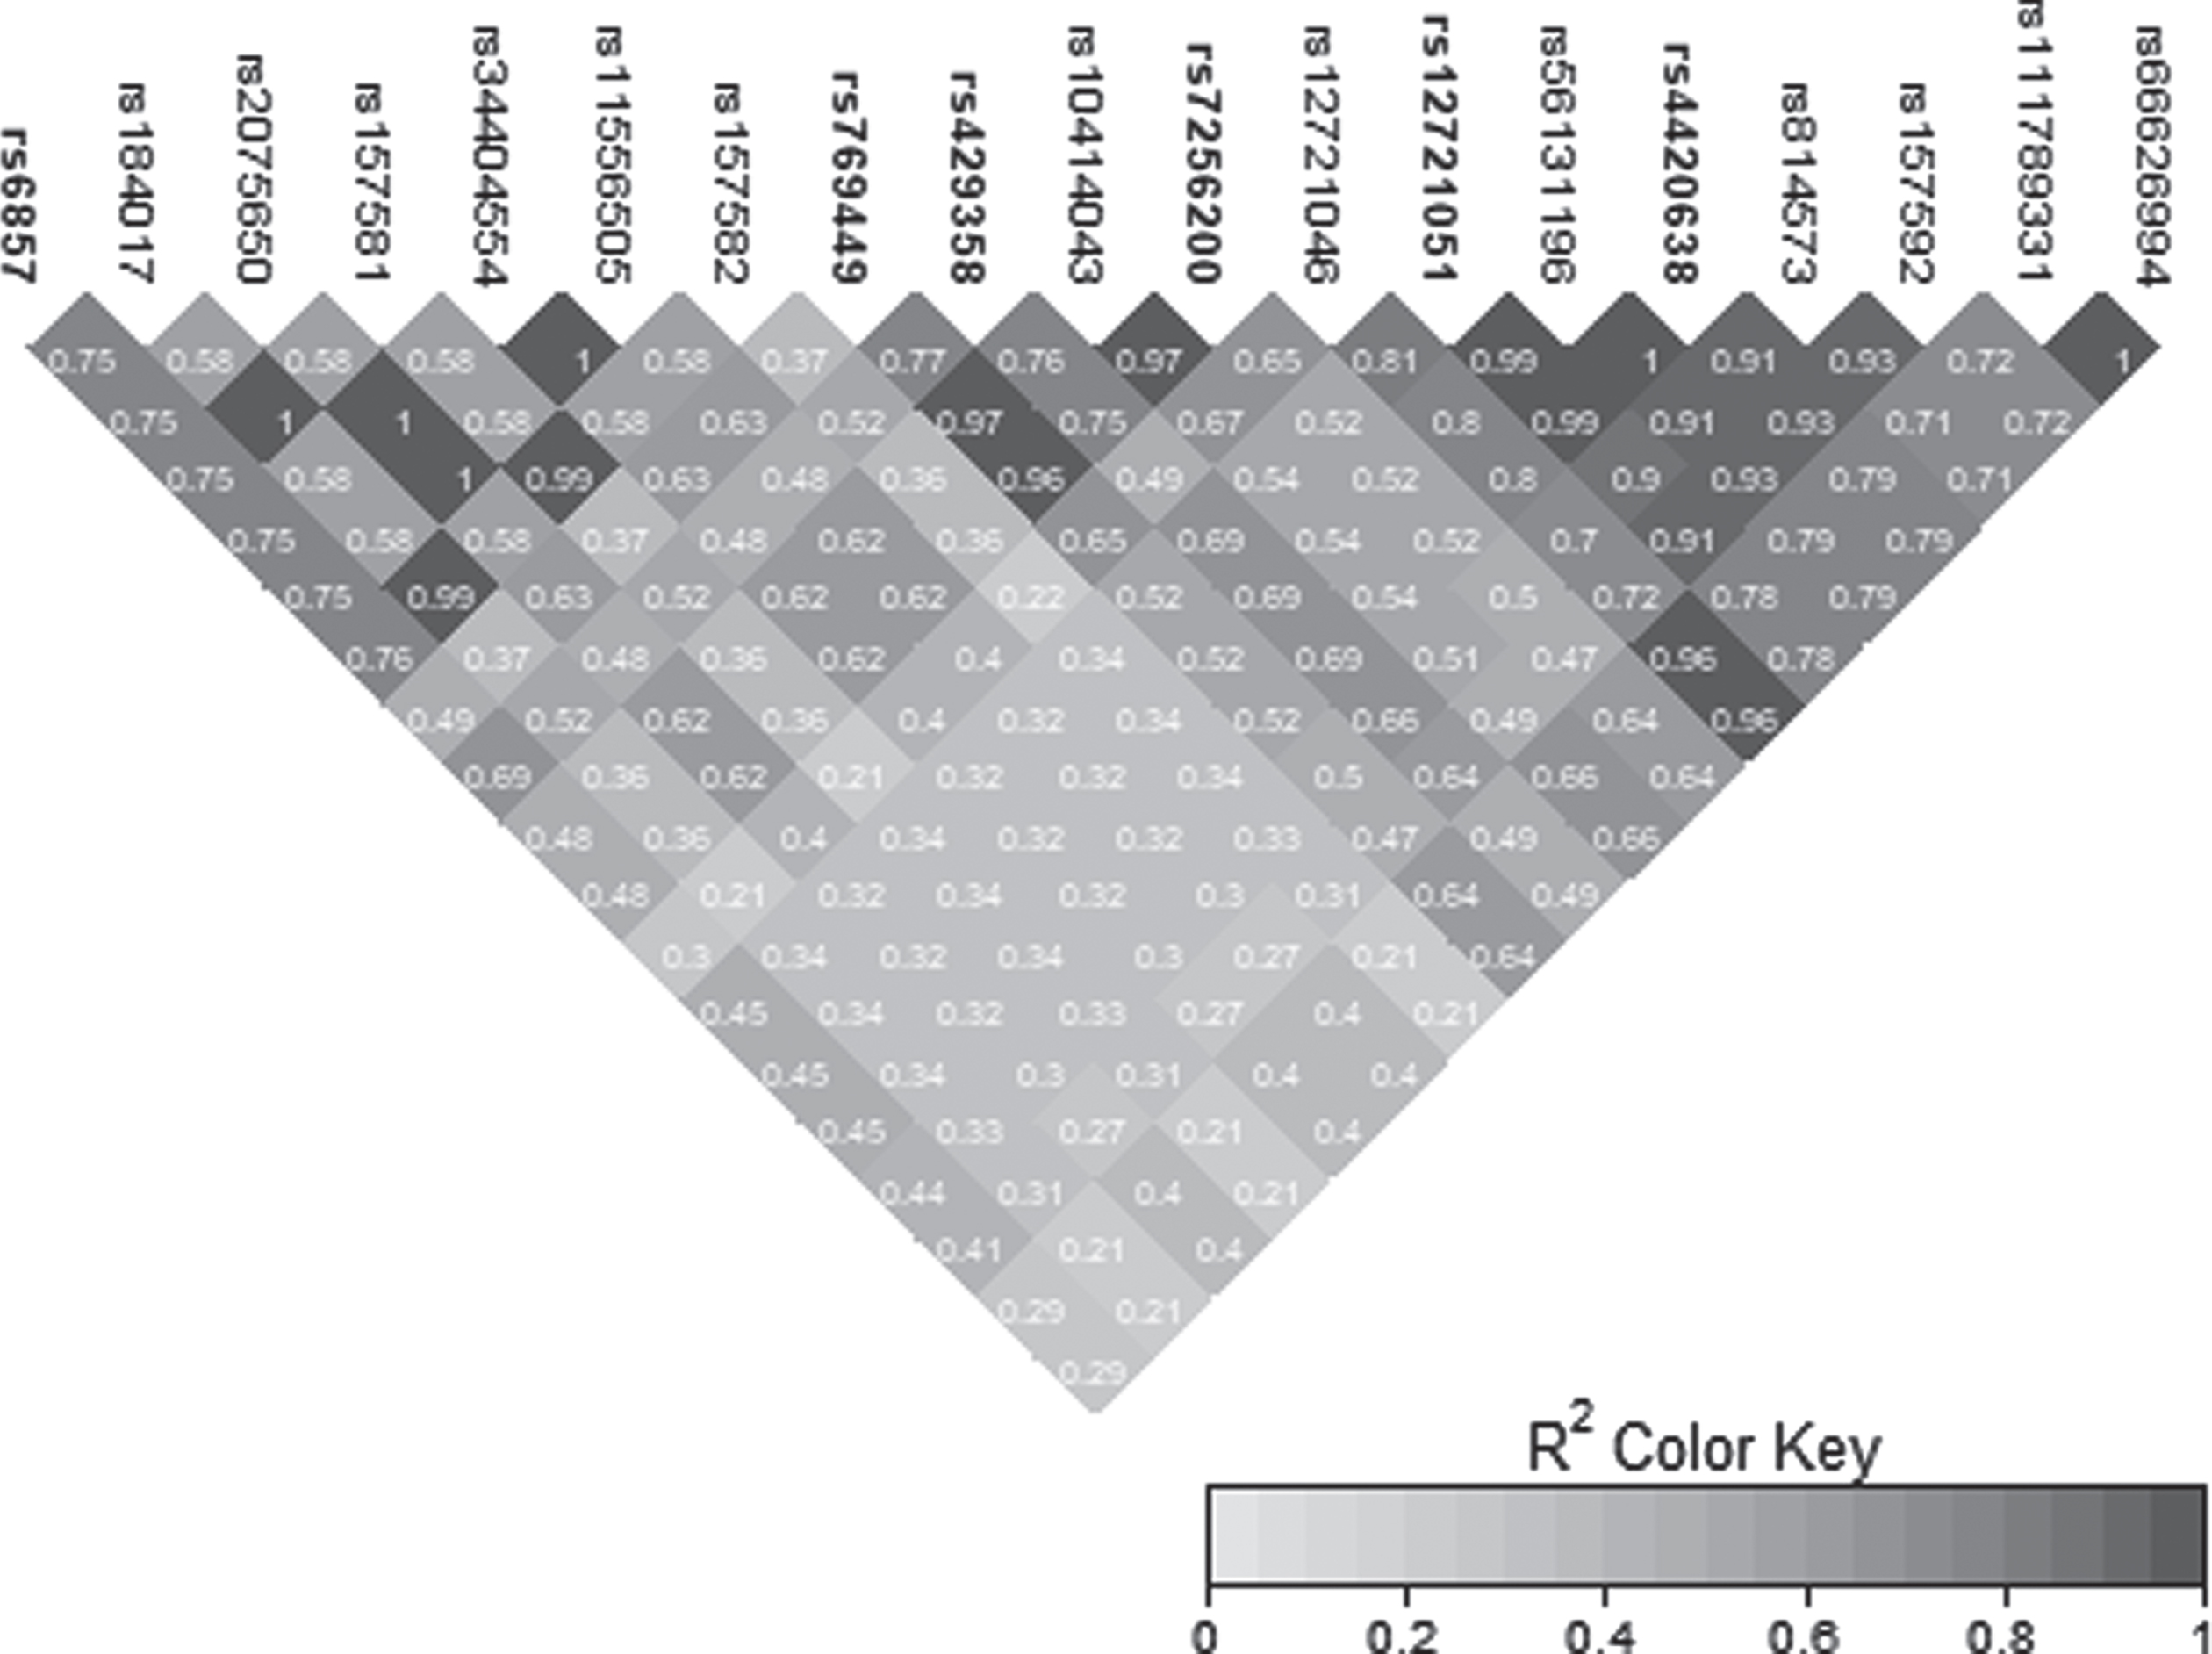
Two genome-wide significant (GWS) signals were observed in the AD Dementia analysis, including the known association on chromosome 19 and a novel signal on chromosome 12 (Fig. 1b). Similar results were observed in the Any Dementia analysis (Supplementary Figure 2; Supplementary Table 3). There were six SNPs in the APOE region that reached the GWS threshold of p < 5E-08 (Table 3). These associations are due to the strong association of APOE*4/rs429358 (OR = 2.22; p = 9.36E-14) with AD and its LD with the surrounding SNPs (Fig. 2).
Table 3
Genome-wide significant SNPs on chromosome 19 and 12 in AD Dementia GWAS analysis
| CHR | SNP | BP | A1 | MAF Cases | MAF Controls | OR (95% CI) | p | LOC | GENE/LOCUS |
| 19 | rs429358 | 45411941 | C | 0.2060 | 0.1099 | 2.217 (1.798–2.733) | 9.356E-14 | Exonic | APOE |
| 19 | rs4420638 | 45422946 | G | 0.2267 | 0.1437 | 1.791 (1.474–2.176) | 4.477E-09 | Down stream | APOC1 |
| 19 | rs12721051 | 45422160 | G | 0.2254 | 0.1435 | 1.785 (1.469–2.169) | 5.575E-09 | Intronic | APOC1 |
| 19 | rs769449 | 45410002 | A | 0.1606 | 0.0891 | 2.027 (1.613–2.546) | 1.278E-09 | Intronic | APOE |
| 19 | rs6857 | 45392254 | T | 0.2189 | 0.1392 | 1.784 (1.463–2.175) | 1.052E-08 | 3’ UTR | NECTIN2 |
| 19 | rs7256200 | 45415935 | T | 0.1580 | 0.0913 | 1.913 (1.526–2.399) | 1.924E-08 | Upstream | APOC1 |
| 12 | rs192213585 | 28918097 | C | 0.0479 | 0.0168 | 3.245 (2.144–4.913) | 2.644E-08 | Intergenic | CCDC91/LOC105369711 |
| 12 | rs148760255 | 28755421 | G | 0.0453 | 0.0152 | 3.408 (2.220–5.233) | 2.087E-08 | Intergenic | CCD91/LOC105369711 |
| 12 | rs148377161 | 28830097 | T | 0.0479 | 0.0163 | 3.312 (2.185–5.019) | 1.661E-08 | Intergenic | CCDC91/LOC105369711 |
CHR, chromosome; SNP, single-nucleotide polymorphism; BP, base-pair position based on GRCh37 assembly; A1, effect allele; MAF, minor allele frequency of the effect allele; OR, odds ratio with 95% confidence interval; LOC, location of the SNP.
Fig. 2
LD heatmap for chromosome 19 signal in the APOE region.
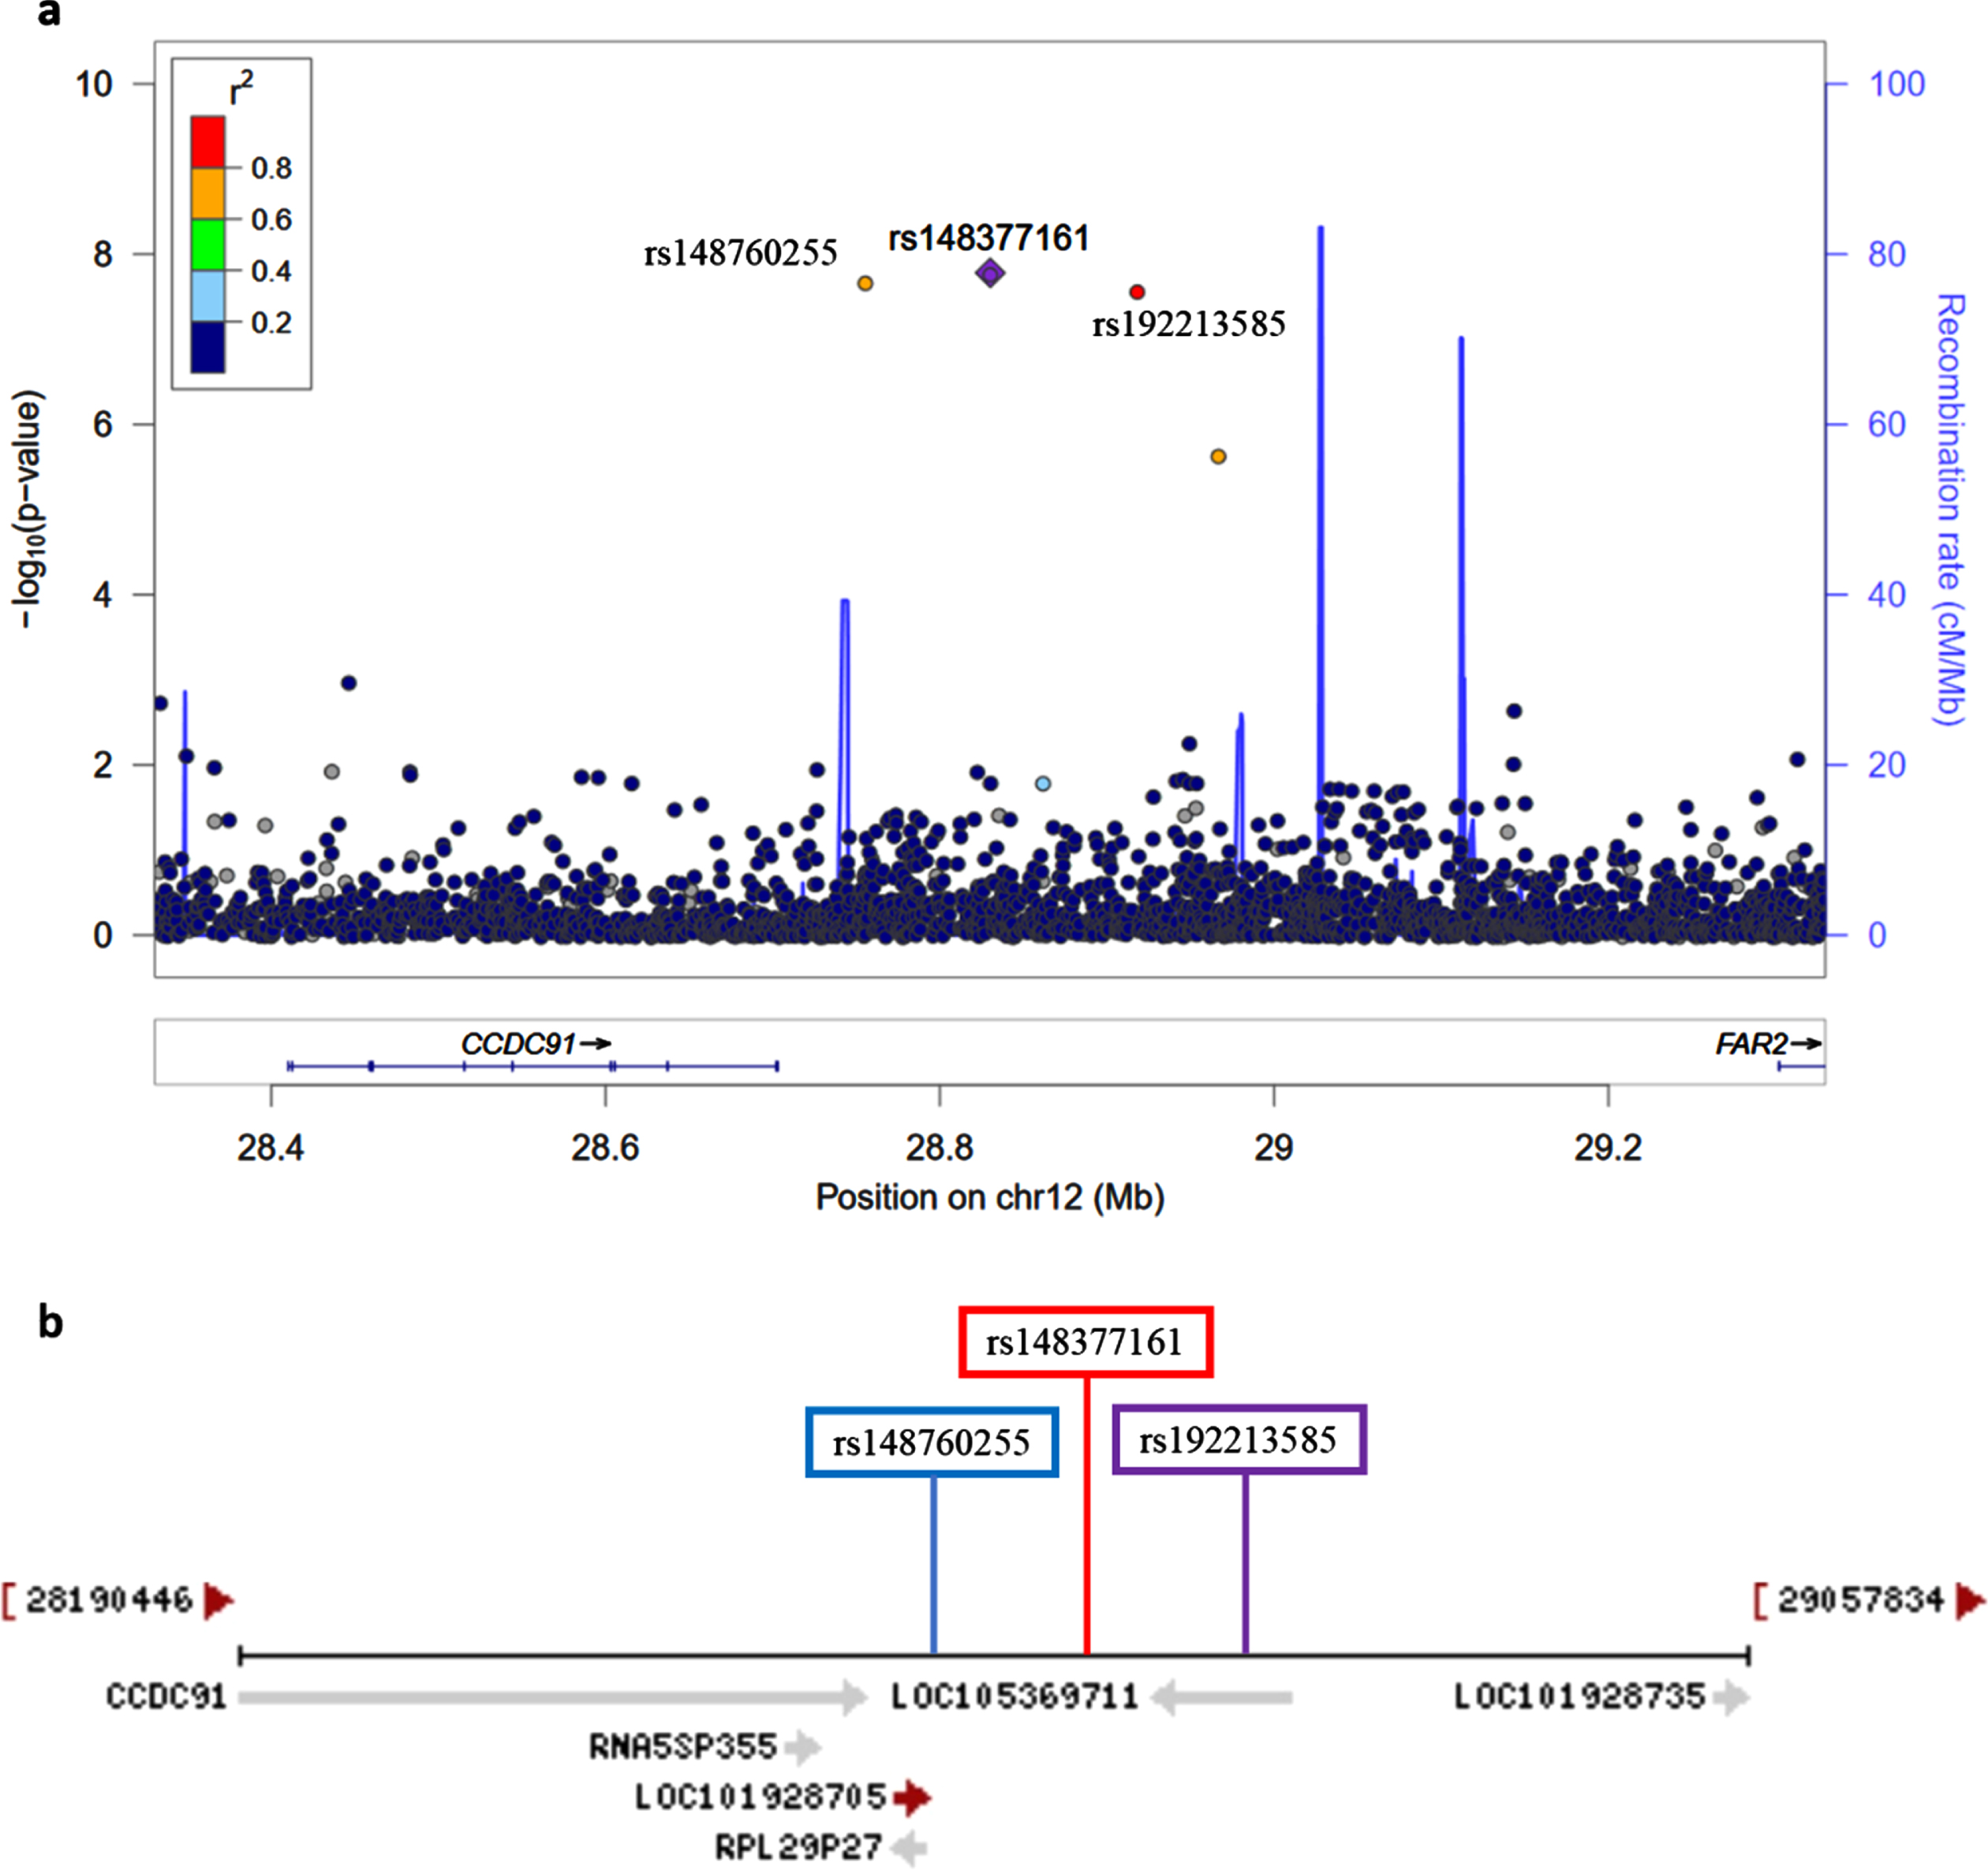
The novel signal observed on chromosome 12 was characterized by three GWS SNPs: rs148377161 (p = 1.66E-08), rs148760255 (p = 2.09E-08), and rs192213585 (p = 2.64E-08) (Table 3). While two of these SNPs were imputed (rs148377161 and rs192213585), rs148760255 was genotyped. The presence of a genotyped SNP in this region reduces the likelihood of this association being caused by an error in imputation. All three SNPs are rare (MAF: 0.019–0.021) and were in LD with each other (pairwise r2 = 0.73, 0.80, 0.83) (Fig. 3). The regional association plot shows that these three SNPs are located near the CCDC91 (coiled-coil domain containing 91) gene such that rs148760255 and s148377161 are located 53 kb and 127 kb, respectively downstream from CCDC91 (Fig. 4a). Based on the NCBI’s gene prediction program Gnomon and GRCh38 assembly (ncbi.nlm.nih.gov/), there are also two predicted non-coding RNAs (ncRNAs) genes, LOC105369711 and LOC101928705, near CCDC91. While rs192213585 is located within LOC105369711, rs148377161 is 61 kb downstream from LOC105369711 and rs148760255 is 24 kb downstream from LOC101928705 (Fig. 4b).
Fig. 3
LD heatmap for chromosome 12 signal in the CCD91/LOC105369711 region.
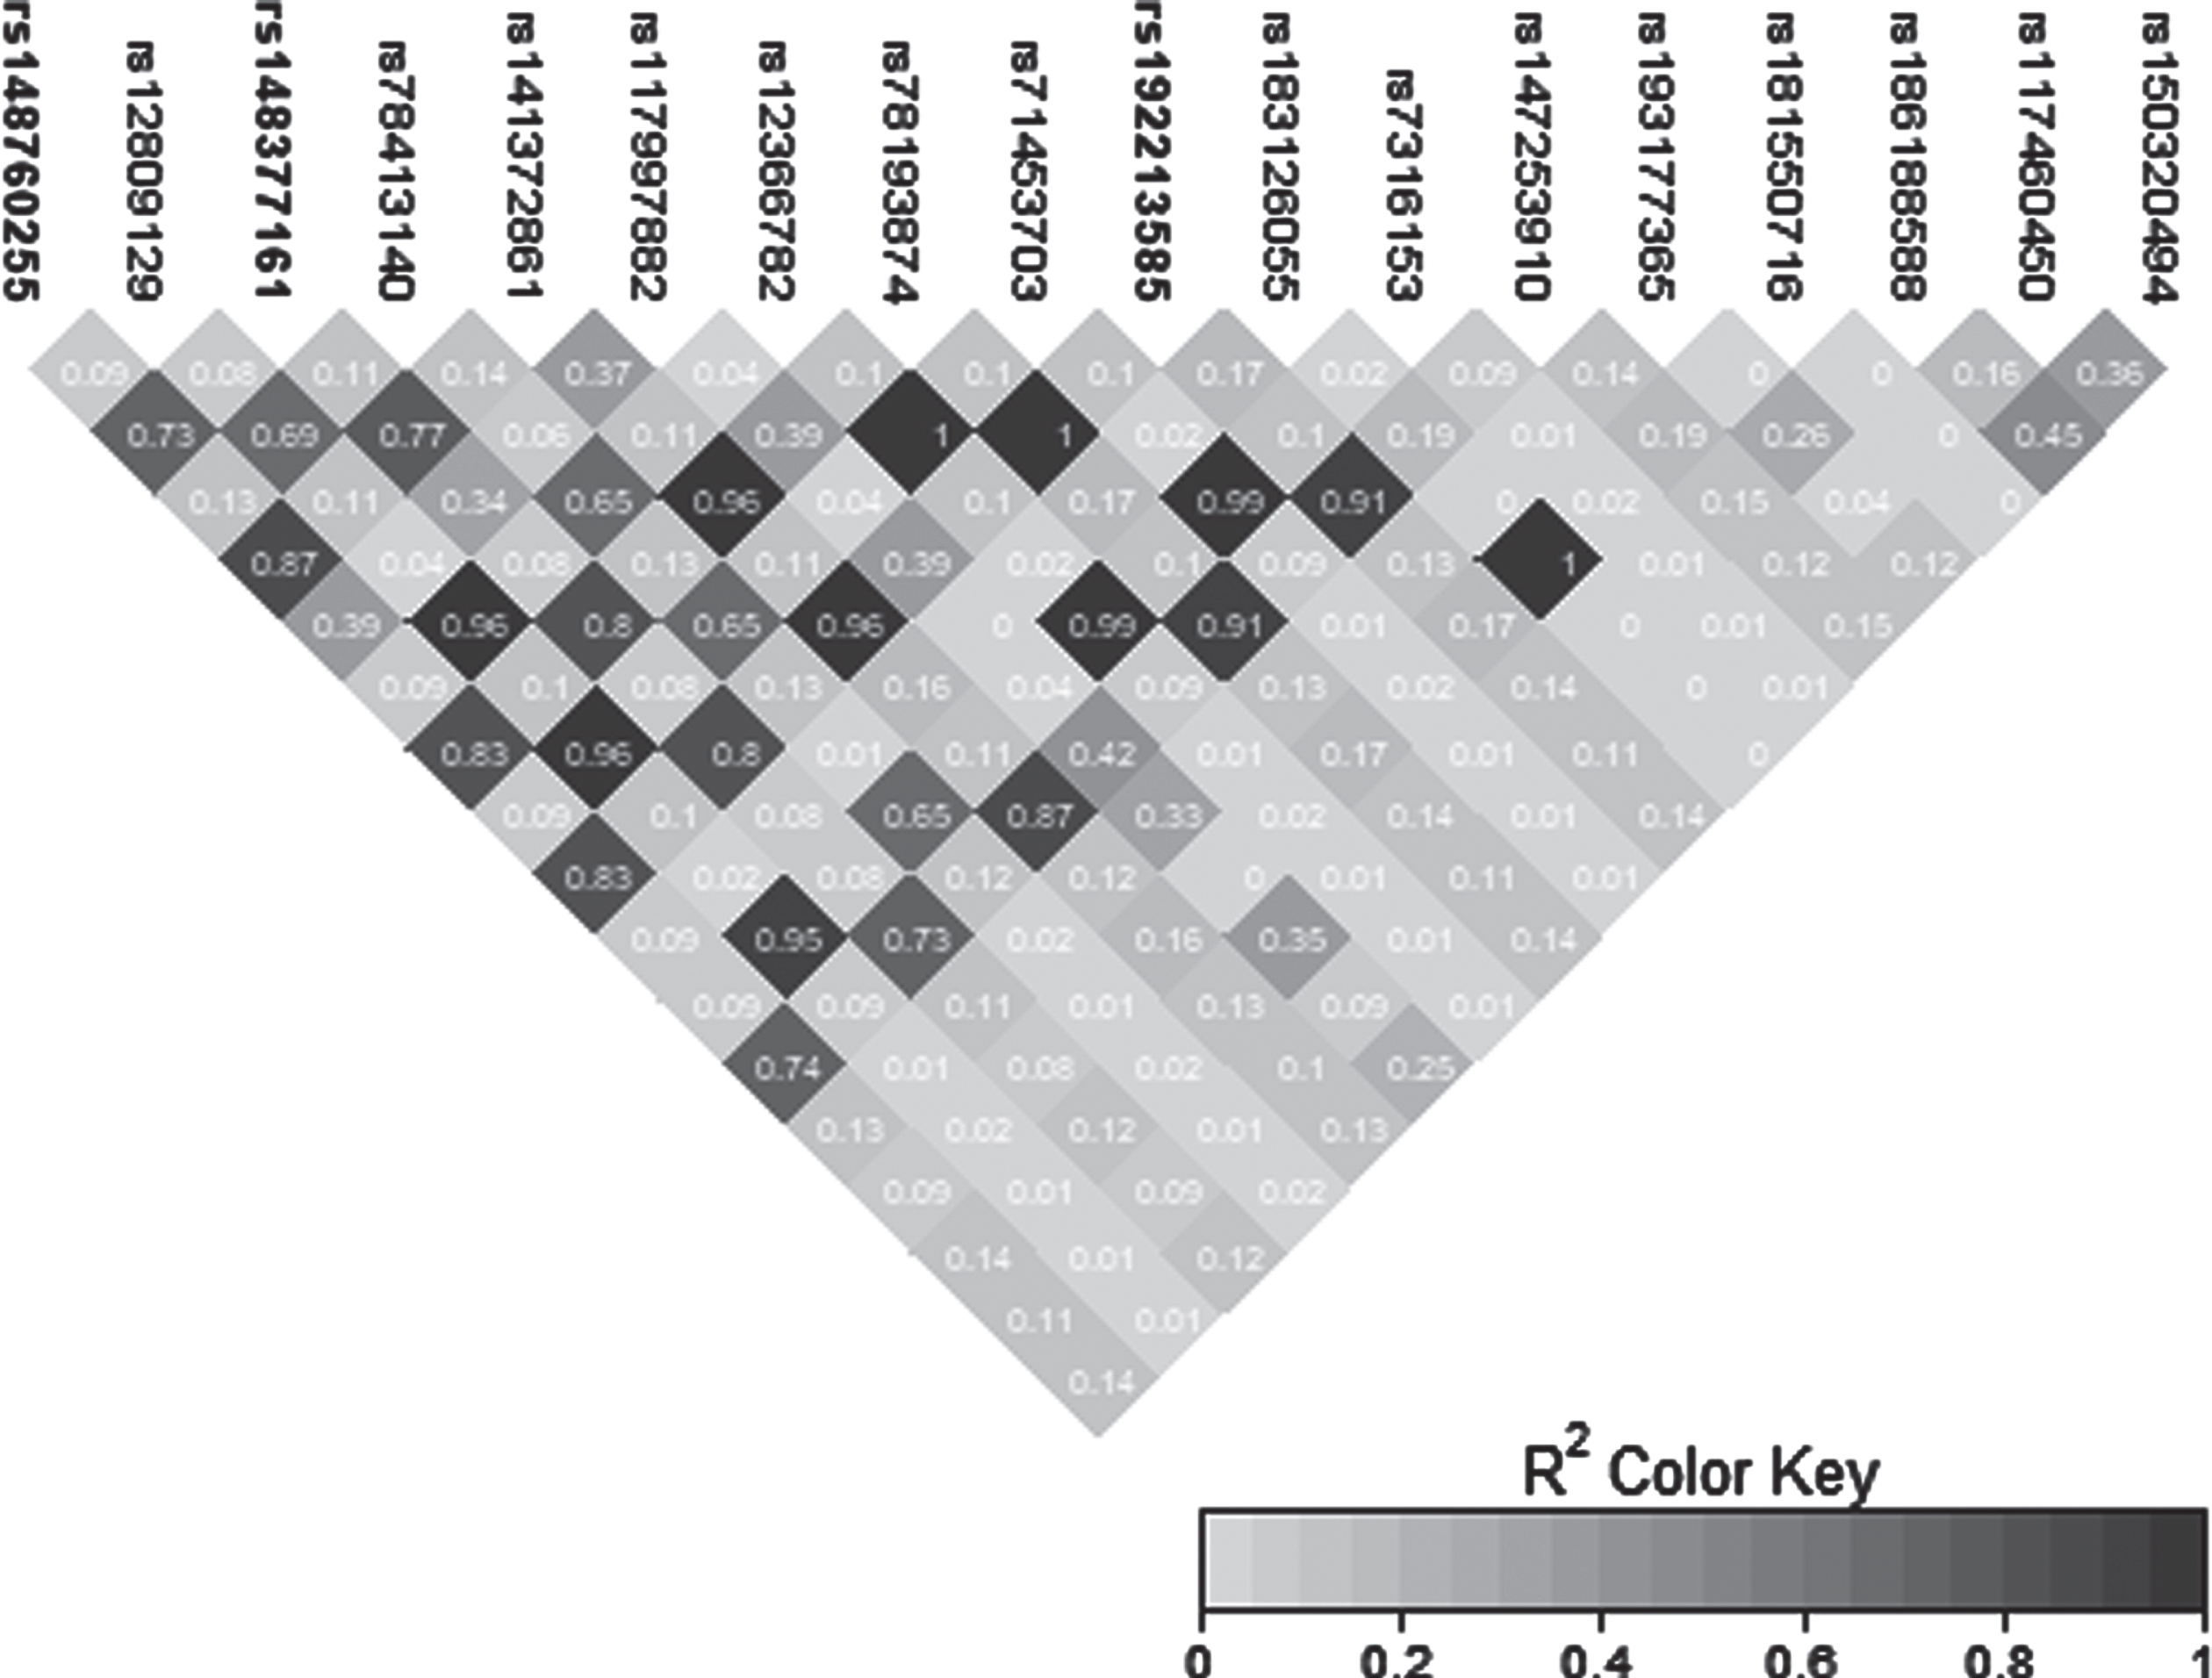
Fig. 4
a) Regional association plot on chromosome 12 centered around the most significant SNP, rs148377161 (p = 1.66E-08) based on GRCh37 assembly. b) Locations of predicted non-coding RNAs genes and three top SNPs relative to CCDC91 based on the NCBI’s gene prediction program Gnomon and GRCh38 assembly.
In order to check replication of the chromosome 12 signal, we examined these SNPs in the International Genomics of Alzheimer’s Project (IGAP) discovery sample of 63,926 subjects [13]. Although the association directions of these SNPs in IGAP were the same, they were not statistically significant (p = 0.862 for rs148377161; p = 0.166 for rs192213585; and p = 0.248 for rs148760255). Because of the strong LD between these SNPs, we expected to observe similar p-values for the three SNPs in the IGAP sample, as we had observed in our sample, but this was not the case. This may be due to inconsistent quality of the imputation in this region obtained in the different sets of samples used inIGAP.
Sex-stratified analysis
Sex-stratified quantile-quantile plots in AD De-mentia and Any Dementia are shown in Supplementary Figures 3–5 and 7, and the Manhattan plot in males in Supplementary Figure 8. The sex-stratified analysis showed GWS at the APOE locus only in females in both the AD Dementia and Any Dementia groups (Fig. 5; Supplementary Figure 6; Table 4; Supplementary Table 4). However, among males, we observed a GWS signal in the AD Dementia analysis on chromosome 1 with rs140076909 (OR = 4.51, 95% CI: 2.64–7.70; p = 3.72E-08) (Fig. 6a; Table 4). Although this SNP did not achieve the GWS threshold in Any Dementia males, the strength of association was similar with an OR of 4.13 (95% CI: 2.42–7.03; p = 1.94E-07) (Supplementary Table 4). The top SNP, rs140076909, is located 70 kb downstream of ncRNA LOC729987 and 319 kb upstream from SNX7 (Sorting Nexin 7) (Fig. 6a). Another SNP, rs117803234, located on chromosome 7 almost reached GWS in males (p = 6.93E-08; Fig. 6b; Table 4), which is located 18 kb upstream from a pseudogene LOC100131257 and 66 kb upstream from C1GALT1 (core 1 synthase, glycoprotein-N-acetylgalactosamine 3-beta-galactosyltransferase 1). Based on the NCBI’s gene prediction program Gnomon and GRCh38 assembly, rs117803234 is 11 kb downstream of a predicted ncRNA LOC105375138 as well as a cis-regulatory element, LOC116183083 (Fig. 6c). These SNPs were also examined in the available sex-combined data from the IGAP GWAS, but neither rs140076909 (p = 0.823) nor rs117803234 (p = 0.695) was significant. The equivalent sex-combined p-values in our study were: rs140076909 (p = 1.93E-04 in AD Dementia; p = 8.99E-04 in Any Dementia), rs117803234 (p = 4.69E-03 in AD Dementia; p = 6.05E-03 in Any Dementia).
Fig. 5
a) Manhattan plot showing genome-wide p-values for the association of Alzheimer’s Dementia in females. The threshold for genome-wide significance (p < 5E-08) is indicated by the red line and the threshold for suggestive significance (p < 1E-05) is indicated by the blue line. b) Manhattan plot showing genome-wide p-values for the association of Alzheimer’s Dementia in males. The threshold for genome-wide significance (p < 5E-08) is indicated by the red line and the threshold for suggestive significance (p < 1E-05) is indicated by the blue line.
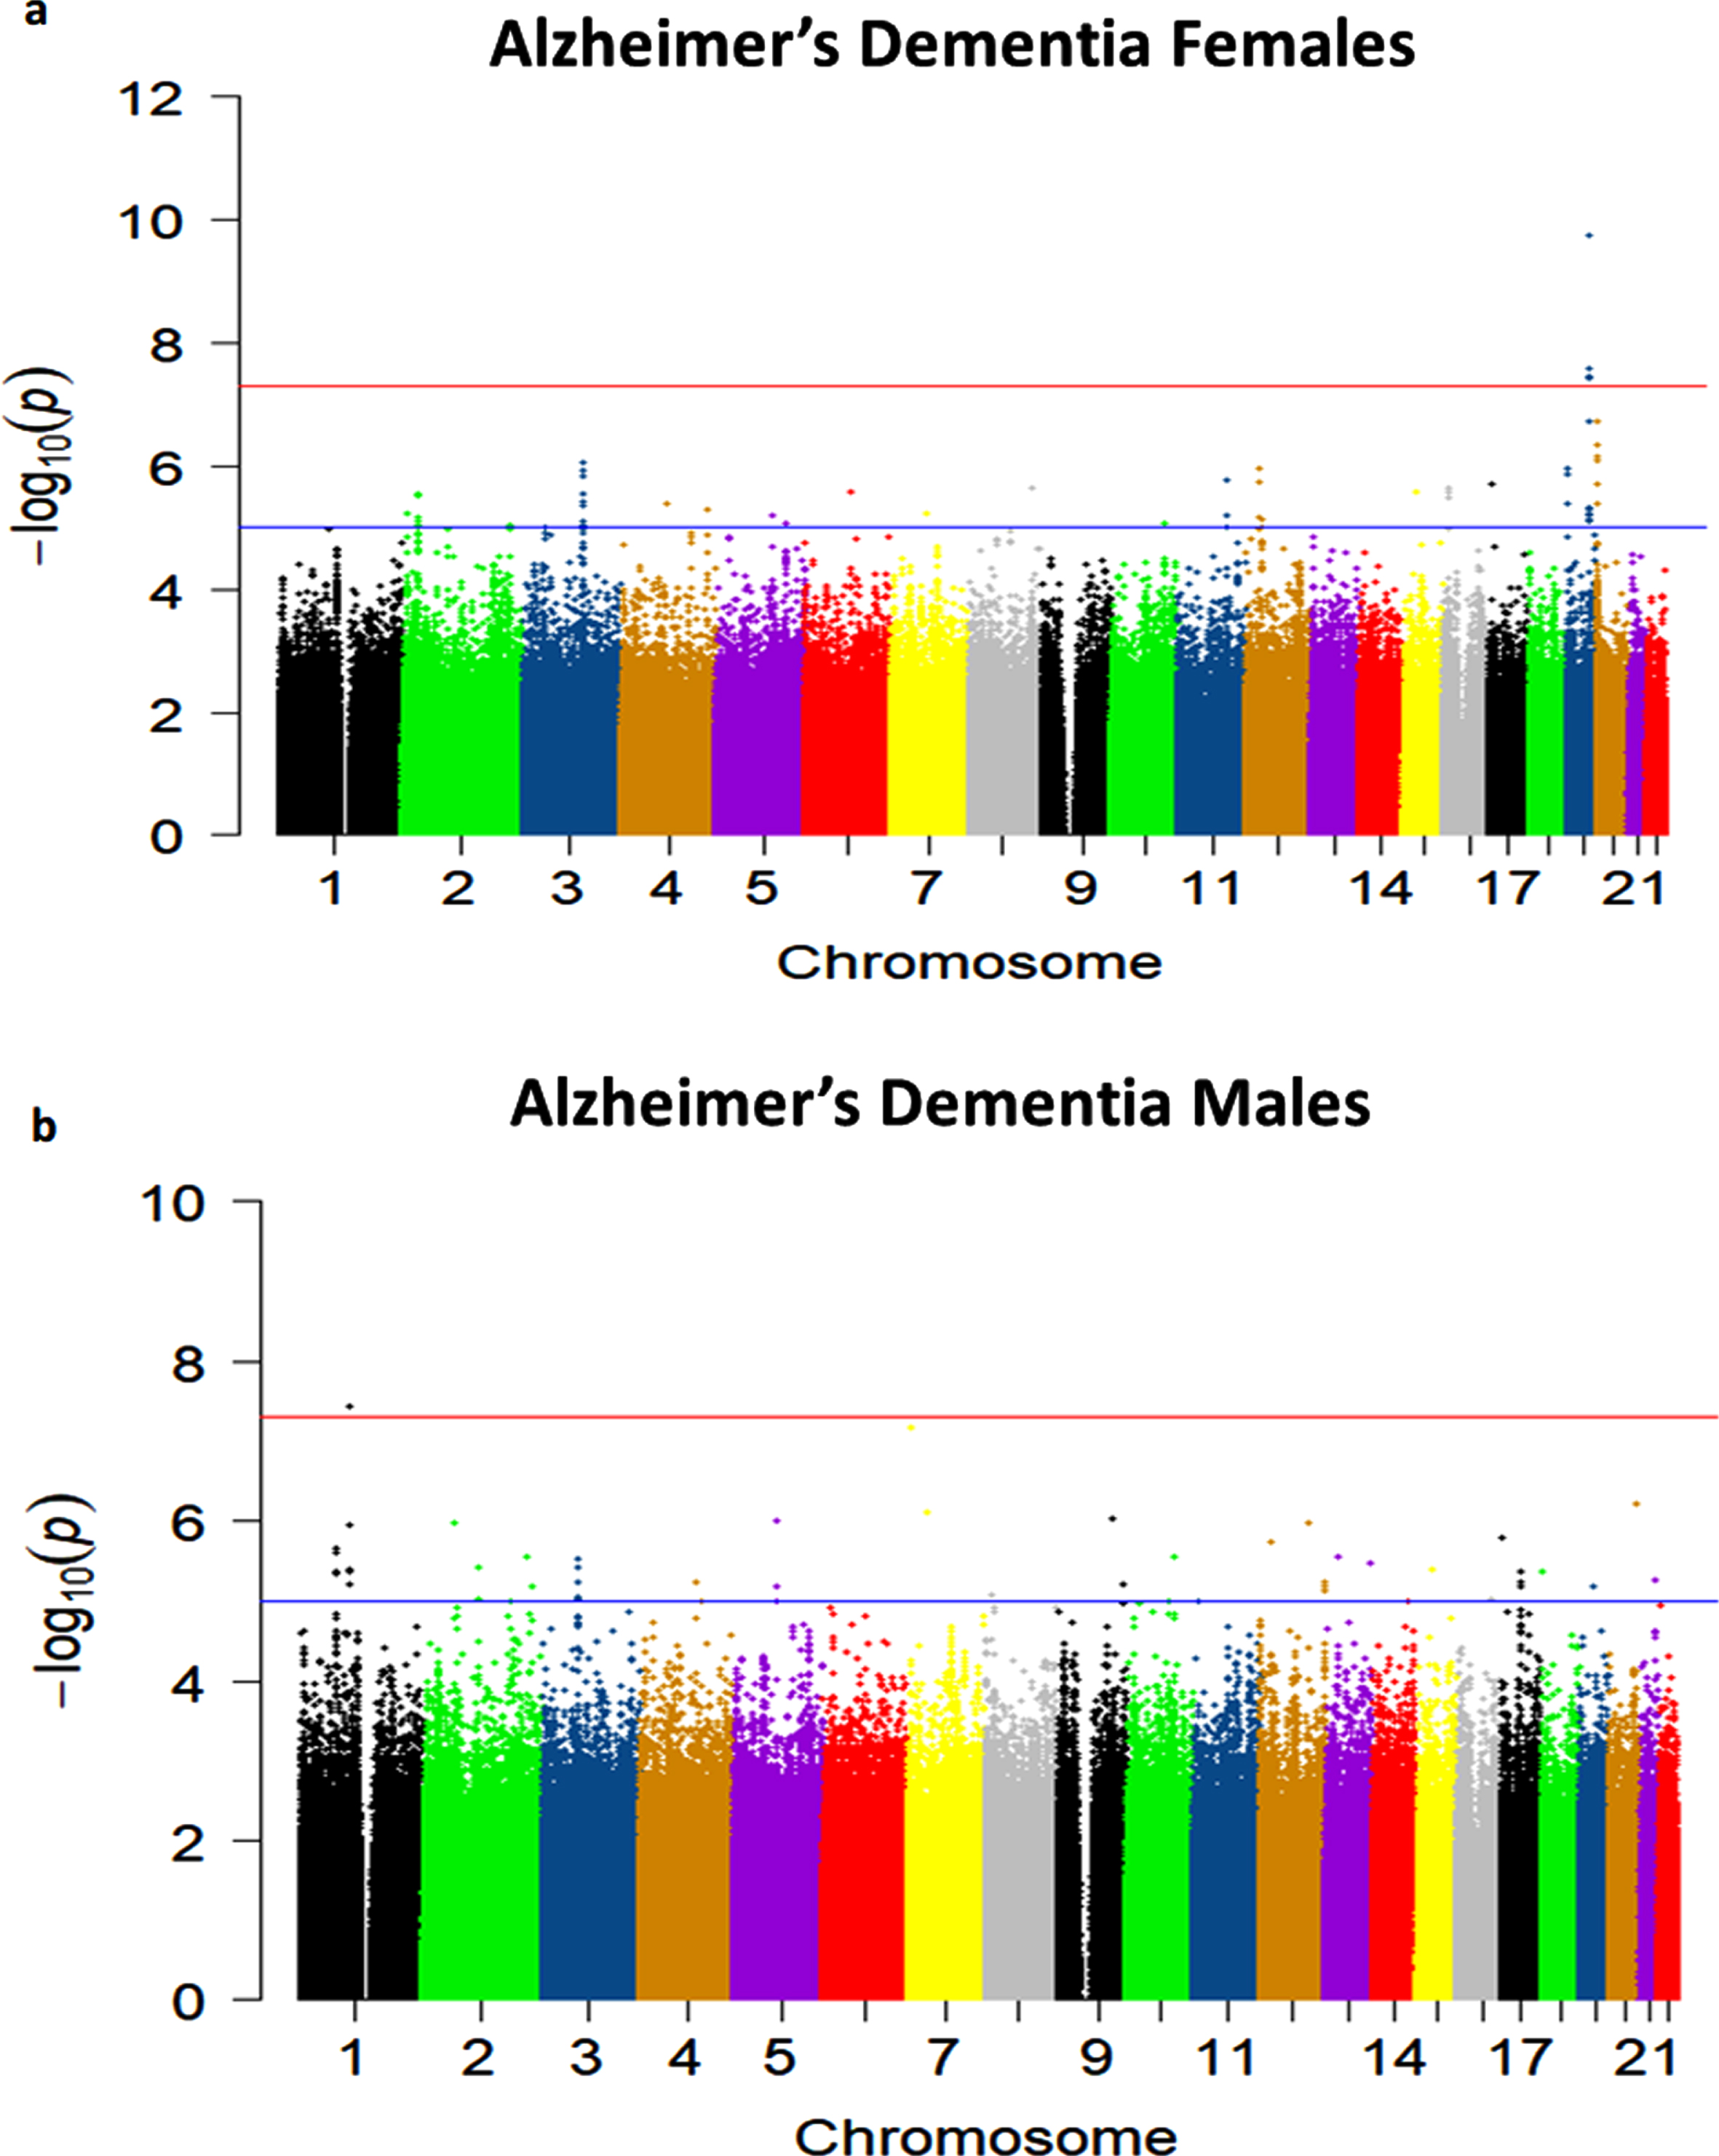
Table 4
AD Dementia sex-stratified analysis
| AD males | AD females | |||||||||||
| CHR | SNP | BP | MAF cases | MAF controls | OR (95% CI) | p | MAF cases | MAF controls | OR (95% CI) | p | LOC | GENE/LOCUS |
| 1 | rs140076909 | 98808256 | 0.0614 | 0.0150 | 4.506 (2.636–7.702) | 3.72E-08 | 0.0137 | 0.0199 | 0.6622 (0.261–1.678) | 0.3849 | Intergenic | LOC729987/ SNX7 |
| 7 | rs117803234 | 7155404 | 0.0711 | 0.0195 | 3.765 (2.325–6.096) | 6.936E-08 | 0.0082 | 0.0286 | 0.2777 (0.086–0.895) | 0.03183 | Intergenic | LOC100131257/ C1GALT1 |
| 12 | rs148760255 | 28755421 | 0.0417 | 0.0179 | 2.578 (1.436–4.631) | 1.523E-03 | 0.0495 | 0.0118 | 4.876 (2.545–9.340) | 1.785E-06 | Intergenic | CCDC91/ LOC105369711 |
| 12 | rs148377161 | 28830097 | 0.0417 | 0.0183 | 2.500 (1.395–4.482) | 2.090E-03 | 0.0549 | 0.0138 | 4.537 (2.469–8.336) | 1.104E-06 | Intergenic | CCDC91/ LOC105369711 |
| 12 | rs192213585 | 28918097 | 0.0441 | 0.0183 | 2.679 (1.510–4.753) | 7.565E-04 | 0.0522 | 0.0148 | 4.066 (2.207–7.493) | 6.865E-06 | Intergenic | CCDC91/ LOC105369711 |
| 19 | rs429358 | 45411941 | 0.1789 | 0.1075 | 1.875 (1.400–2.511) | 2.433E-05 | 0.2363 | 0.1130 | 2.722 (2.002–3.703) | 1.740E-10 | Exonic | APOE |
| 19 | rs769449 | 45410002 | 0.1373 | 0.0888 | 1.662 (1.206–2.290) | 0.001909 | 0.1868 | 0.0895 | 2.568 (1.842–3.580) | 2.697E-08 | Intronic | APOE |
CHR, chromosome; SNP, single-nucleotide polymorphism; BP, base-pair position based on GRCh37 assembly; A1, effect allele; MAF, minor allele frequency of the effect allele; OR, odds ratio with 95% confidence interval; LOC, location of the SNP.
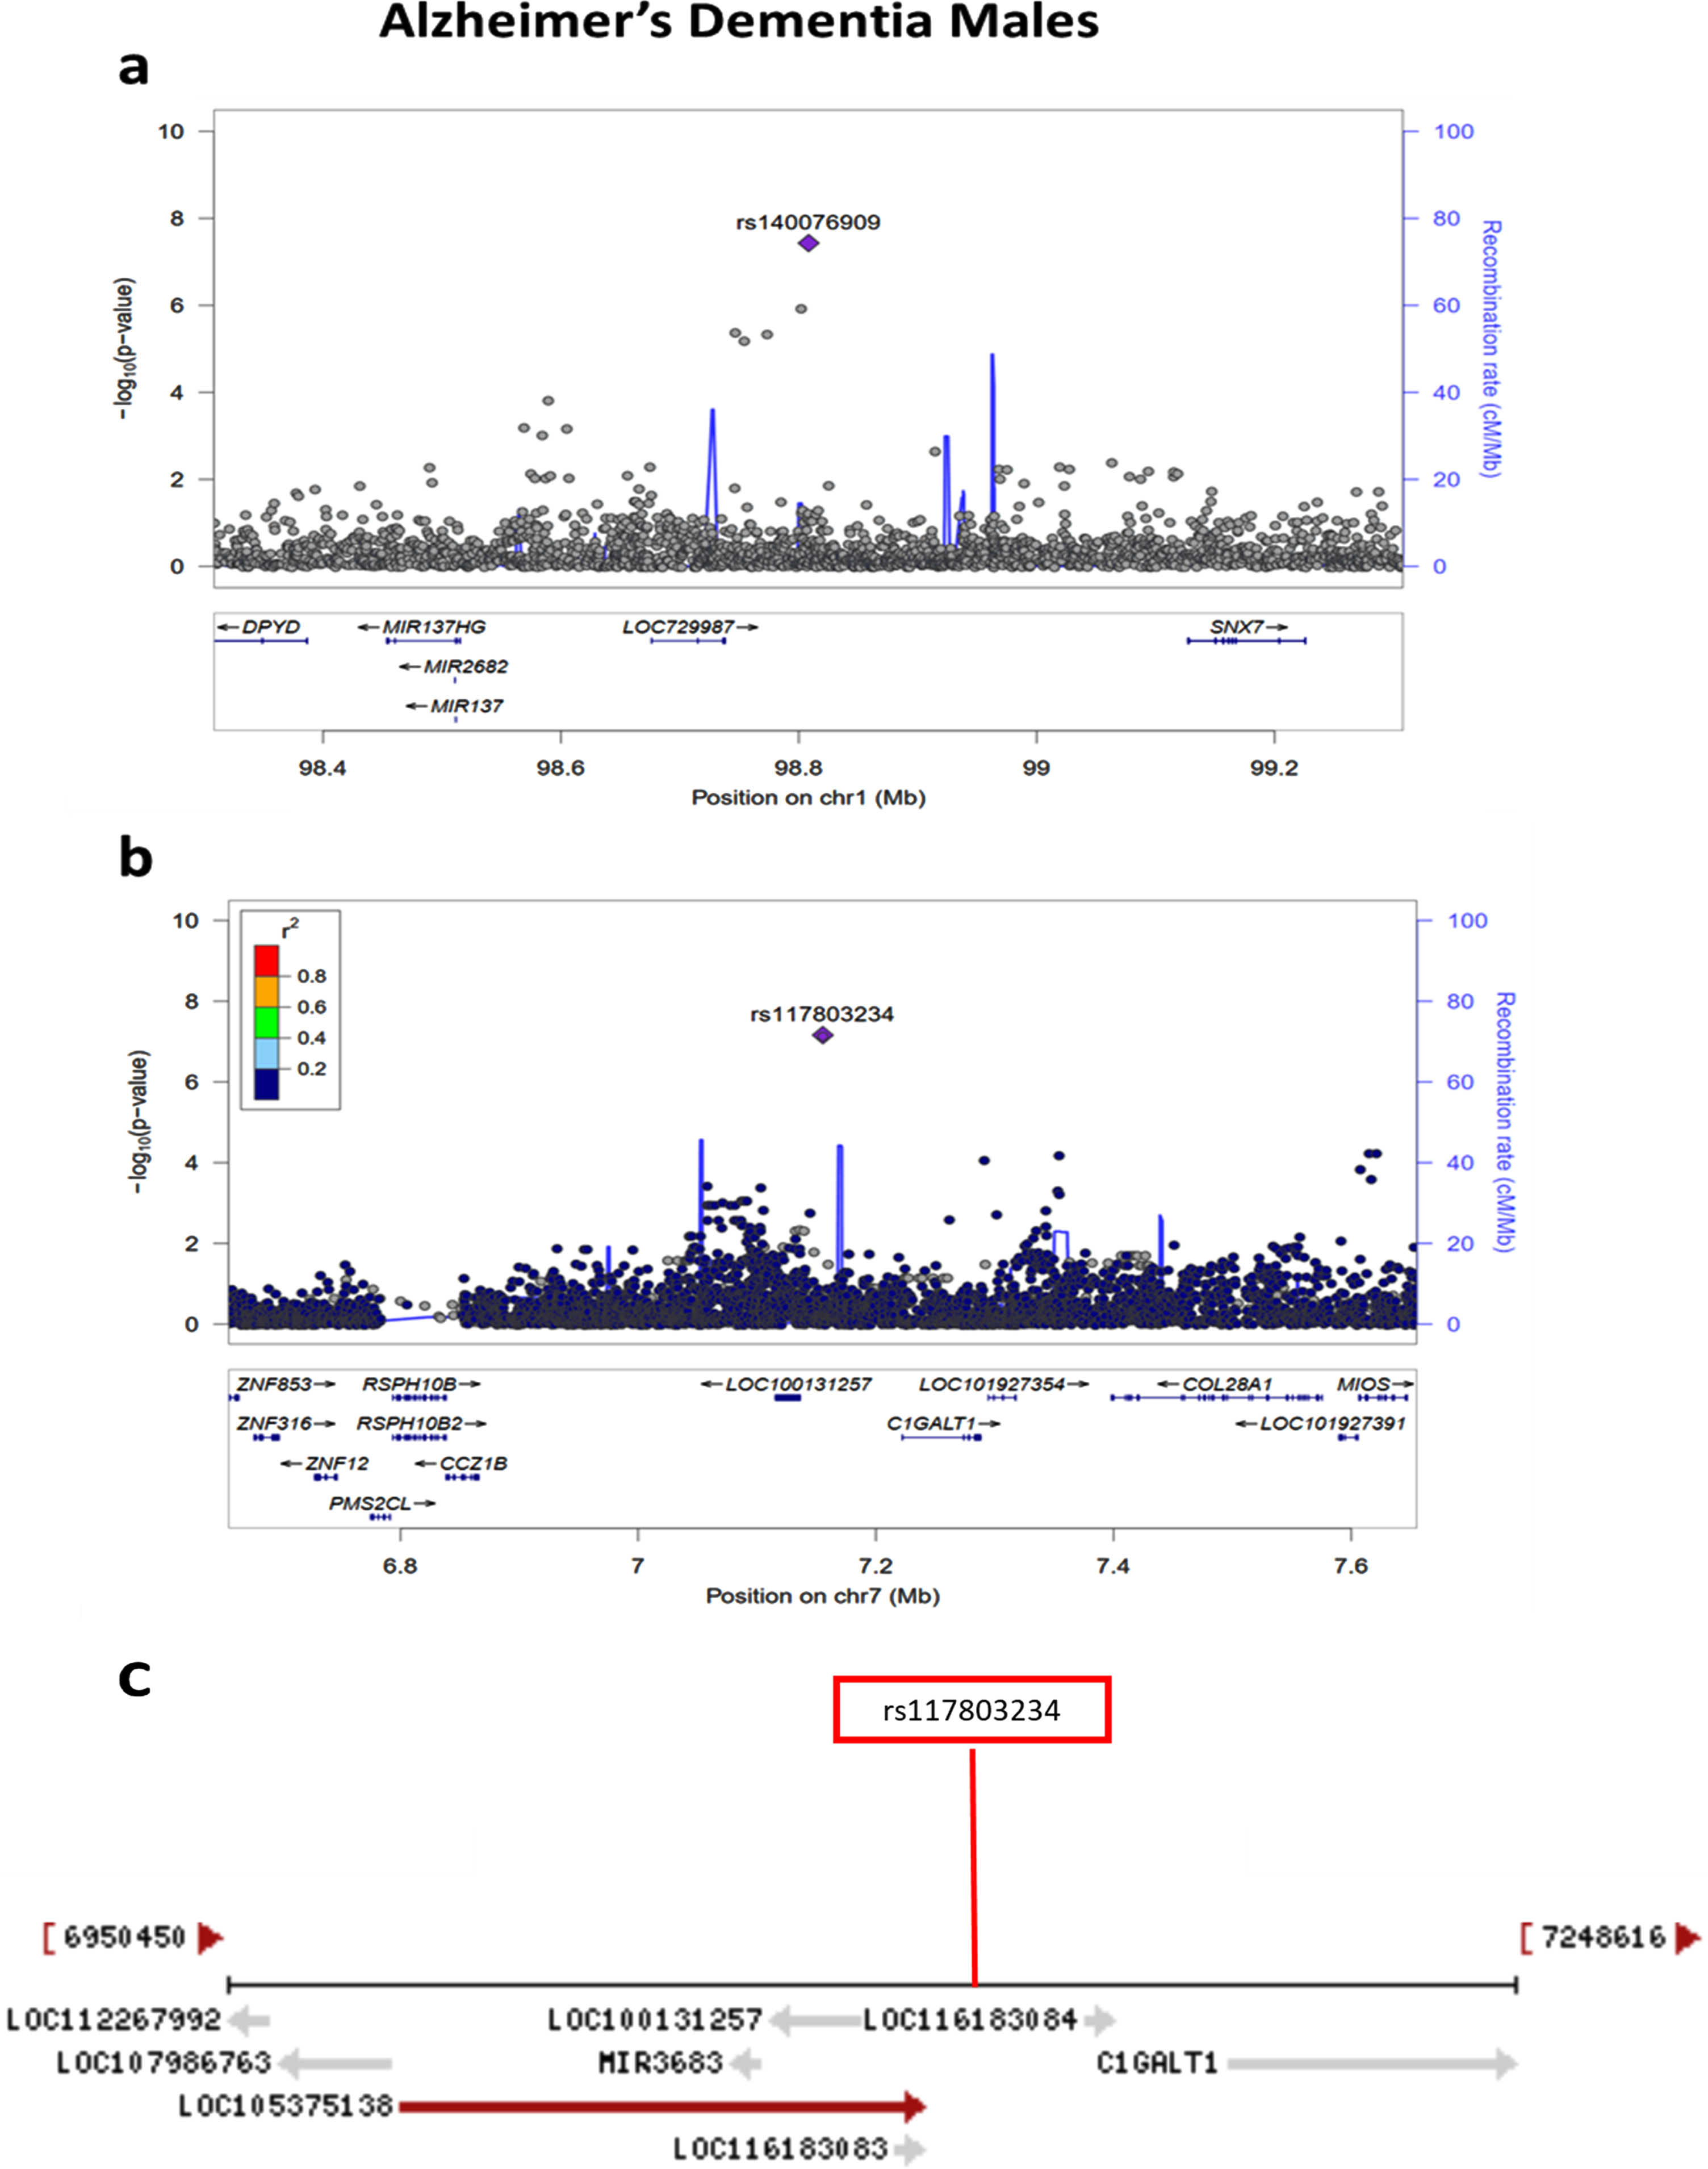
Fig. 6
a) Regional association plot on chromosome 1 centered around the most significant SNP, rs140076909 (p = 3.72E-08) based on GRCh37 assembly. b) Regional association plot on chromosome 7 centered around the most significant SNP, rs117803234 (p = 6.93E-08) based on GRCh37 assembly. c) Locations of predicted genes and top SNP, rs117803234 relative to LOC100131257, LOC105375138, and LOC116183083 based on the NCBI’s gene prediction program Gnomon and GRCh38 assembly.
APOE*4 and non-APOE*4-stratified analyses
The results of APOE*4 stratified analyses are presented in Supplementary Tables 5–8 and Supplementary Figures 9–14. Although there were no GWS signals, multiple suggestive associations (p < 1E-05) were observed in both APOE*4 and non-APOE*4 carriers. There were three most significant associations among non-APOE*4 carriers in AD Dementia: HSP90AA6P/rs111618415, p = 1.89E-07 on chromo-some 4; RPL29P13/rs187039392, p = 8.98E-07 on chromosome 5 and BORCS5/rs556343211, p = 8.61E-07 on chromosome 12 (Supplementary Table 8). Likewise, two most significant associations were observed among non-APOE*4 carriers in Any Dementia: IRF2BP2/rs35581844, p = 2.22E-07 on chromosome 1; and LOC100507053/rs29001236, p = 7.74E-07 on chromosome 4 (Supplementary Table 8).
Bioinformatics analyses
Next, the significant SNPs on chromosome 12 locus as well as the sex-stratified significant SNPs on chromosome 1 and 7 locus were examined to determine their possible functional significance (Supple-mentary Table 9). Using data from the Genotype-Tissue Expression (GTEx) v8 database these SNPs were investigated for any single-tissue eQTLs. None of these SNPs from these three loci had any significant eQTLs in any tissue. These SNPs were also investigated in the RegulomeDB database where a lower number rank on a scale of 1–7 indicates higher evidence for regulatory function and a higher probability score on a scale of 1–2 indicates a higher probability of regulatory function. The RegulomeDB score for these SNPs ranged from 4–6, indicating a lower probability of regulatory function. CADD scores were obtained for these five SNPs where a higher score indicates a higher level of deleteriousness. The highest CADD score of 4.32 was observed for the top chromosome 1 SNP, rs140076909. We also examined four SNPs in LD with the top SNPs on chromosomes 1 and 12. One SNP on chromosome 1 (rs184006746) in LD with the top SNP (R2 = 0.76) had a RegulomeDB score of 3a, indicating a 65% probability of being regulatory function. This SNP also showed the second highest CADD score of 3.49 (Supplementary Table 9).
DISCUSSION
In this community-based sample of older White subjects, we have confirmed the established association of APOE*4 with AD Dementia where ORs with one and two copies of APOE*4 were 2.22 and 4.92, respectively. This observation is similar to the majority of reported associations in community-based White populations [14], but weaker than the reported ORs of about 3.5 with one copy of APOE*4 and 14.5 with two copies of APOE*4 in standard case-control studies among Whites [15, 16] where AD cases are largely derived from AD centers having moderate to severe AD compared to the mild dementias in community-based cohorts. We also found that the association of APOE*4 is stronger in females (OR = 2.72; p = 1.74E-10) than in males (OR = 1.88; p = 2.43E-05) in the GEM sample. A previous study found a similar sex difference in APOE*4 association, though the effect size was not statistically significant between females (OR = 3.66; p = 1.78E-215) and males (OR = 3.25; p = 5.04E-122) [17]. Of the other known AD loci, reported SNPs near or at OR2B2, HS3ST5, GPR141, CTSB, CCDC6, MS4A6A/MS4A4E, PICALM, APH1B, PLCG2, and ABCA7 were also replicated in this study at nominal significance.
We have identified a novel GWS locus on chromosome 12 in this community-based sample of older subjects. However, this finding was not replicated in the IGAP-2019 data. The lack of replication may be due to a false-positive association observed in this small sample of AD subjects. Alternatively, this is a real association in a unique older sample with incident dementia that needs to be confirmed in an equivalent older and community-based sample. The three GWS SNPs on chromosome 12 are located near CCDC91. These SNPs lacked evidence of being significant eQTLs and had relatively low CADD scores. The RegulomeDB ranks of two of these SNPs, however, were 5, indicating a transcription factor binding location or a DNase peak, which is correlated with transcriptional activity. Most importantly, there are two predicted ncRNA genes, LOC105369711 and LOC101928705, near CCDC91 where one of the three top SNPs (rs192213585) is located within LOC105369711, and the other two SNPs are only 24–61 kb downstream from these ncRNA genes. In the sex-stratified analysis, we also identified two novel loci near ncRNA LOC729987 on chromosome 1 and ncRNA LOC105375138 on chromosome 7 in males. ncRNAs are relatively new classes of RNA that are broadly divided into small ncRNAs (< 200 nucleotides), including microRNAs and piwi-interacting RNAs, and long ncRNAs (> 200 nucleotides) including circular and linear RNAs. These ncRNAs have the ability to regulate gene expression and affect metabolic pathways and have been implicated in neurodegenerative diseases [18–21]. Although we have not come across any published paper about the roles of these ncRNAs, based on the NCBI HPA RNA-seq data in normal tissues (ncbi.nlm.nih.gov/), all four ncRNA genes (LOC105369711, LOC101928705, LOC729987, and LOC105375138) are expressed in the brain and thus may be relevant to AD Dementia. Additional genetic and functional studies are necessary to delineate the roles of these ncRNAs.
These novel signals have not been previously associated with AD, which is surprising given the relatively large sample sizes of recent AD GWAS compared to the size of the GEM sample. The uniqueness of the GEM cohort may have contributed to the identification of novel signals despite its relatively modest sample size. First, the association of APOE*4 in this sample is modest as compared to in standard AD case-control studies and the association of APOE*2 was also not statistically significant. Second, this is a sample of older adults with age > 75, suggesting that the association signals observed here may be associated specifically with the development of dementia at a more advanced age. Third, the participants in the GEM study developed incident dementia over a longer period of time than a typical community-based study, indicating the presence of potential resilience factors and their interaction with the genetic background. Typically, cases used in GWAS of AD are derived from AD centers or similar referral centers with an already established diagnosis. This suggests that the associations observed here may be more relevant to the development of dementia over time rather than the state of having dementia.
In conclusion, our genome-wide analyses on a unique community-based sample of older subjects have identified three novel loci associated with incident dementia, in addition to APOE. The novel loci are located near ncRNAs genes with potential regulatory effects. Further genetic and functional characterization of these regions would help to elucidate these associations with AD. These novel associations should be considered provisional until replicated in larger and older incident dementia cases derived from community-based studies. Our study suggests that the use of similar samples of older adults who have developed incident dementia over time may be a helpful tool in unraveling novel genetic associations normally not seen in highly selected cases derived from AD centers or similar referral centers.
ACKNOWLEDGMENTS
This study was supported by the National Institute on Aging (NIA) grants AG030653, AG041718, and AG064877. A subset of samples used in this study were obtained from the National Centralized Repository for Alzheimer’s Disease and Related Dementia (NCRAD), which receives government support under a cooperative agreement grant (U24 AG021886) awarded by the NIA. We thank contributors who collected samples used in this study, as well as patients and their families, whose help and participation made this work possible. This publication was made possible by Grant Number U01 AT000162 from the National Center for Complementary and Alternative Medicine, National Institutes of Health.
Authors’ disclosures available online (https://www.j-alz.com/manuscript-disclosures/22-0293r1).
SUPPLEMENTARY MATERIAL
[1] The supplementary material is available in the electronic version of this article: https://dx.doi.org/10.3233/JAD-220293.
REFERENCES
[1] | 2021 Alzheimer’s disease facts and figures ((2021) ), Alzheimers Dement 17: , 327–406. |
[2] | Gatz M , Reynolds CA , Fratiglioni L , Johansson B , Mortimer JA , Berg S , Fiske A , Pedersen NL ((2006) ) Role of genes and environments for explaining Alzheimer disease. Arch Gen Psychiatry 63: , 168–174. |
[3] | Wingo TS , Lah JJ , Levey AI , Cutler DJ ((2012) ) Autosomal recessive causes likely in early-onset Alzheimer disease. Arch Neurol 69: , 59–64. |
[4] | Ridge PG , Hoyt KB , Boehme K , Mukherjee S , Crane PK , Haines JL , Mayeux R , Farrer LA , Pericak-Vance MA , Schellenberg GD , Kauwe JSK ((2016) ) Assessment of the genetic variance of late-onset Alzheimer’s disease. Neurobiol Aging 41: , 200.e213–200.e220. |
[5] | Kamboh MI ((2022) ) Genomics and functional genomics of Alzheimer–s disease. Neurotherapeutics 19: , 152–172. |
[6] | DeKosky ST , Fitzpatrick A , Ives DG , Saxton J , Williamson J , Lopez OL , Burke G , Fried L , Kuller LH , Robbins J , Tracy R , Woolard N , Dunn L , Kronmal R , Nahin R , Furberg C ((2006) ) The Ginkgo Evaluation of Memory (GEM) study: Design and baseline data of a randomized trial of Ginkgo biloba extract in prevention of dementia. Contemp Clin Trials 27: , 238–253. |
[7] | Teng EL , Chui HC ((1987) ) The modified mini-mental state examination (3MSE). J Clin Psychiatr 41: , 114–121. |
[8] | Snitz BE , O’Meara ES , Carlson MC , Arnold AM , Ives DG , Rapp SR , Saxton J , Lopez OL , Dunn LO , Sink KM , DeKosky ST ;Ginkgo Evaluation of Memory (GEM) Study Investigators ((2009) ) Ginkgo biloba for preventing cognitive decline in older adults: A randomized trial. JAMA 302: , 2663–2670. |
[9] | DeKosky ST , Williamson JD , Fitzpatrick AL , Kronmal RA , Ives DG , Saxton JA , Lopez OL , Burke G , Carlson MC , Fried LP , Kuller LH ((2008) ) Ginkgo biloba for prevention of dementia: A randomized controlled trial. JAMA 300: , 2253–2262. |
[10] | Purcell S , Neale B , Todd-Brown K , Thomas L , Ferreira MA , Bender D , Maller J , Sklar P , de Bakker PI , Daly MJ , Sham PC ((2007) ) PLINK: A toolset for whole-genome association and population-based linkage analysis . Am J Hum Genet 81: , 559–575. |
[11] | Turner SD ((2018) ) qqman: An R package for visualizing GWAS results using Q-Q and manhattan plots. J Open Source Softw 3: , 731. |
[12] | Pruim RJ , Welch RP , Sanna S , Teslovich TM , Chines PS , Gliedt TP , Boehnke M , Abecasis GR , Willer CJ ((2010) ) LocusZoom: Regional visualization of genome-wide association scan results. Bioinformatics 26: , 2336–2337. |
[13] | Kunkle BW , Grenier-Boley B , Sims R , Bis JC , Damotte V , Naj AC , Boland A , Vronskaya M , van der Lee SJ , Amlie-Wolf A , et al. ((2019) ) Genetic meta-analysis of diagnosed Alzheimer’s disease identifes new risk loci and implicates Aβ, tau, immunity and lipid processing. Nat Genet 51: , 414–430. |
[14] | Ganguli M , Chandra V , Kamboh MI , Johnston JM , Dodge HH , Thelma BK , Juyal RC , Pandav R , Belle SH , DeKosky ST ((2000) ) Apolipoprotein E polymorphism and Alzheimer disease: The Indo-US Cross-National Dementia Study. Arch Neurol 57: , 824–833. |
[15] | Farrer LA , Cupples LA , Haines JL , Hyman B , Kukull WA , Mayeux R , Myers RH , Pericak-Vance MA , Risch N , van Duijn CM ((1997) ) Effects of age, sex, and ethnicity on the association between apolipoprotein E genotype and Alzheimer disease. A meta-analysis. APOE and Alzheimer Disease Meta Analysis Consortium. JAMA 278: , 1349–1356. |
[16] | Genin E , Hannequin D , Wallon D , Sleegers K , Hiltunen M , Combarros O , Bullido MJ , Engelborghs S , De Deyn P , Berr C , Pasquier F , Dubois B , Tognoni G , Fiévet N , Brouwers N , Bettens K , Arosio B , Coto E , Del Zompo M , Mateo I , Epelbaum J , Frank-Garcia A , Helisalmi S , Porcellini E , Pilotto A , Forti P , Ferri R , Scarpini E , Siciliano G , Solfrizzi V , Sorbi S , Spalletta G , Valdivieso F , Vepsäläinen S , Alvarez V , Bosco P , Mancuso M , Panza F , Nacmias B , Bossù P , Hanon O , Piccardi P , Annoni G , Seripa D , Galimberti D , Licastro F , Soininen H , Dartigues JF , Kamboh MI , Van Broeckhoven C , Lambert JC , Amouyel P , Campion D ((2011) ) APOE and Alzheimer disease: A major gene with semi-dominant inheritance. Mol Psychiatry 16: , 903–907. |
[17] | Wang H , Lo M-T , Rosenthal SB , Makowski C , Andreasse O , Salem RM , McEvoy LK , Fiecas M , Chen C-H , ((2021) ) Similar genetic architecture of Alzheimer’s disease and differential APOE effect between sexes. Front Aging Neurosci 13: , 674318. |
[18] | Barry G ((2014) ) Integrating the roles of long and small non-coding RNA in brain function and disease. Mol Psychiatry 19: , 410–416. |
[19] | Wu Y-Y , Kuo H-C ((2020) ) Functional roles and networks of non-coding RNAs in the pathogenesis of neurodegenerative diseases. J Biomed Sci 27: , 49. |
[20] | Nguyen LD , Chau RK , Krichevsky AM ((2021) ) Small molecule drugs targeting non-coding RNAs as treatments for Alzheimer’s disease and related dementias. Genes (Basel) 12: , 2005. |
[21] | Kuo M-C , Liu SC-H , Hsu Y-F , Wu R-M ((2021) ) The role of noncoding RNAs in Parkinson’s disease: Biomarkers and associations with pathogenic pathways. J Biomed Sci 28: , 78. |


