
Low Serum Insulin-like Growth Factor-I Is Associated with Decline in Hippocampal Volume in Stable Mild Cognitive Impairment but not in Alzheimer’s Disease
Abstract
Background:
Serum insulin-like growth factor-I (IGF-I) has shown some association with hippocampal volume in healthy subjects, but this relation has not been investigated in stable mild cognitive impairment (sMCI) or Alzheimer’s disease (AD).
Objective:
At a single memory clinic, we investigated whether serum IGF-I was associated with baseline magnetic resonance imaging (MRI)-estimated brain volumes and longitudinal alterations, defined as annualized changes, up to 6 years of follow-up.
Methods:
A prospective study of patients with sMCI (n = 110) and AD (n = 60). Brain regions included the hippocampus and amygdala as well as the temporal, parietal, frontal, and occipital lobes, respectively.
Results:
Serum IGF-I was statistically similar in sMCI and AD patients (112 versus 123 ng/mL, p = 0.31). In sMCI, serum IGF-I correlated positively with all baseline MRI variables except for the occipital lobe, and there was also a positive correlation between serum IGF-I and the annualized change in hippocampal volume (rs = 0.32, p = 0.02). Furthermore, sMCI patients having serum IGF-I above the median had lower annual loss of hippocampal volume than those with IGF-I below the median (p = 0.02). In contrast, in AD patients, IGF-I did not associate with baseline levels or annualized changes in brain volumes.
Conclusion:
In sMCI patients, our results suggest that IGF-I exerted neuroprotective effects on the brain, thereby maintaining hippocampal volume. In AD, serum IGF-I did not associate with brain volumes, indicating that IGF-I could not induce neuroprotection in this disease. This supports the notion of IGF-I resistance in AD.
INTRODUCTION
Insulin-like growth factor-I receptors (IGF-IRs) are widely expressed in the central nervous system [1, 2]. Systemic IGF-I can be transported across the blood-brain barrier at the choroid plexus and is also produced locally in the brain [3]. IGF-I is required for normal brain development and functioning [4–6], and IGF-I gene mutations are associated with some mental retardation [7–9]. The pleiotropic effects of IGF-I in the aging brain have been less studied. However, intracerebroventricular infusion of IGF-I in rats reduced the age-related decline in hippocampal neurogenesis [10]. Furthermore, in adult rodent models, circulating IGF-I regulated the density of brain blood vessels [11] as well as spatial learning and memory [12, 13]. Finally, circulating IGF-I mediated many of the beneficial effects of exercise on the mouse brain [14].
Beyond the physiological effects of IGF-I in the aging brain, altered IGF-I activity has been linked to Alzheimer’s disease (AD) pathology. Absence of IGF-I resulted in increased phosphorylation of tau in the mouse brain [15]. In experimental AD, IGF-I regulated the clearance of amyloid-β (Aβ) from the brain by interactions with the choroid plexus endocytic receptor megalin [16, 17]. Moreover, in the postmortem human AD brain, IGF-I expression was reduced along with resistance to signaling through the IGF-IR [18, 19]. Further postmortem research of both experimental [20] and human [21, 22] brains with AD confirmed an aberrant distribution of IGF-IRs and resistance to IGF-IR signaling in the AD brain, which could result in lack of trophic signals with subsequent degeneration of neurons [3, 23].
In AD, studies of serum IGF-I concentrations have shown discrepant results as serum IGF-I has been decreased [24], unchanged [25] or increased [26–28] as compared with controls. Furthermore, there are limited data on the associations between IGF-I and regional brain volumes, and the results of previous studies have not been fully consistent. In healthy middle-aged participants, the exercise-induced elevation of serum IGF-I correlated with larger hippocampal volumes [29]. However, in other studies, associations between serum IGF-I levels and measures of hippocampal volumes have been marginal [30] or absent [31, 32].
In summary, few studies have analyzed the association between serum IGF-I and magnetic resonance imaging (MRI)-estimated brain volumetrics. Furthermore, to our knowledge, no study has assessed the relation between IGF-I and changes in brain volumes over time. We therefore investigated the association between serum IGF-I and MRI-estimated brain region volumes at baseline and during follow-up in a single-center memory clinic population of patients with stabile mild cognitive impairment (sMCI) or AD. We hypothesized that serum IGF-I would be associated with brain MRI characteristics in sMCI, whereas in AD, such associations would be abolished due to resistance to the effects of IGF-I.
METHODS
Patients
The patients were recruited from the Gothenburg MCI study, a longitudinal single-center study performed at the memory clinic at Sahlgrenska University Hospital [33]. All patients underwent baseline investigations to determine the state of cognitive function as described previously in detail [33, 34]. The Gothenburg MCI study was designed to exclude somatic and psychiatric conditions associated with increased risk of cognitive impairment. Thus, the exclusion criteria comprised age < 50 or > 79 years, Mini-Mental State Examination (MMSE) score < 18, severe somatic diseases (e.g., subdural hemorrhage, brain tumor, encephalitis, untreated hypothyroid state, and unstable heart disease), psychiatric disorders (e.g., major affective disorder and schizophrenia), substance abuse, and confusion [33]. In the present study, additional inclusion criteria were a diagnosis of sMCI or AD, a blood sample available for analysis of serum IGF-I, and a baseline brain MRI measurement.
The patients were classified according to the Global Deterioration Scale (GDS) [35]. Patients with GDS 3 were considered as MCI, while patients with GDS 4 were classified as probable mild dementia. The classification into GDS groups were based on medical history, checklists, and cognitive instruments [33]; 1) Stepwise Comparative Status Analysis (STEP) variables 13–20 (memory disturbance, disorientation, reduced abstract thinking, visuospatial disturbance, poverty of language, sensory aphasia, visual agnosia, apraxia) [36]; 2) I-FLEX, a short form of the Executive Interview (EXIT) (number-letter task, word fluency, anomalous sentence repetition, interference task, Luria hand sequences, counting task) [37]; 3) MMSE [38]; and 4) Clinical Dementia Rating (CDR) [39]. The CDR assessment was based on information from both the patient and an informant. Guidelines for GDS 4 was: STEP > 1, I-FLEX > 3, CDR > 1.0, and MMSE≤25. However, a consensus decision was made among the physicians at the memory clinic to determine the appropriate GDS score.
Patients were diagnosed as sMCI if they were classified as GDS 3 at baseline and did not convert to dementia during the follow-up. In GDS 4, a specialized physician determined the specific dementia diagnoses. This physician had access to clinical information and MRI images but was blinded to imaging results from volumetry/rating scales, neuropsychological test results and cerebrospinal fluid (CSF) biomarker levels. AD was diagnosed according to The National Institute of Neurological and Communicative Disorders and Stroke and the Alzheimer’s Disease and Related Disorders Association (NINCDS-ADRDA) [40]. Patients with mixed forms of AD and the subcortical small vessel type of vascular dementia (SSVD) were included in the AD group. The diagnosis of mixed AD/SSVD was set if AD patients also exhibited MRI findings of cerebral white matter hyperintensities (moderate or severe according to Fazekas classification) [41] with no predominant frontal lobe syndrome, or alternatively, if AD patients exhibited mild degree of white matter hyperintensities in combination with a marked frontal lobe syndrome [33, 34]. In our 60 AD patients, 37 suffered from non-vascular AD and 23 from mixed forms of AD/SSVD. Other forms of dementia (including cortical VaD, Lewy body dementia, frontotemporal dementia, or unspecified dementia) were excluded.
Ethical approval and consent to participate
Ethical approval was obtained from the regional ethics review board at the University of Gothenburg. All patients provided oral and written informed consent for enrollment. The study was conducted according to the Declaration of Helsinki.
Neuropsychological tests
In addition to the tests used for GDS classification, we assessed episodic memory using the delayed word recall from the Rey Auditory Verbal Learning Test (RAVLT) [42].
Blood and CSF samples
Blood samples were drawn in the fasted state between 08.00 AM and 10.00 AM, and CSF samples were drawn at the lumbar vertebrae L3/L4 or L4/L5 interspace. The first portion of CSF was discarded to avoid blood contamination. In total, 20 ml of CSF was collected in polypropylene tubes and gently mixed by inverting the tube. Thereafter, the CSF was centrifuged at room temperature at 2,000 x g for 10 min. All blood and CSF samples were stored at –80°C pending analysis [33].
Biochemical analysis
Serum IGF-I concentrations were analyzed at the Clinical Chemistry Laboratory, Sahlgrenska University Hospital using a chemiluminescent immunometric assay (IDS-iSYS; Immunodiagnostic Systems Limited, Boldon, United Kingdom) on an IDS-iSYS automated system (IS31040; Immunodiagnostic Systems Limited). The IDS-iSYS IGF-I assay was calibrated according to the WHO International Standard 02/254. The analyses of serum IGF-I were performed at one occasion in 2015 by experienced laboratory technicians that were blinded to clinical information. CSF levels of total (T)-tau, phosphorylated (P)-tau 181, and amyloid-β amino acids 1 to 42 (Aβ1–42) were determined using sandwich ELISAs (INNOTEST, Fujirebio, Gent, Belgium). Two or more internal control CSF samples (aliquots of pooled CSF) were analyzed each run as internal quality controls to minimize between-assay variability [33]. APOE (gene map locus 19q13.2) genotyping was performed by minisequencing [33].
Magnetic resonance imaging and volumetric brain estimations
All patients underwent structural brain imaging on a 1.5 tesla Siemens Symphony (Erlanger, Germany) MRI scanner. The imaging protocol, sequence generation, and volumetric assessment have been described previously [43]. T1-weighted brain images were analyzed using the FreeSurfer software (version 5.3.0; https://surfer.nmr.mgh.harvard.edu/. Cortical segmentation/parcellation and lobe mapping was carried out using the Desikan-Killiany Atlas [44]. A blinded quality control check was conducted using the FreeSurfer graphical user interface Freeview https://surfer.nmr.mgh.harvard.edu/fswiki/FreeviewGuide/FreeviewIntroduction [FreeviewGuide/FreeviewIntroduction]) [43]. Brain regions of interest included the combined volumes (cm3) of the right and left sides of the hippocampus, amygdala, temporal lobe, parietal lobe, frontal lobe, and occipital lobe. Normalization for total intracranial volume was not performed as total intracranial volume was similar in the sMCI and AD groups. Of the included 170 patients (110 sMCI patients and 60 AD patients) with baseline MRI, 87 patients (58 sMCI patients and 29 AD patients) had a follow-up MRI (2 years: sMCI, n = 47 and AD, n = 27; 4 years: sMCI, n = 2 and AD, n = 1; 6 years: sMCI, n = 27 and AD, n = 7). The duration of follow-up was 3.3 [standard deviation (SD) 1.9] years on average (median 2.0 years, 25th –75th percentiles: 2.0 –6.0 years). The annualized change for brain regional volumes were calculated as the value at the last available MRI scan minus the value at the baseline MRI scan divided by the duration (years) between the measurements.
Statistical analyses
The statistical analyses were performed using SPSS for Mac version 27 (IBM Corp., Armonk, NY, USA). Continuous variables are presented as the median (25th–75th percentiles) and categorical variables as count (n) and proportions (%). Between-group differences were assessed using Mann-Whitney U test for continuous variables and using Chi-square test for categorical data. Correlation analyses were performed using the Spearman rank order correlation test, rho-values shown as r s . A two-tailed p-value < 0.05 was considered statistically significant.
RESULTS
Demographic and MRI volumetric characteristics
Baseline characteristics
The demographic and brain volumetric characteristics of the 110 sMCI patients and 60 AD patients having a baseline MRI scan are provided in Table 1. sMCI patients were younger and had higher BMI than AD patients. Gender distribution and education level (years) were statistically similar in the sMCI patients and AD patients. As expected, sMCI patients and AD patients differed in terms of cognitive performance (MMSE and RAVLT delayed recall scores), CSF levels of AD biomarkers (Aβ1–42, T-tau, and P-tau), and APOE ɛ4 allele distribution. There was no difference in serum IGF-I level between the groups, although there was a non-significant trend to lower serum IGF-I in the sMCI group. Volumes of the hippocampus, amygdala, temporal lobe, parietal lobe, and frontal lobe were significantly greater in the sMCI group, whereas the occipital lobe volume was statistically similar in the sMCI and AD groups.
Table 1
Demographic and radiologic characteristics of sMCI patients and AD patients with baseline MRI brain scans
| sMCI (n = 110) | AD (n = 60) | P | |
| Men/women, n (%) | 40/70 (36% /64%) | 28/32 (47% /53%) | 0.19 |
| Age (y) | 64.0 (58.0–71.0) | 69.0 (62.0–75.0) | < 0.01 |
| Education (y) | 13.5 (11.0–16.0) | 12.5 (9.0–15.0) | 0.19 |
| BMI (kg/m2) | 25.0 (22.5–27.4) | 24.0 (21.6–26.0) | 0.03 |
| MMSE score | 29.0 (28.0–30.0) | 26.5 (24.0–28.0) | < 0.001 |
| RAVLT delayed recall score | 8.0 (5.0–11.0) | 1.0 (0.0–3.0) | <0.001 |
| CSF Aβ1–42 (ng/L) | 610 (460–790) | 365 (268–455) | < 0.001 |
| CSF T-tau (ng/L) | 310 (210–450) | 530 (379–743) | < 0.001 |
| CSF P-tau (ng/L) | 49 (38–67) | 78 (61–96) | < 0.001 |
| APOE ɛ4 allele (0/1/2; n, %) | 55/40/7 (50% /36% /6%) | 16/28/12 (27% /47% /20%) | < 0.01 |
| S –IGF-I (ng/mL) | 112 (94–139) | 123 (96–146) | 0.31 |
| Brain region volumes (cm3) | |||
| Hippocampus | 7.3 (6.6–8.1) | 6.0 (5.4–6.9) | < 0.001 |
| Amygdala | 2.6 (2.4–2.9) | 2.3 (2.1–2.6) | < 0.001 |
| Temporal lobe | 99 (95–107) | 90 (84–98) | < 0.001 |
| Parietal lobe | 114 (107–121) | 108 (100–118) | < 0.01 |
| Frontal lobe | 165 (155–174) | 161 (146–169) | 0.03 |
| Occipital lobe | 44 (41–47) | 43 (39–48) | 0.67 |
Values are given as the median (25th–75th percentiles) if not otherwise stated. Between-group differences were examined using Mann-Whitney U tests for continuous data and chi-square tests for categorical data. APOE genotyping was not conducted in 12 patients. Aβ, amyloid-β; AD, Alzheimer’s disease; APOE, Apolipoprotein E; BMI, body mass index; CSF, cerebrospinal fluid; MMSE, Mini-Mental State Examination; MRI, magnetic resonance imaging; S-IGF-I, serum insulin like growth factor-I; sMCI, stable mild cognitive impairment; P-tau, phosphorylated tau; RAVLT, Rey Auditory Verbal Learning Test; T-tau, total tau.
Comparison of patients having or not having MRI follow-up
In Supplementary Table 1, the demographic characteristics of the sMCI and AD patients with or without brain MRI follow-up are shown. The sMCI patients with MRI follow-up had lower BMI and higher CSF P-tau levels compared with sMCI patients with no MRI follow-up. In AD patients, the demographic characteristics were similar in patients with or without MRI follow-up.
Brain volumetric results in patients with MRI follow-up
sMCI patients (n = 58) with MRI follow-up exhibited greater baseline hippocampal, amygdala, and temporal lobe volumes than AD patients (n = 29) with MRI follow-up (Table 2). The parietal, frontal, and occipital lobe volumes did not differ significantly between the two groups. At the final follow-up (endpoint MRI), the sMCI group had greater volumes of all the studied brain regions except for the occipital lobe, which was similar in sMCI and AD patients. Furthermore, evaluations of the annualized changes in MRI variables showed that sMCI patients had less annual loss in the volumes of the hippocampus and amygdala as well as the temporal, parietal, frontal, and occipital lobes compared with AD patients (Table 2).
Table 2
Regional brain volumes and annualized changes in sMCI patients and AD patients having MRI follow-up
| Baseline MRI | Endpoint MRI | Annualized change in brain region volumes | |||||||
| sMCI (n = 58) | AD (n = 29) | p | sMCI (n = 58) | AD (n = 29) | p | sMCI (n = 58) | AD (n = 29) | p | |
| Brain region | |||||||||
| volumes (cm3) | |||||||||
| Hippocampus | 7.7 (6.8–8.2) | 5.9 (5.1–6.8) | < 0.001 | 7.4 (6.3–8.1) | 5.2 (4.6–6.2) | < 0.001 | –0.07 (–0.2 to –0.02) | –0.2 (–0.4 to –0.2) | < 0.001 |
| Amygdala | 2.6 (2.4–2.9) | 2.2 (2.1–2.6) | < 0.01 | 2.6 (2.3–2.9) | 2.1 (1.8–2.3) | < 0.001 | –0.03 (–0.09 to 0.03) | –0.09 (–0.2 to –0.01) | < 0.01 |
| Temporal lobe | 101 (95–108) | 90 (83–105) | 0.01 | 98 (91–106) | 83 (72–96) | < 0.001 | –1.1 (–2.1 to –0.3) | –3.6 (–4.5 to –3.0) | < 0.001 |
| Parietal lobe | 114 (108–122) | 110 (103–119) | 0.10 | 112 (105–119) | 101 (93–114) | < 0.01 | –0.4 (–0.1 to 0.07) | –1.1 (–2.1 to –0.5) | < 0.01 |
| Frontal lobe | 167 (158–176) | 162 (152–171) | 0.15 | 165 (153–174) | 155 (140–159) | < 0.01 | –0.5 (–1.3 to 0.4) | –1.7 (–2.6 to –0.3) | 0.02 |
| Occipital lobe | 44 (41–47) | 45 (41–49) | 0.35 | 43 (40–46) | 41 (37–44) | 0.13 | –0.2 (–0.5 to 0.07) | –0.6 (–1.1 to –0.2) | < 0.01 |
Values are given as the median (25th –75th percentiles) if not stated otherwise. Between group differences were examined using Mann-Whitney U tests. AD, Alzheimer’s disease; MRI, magnetic resonance imaging; sMCI, stable mild cognitive impairment.
Correlation analyses
First, we investigated whether serum IGF-I concentrations correlated with MRI-estimated brain region volumes at baseline. In the sMCI group (n = 110), serum IGF-I correlated positively with hippocampal volume (rs = 0.32, p < 0.01; Fig. 1A), and additionally with amygdala (rs = 0.27, p < 0.01), temporal lobe (r s = 0.25, p = 0.02), parietal lobe (rs = 0.22, p = 0.02), and frontal lobe (rs = 0.26, p < 0.01) volumes at baseline (Table 3). Serum IGF-I was not correlated with baseline occipital lobe volume in sMCI patients. In the AD group (n = 60), serum IGF-I did not correlate with any of the studied brain region volumes at baseline (Table 3).
Table 3
Correlation analyses between serum IGF-I and baseline MRI-estimated brain volumes or annualized changes in brain region volumetry
| Baseline MRI | Annualized change in brain region volumes | |||
| sMCI (n = 110) | AD (n = 60) | sMCI (n = 58) | AD (n = 29) | |
| Brain region | ||||
| volumes (cm3) | ||||
| Hippocampus | rs= 0.32, p < 0.01 | rs= 0.01, p = 0.97 | rs= 0.32, p = 0.02 | rs= –0.04, p = 0.86 |
| Amygdala | rs= 0.27, p < 0.01 | rs= 0.03, p = 0.84 | rs= –0.01, p = 0.92 | rs= –0.15, p = 0.44 |
| Temporal lobe | rs= 0.25, p = 0.02 | rs= –0.01, p = 0.97 | rs= 0.29, p = 0.07 | rs= –0.36, p = 0.19 |
| Parietal lobe | rs= 0.22, p = 0.02 | rs= –0.05, p = 0.69 | rs= 0.09, p = 0.52 | rs= –0.04, p = 0.84 |
| Frontal lobe | rs= 0.26, p < 0.01 | rs= 0.08, p = 0.56 | rs= 0.01, p = 0.99 | rs= 0.32, p = 0.15 |
| Occipital lobe | rs= 0.14, p = 0.15 | rs= 0.01, p = 0.95 | rs= 0.21, p = 0.13 | rs= 0.26, p = 0.20 |
Correlation analyses were performed using the Spearman rank order correlation test, rho-values shown as rs. AD, Alzheimer’s disease; MRI, magnetic resonance imaging; sMCI, stable mild cognitive impairment.
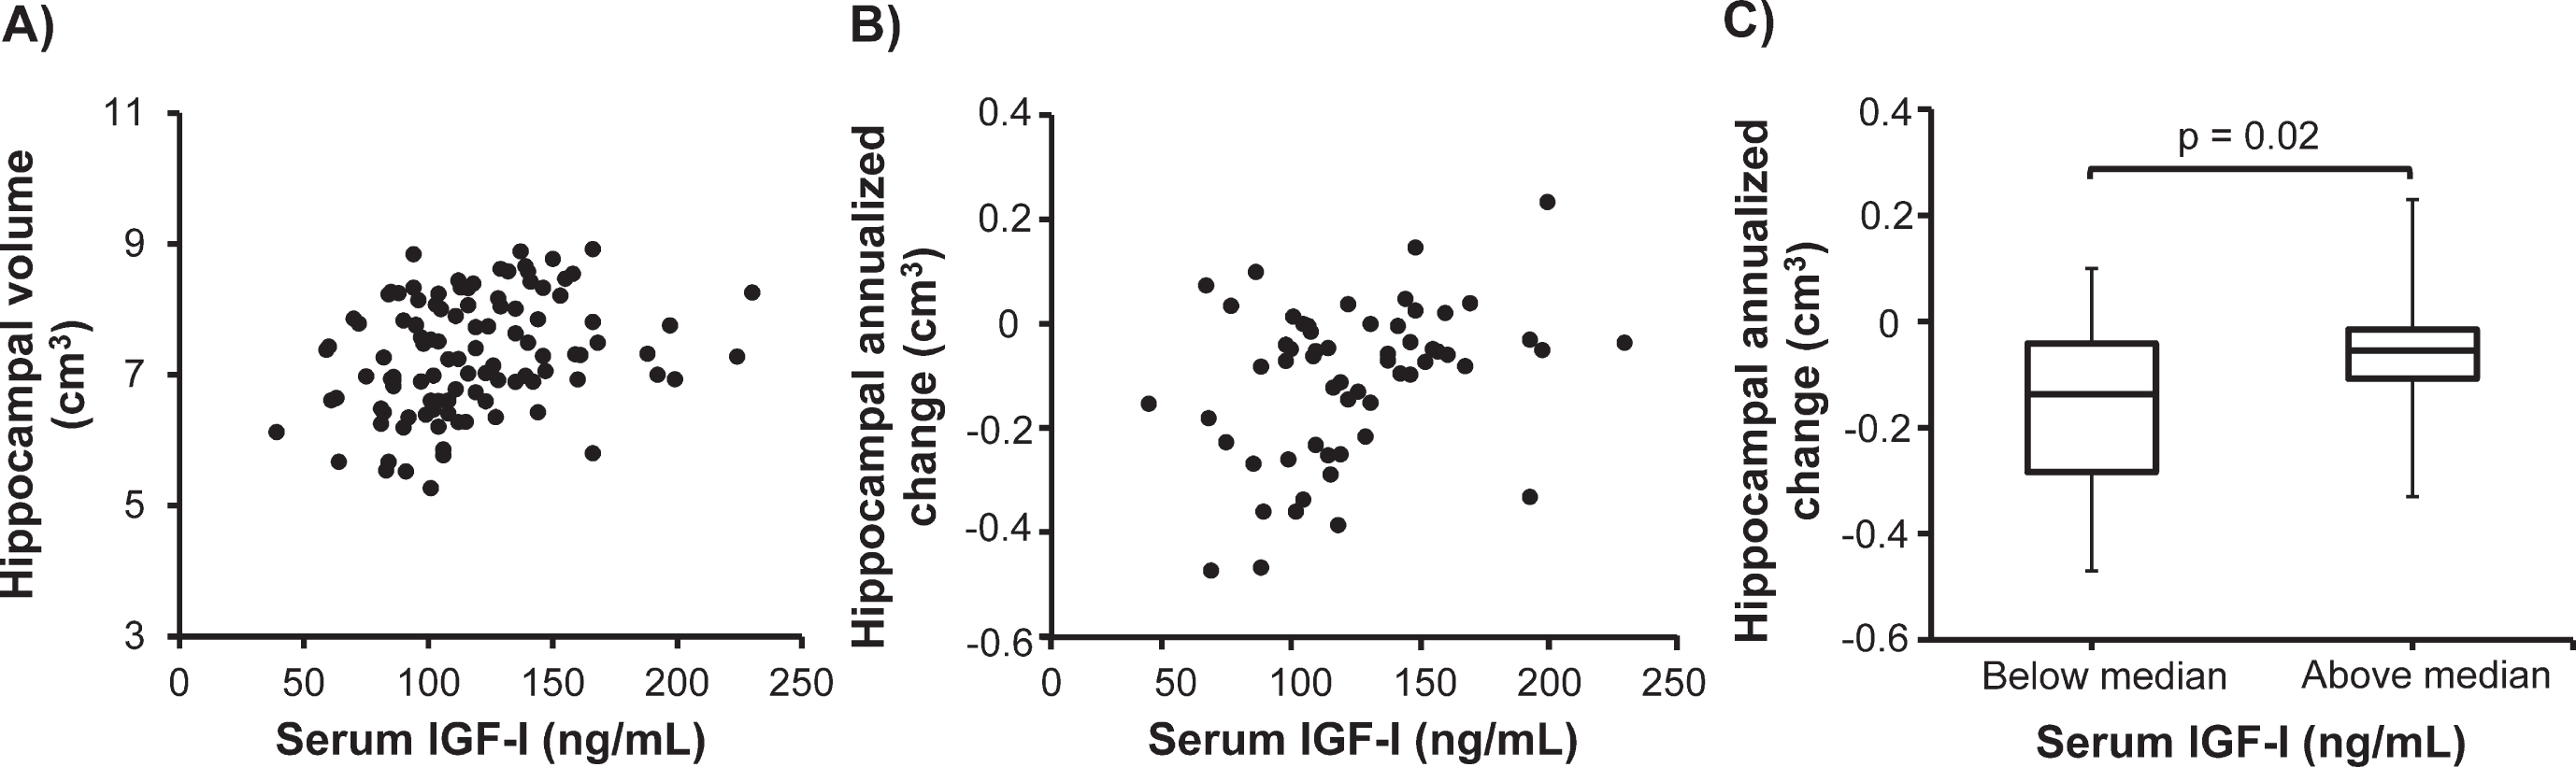
Fig. 1
Higher serum insulin-like growth factor-I (IGF-I) concentration is associated with larger hippocampal volume in stable mild cognitive impairment (sMCI). In the sMCI patients, serum IGF-I correlated positively with (A) baseline hippocampal volume (n = 110; rs = 0.32, p < 0.01) and (B) the annualized change in hippocampal volume (n = 58; rs = 0.32, p = 0.02). C) In the sMCI group (n = 58), patients having serum IGF-I concentrations above the median had a less prominent decrease in hippocampal volume during the follow-up than those having serum IGF-I below the median (p = 0.02). Data in the box plots are presented as medians (horizontal lines), 25th–75th percentiles (boxes), and ranges (whiskers). Correlations were sought using the Spearman rank order correlation test and between-group differences were investigated using the Mann-Whitney U test.
Next, we determined whether serum IGF-I was associated with the annualized changes in brain region volumes over the follow-up period. In sMCI patients (n = 58), serum IGF-I correlated positively with the annualized change in hippocampal volume (rs = 0.32, p = 0.02; Fig. 1B). Otherwise, serum IGF-I did not correlate with the annualized change in any regional brain volume in sMCI patients or AD patients.
Brain volumetric results in patients having low or high serum IGF-I
In additional analyses, we evaluated MRI variables in patients having serum IGF-I concentrations above and below the median value. In the sMCI group, baseline volumes of hippocampus (p = 0.001), amygdala (p = 0.01), temporal lobe (p = 0.02), parietal lobe (p = 0.02), and frontal lobe (p = 0.01) were significantly greater in patients having serum IGF-I concentration above the median compared with those having serum IGF-I concentration below the median (not shown). Occipital lobe volumes were similar in the sMCI patients with high or low serum IGF-I. In addition, the annualized change in hippocampal volume differed significantly (p = 0.02) as sMCI patients having serum IGF-I above the median had lower loss of hippocampal volume than those having serum IGF-I below the median (Fig. 1C). The annualized change in the other MRI variables did not differ between sMCI patients with serum IGF-I above or below the median (not shown).
In AD patients, baseline brain region volumes did not differ significantly between patients having serum IGF-I concentrations above or below the median value (not shown). Furthermore, the annualized changes in all the measured MRI variables were similar in AD patients having serum IGF-I above or below the median (not shown).
DISCUSSION
This is the first study to investigate the association between serum IGF-I levels and longitudinal changes in MRI-estimated brain region volumes. At a single center, we included AD patients as well as patients with sMCI. Often, MCI is considered as a transitory state between early disease stages and manifest dementia. However, MCI is a heterogenous condition and sMCI may be of special interest as these patients do not convert to manifest dementia. We found that in the sMCI group, serum IGF-I correlated positively with all baseline MRI variables except the occipital lobe, and in addition, serum IGF-I correlated positively with the annualized change in hippocampal volume. Furthermore, in subanalyses, we found that sMCI patients having serum IGF-I above the median had lower annual loss of hippocampal volume than those having serum IGF-I below the median. In contrast, in AD patients, serum IGF-I was not associated with baseline brain region volumes or longitudinal volumetric changes in brain structures. Moreover, AD patients having serum IGF-I above or below the median displayed similar MRI characteristics.
At baseline, AD patients had lower MMSE and RAVLT delayed recall scores, higher distribution of the APOE ɛ4 allele, and impaired CSF levels of AD biomarkers (Aβ1–42, T-tau, and P-tau) compared with the sMCI patients. Furthermore, at baseline, AD patients had higher age and lower BMI than sMCI patients, which is in line with the previous observations that age is a risk factor for AD [45] and that BMI declines during the years before and after an AD diagnosis [46, 47]. The MRI measurements demonstrated that AD patients exhibited lower baseline volumes and more marked annualized losses of all the studied brain region volumes except for the occipital lobe. Thus, we observed the expected differences between AD and sMCI patients in terms of clinical characteristics and MRI findings.
We found similar serum IGF-I concentrations in patients with sMCI and AD patients although there was a non-significant trend to higher serum IGF-I in the AD patients. Previous studies have shown inconsistent results as in AD, serum IGF-I has been decreased [24], unchanged [25], or increased [26–28] compared with healthy controls. Fewer studies have investigated serum IGF-I in AD patients compared with sMCI patients, but in line with the results of the present study, most of these studies have found similar serum IGF-I concentration in AD and sMCI [27, 48]. It is unknown why previous studies have shown discrepant results in terms of serum IGF-I in AD, but it has been postulated that there is resistance to IGF-I action early in AD, reflected as increased serum IGF-I. Later, this is followed by deficiency when the disease progresses (reflected as low serum IGF-I) [49]. Underlying mechanisms for low serum IGF-I in more severe AD could be that this state is accompanied by isolation, immobilization, malnutrition, and impaired body composition, all of which are associated with low circulating IGF-I level [12].
At baseline in our sMCI patients, serum IGF-I level was positively correlated with MRI-estimated volumes of the hippocampus, amygdala, temporal lobe, parietal lobe, and frontal lobe. In subanalyses, we also observed larger baseline volumes of these structures in the sMCI patients with serum IGF-I above the median compared with those having serum IGF-I below the median. Notably, both in the correlation analyses as well as in the analyses of sMCI patients with serum IGF-I above or below the median, serum IGF-I showed the strongest baseline association with hippocampal volume followed by amygdala volume. Although the association between serum IGF-I and brain volumetry has previously not been evaluated in a memory clinic setting, the relationship has been investigated in some cohort studies. A study of hypertensive adults showed that lower serum IGF-I concentrations were marginally related to a widening of the radial width of the temporal horn, reflecting medial cerebral temporal lobe atrophy [30]. A positive correlation between serum IGF-I, hippocampal volume, and cognitive performance was observed in healthy individuals [29]. In the Framingham cohort, serum IGF-I concentration was positively associated with total brain volume, whereas there was no association between IGF-I and hippocampal volume in older or middle-aged individuals [31]. Finally, in a population-based study, circulating IGF-I was not related to later-life total brain or hippocampal volumes [32]. Therefore, the results of some, but not all, of the earlier studies suggest that circulating IGF-I is associated with hippocampal volume in non-demented elderly subjects.
A major finding of the present study is that serum IGF-I concentration was associated with the annualized change in hippocampal volume in sMCI patients, suggesting that circulating IGF-I is of importance for the maintenance of hippocampal volume in this group of patients. There is a relatively marked decrease in hippocampal volume over time in sMCI patients [50], which could underly why serum IGF-I only correlated with the loss of hippocampal volume in the longitudinal analyses. However, some data suggest that IGF-I could be of particular importance for the hippocampus. In the postmortem human brain free from neurological diseases, the distribution of IGF-IRs was greater in the hippocampus compared with other brain regions [51]. Moreover, in MCI patients, serum IGF-I was positively correlated with cognitive performance, mainly in the hippocampal-dependent domains of learning and memory [52]. The latter finding concurs with the impaired spatial learning and memory found in mice with inactivation of liver-derived circulating IGF-I [13]. Furthermore, both suppression and overexpression of IGF-I in rodents markedly affected the hippocampal structure. In mice with inhibited IGF-I activity due to IGF-binding protein-1 (IGFBP-1) overexpression or total IGF-I deficiency, the decrease in tissue volume was greater in the hippocampus than in the total brain [53, 54]. Conversely, IGF-I overexpression resulted in an increased number of neurons and synapses in the hippocampus [55]. Additionally, rodent data demonstrate that IGF-IR transcription increases with age in the hippocampal region, possibly to counteract the age-related decreases in IGF-I production and the density of IGF-IR distribution [56, 57], and to provide protection from the lowering of systemic and brain levels of IGF-I in the aged rodent [58]. Experiments in young and old mice lacking the IGF-IR in astrocytes showed that decreased IGF-IR expression was associated with reduced working memory as well as impaired mitochondrial metabolism and reduced Aβ uptake in cultured astrocytes [59]. Altogether, previous findings suggest that there is an intricate relationship between IGF-I and the hippocampus, and our findings in addition suggest that IGF-I exerts neuroprotective effects in the aged hippocampus, thereby maintaining hippocampal volume over time.
In the present study, in the AD patients, serum IGF-I did not correlate with any of the baseline or longitudinal measures of brain region volumes. This lack of association between serum IGF-I and brain region volumes might suggest that IGF-I can exert neuroprotective effects only to a low degree in the AD brain. Although the underlying mechanisms are unknown, it could be hypothesized that resistance to IGF-I action in the AD brain results in loss of the neuroprotective effects of IGF-I. Indeed, reduced IGF-IR signaling has been observed in the postmortem human AD brain [18, 19] and severe resistance to signaling through the IGF-IR has been confirmed in both experimental [20] and human [22] postmortem studies of AD brains. Thus, this resistance to IGF-IR signaling could preclude IGF-I from exerting neuroprotective effects in the AD brain. However, we did not observe any significant difference in serum IGF-I levels between the AD and sMCI groups (median serum IGF-I: 123 versus 112 ng/mL, respectively), which may argue against that resistance to IGF-IR signaling in the AD brain is reflected in the serum levels of IGF-I. Therefore, in the AD group, we cannot exclude the possibility that the lack of correlations between serum IGF-I and brain region volumes was due to factors other than brain resistance to IGF-I action.
A major strength of the present study is the longitudinal investigation of MRI estimates of brain region volumes, with a maximum follow-up of 6 years. Additional strengths are that the included patients were well characterized at a single memory clinic and that serum IGF-I values were analyzed on one occasion. There were no differences in baseline characteristics between AD patients having or not having MRI follow-up, and within the sMCI group, baseline clinical characteristics were similar except for lower BMI and higher CSF P-tau in the sMCI patients with MRI follow-up. However, limitations include that the number of patients having MRI follow-up was limited, which could have reduced the statistical power in the analyses of the associations between serum IGF-I and the annualized changes in brain region volumes. Also, it may be noted that we did not assess IGF-I in CSF to estimate the levels of IGF-I in the central nervous system. Furthermore, we did not measure other members of the IGF family, such as IGFBPs, and serum IGF-I was only measured at baseline, why possible alterations in IGF-I levels over time were not accounted for.
This is the first study that has investigated the association between serum IGF-I levels and longitudinal changes in MRI-estimated brain region volumes in sMCI and AD. In sMCI patients, serum IGF-I was associated with baseline volumes of hippocampus, amygdala, temporal lobe, parietal lobe, and frontal lobe, as well as the annualized change in hippocampal volume. These results indicate that IGF-I provides neuroprotective effects in sMCI, thereby maintaining hippocampal volume. Speculatively, this could be of importance for the lack of progression to manifest dementia in this group of patients. In contrast, in AD patients, IGF-I was not associated with baseline volumes or annualized changes in any of the studied brain structures, which could suggest that the neuroprotective effects of IGF-I are lost in AD. This in turn gives some further support for the notion of IGF-I resistance in AD.
ACKNOWLEDGMENTS
The authors are in gratitude to Eva Bringman and Marie C. Johansson at the Department of Psychiatry, Sahlgrenska University Hospital for excellent technical assistance. This work was supported by the Swedish state under the agreement between the Swedish government and the county councils, the ALF-agreement (ALFGBG-722371, ALFGBG-720661).
Authors’ disclosures available online https://www.j-alz.com/manuscript-disclosures/22-0292r1.
SUPPLEMENTARY MATERIAL
[1] The supplementary material is available in the electronic version of this article: https://dx.doi.org/10.3233/JAD-220292.
REFERENCES
[1] | De Keyser J , Wilczak N , De Backer JP , Herroelen L , Vauquelin G ((1994) ) Insulin-like growth factor-I receptors in human brain and pituitary gland: an autoradiographic study. Synapse 17: , 196–202. |
[2] | Jafferali S , Dumont Y , Sotty F , Robitaille Y , Quirion R , Kar S ((2000) ) Insulin-like growth factor-I and its receptor in the frontal cortex, hippocampus, and cerebellum of normal human and alzheimer disease brains. , Synapse 38: , 450–459. |
[3] | Fernandez AM , Torres-Alemán I ((2012) ) The many faces of insulin-like peptide signalling in the brain. , Nat Rev Neurosci 13: , 225–239. |
[4] | Nieto-Estévez V , Defterali Ç , Vicario-Abejón C ((2016) ) IGF-I: a key growth factor that regulates neurogenesis and synaptogenesis from embryonic to adult stages of the brain. , Front Neurosci 10: , 52. |
[5] | Liang G , Cline GW , Macica CM ((2007) ) IGF-1 stimulates de novo fatty acid biosynthesis by Schwann cells during myelination.Glia 55: , 632–641. |
[6] | Abuzzahab MJ , Schneider A , Goddard A , Grigorescu F , Lautier C , Keller E , Kiess W , Klammt J , Kratzsch J , Osgood D , Pfäffle R , Raile K , Seidel B , Smith RJ , Chernausek SD ((2003) ) IGF-I receptor mutations resulting in intrauterine and postnatal growth retardation. N Engl J Med 349: , 2211–2222. |
[7] | Woods KA , Camacho-Hübner C , Savage MO , Clark AJ ((1996) ) Intrauterine growth retardation and postnatal growth failure associated with deletion of the insulin-like growth factor I gene. N Engl J Med 335: , 1363–1367. |
[8] | Walenkamp MJ , Karperien M , Pereira AM , Hilhorst-Hofstee Y , van Doorn J , Chen JW , Mohan S , Denley A , Forbes B , van Duyvenvoorde HA , van Thiel SW , Sluimers CA , Bax JJ , de Laat JA , Breuning MB , Romijn JA , Wit JM ((2005) ) Homozygous and heterozygous expression of a novel insulin-like growth factor-I mutation. J Clin Endocrinol Metab 90: , 2855–2864. |
[9] | Bonapace G , Concolino D , Formicola S , Strisciuglio P ((2003) ) A novel mutation in a patient with insulin-like growth factor 1 (IGF1) deficiency. J Med Genet 40: , 913–917. |
[10] | Lichtenwalner RJ , Forbes ME , Bennett SA , Lynch CD , Sonntag WE , Riddle DR ((2001) ) Intracerebroventricular infusion of insulin-like growth factor-I ameliorates the age-related decline in hippocampal neurogenesis. Neuroscience 107: , 603–613. |
[11] | Lopez-Lopez C , LeRoith D , Torres-Aleman I ((2004) ) Insulin-like growth factor I is required for vessel remodeling in the adult brain. Proc Natl Acad Sci U S A 101: , 9833–9838. |
[12] | Ohlsson C , Mohan S , Sjögren K , Tivesten A , Isgaard J , Isaksson O , Jansson JO , Svensson J ((2009) ) The role of liver-derived insulin-like growth factor-I. Endocr Rev 30: , 494–535. |
[13] | Svensson J , Diez M , Engel J , Wass C , Tivesten A , Jansson JO , Isaksson O , Archer T , Hökfelt T , Ohlsson C ((2006) ) Endocrine, liver-derived IGF-I is of importance for spatial learning and memory in old mice. J Endocrinol 189: , 617–627. |
[14] | Trejo JL , Llorens-Martín MV , Torres-Aleìn I ((2008) ) The effects of exercise on spatial learning and anxiety-like behavior are mediated by an IGF-I-dependent mechanism related to hippocampal neurogenesis. Mol Cell Neurosci 37: , 402–411. |
[15] | Cheng CM , Tseng V , Wang J , Wang D , Matyakhina L , Bondy CA ((2005) ) Tau is hyperphosphorylated in the insulin-like growth factor-I null brain. Endocrinology 146: , 5086–5091. |
[16] | Carro E , Spuch C , Trejo JL , Antequera D , Torres-Aleman I ((2005) ) Choroid plexus megalin is involved in neuroprotection by serum insulin-like growth factor I. J Neurosci 25: , 10884–10893. |
[17] | Carro E , Trejo JL , Gomez-Isla T , LeRoith D , Torres-Aleman I ((2002) ) Serum insulin-like growth factor I regulates brain amyloid-beta levels. Nat Med 8: , 1390–1397. |
[18] | Rivera EJ , Goldin A , Fulmer N , Tavares R , Wands JR , de la Monte SM ((2005) ) Insulin and insulin-like growth factor expression and function deteriorate with progression of Alzheimer’s disease: link to brain reductions in acetylcholine. J Alzheimers Dis 8: , 247–268. |
[19] | Steen E , Terry BM , Rivera EJ , Cannon JL , Neely TR , Tavares R , Xu XJ , Wands JR , de la Monte SM ((2005) ) Impaired insulin and insulin-like growth factor expression and signaling mechanisms in Alzheimer’s disease–is this type 3 diabetes? , J Alzheimers Dis 7: , 63–80. |
[20] | Muller AP , Fernandez AM , Haas C , Zimmer E , Portela LV , Torres-Aleman I ((2012) ) Reduced brain insulin-like growth factor I function during aging. Mol Cell Neurosci 49: , 9–12. |
[21] | Moloney AM , Griffin RJ , Timmons S , O’Connor R , Ravid R , O’Neill C ((2010) ) Defects in IGF-1 receptor, insulin receptor and IRS-1/2 in Alzheimer’s disease indicate possible resistance to IGF-1 and insulin signalling. Neurobiol Aging 31: , 224–243. |
[22] | Talbot K , Wang HY , Kazi H , Han LY , Bakshi KP , Stucky A , Fuino RL , Kawaguchi KR , Samoyedny AJ , Wilson RS , Arvanitakis Z , Schneider JA , Wolf BA , Bennett DA , Trojanowski JQ , Arnold SE ((2012) ) Demonstrated brain insulin resistance in Alzheimer’s disease patients is associated with IGF-1 resistance, IRS-1 dysregulation, and cognitive decline. J Clin Invest 122: , 1316–1338. |
[23] | de la Monte SM ((2012) ) Triangulated mal-signaling in Alzheimer’s disease: roles of neurotoxic ceramides, ER stress, and insulin resistance reviewed. J Alzheimers Dis 30: , Suppl 2 231–249. |
[24] | Xu LZ , Li FY , Li BQ , Cao SM , Li Y , Xu J , Jia JP ((2021) ) Decreased levels of insulin-like growth factor-1 are associated with Alzheimer’s disease: a meta-analysis. J Alzheimers Dis 82: , 1357–1367. |
[25] | Ostrowski PP , Barszczyk A , Forstenpointner J , Zheng W , Feng ZP ((2016) ) Meta-analysis of serum insulin-like growth factor 1 in Alzheimer’s disease. PLoS One 11: , e0155733. |
[26] | Horvath A , Salman Z , Quinlan P , Wallin A , Svensson J ((2020) ) Patients with Alzheimer’s disease have increased levels of insulin-like growth factor-I in serum but not in cerebrospinal fluid. J Alzheimers Dis 75: , 289–298. |
[27] | Johansson P , Åberg D , Johansson JO , Mattsson N , Hansson O , Ahrnén B , Isgaard J , Åberg ND , Blennow K , Zetterberg H , Wallin A , Svensson J ((2013) ) Serum but not cerebrospinal fluid levels of insulin-like growth factor-I (IGF-I) and IGF-binding protein-3 (IGFBP-3) are increased in Alzheimer’s disease. Psychoneuroendocrinology 38: , 1729–1737. |
[28] | Salehi Z , Mashayekhi F , Naji M ((2008) ) Insulin like growth factor-1 and insulin like growth factor binding proteins in the cerebrospinal fluid and serum from patients with Alzheimer’s disease. Biofactors 33: , 99–106. |
[29] | Maass A , Düzel S , Brigadski T , Goerke M , Becke A , Sobieray U , Neumann K , Lövdén M , Lindenberger U , Bäckman L , Braun-Dullaeus R , Ahrens D , Heinze HJ , Müller NG , Lessmann V , Sendtner M , Düzel E ((2016) ) Relationships of peripheral IGF-1, VEGF and BDNF levels to exercise-related changes in memory, hippocampal perfusion and volumes in older adults. Neuroimage 131: , 142–154. |
[30] | Angelini A , Bendini C , Neviani F , Bergamini L , Manni B , Trenti T , Rovati R , Neri M ((2009) ) Insulin-like growth factor-1 (IGF-1): relation with cognitive functioning and neuroimaging marker of brain damage in a sample of hypertensive elderly subjects. Arch Gerontol Geriatr 49: Suppl 1, 5–12. |
[31] | Westwood AJ , Beiser A , Decarli C , Harris TB , Chen TC , He XM , Roubenoff R , Pikula A , Au R , Braverman LE , Wolf PA , Vasan RS , Seshadri S ((2014) ) Insulin-like growth factor-1 and risk of Alzheimer dementia and brain atrophy. Neurology 82: , 1613–1619. |
[32] | Salzmann A , James SN , Williams DM , Richards M , Cadar D , Schott JM , Coath W , Sudre CH , Chaturvedi N , Garfield V ((2021) ) Investigating the relationship between IGF-I, IGF-II, and IGFBP-3 concentrations and later-life cognition and brain volume. J Clin Endocrinol Metab 106: , 1617–1629. |
[33] | Wallin A , Nordlund A , Jonsson M , Lind K , Edman Å , Göthlin M , Stålhammar J , Eckerström M , Kern S , Börjesson-Hanson A , Carlsson M , Olsson E , Zetterberg H , Blennow K , Svensson J , Öhrfelt A , Bjerke M , Rolstad S , Eckerström C ((2016) ) The Gothenburg MCI study: Design and distribution of Alzheimer’s disease and subcortical vascular disease diagnoses from baseline to 6-year follow-up. J Cereb Blood Flow Metab 36: , 114–131 . |
[34] | Wallin A , Nordlund A , Jonsson M , Blennow K , Zetterberg H , Öhrfelt A , Stålhammar J , Eckerström M , Carlsson M , Olsson E , Göthlin M , Svensson J , Rolstad S , Eckerström C , Bjerke M ((2016) ) Alzheimer’s disease–subcortical vascular disease spectrum in a hospital-based setting: Overview of results from the Gothenburg MCI and dementia studies. J Cereb Blood Flow Metab 36: , 95–113 . |
[35] | Reisberg B , Ferris SH , de Leon MJ , Crook T ((1982) ) The Global Deterioration Scale for assessment of primary degenerative dementia. Am J Psychiatry 139: , 1136–1139. |
[36] | Wallin A , Edman A , Blennow K , Gottfries CG , Karlsson I , Regland B , Sjögren M ((1996) ) Stepwise comparative status analysis (STEP): a tool for identification of regional brain syndromes in dementia. J Geriatr Psychiatry Neurol 9: , 185–199. |
[37] | Royall DR , Mahurin RK , Gray KF ((1992) ) Bedside assessment of executive cognitive impairment: the executive interview. J Am Geriatr Soc 40: , 1221–1226. |
[38] | Folstein MF , Folstein SE , McHugh PR ((1975) ) “Mini-mental state”. A practical method for grading the cognitive state of patients for the clinician. J Psychiatr Res 12: , 189–198. |
[39] | Morris JC ((1997) ) Clinical dementia rating: a reliable and valid diagnostic and staging measure for dementia of the Alzheimer type. , 173-176; discussion, Int Psychogeriatr 9: , Suppl 1, 177–178. |
[40] | McKhann G , Drachman D , Folstein M , Katzman R , Price D , Stadlan EM ((1984) ) Clinical diagnosis of Alzheimer’s disease: report of the NINCDS-ADRDA Work Group under the auspices of Department of Health and Human Services Task Force on Alzheimer’s Disease. Neurology 34: , 939–944. |
[41] | Wahlund LO , Barkhof F , Fazekas F , Bronge L , Augustin M , Sjögren M , Wallin A , Ader H , Leys D , Pantoni L , Pasquier F , Erkinjuntti T , Scheltens P ((2001) ) A new rating scale for age-related white matter changes applicable to MRI and CT. Stroke 32: , 1318–1322. |
[42] | Geffen GM , Butterworth P , Geffen LB ((1994) ) Test-retest reliability of a new form of the auditory verbal learning test (AVLT). Arch Clin Neuropsychol 9: , 303–316. |
[43] | Eckerström C , Klasson N , Olsson E , Selnes P , Rolstad S , Wallin A ((2018) ) Similar pattern of atrophy in early- and late-onset Alzheimer’s disease. Alzheimers Dement (Amst) 10: , 253–259. |
[44] | Desikan RS , Ségonne F , Fischl B , Quinn BT , Dickerson BC , Blacker D , Buckner RL , Dale AM , Maguire RP , Hyman BT , Albert MS , Killiany RJ ((2006) ) An automated labeling system for subdividing the human cerebral cortex on MRI scans into gyral based regions of interest. Neuroimage 31: , 968–980. |
[45] | Blennow K , de Leon MJ , Zetterberg H ((2006) ) Alzheimer’s disease. Lancet 368: , 387–403. |
[46] | Wagner M , Helmer C , Tzourio C , Berr C , Proust-Lima C , Samieri C ((2018) ) Evaluation of the concurrent trajectories of cardiometabolic risk factors in the 14 years before dementia. JAMA Psychiatry 75: , 1033–1042. |
[47] | Axelsson E , Wallin A , Svensson J ((2020) ) Patients with the subcortical small vessel type of dementia have disturbed cardiometabolic risk profile. J Alzheimers Dis 73: , 1373–1383. |
[48] | Alvarez A , Cacabelos R , Sanpedro C , García-Fantini M , Aleixandre M ((2007) ) Serum TNF-alpha levels are increased and correlate negatively with free IGF-I in Alzheimer disease. Neurobiol Aging 28: , 533–536. |
[49] | Carro E , Torres-Aleman I ((2004) ) The role of insulin and insulin-like growth factor I in the molecular and cellular mechanisms underlying the pathology of Alzheimer’s disease. Eur J Pharmacol 490: , 127–133. |
[50] | Zeng Q , Li K , Luo X , Wang S , Xu X , Li Z , Zhang T , Liu X , Fu Y , Xu X , Wang C , Wang T , Zhou J , Liu Z , Chen Y , Huang P , Zhang M ((2021) ) Distinct atrophy pattern of hippocampal subfields in patients with progressive and stable mild cognitive impairment: a longitudinal MRI study. J Alzheimers Dis 79: , 237–247. |
[51] | Adem A , Jossan SS , d’Argy R , Gillberg PG , Nordberg A , Winblad B , Sara V ((1989) ) Insulin-like growth factor 1 (IGF-1) receptors in the human brain: quantitative autora-diographic localization. Brain Res 503: , 299–303. |
[52] | Calvo D , Gunstad J , Miller LA , Glickman E , Spitznagel MB ((2013) ) Higher serum insulin-like growth factor-1 is associated with better cognitive performance in persons with mild cognitive impairment. Psychogeriatrics 13: , 170–174. |
[53] | Ni W , Rajkumar K , Nagy JI , Murphy LJ ((1997) ) Impaired brain development and reduced astrocyte response to injury in transgenic mice expressing IGF binding protein-1. Brain Res 769: , 97–107. |
[54] | Beck KD , Powell-Braxton L , Widmer HR , Valverde J , Hefti F ((1995) ) Igf1 gene disruption results in reduced brain size, CNS hypomyelination, and loss of hippocampal granule and striatal parvalbumin-containing neurons. Neuron 14: , 717–730. |
[55] | O’Kusky JR , Ye P , D’Ercole AJ ((2000) ) Insulin-like growth factor-I promotes neurogenesis and synaptogenesis in the hippocampal dentate gyrus during postnatal development. J Neurosci 20: , 8435–8442. |
[56] | Sonntag WE , Lynch CD , Bennett SA , Khan AS , Thornton PL , Cooney PT , Ingram RL , McShane T , Brunso-Bechtold JK ((1999) ) Alterations in insulin-like growth factor-1 gene and protein expression and type 1 insulin-like growth factor receptors in the brains of ageing rats. Neuroscience 88: , 269–279. |
[57] | Lai M , Hibberd CJ , Gluckman PD , Seckl JR ((2000) ) Reduced expression of insulin-like growth factor 1 messenger RNA in the hippocampus of aged rats. Neurosci Lett 288: , 66–70. |
[58] | Ashpole NM , Sanders JE , Hodges EL , Yan H , Sonntag WE ((2015) ) Growth hormone, insulin-like growth factor-1 and the aging brain. Exp Gerontol 68: , 76–81. |
[59] | Logan S , Pharaoh GA , Marlin MC , Masser DR , Matsuzaki S , Wronowski B , Yeganeh A , Parks EE , Premkumar P , Farley JA , Owen DB , Humphries KM , Kinter M , Freeman WM , Szweda LI , Van Remmen H , Sonntag WE ((2018) ) Insulin-like growth factor receptor signaling regulates working memory, mitochondrial metabolism, and amyloid-β uptake in astrocytes. Mol Metab 9: , 141–155. |


