
Importance of Accounting for Regional Differences in Modifiable Risk Factors for Alzheimer’s Disease and Related Dementias: The Case for Tailored Interventions
Abstract
Background:
We recently estimated that 36.9% of Alzheimer’s disease and related dementias (ADRD) cases in the US may be attributable to modifiable risk factors, but it is not known whether national estimates generalize to specific states or regions.
Objective:
To compare national estimates of modifiable risk factors of ADRD to California, overall and by sex and race/ethnicity, and to estimate number of cases potentially preventable by reducing the prevalence of key risk factors by 25%.
Methods:
Adults ≥18 years who participated in the Behavioral Risk Factor Surveillance Survey in California (n = 9,836) and the US (n = 378,615). We calculated population attributable risks (PARs) for eight risk factors (physical inactivity, current smoking, depression, low education, diabetes mellitus, midlife obesity, midlife hypertension, and hearing loss) and compared estimates in California and the U.S.
Results:
In California, overall, 28.9% of ADRD cases were potentially attributable to the combination of risk factors, compared to 36.9% in the U.S. The top three risk factors were the same in California and the U.S., although their relative importance differed (low education [CA:14.9%; U.S.:11.7% ], midlife obesity [CA:14.9%; U.S.:17.7% ], and physical inactivity [CA:10.3%; U.S.:11.8% ]). The number of ADRD cases attributable to the combined risk factors was 199,246 in California and 2,287,683 in the U.S. If the combined risk factors were reduced by 25%, we could potentially prevent more than 40,000 cases in California and 445,000 cases in the U.S.
Conclusion:
Our findings highlight the importance of examining risk factors of ADRD regionally, and within sex and race/ethnic groups to tailor dementia risk reduction strategies.
INTRODUCTION
There are currently 6.2 million people in the United States (U.S.) who are living with Alzheimer’s disease and related dementias (ADRD) [1]. By the year 2050, it is expected that there will be a dramatic increase in ADRD prevalence due to longer life expectancies paired with demographic trends, with an estimated 13.8 million cases in the U.S. [1]. While age is the single strongest risk factor for late life cognitive impairment and ADRD, we recently estimated that up to 1 in 3 cases (37%) of ADRD in the U.S. are potentially attributable to eight modifiable risk factors [2]. In order of importance, these included midlife obesity, physical inactivity, low education, depression, diabetes mellitus, midlife hypertension, smoking, and hearing loss. In addition, the contribution of these modifiable risk factors to dementia risk differed by sex and race/ethnicity, with a greater burden of disease observed in men versus women and in Black, Native American/Alaska Native, and Hispanic subpopulations than non-Hispanic White and Asian subpopulations [2].
California is the most populous and most diverse state in the U.S. (58.8% Hispanic and/or non-White) [3]. In addition, California has a lower health behavior risk profile overall, with lower rates of smoking, midlife obesity, depression, midlife hypertension, diabetes mellitus, physical inactivity, and hearing loss compared to national trends [4]. There are currently 690,000 people in California who are living with ADRD [5]. Given these differences in demographics and risk factor prevalence, it is important to determine whether our national estimates generalize to individual states such as California. In addition, it is important to estimate how many cases may be potentially preventable if risk factors are reduced.
In this study, we estimated the proportion of ADRD cases that are potentially attributable to eight modifiable risk factors in California, overall and within sex and racial/ethnic sub-populations compared to the U.S. In addition, we estimated the total number of ADRD cases that are potentially preventable if the prevalence of risk factors were reduced by 25% in California and the U.S. These estimates may inform the need for tailored public health messaging and interventions related to ADRD risk reduction [5, 6].
METHODS
Data sources
We determined risk factor prevalence for eight previously established modifiable ADRD risk factors using data from the nationally representative Behavioral Risk Factor Surveillance System Data (BRFSS; https://www.cdc.gov/brfss/index.html). The BRFSS is an annual survey and publicly available data system of health-related telephone surveys that collect state data on U.S. residents regarding their health-related risk behaviors, chronic health conditions, and use of preventive services. According to the Centers for Disease Control (CDC) [4], these data are representative of the U.S. as a whole and of each state individually. Beginning in 2011, the CDC updated their methods to maintain representativeness, including making survey calls to cell-phone numbers, and adopting an advanced weighting method. This update allowed for the CDC to better capture lower-income and minority populations [4]. These data include information for all 50 states as well as the District of Columbia and three U.S. territories [4].
We obtained relative risk estimates for the associations between each modifiable risk factor and ADRD by searching the Cochrane Database of Systematic Reviews and PubMed to identify English-language systematic reviews and recent meta-analyses examining effect/associations between each risk factor and AD or dementia in terms of the relative risk (i.e., risk ratio or odds ratio) [4, 5]. The search strategy details can be found in a previous paper [2]. Briefly, we used the following keywords or their synonyms (“physical inactivity”, “smoking”, “depression”, “low education”, “diabetes”, “obesity”, and “hypertension”) AND (“Alzheimer”, “dementia”, “cognitive decline”). We selected the most recent and comprehensive meta-analysis available. Relative risk estimates for AD were used when available; otherwise, estimates for all-cause dementia were used.
This study was reviewed by the Institutional Review Board at the University of California, San Francisco and was classified as exempt (IRB #20-31363). All individuals who contributed to data analyses signed Data Use Agreements.
Variables
In the BRFSS, participants provided sociodemographic information including age, sex, race, and ethnicity. We categorized self-reported race and ethnicity into mutually exclusive categories of Hispanic (any race), Black, Asian, White, and Native American/Alaska Native. In addition, the eight modifiable factors (physical inactivity, smoking, depression, low education, diabetes mellitus, midlife obesity, midlife hypertension, and hearing loss) were assessed using self-reported behavioral, physiologic, and clinical information. Details on how each risk factor was assessed and coded can be found in Supplementary Table 1.
Statistical analysis
Estimation of the population attributable risk (PAR)
To estimate the PAR for the different modifiable risk factors specific to California, we undertook steps similar to those undertaken in our prior studies [2, 7, 8]. More details can be found in the respective studies. First, we estimated the weighted prevalence for each modifiable risk factors using information from the 2018 California BRFSS including the raw proportion, the sampling unit, the stratification information, and the sampling weight. Second, we calculated the weighted correlation between the modifiable risk factors using a similar strategy. Third, we estimated the unique variance explained by each risk factor. To do so, we extracted the principal components of the inter-risk-factor tetrachoric correlation matrix and the corresponding communality (i.e., explained variance shared with the other factors) among the different risk factors using the weighted correlation. As in similar studies [2, 8], the number of components were determined by the Kaiser method [9] (in this study, two components were extracted). We then estimated the “uniqueness”— or the unique contribution of each factor to dementia risk not explained by the other factors as one minus the communality. The uniqueness was then used as a weight in the estimation of the combined PAR. Fourth, we estimated the individual PAR using Levin’s formula [10], i.e.,
Estimation of the total number of ADRD cases due to the presence of the modifiable risk factors
We estimated the total number of ADRD cases due to the presence of the modifiable risk factors by multiplying the PAR estimates by the current number of cases of ADRD in California and the U.S. We also determined the number of cases that could potentially be prevented if the risk factor prevalence were 25% lower than current levels. To do so, we first reduced the weighted prevalence estimates (and confidence limits) by 25%. We then re-calculated a new PAR using the above formulas and new prevalence estimates. Lastly, we multiplied the new PARs by the current number of ADRD cases in California and the U.S and divided that number by 10,000 to obtain the point estimates and confidence limits of the number of cases of ADRD that could be prevented per 10,000 cases if the prevalence of one or more modifiable risk factors were reduced by 25%.
RESULTS
Sample characteristics
In California and the U.S., about half of the sample was male (CA: 48.7%; U.S.: 49.4%) and about one-fifth of the population was 65 and older (CA: 21.1%; U.S.: 19.4%) (Table 1). In California, over half of the population was non-white (59%) compared to about one-third of the population in the U.S. (35.7%) (Table 1).
Table 1
Weighted sample characteristics, Behavioral Risk Factor Surveillance System data (BRFSS), 2018, California versus U.S
| Characteristics | US weighted prevalence, 95% CI | CA weighted prevalence, 95% CI |
| Demographics | ||
| Age 65 and older | 21.1% (20.9, 21.3) | 19.4% (18.4, 20.5) |
| Male sex | 48.7% (48.3, 49.0) | 49.4% (48.0, 50.7) |
| Non-White subpopulation | 35.7% (35.4, 36.1) | 59.0% (57.7, 60.2) |
| Asian, Non-Hispanic | 5.1% (4.9, 5.3) | 15.3% (14.0, 16.6) |
| Black, Non-Hispanic | 11.7% (11.5, 12.0) | 5.6% (4.9, 6.2) |
| Hispanic | 16.0% (15.6, 16.3) | 34.9% (33.6, 36.1) |
| Native American/Alaska | ||
| Native, Non-Hispanic | 0.9% (0.9, 1.0) | 0.5% (0.3, 0.6) |
| Other, Non-Hispanic | 2.0% (1.9, 2.1) | 2.8% (2.4, 3.1) |
| White, Non-Hispanic | 64.3% (63.9, 64.6) | 41.0% (39.8, 42.3) |
| Risk Factors | ||
| Current smoking | 15.7% (15.4, 15.9) | 11.3% (10.5, 12.2) |
| Midlife obesitya | 36.0% (35.5, 36.5) | 29.1% (27.3, 31.0) |
| Depression | 18.7% (18.4,18.9) | 15.9% (14.9, 16.8) |
| Midlife hypertensionab | 37.1% (36.6, 37.6) | 33.9% (31.8, 36.1) |
| Diabetes mellitus | 11.4% (11.1, 11.6) | 10.5% (9.6, 11.4) |
| Low education | 12.8% (12.5, 13.1) | 16.9% (15.8, 17.9) |
| Physical inactivity | 23.9% (23.6, 24.2) | 20.6% (19.5, 21.7) |
| Hearing loss | 6.5% (6.4, 6.7) | 5.3% (4.7, 5.9) |
aMidlife included ages 40–64. bMidlife hypertension data were collected in 2017.
Overall population attributable risk
In California, 28.9% (95% CI: 27.4, 30.3) of ADRD cases were potentially attributable to the combination of eight modifiable risk factors evaluated in this study, compared to 36.9% (95% CI: 36.5, 37.3) in the U.S. (Table 2). The top 3 dementia risk factors were the same in the U.S. and California, although their relative importance differed slightly. For example, the risk factors that contributed to the largest proportion of ADRD cases in order of relative importance were low education (PAR: 14.9%, 95% CI: 14.1, 15.7), midlife obesity (PAR: 14.9%, 95% CI: 14.1, 15.7), and physical inactivity (PAR: 10.3%, 95% CI: 9.8, 10.8) in California compared to midlife obesity (PAR: 17.7%, 95% CI: 17.5, 18.0), physical inactivity (PAR: 11.8%, 95% CI: 11.7, 11.9), and low education (PAR: 11.7%, 95% CI: 11.5, 12.0) in the U.S. (Table 2). All but one of the risk factors (low education) were lower in California compared to the U.S. (Table 2 and Fig. 1).
Table 2
Unadjusted and combined population attributable risk (PAR) for 8 modifiable dementia risk factors overall, 2018, California and U.S
| Risk factor | Relative Risk | Uniquenessc | PAR California | PAR U.S. |
| Current smoking | 1.4 (1.2, 1.6) | 36.10% | 4.4% (4.1, 4.7) | 6.0% (5.9, 6.1) |
| Midlife obesitya | 1.6 (1.1, 2.3) | 68.60% | 14.9% (14.1, 15.7) | 17.7% (17.5, 18.0) |
| Depression | 1.5 (1.1, 2.0) | 45.00% | 7.3% (6.9, 7.7) | 8.5% (8.4, 8.6) |
| Midlife hypertensionab | 1.3 (1.1, 1.4) | 21.20% | 8.1% (7.6, 8.6) | 8.8% (8.7, 8.9) |
| Diabetes mellitus | 1.7 (1.5, 1.9) | 42.60% | 6.8% (6.2, 7.3) | 7.3% (7.1, 7.4) |
| Low education | 2.0 (1.6, 2.6) | 47.00% | 14.9% (14.1, 15.7) | 11.7% (11.5, 12.0) |
| Physical inactivity | 1.6 (1.3, 1.8) | 47.20% | 10.3% (9.8, 10.8) | 11.8% (11.7, 11.9) |
| Hearing loss | 1.4 (1.1, 1.7) | 74.60% | 1.9% (1.7, 2.1) | 2.3% (2.2, 2.3) |
| Combined | 28.9% (27.4, 30.3) | 36.9% (36.5, 37.3) |
aMidlife included ages 40–64. bMidlife hypertension data were collected in 2017. cThe unique contribution of each factor to dementia risk not explained by the other factors (defined as one minus the communality).
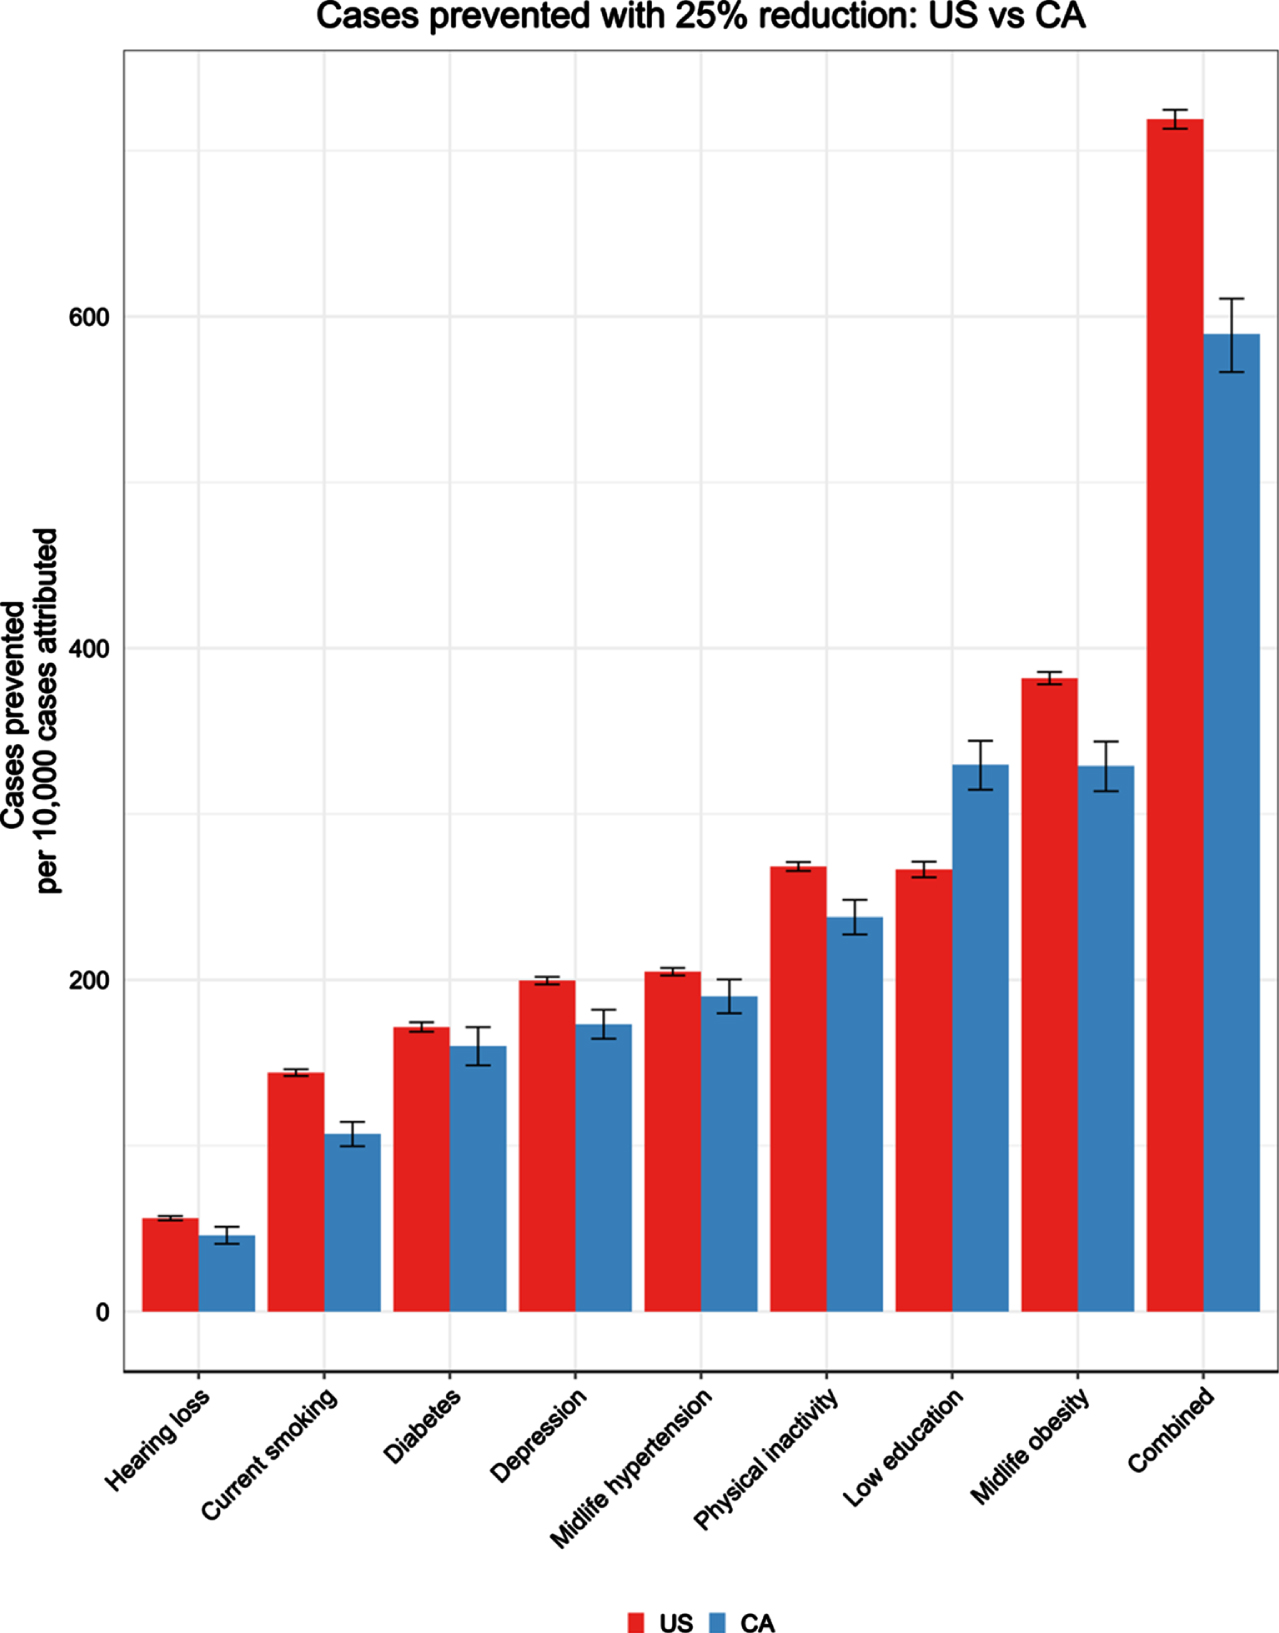
Fig. 1
Number of dementia cases prevented per 10,000 cases with 25% risk factor reduction.
PAR among racial/ethnic and sex subpopulations
In both California and the U.S., the combined PAR was higher in Hispanic adults (CA: PAR: 35.1%, 95% CI: 33.1, 37.0; U.S.: PAR: 34.2%, 95% CI: 33.0, 35.3) compared to Non-Hispanic White adults (CA: PAR: 27.5%, 95% CI: 25.0, 29.9; U.S.: PAR: 28.5%, 95% CI: 28.1, 28.9) and was lowest in Asian adults (CA: PAR: 14.7%, 95% CI: 10.5, 18.6; U.S.: PAR: 15.8%, 95% CI: 13.8, 17.8). However, the combined PAR for Black adults was substantially lower in CA (PAR: 29.5%, 95% CI: 23.6, 34.8) than the U.S. (PAR: 39.8%, 95% CI: 38.6, 41.0) (Supplementary Figure 1). The combined PAR for ADRD was lower in men in California compared to the U.S. (CA: PAR: 28.4%, 95% CI: 26.4, 30.3; U.S.: PAR: 35.9%, 95% CI: 35.3, 36.5), but was similar in women (CA: PAR: 32.4%, 95% CI: 30.1, 34.5; U.S.: PAR: 30.1%, 95% CI: 29.6, 30.6) (Supplementary Figure 1). In the U.S., the combined PAR was higher in Native Americans/Alaska Native adults (PAR: 39.2%, 95% CI: 36.1, 42.0) compared to Non-Hispanic White adults, but the same conclusions could not be drawn for California, due to the large confidence intervals in estimates for Native American/Alaska Native adults (PAR: 35.2%, 95% CI: 15.8, 48.5).
Estimated cases attributable and preventable in California and the U.S.
The total number of ADRD cases that may currently be attributable to combined risk factors in California was estimated to be 199,246 in California and 2,287,683 in the U.S. (Table 3). If the combined risk factors were reduced by 25%, we could potentially prevent approximately 40,665 cases in CA and 445,737 cases in the U.S. (Table 3). The proportion of cases that could be potentially prevented per 10,000 cases if risk factors were reduced by 25% would be 589 per 10,000 cases in CA and 719 per 10,000 cases in the U.S (Fig. 1). The top three risk factors (low education, midlife obesity, physical inactivity) account for the largest number of attributable cases (CA: 102,955; 102,708; 71,337; U.S.: 726,974; 1,100,363; 732,497) and the most potentially preventable cases with a 25% reduction in each risk factor (CA: 22,747; 22,700; 16,415; U.S.: 165,278; 236,744; 166,404) (Table 3). See Supplementary Table 2 for the number of cases attributable and potentially preventable with a 10% risk factor reduction.
Table 3
Estimated number of ADRD cases attributable to modifiable risk factors and potentially preventable with 25% risk factor reduction
| Risk Factors | Cases attributable point estimate | Cases attributable lower 95% CI | Cases attributable higher 95% CI | Cases prevented (25% reduction) | Cases prevented lower 95% CI | Cases prevented higher 95% CI |
| California | ||||||
| Current smoking | 30,587 | 28,404 | 32,756 | 7,390 | 6,879 | 7,894 |
| Midlife obesity | 102,708 | 97,249 | 108,067 | 22,700 | 21,649 | 23,714 |
| Depression | 50,668 | 47,937 | 53,377 | 11,956 | 11,349 | 12,555 |
| Midlife hypertension | 55,953 | 52,722 | 59,153 | 13,120 | 12,410 | 13,816 |
| Diabetes mellitus | 46,590 | 43,020 | 50,121 | 11,048 | 10,244 | 11,835 |
| Low education | 102,955 | 97,582 | 108,232 | 22,747 | 21,713 | 23,745 |
| Physical inactivity | 71,337 | 67,881 | 74,754 | 16,415 | 15,687 | 17,128 |
| Hearing loss | 12,877 | 11,417 | 14,331 | 3,174 | 2,819 | 3,527 |
| Combined | 199,246 | 189,174 | 209,018 | 40,665 | 39,084 | 42,144 |
| U.S. | ||||||
| Current smoking | 374,413 | 368,836 | 379,978 | 89,299 | 88,033 | 90,560 |
| Midlife obesity | 1,100,363 | 1,087,455 | 1,113,205 | 236,774 | 234,461 | 239,063 |
| Depression | 529,466 | 522,873 | 536,044 | 123,704 | 122,272 | 125,129 |
| Midlife hypertension | 545,022 | 538,434 | 551,594 | 127,070 | 125,647 | 128,488 |
| Diabetes mellitus | 450,592 | 442,613 | 458,549 | 106,394 | 104,621 | 108,159 |
| Low education | 726,974 | 712,514 | 741,358 | 165,278 | 162,321 | 168,206 |
| Physical inactivity | 732,497 | 724,320 | 740,649 | 166,404 | 164,737 | 168,062 |
| Hearing loss | 142,162 | 138,822 | 145,497 | 34,926 | 34,119 | 35,730 |
| Combined | 2,287,683 | 2,260,631 | 2,314,480 | 445,737 | 442,166 | 449,226 |
DISCUSSION
In this study we found that the proportion of ADRD cases potentially attributable to eight modifiable risk factors is lower in California (28.9%) than in the U.S. as a whole (36.9%). This is likely due to the lower prevalence of all but one of the risk factors (low education) in California, suggesting an overall healthier population. Although the overall PAR for ADRD was lower in California, the top three risk factors were the same (low education, midlife obesity, and physical inactivity), suggesting that these may be important dementia risk reduction targets in most U.S. regions.
This study also shows that, in both the U.S. and California, the proportion of ADRD cases potentially due to these eight modifiable risk factors was relatively higher among Hispanic and Black adults compared to non-Hispanic White adults and was substantially lower in Asian adults. This appears to be largely explained by differences in risk factor prevalence within these populations. For example, the higher prevalence of low education within California and especially within the Hispanic population, which makes up a much greater majority of the population compared to the U.S., may contribute to low education being the number one risk factor in California. Although the proportion of modifiable risk factors was relatively higher among Hispanic and Black adults compared to White and Asian adults in both California and the U.S., men and Black adults in California had lower ADRD PARs compared to the U.S. This is likely due to lower risk factor prevalence within these groups in California.
Overall, our findings highlight the importance of understanding both similarities and differences in factors that contribute to ADRD risk in specific regions and sub-populations, which may help inform when tailoring of public health messaging may be needed. For example, ADRD risk reduction strategies appear to be especially needed in Hispanic, Native American/Alaska Native, and Black populations who tend to have higher prevalence of certain risk factors and higher burden of disease. In addition, our research suggests that prevalence of risk factors within each subpopulation within specific regions should be considered when tailoring public health messaging.
In California, beyond targeting each of the eight modifiable risk factors and especially low education, midlife obesity, and physical inactivity, it may be beneficial to target certain risk factors within specific subpopulations (e.g., low education in Hispanic adults) for a higher potential impact on prevention of ADRD cases. Previous studies that have examined PARs globally and by country for ADRD have shed light on differences in risk factors by region and subpopulation. For example, in a study that examined PARs of ADRD globally, they reported that the top three PARs were low education, hearing loss, and smoking [11]. In another study that examined PARs in low income and middle income countries, including India, China, and six Latin American countries, they reported that the top five PARs were low education, hypertension, hearing loss, obesity, and physical inactivity [12]. They also reported that the relative importance of risk factors differed by country/region and compared to global estimates. These studies further highlight the importance of examining differences by region and subpopulation.
California may also serve as a 1) model for the direction of the U.S. population, as the most diverse state, and 2) as a potential model of improvement, given the lower prevalence of all but one risk factor (low education) and the lower proportion of ADRD cases attributable to modifiable risk factors in the state overall. California is consistently ranked number one for public health, based on several factors (collected by the CDC) including mental health, low obesity rate, low smoking rate, and low suicide rate [13]. The lower risk factor profile in California may be due to a number of factors, including policies, individual behaviors, health care, and other determinants of health. For example, the California Tobacco Control Program established in 1989, aimed to change social norms and reinforce nonsmoking. It had a substantial effect on reducing smoking prevalence and cigarette consumption, which in turn reduced healthcare expenditures [14]. Previous research has indicated that health improvement requires investment in the following three major areas: health care, behavior change, and socioeconomic factors [15]. While different states will have different patterns of modifiable and nonmodifiable determinants of health, California may serve as a window into the future of the U.S. and as a good model for reducing risk factors and lowering overall dementia prevalence in a diverse population of adults.
In addition, our research highlights the public health implications of how targeting and reducing modifiable risk factors may impact rates of ADRD. For example, a 25% reduction in combined risk factors could potentially prevent over 20% of the attributable cases in California and the almost 20% in the U.S. It may be beneficial to prioritize the top three risk factors as targets for ADRD risk reduction, as they account for the greatest number of attributable cases.
Our study is not without limitations. First, it used self-reported data to estimate the prevalence of risk factors, which could result in the presence of measurement and misclassification errors. Second, the relative risk estimates used for the calculation of the PARs, which came primarily from meta-analyses of observational studies, do not necessarily reflect causal associations. Therefore, the validity of our estimates would depend on the extent to which relative risk estimates from the original studies were also valid. However, using these associational estimates to estimate PAR may represent the best evidence in the absence of randomized controlled trials. Third, similarly to previous papers [2, 8], we accounted for uncertainty in the relative risk estimates, but not for the prevalence estimates, which could result in an overestimation of precision in the PAR estimates. Future studies may benefit from using simulation to incorporate confidence intervals for both. Fourth, there was variability in how risk factors were operationalized across studies included in the meta-analyses that provided the relative risk estimates used in this study, which differ from how the risk factors were defined here (e.g., low education, depression). For example, the meta-analysis that we used to inform the relative risk estimate for low education included studies in which the definition of low education ranged from < 7 years to < 15 years, whereas in the present study, low education was defined as anyone who was classified as not graduating high school, based on self-report (< 12 years). Definitions of “low education” also vary across countries. For example, a study that included participants in Jamaica identified “low education” as a key risk factor associated with proportion of dementia cases and defined “low education” as having attended primary and/or secondary school education (based on self-report) [16]. In addition, the prevalence of low education is low in California (16.9%) and the U.S. (12.8%), compared to other countries. For example, in a similar study done in Jamaica, the majority of participants (72%) reported attending primary school at most [16]. In another study done in Brazil, the participants reported an average of 4.56±4.0 years of education [17]. As such, caution should be taken when generalizing these results to other populations. Fifth, the sample was not age adjusted, and age may drive prevalence of risk factors. However, prevalence of risk factors by age categories were similar in California compared to the U.S. In addition, the age structure (proportion of people in different age categories) can vary across studies and countries, therefore caution should be taken when comparing these results to other studies or countries. Lastly, there are potential modifiable risk factors that were not included in our estimates (e.g., social isolation, sleep, diet, leisure activities, occupation, etc.) [18, 19]. The risk factors included were based on risk factors included in previous papers, risk factors that are well-established, and were limited by what was available in the BRFSS. We acknowledge that as more data become available our estimates may change. These estimates are intended to guide policy and decision-making strategies to prevent ADRD by highlighting modifiable risk factors that will most likely have the greatest impact on ADRD prevalence in California and the U.S. and in specific sex and race/ethnic sub-populations.
Conclusions
The trends and estimates of modifiable ADRD risk factors in California included similarities and differences when compared to the national trends in the U.S., further confirming the importance of examining the sex- and race/ethnicity-specific and regional contributors to ADRD burden to inform tailored public health strategies. More importantly, this study suggests that policymakers and clinicians should consider increasing efforts to prevent ADRD by focusing on the most prevalent modifiable risk factors and highest-risk groups in a given region or subpopulation. Public health campaigns should aim to target primary education and increase high school graduation rates, especially in certain subpopulations (e.g., Hispanic adults). Public health initiatives that target top risk factors, such as reducing midlife obesity and increasing physical activity levels across the lifespan, can also serve to impact other modifiable risk factors of ADRD (e.g., depression, midlife hypertension, and diabetes mellitus). In addition, risk factor specific initiatives (e.g., California’s smoking cessation program) may be particularly helpful to address region- and subpopulation-specific risk factor prevalence. Given California’s diverse population, and lower overall PAR for ADRD potentially attributable to modifiable risk factors compared to the U.S., California may serve as a model to understand and drive future initiatives to decrease risk factor prevalence. In summary, strategies to prevent ADRD are critically needed, and public health campaigns and tailored interventions are promising avenues to mitigate risk factors of ADRD.
ACKNOWLEDGMENTS
This work was supported by the California Department of Public Health Alzheimer’s Disease Program. Funding is provided by the 2019 California Budget Act. The funder had no role in study design, data collection and analysis, decision to publish, or preparation of the manuscript. The corresponding author had full access to all the data in the study and takes final responsibility for the paper. The views and opinions expressed in this paper are those of the author and do not necessarily reflect the official policy or position of any public health agency of California or of the United States government.
A poster of an earlier version of this manuscript was presented at the Alzheimer’s Association International Conference (AAIC), July 26th-30th, Denver, Colorado.
Authors’ disclosures available online (https://www.j-alz.com/manuscript-disclosures/22-0278r3).
SUPPLEMENTARY MATERIAL
[1] The supplementary material is available in the electronic version of this article: https://dx.doi.org/10.3233/JAD-220278.
REFERENCES
[1] | Alzheimer’s Association ((2019) ) 2019 Alzheimer’s disease facts and figures. Alzheimers Dementia 15: , 321–387. |
[2] | Nianogo RA , Rosenwohl-Mack A , Yaffe K , Carrasco A , Hoffmann CM , Barnes DE ((2021) ) Risk factors associated with Alzheimer Disease and related dementias by sex and race ethnicity in the US. JAMA Neurol 79: , 584–591. |
[3] | United States Census Bureau. California 2020 Census. |
[4] | CDC-BRFSS. Centers for Disease Control (CDC) - BRFSS. https://www.cdc.gov/brfss/index.html. |
[5] | Alzheimer’s Association. California’s State Plan for Alzheimer’s Disease: An Action Plan for 2011-2021. https://www.alz.org/national/documents/stateplan-calif.pdf. Accessed September 20, 2021. |
[6] | ((2019) ) Risk Reduction of Cognitive Decline and Dementia: WHO Guidelines. World Health Organization, Geneva. |
[7] | Barnes DE , Yaffe K ((2011) ) The projected impact of risk factor reduction on Alzheimer’s disease prevalence. Lancet Neurol 10: , 819–828. |
[8] | Norton S , Matthews FE , Barnes DE , Yaffe K , Brayne C ((2014) ) Potential for primary prevention of Alzheimer’s disease: An analysis of population-based data. Lancet Neurol 13: , 788–794. |
[9] | Kaiser HF ((1960) ) The application of electronic computers to factor analysis. Edu Psychol Meas 20: , 141–151. |
[10] | Levin M ((1953) ) The occurrence of lung cancer in man. Acta Unio Int Contra Cancrum 9: , 531–541. |
[11] | Livingston G , Huntley J , Sommerlad A , Ames D , Ballard C , Banerjee S , Brayne C , Burns A , Cohen-Mansfield J , Cooper C , Costafreda SG , Dias A , Fox N , Gitlin LN , Howard R , Kales HC , Kivimäki M , Larson EB , Ogunniyi A , Orgeta V , Ritchie K , Rockwood K , Sampson EL , Samus Q , Schneider LS , Selbæk G , Teri L , Mukadam N ((2020) ) Dementia prevention, intervention, and care: 2020 report of the Lancet Commission. Lancet 396: , 413–446. |
[12] | Mukadam N , Sommerlad A , Huntley J , Livingston G ((2019) ) Population attributable fractions for risk factors for dementia in low-income and middle-income countries: An analysis using cross-sectional survey data. Lancet Glob Health 7: , e596–e603. |
[13] | U.S. News & World Report ((2019) ) Public health rankings: Measuring the health of state populations. https://www.usnews.com/news/best-states/rankings/health-care/public-health. |
[14] | Lightwood J , Glantz SA ((2013) ) The effect of the California Tobacco Control Program on smoking prevalence, cigarette consumption, and healthcare costs: 1989-2008. PLoS One 8: , e47145. |
[15] | Kindig D , Peppard P , Booske B ((2010) ) How healthy could a state be? Public Health Rep 125: , 160–167. |
[16] | Ashby-Mitchell K , Willie-Tyndale D , Eldemire-Shearer D ((2020) ) Proportion of dementia explained by five key factors in Jamaica. J Alzheimers Dis 78: , 603–609. |
[17] | de Oliveira FF , de Almeida SS , Chen ES , Smith MC , Naffah-Mazzacoratti MG , Paulo HF ((2018) ) Lifetime risk factors for functional and cognitive outcomes in patients with Alzheimer’s disease. J Alzheimers Dis 65: , 1283–1299. |
[18] | Falck RS , Best JR , Davis JC , Liu-Ambrose T ((2018) ) The independent associations of physical activity and sleep with cognitive function in older adults. J Alzheimers Dis 63: , 1469–1484. |
[19] | Scarmeas N , Stern Y , Tang MX , Mayeux R , Luchsinger JA ((2006) ) Mediterranean diet and risk for Alzheimer’s Disease. Ann Neurol 59: , 912–921. |


