
Contrast Enhanced Magnetic Resonance Imaging of Amyloid-β Plaques in a Murine Alzheimer’s Disease Model
Abstract
Background:
Early detection of amyloid-β (Aβ) aggregates is a critical step to improve the treatment of Alzheimer’s disease (AD) because neuronal damage by the Aβ aggregates occurs before clinical symptoms are apparent. We have previously shown that luminescent conjugated oligothiophenes (LCOs), which are highly specific towards protein aggregates of Aβ, can be used to fluorescently label amyloid plaque in living rodents.
Objective:
We hypothesize that the LCO can be used to target gadolinium to the amyloid plaque and hence make the plaque detectable by T1-weighted magnetic resonance imaging (MRI).
Methods:
A novel LCO-gadolinium construct was synthesized to selectively bind to Aβ plaques and give contrast in conventional T1-weighted MR images after intravenous injection in Tg-APPSwe mice.
Results:
We found that mice with high plaque-burden could be identified using the LCO-Gd constructs by conventional MRI.
Conclusion:
Our study shows that MR imaging of amyloid plaques is challenging but feasible, and hence contrast-mediated MR imaging could be a valuable tool for early AD detection.
INTRODUCTION
Alzheimer’s disease (AD) is a neurodegenerative disease that causes dementia. The diagnosis is given based on clinical symptoms, such as amnesia or functional disabilities, and supportive laboratory tests. However, it is believed that pathological changes in the brain such as the formation of amyloid-β (Aβ) plaques and neurofibrillary tangles (NFTs) are present before clinical symptoms are experienced [1, 2].
While the cause of AD is not fully understood, it is hypothesized that Aβ aggregates play an important role in the pathogenesis. Aβ plaques are present in the brain before clinical signs can be found, hence successful therapies should start also before clinical symptoms and neuronal damage are detected [3]. Positron emission tomography (PET) provides a molecular imaging modality to quantitatively image Aβ plaque and NFTs using molecular tracers which specifically target these aggregated proteins [4]. PET imaging has revolutionized the field of AD diagnosis and patient stratification and can also be complemented with metabolic and inflammatory markers [4]. Notwithstanding, PET imaging tracers are based on the short-lived radionuclides 11C and 18F which necessitate proximal location of PET imaging with radiochemistry and cyclotron production. Magnetic resonance imaging (MRI) provides an attractive complement to PET, especially in the context of targeted imaging molecules for contrast enhancement. Detection by MRI is advantageous over PET as MRI is more accessible, does not require radionuclides and MRI probes can be easily transported and stored.
In previously published work, we have synthesized fluorescent ligands, denoted luminescent conjugated oligothiophenes (LCOs), that pass the blood-brain barrier (BBB) and have strong affinity for Aβ plaques [5]. LCO ligands for PET imaging have also been experimentally assessed, but extensive blood-residence precluded reliable PET imaging due to the short time-frame accessible by 11C and 18F radionuclides [6]. In the present study, we show that the LCO can be attached to a dodecane tetraacetic acid (DOTA)-cage chelated with Gadolinium III (Gd), cross the BBB in mice and be used to stain Aβ plaques in vivo. We also show how the T1-lowering effect of the paramagnetic Gd of the probe makes in vivo plaque-detection possible on T1-weighted MRI. We used the Tg-APPSwe AD model [7] and show detection of Aβ plaques in Tg-APPSwe mice ranging from 19–28 months of age. While this is a model with extensive Aβ amyloid load, our work provides an alternative and relatively rapid method to screen for early signs of Aβ plaque formation that could be used to screen patients with a risk of developing AD and start treatment before irreversible neural damage has occurred.
MATERIALS AND METHODS
Chemical characterization
Nuclear magnetic resonance (NMR) spectra were recorded on a Varian instrument (1H 300 MHz, 13C 75.4 MHz) with solvent indicated. Chemical shifts were reported in ppm on the δ scale and referenced to the solvent peak.
Analytical liquid chromatography was performed on a Waters system equipped with a Waters 1525 gradient pump, 2998 Photodiode Array Detector, 2424 Evaporative Light Scattering Detector, SQD2 Mass Detector and an Xbridge©C18 column (4.6×50 mm, 3.5μm). Gradient system: (A) 95:5 water:acetonitrile, 10 mM NH4OAc; (B) 90:10 acetonitrile:water, 10 mM NH4OAc. Preparative liquid chromatography was performed on the same Waters system using a 2535 quaternary gradient pump and Xselect© phenyl-hexyl column (19×250 mm, 5.0μm). Flow rate 25 mL/min. A linear gradient of A (95:5 water:acetonitrile, 10 mM NH4OAc) and B (90:10 acetonitrile:water, 10 mM NH4OAc) was used. Mass spectrometry (MS) data were recorded on a Waters SQ Detector 2.
Synthesis of compound 2
The chemical structure of material 1, 2, and 3 is shown in Fig. 1. The synthesis of starting material 1 has been previously reported [8]. Methanol (10 mL) was added, and the solution was azeotrope concentrated (toluene) in vacuo to remove any residual trifluoracetic acid. The crude material was retrieved as a red solid quantitatively (0.568 g) and used in the next step without further purification. The deprotected material was dissolved in DMF (10 mL) and triethylamine was used to ensure basic pH of the solution before DOTA-mono-NHS (0.418 g, 0.834 mmol) was added. The reaction was left over night and the mixture was azeotrope concentrated with toluene. The final ester hydrolysis was achieved by dissolving the crude material in 1M LiOH (12 equivalents) and stirring for 1 h. Completion of the reaction was confirmed by analytical LC-MS. The reaction mixture was filtered before purification by preparative HPLC (Rt= 6.31 min, 0–75% eluent B in eluent A in a linear gradient over 6 min followed by isocratic 75 % eluent B. Product 2 (0.247 g, 30 % over three steps) was obtained as a red solid. 1H NMR (300 MHz, D2O) δ 3.03 (s, 8H), 3.32–3.56 (m, 18H), 3.57–3.68 (m, 14H), 3.74s, 4H), 6.92 (d, J = 3.8 Hz, 1H), 6.96 (s, 2H), 6.98 (d, J = 3.8 Hz, 1H), 7.08 (s, 1H), 7.09 (s, 1H), 7.42 (d, J = 3.7 Hz, 2H). 13C NMR (75 MHz, D2O) δ 22.3, 37.3, 39.9, 40.6, 52.1, 52.8, 56.2, 57.9, 70.1, 70.2, 70.7, 70.9, 70.9, 71.0, 125.2, 125.3, 127.8, 127.9, 129.5, 130.0, 131.0, 131.1, 133.1, 133.6, 133.9, 134.0, 135.0, 135.8, 136.1, 136.3, 137.5, 140.1, 141.9, 142.4, 164.1, 168.6, 170.5, 176.3, 176.3, 177.0. MS: m/z calcd for C50H59N6O17S5 M-H)– 1175.3. Found 1175.2.
Fig. 1
The synthesis and resulting chemical structure of the product 3, LCO-DOTA-GD.
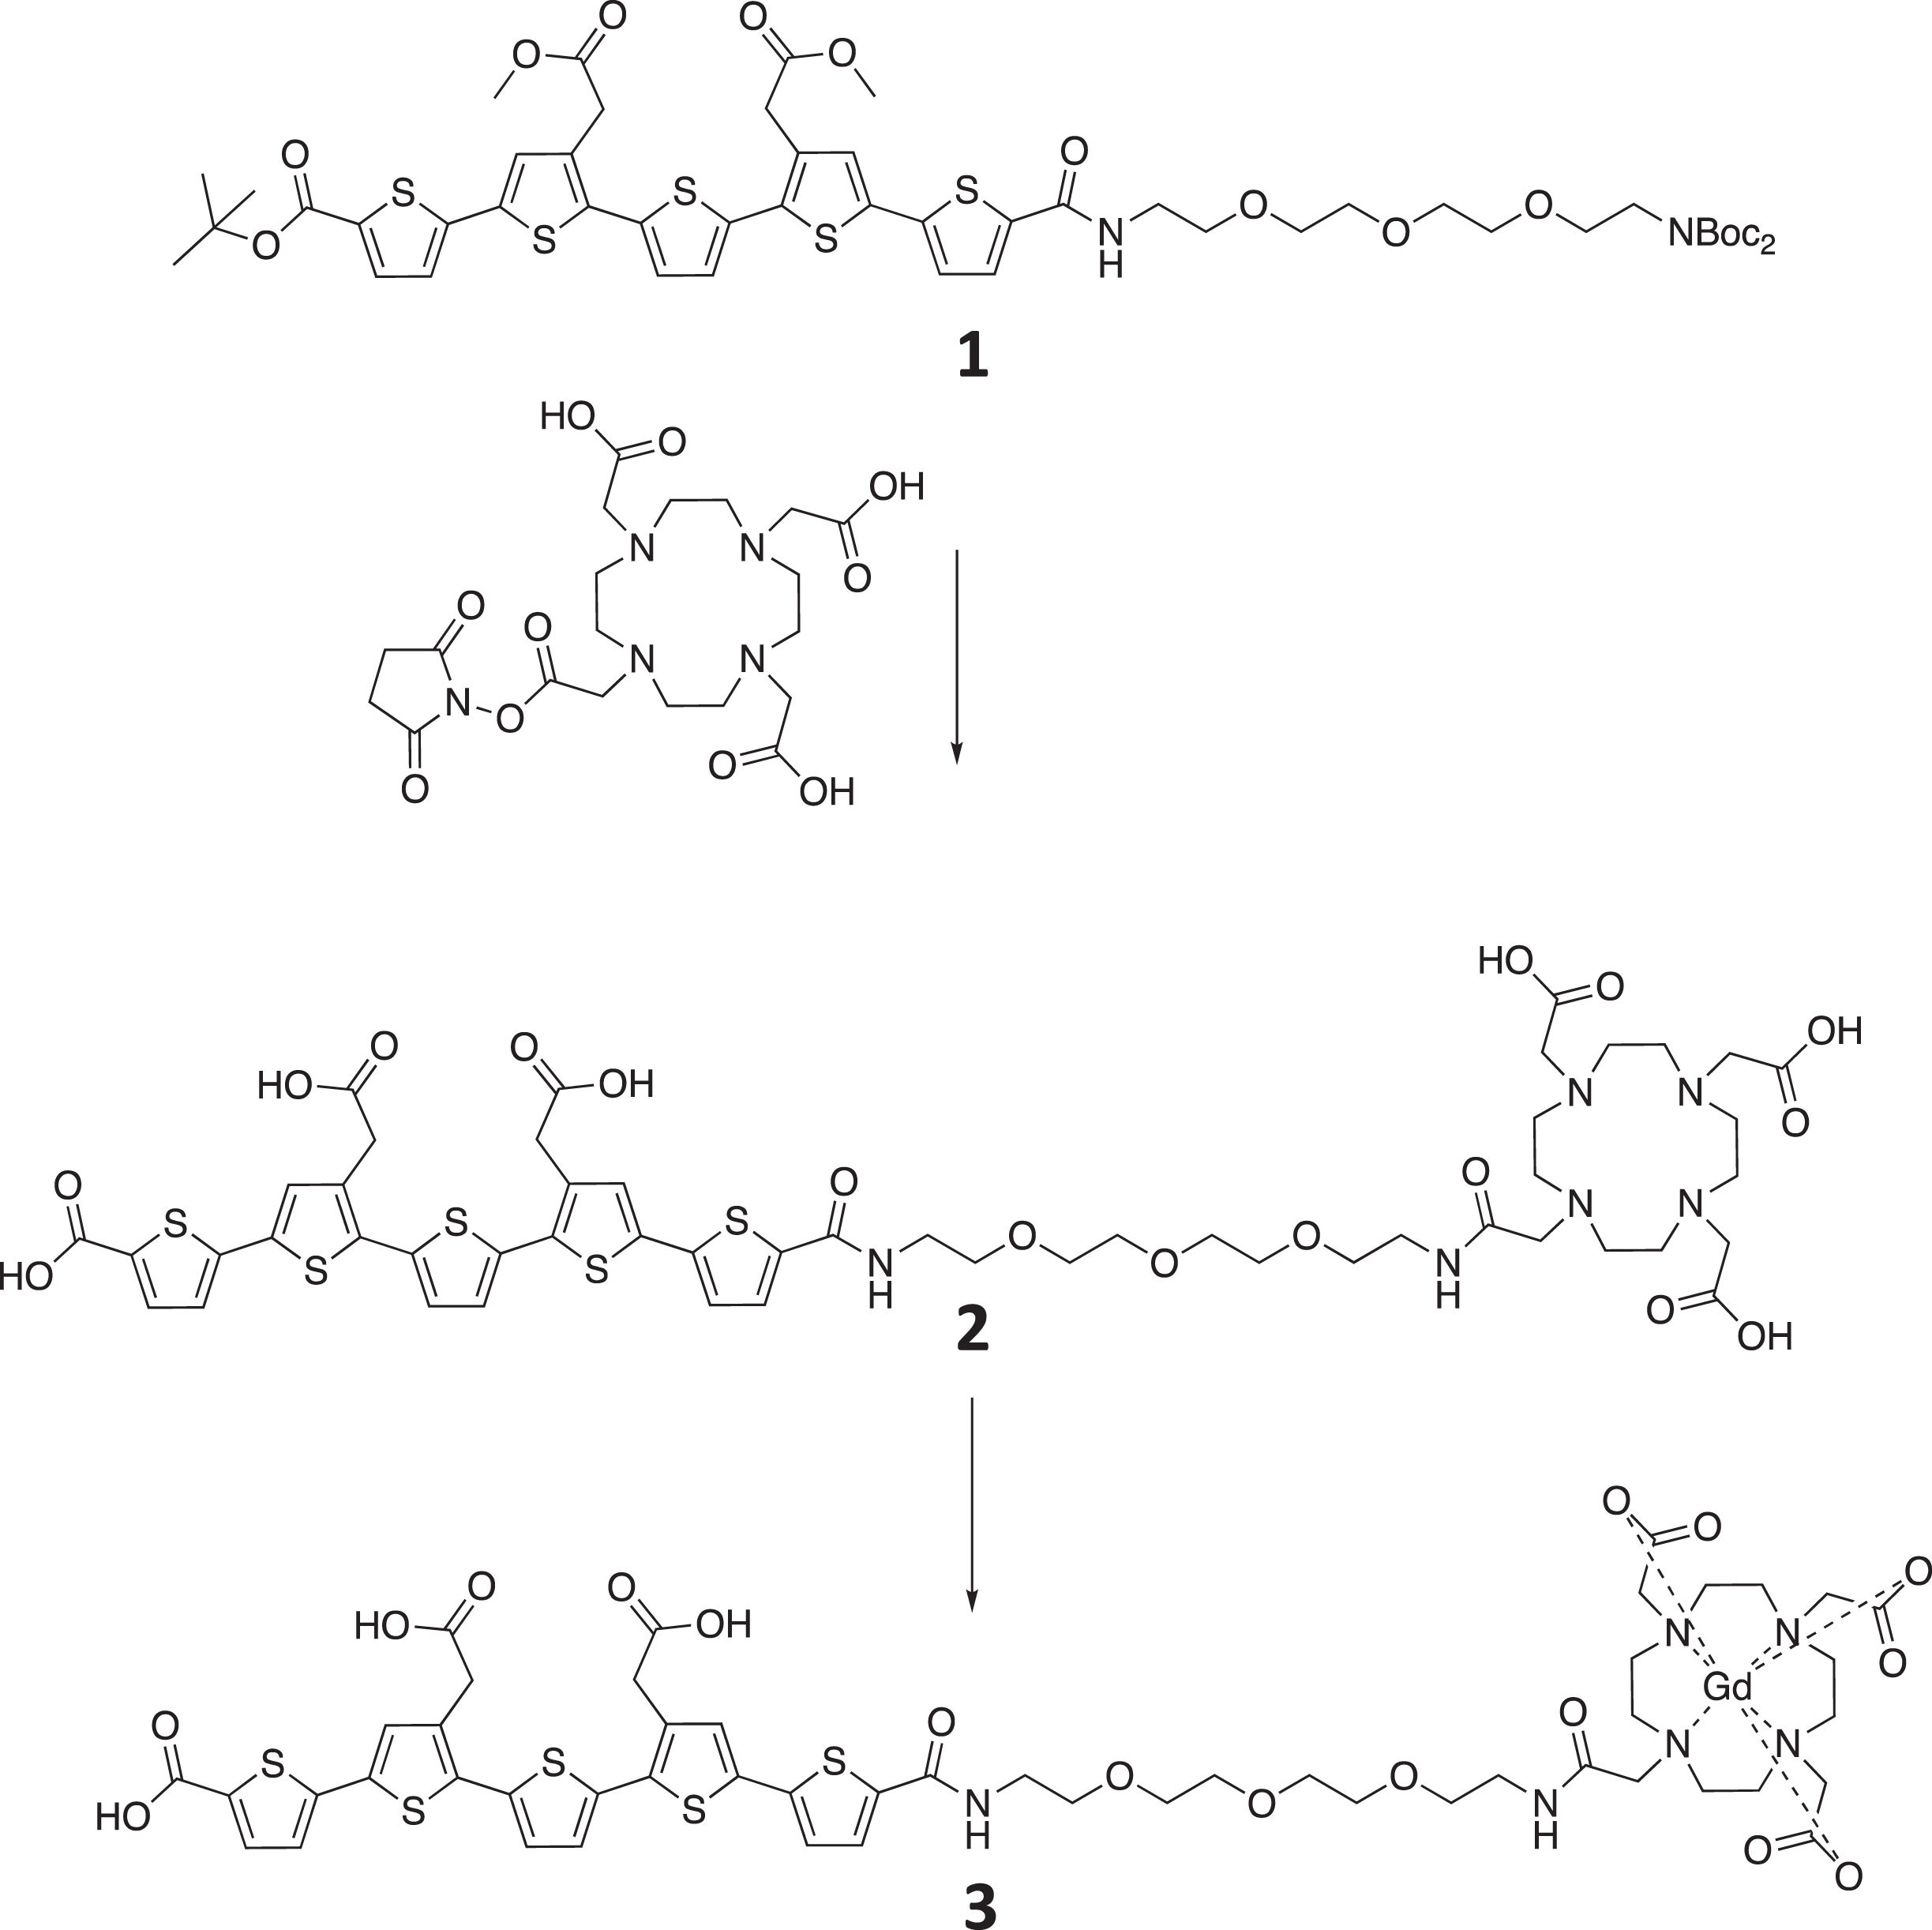
Synthesis of compound 3
2 (0.332 g, 0.282 mmol) was dissolved in water (16 mL) and gadolinium (III) chloride hexahydrate (0.131 g, 0.352 mmol) was added. Solution became acidic (≈pH2) and the solubility decreased after addition of the latter. The mixture was stirred for 2 h and 1 NaOH was added until basic pH whereupon the solubility increased. Complexation of gadolinium with target compound was confirmed by analytical LC-MS before and after addition of NaOH. The basic reaction mixture was injected on, and purified by, preparative HPLC (Rt= 5.24 min, 0–50% eluent B in eluent A in a linear gradient over 7 min) to give target compound 3 (0.297 g, 79 %) as a red solid. MS: m/z calcd for C50H56GdN6O17S5 (M-H)– 1330.2. Found 1330.3.
The synthesis was achieved in 5 steps resulting in 82 % yield. Product 2 was confirmed by NMR and product 3 by mass spectrometry, as the gadolinium broadened the peaks significantly.
All animal experiments were performed according to the European Communities Council Directive of 24 November 1986 (86/609/EEC) and Norwegian law and approved by the Norwegian Food Safety Authority. Measures were taken to minimize pain or discomfort by the animals. Animals were housed in groups and their environment were enriched by adding bedding material and chewing toys. Male and female APP transgenic mice with the Swedish APP mutation (Tg-APPSwe) [9] aged between 19 and 28 months were bred in-house. In addition, healthy C57BL/6J mice at 20 weeks age were purchased and used as controls. The animals were fed ad libitum and were on a 12-h day/night cycle in a pathogen-free, temperature-controlled environment.
To investigate the optimal timepoint for detection of MRI contrast related to LCO-DOTA-Gd in the brain after intravenous injection, MRI with T1-mapping was performed on three animals (21–22 months old), 2 h, 1 day, 3 days, and 7 days after injection of 44μmol/kg LCO-DOTA-Gd. To investigate the influence of age and amount of plaque needed to detect LCO-DOTA-Gd related changes on the MRI, Tg-APPSwe mice at ages 19 (n = 2), 21 (n = 6), and 28 months (n = 5) in addition to 6 C57BL/6J mice at age of 20 months were scanned before and 7 days after injection of LCO-DOTA-Gd (0.5 mmol/kg), and T1-weighted images and T1-maps were acquired. MR scanning was performed on a 7 Tesla small animal MR system (Bruker Biospec 70/20 USR Avance III Bruker BioSpin, Ettlingen, Germany) with an 86 mm circular polarized volume coil for RF transmission and a 4-channel phased array mouse head surface coil for reception (both Bruker Biospin). A Rapid Acquisition with Relaxation Enhancement (RARE) sequence was used for all imaging with different settings. T1-weighted images: RARE factor 4, effective TE 6.3 ms, TR 1300 ms, 16 averages, FOV 20×15 mm2, MTX 256×192, spatial resolution 78×78μm2, 16 coronal slices á 0.5 mm with 0.25 mm slice gaps, acquisition time 12 min and 28 s. T1-maps: RARE factor 2, effective TE: 7 ms, TRs: 5000, 3000, 1500, 800, 500, 410; 2 averages, FOV 20×15 mm2, MTX 128×96, spatial resolution 156×156μm2, 16 coronal slices á 0.5 mm with 0.25 mm slice gaps and acquisition time 19 min and 14 s. On day 7 the animals were euthanized, and the brains were harvested and frozen for sectioning into 25μm sections.
MR Image analysis: T1-maps were calculated by fitting of the signal intensity to the different TRs in the T1-mapping sequence using in-house made Matlab scripts. Brains were manually segmented out on the T1-weighted image volumes and co-registered to a brain template using tools (FSLeyes and FLIRT) [10] of the FMRIB software library (FSL version 4.1.4, Oxford Centre for Functional MRI of the Brain, UK; http://www.fmrib.ox.ac.uk/fsl [11]. Using the same transformation matrices, the T1-maps were also co-registered to the template. A reduced version of an MRI atlas of the C57BL/6J brain [12] where minor brain regions had been fused to larger anatomical regions, was co-registered to the same template brain. The transformation matrices from the co-registrations to the template were then used to co-register the atlas to the individual mouse brain T1-weighted images and T1-maps using FLIRT. Average signal intensity in the T1-weighted images and average T1-values in the anatomical regions (derived from the atlas) were then calculated for each animal. The mice at 19 and 21 months of age were pooled into a group called “TgSwe 20 months” for analysis.
Antibody staining of Aβ plaques
Sections from Tg-APPSwe mice were frozen and sectioned to 25μm sections. Before staining, the sections were fixated with acetone for 2 min and washed in PBS. The sections were then permeabilized by covering the section with 0.1% Triton X-100 for 10 min and washed with PBS. The sections were then stained with the primary antibody (Anti-β-Amyloid, 17–24, clone 4G8, Biolegend, 1:50 dilution in PBS with 1% BSA) for 1 h at room temperature. Subsequently, the sections were washed 3×5 min in PBS before staining with the Alexa Fluor 594 labelled secondary antibody (ThermoFisher #A-11005, 1:50 dilution in PBS with 1% BSA) for 1 h. Finally, the sections were washed 3×5 min in PBS and mounted using Vectashield H-1000 mounting medium.
The sections were then imaged on a Zeiss Axio microscope using a sequential scan to image first LCO and secondly the antibody staining of the amyloid plaque.
Confocal laser scanning microscopy (CLSM)
25μm frozen sections were mounted with mounting media (VectorLabs) and imaged using tile scanning on a Zeiss Axio with a 10x/0.3 air objective. Image analysis was performed in FIJI. The images were manually segmented using the same brain atlas as for MRI into different functional region. For each region, the average intensity of LCO was measured and used for further quantification and analysis. Statistical analyses were performed in GraphPad Prism.
RESULTS
To investigate the optimal time-point for imaging after injection, we imaged a few mice daily up to a week after the injection (not shown). This imaging showed increasing amounts of high-signal spots on T1-weighted images in the cerebral cortex over the days following injection, likely reflecting a T1-reduction caused by accumulation of the LCO-DOTA-Gd onto Aβ plaques. Based on this, imaging at seven days after injection was chosen for the main study. This late timepoint is due to the long circulation time of the LCO-DOTA construct. The decrease in T1 signal up to a week after injection that also coincide with the increase in fluorescence previously seen for the unmodified LCO over a similar time frame, is a clear indication that LCO-DOTA-Gd not only enters the brain intact but that it is also dependent on an uptake mechanism that is likely not reliant on a leaky BBB. With regard to the phenotype, in general, studies do not find BBB penetrance of small molecules being much affected neither in young nor in middle-aged plaque-depositing APP-transgenic mice [13, 14]. Aging is also an important factor and here some mice were very old. BBB leakage in aged APP mice when they occur, are typically limited locally and associated with CAA pathology. In contrast, ex vivo fluorescent images presented here show a widespread LCO-staining in brain tissue. The experimental sequence is shown in Fig. 2. T1-weighted images showed clear spots of high signal in the cortical areas of 3 out of 14 Tg-APPSwe animals in the study, all of them 28 months old. To verify that the fluorescence detected ex vivo were from amyloid plaques, an antibody co-staining was performed which showed excellent coincidence of the staining from LCO-DOTA-Gd and the antibody (Fig. 3).
Fig. 2
Illustration of experimental sequence and acquired data. A) The age of the Tg-APPSwe mice was 18–30 months. They were pre-imaged, injected with LCO-DOTA, re-imaged 1, 3, and 7 days later. B) Images showing the T1-map, T1-weighted imaging, and the confocal microscopy imaging of the same brain section for wild type and Tg-APPSwe mice.
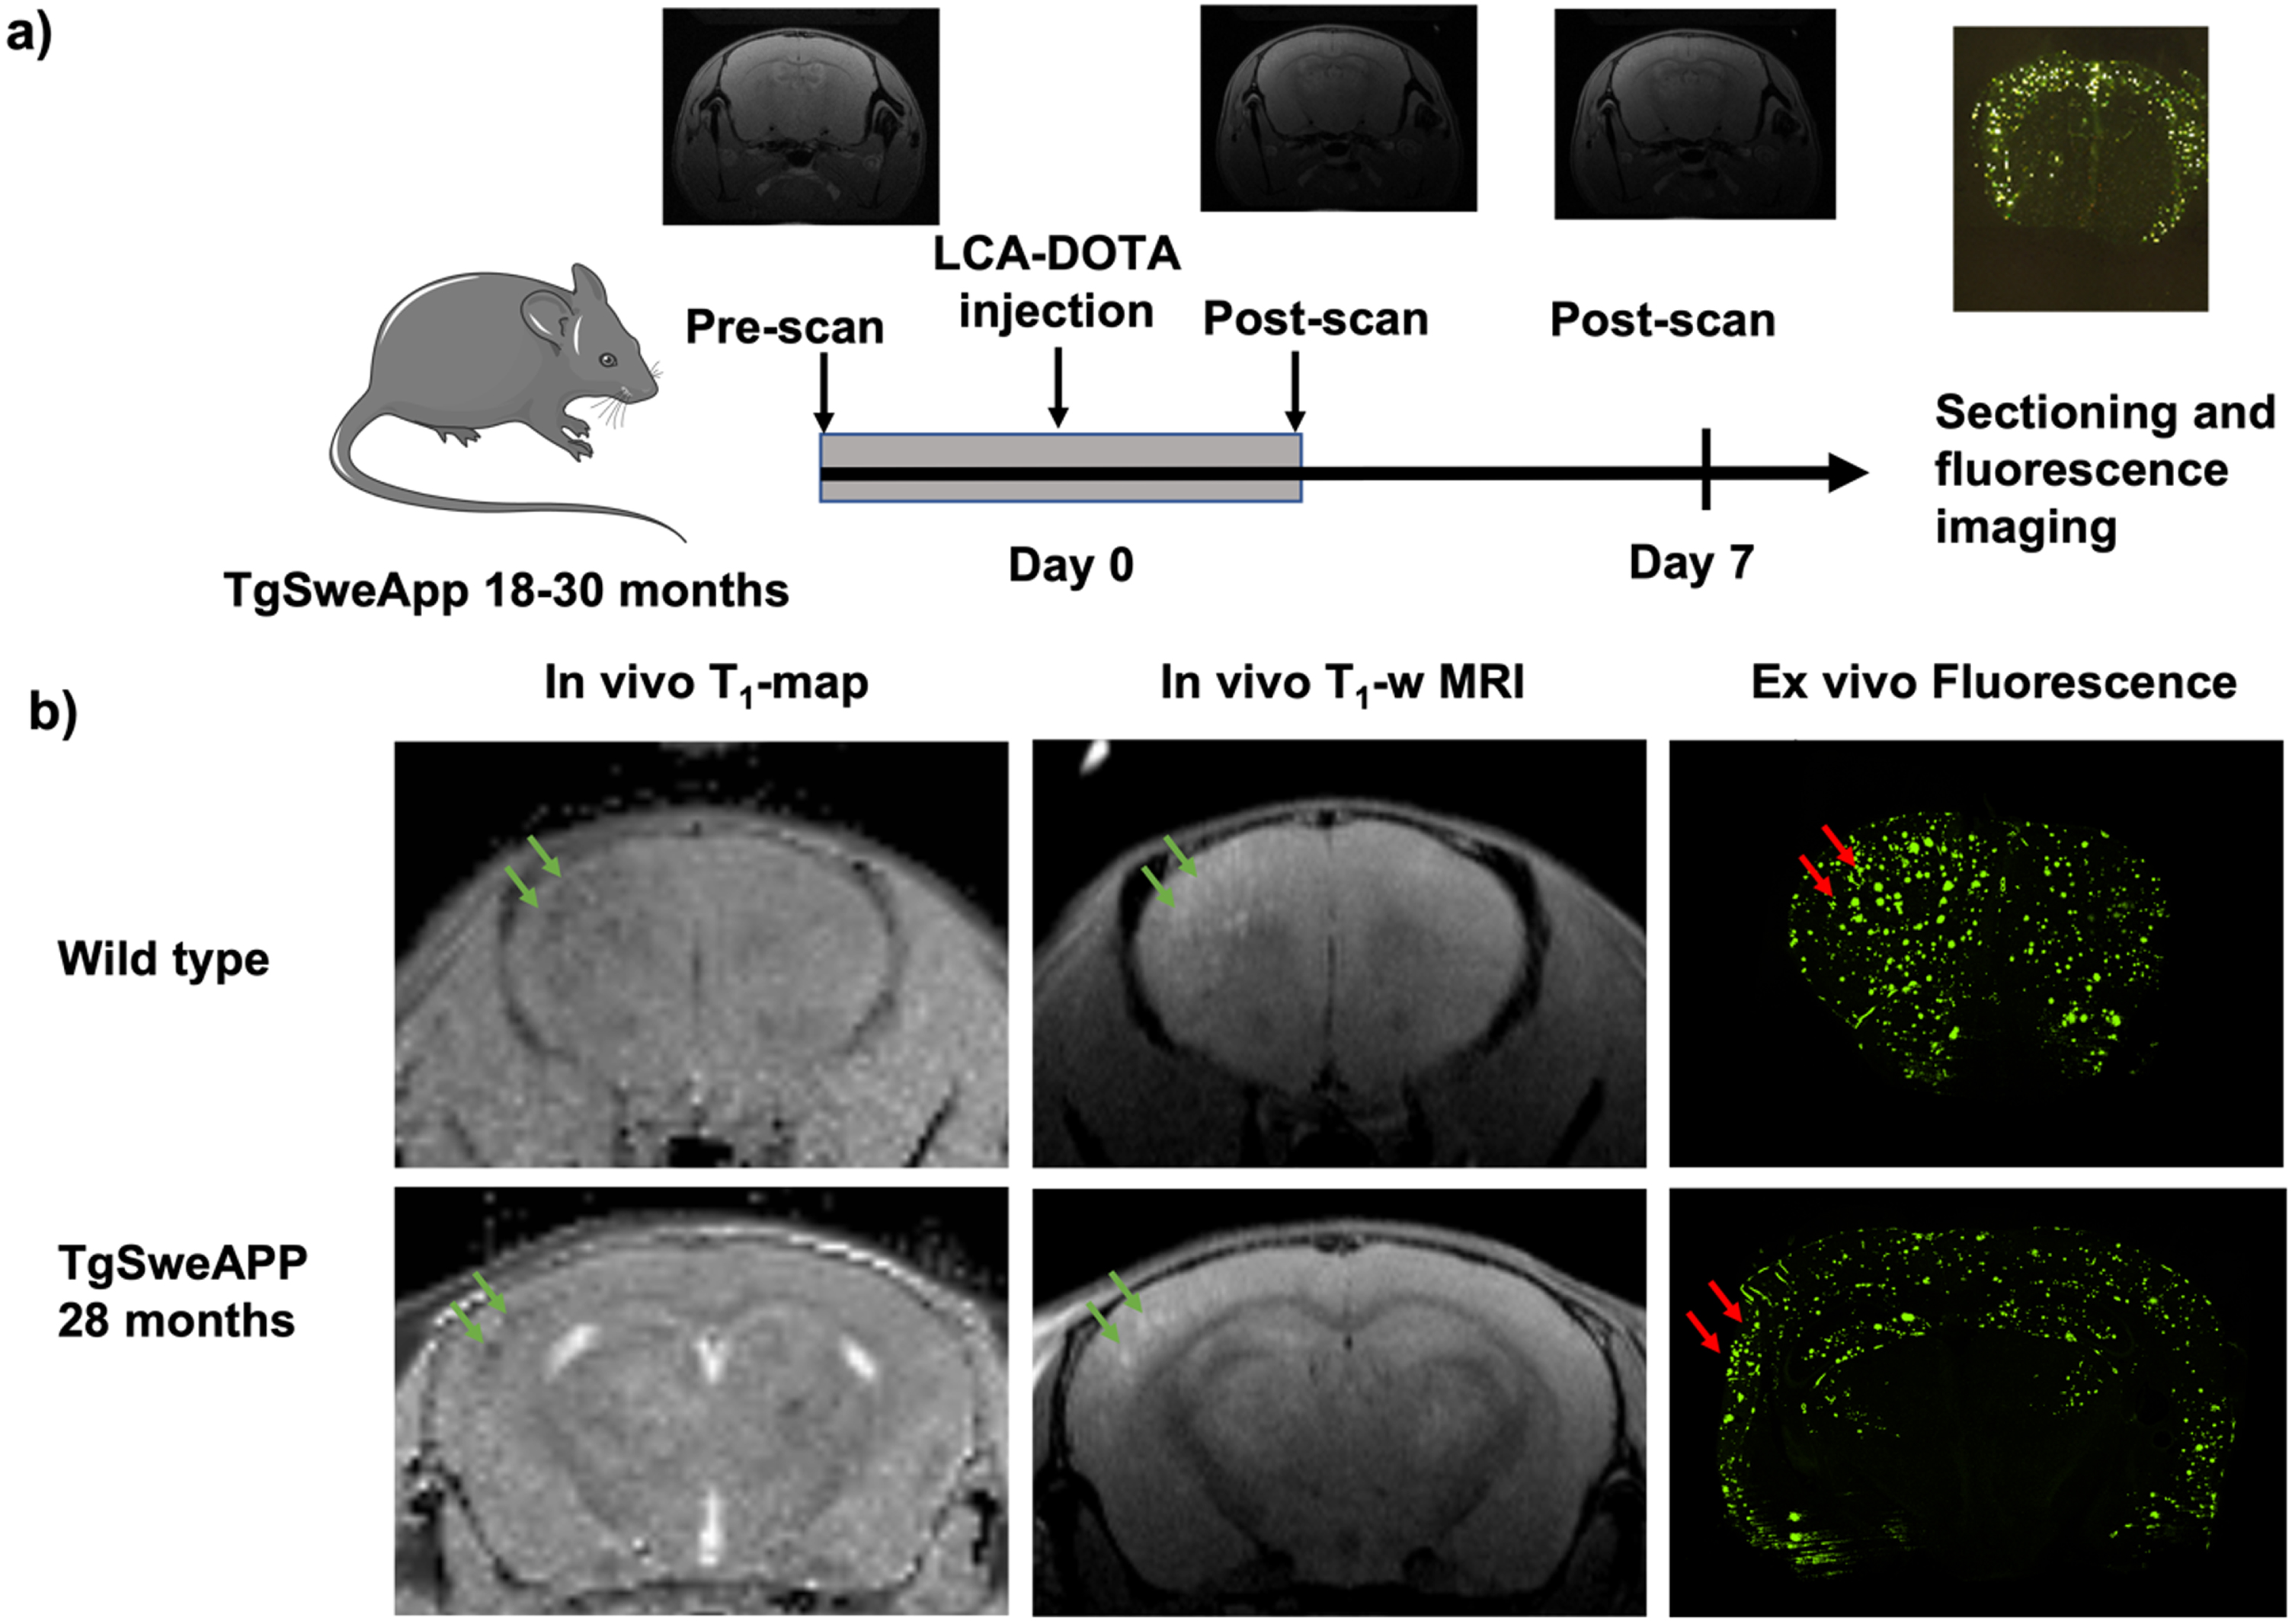
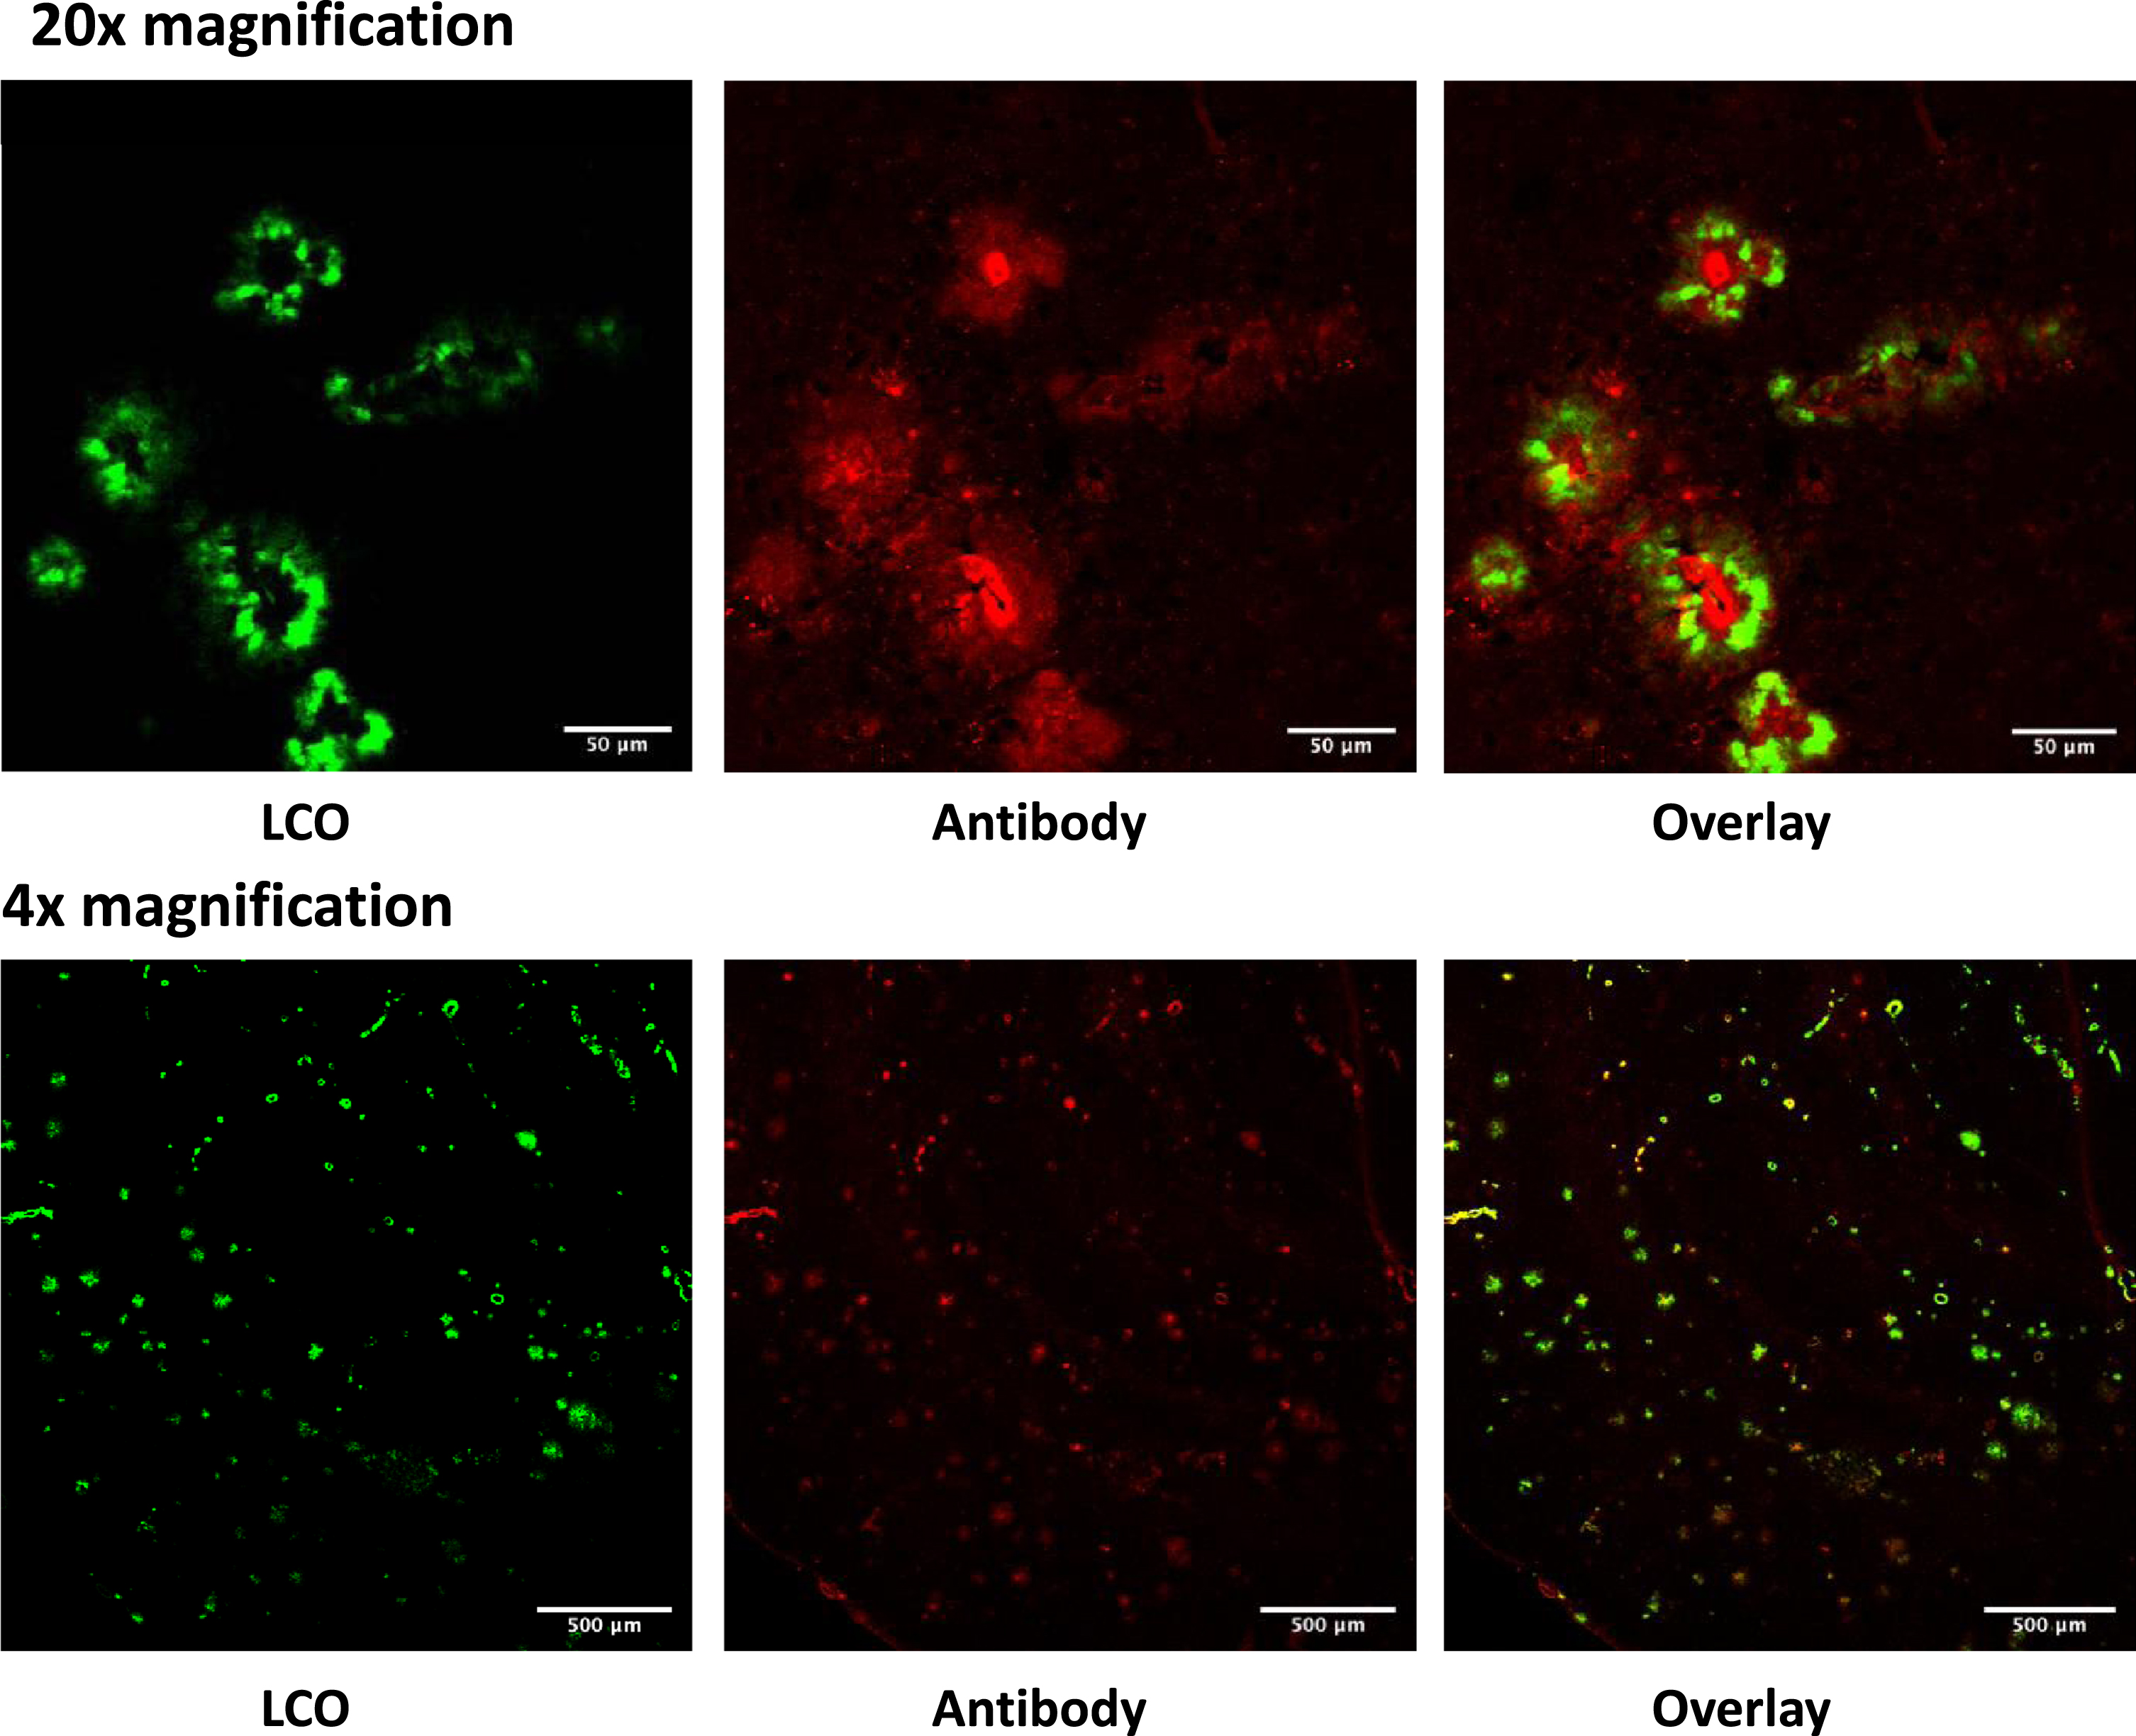
Fig. 3
Sections from the brain of 28 months old TgAPPSwe mice labelled in vivo with LCO-DOTA (green) and stained with an anti-amyloid plaque (4G8) antibody (red). The images show that the two stains label the same objects albeit at different binding sites.
After seven days, the brains were removed, sectioned, and imaged by CLSM. The probe weakly stained blood vessels in all animals including wild type (C57BL/6) mice, probably due to LCOs that were still in circulation. The Tg-APPSwe AD model gives a variation in the amount of plaque formed at all ages. Figure 3d shows that the mice ≤21 months of age generally had low amounts of plaque in the brain and were comparable to the wild type when analyzed with LCO-DOTA-Gd. The Tg-APPSwe mice of age 28 months generally had a much stronger fluorescence, reflecting a higher plaque-load, especially in the cerebral cortex. However, also in this age group, there was a large variation in amount of plaque between animals, ranging from the control animals and upwards. As can be seen in Fig. 4c and d, age was in general not a good predictor for neither T1 levels nor fluorescence signal in the brain as a whole, reflecting the large variation in plaque load within both age groups.
Fig. 4
T1-values from MRI, compared with LCO fluorescence intensity from CLSM. A) average T1-values in different regions of the brain for middle-aged Tg-APPSwe mice, old Tg-APPSwe mice and wild type mice showing a reduction in T1-values for old mice. Error bars indicate S.E.M. B) T1-values versus fluorescence intensity from the somatosensory cortex and representative CLSM images from the animals of different age and plaque-burden. C) average T1-values vs age. D) Average fluorescence intensities vs age. E–H) average T1-values vs fluorescence intensities in the whole brain (E), entorhinal cortex (F), piriform cortex (G), and frontal region (H).
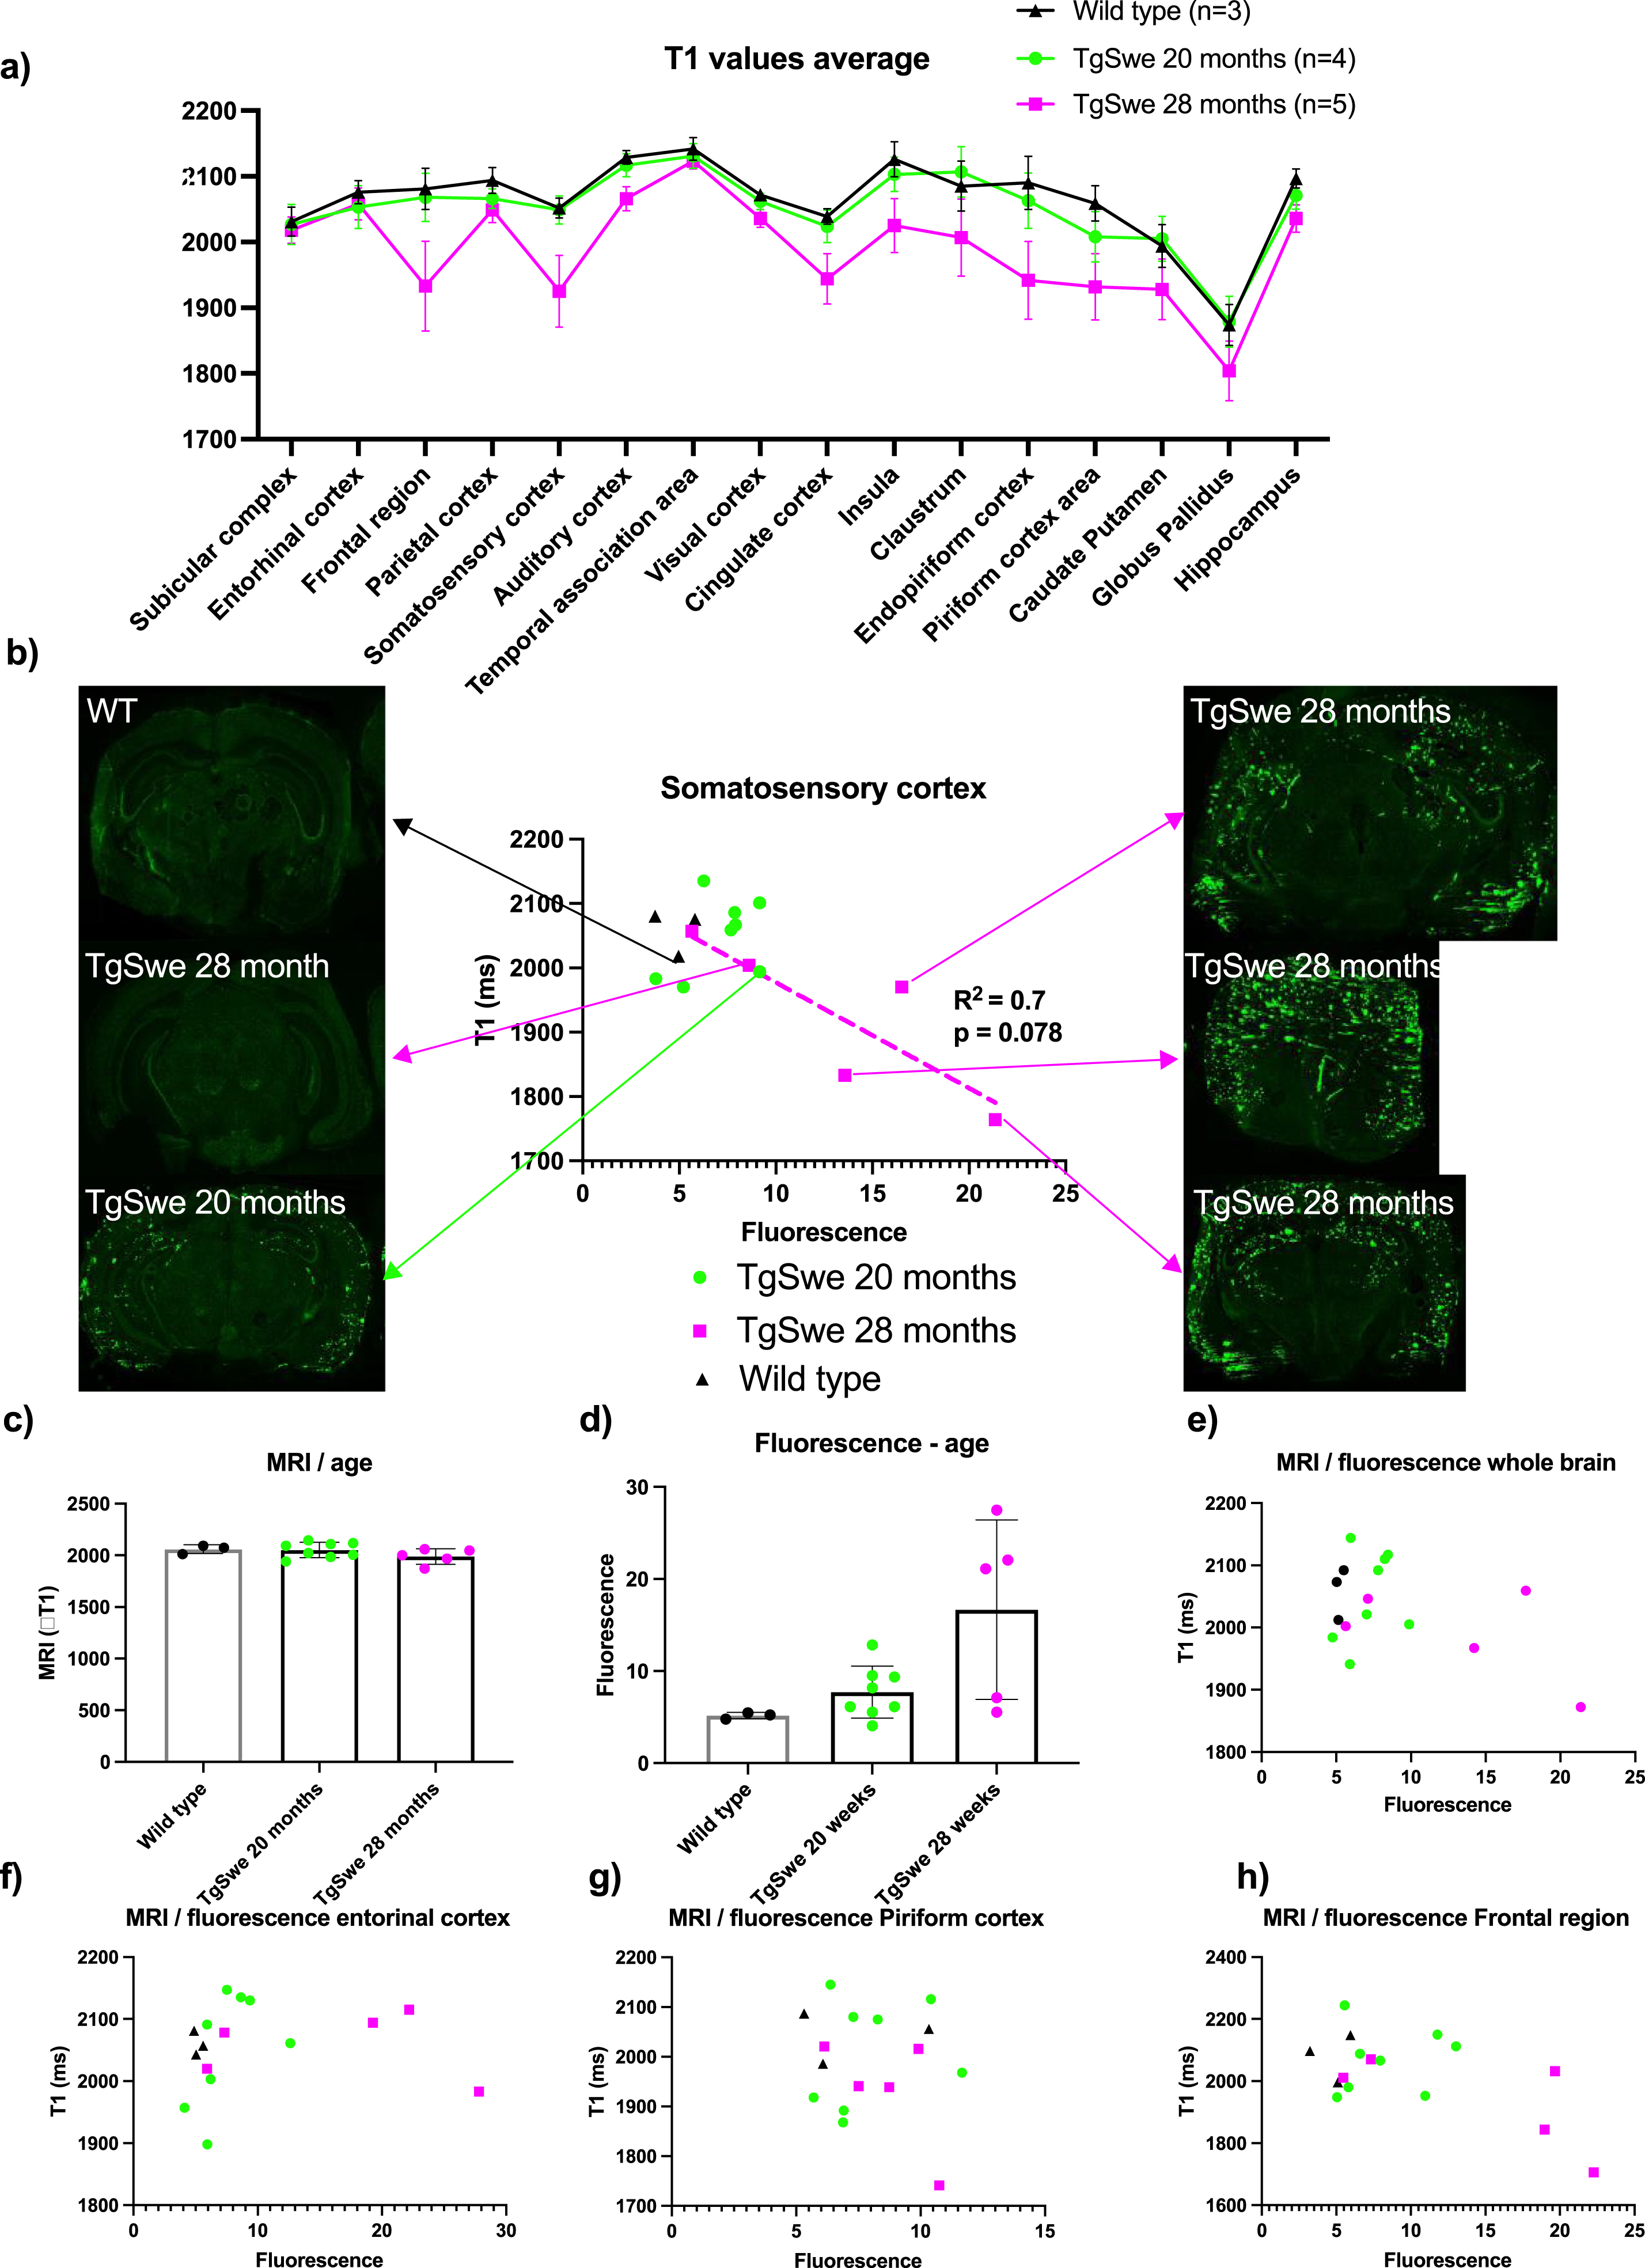
MRI on day 7 after injection of the probe showed that T1-values on average was lower in the 28-month-old Tg-APPSwe mice in most regions of the brain and most reduced in the frontal region and somatosensory cortex compared to the 20-month-old Tg-APPSwe mice and wild type mice (Fig. 3a). This group difference was significant when looking at all regions together (p < 0.001, two-way ANOVA), but individual t-test for the separate regions did not give adjusted p-values below 0.05, likely due to the large variation among the 28-month-old Tg-APPSwe mice and a low number of animals. The lower T1 among the 28-month-old Tg-APPSwe mice probably reflects a higher concentration of the probe in the tissue as the Gd attached to the probe acts as a MRI contrast agent reducing the tissue T1-value. When comparing the LCO fluorescence intensity versus the T1-value in selected regions (Fig. 4b e–g), we found an agreement between fluorescence intensity and T1-level in the regions with a strong fluorescence signal. Especially in the larger regions (somatosensory cortex and frontal region of the cerebral cortex), there was a clear correlation between the level of T1 and the fluorescence signal with an R2 of 0.7 (p = 0.08) for the somatosensory cortex (Fig. 3b).
DISCUSSION
In this study we found that a reduction in T1-values correlated with mouse age and local plaque burden in highly affected regions of the brain. This shows that the reduction in T1 values seen on MRI, reflects higher concentrations of the probe in these regions that again reflects Aβ plaque load. However, in regions where less fluorescence intensity was detected (such as piriform cortex) no correlation was found with T1-levels. This could reflect inaccuracies in co-localization and partial volume effects, as most of the regions were small and there is a difference in in-plane resolution and slice thickness between the optical images and MR images. Furthermore, other tissue factors do also influence T1 values and for reliable detection of the probe using MRI, the lowering of T1-values by Gd attached to the probe must be significantly greater than the natural variation of T1. Further optimization of the amount of probe to be injected, timing of MRI and the MRI sequences could improve the accuracy of this probe to detect in vivo plaque load.
Tg-APPSwe mice were used at the age of 19–28 months, this is when Aβ plaque load is expected to rise above 1% in the model [15, 16]. LCO accumulation on cerebral Aβ plaque after 24 h intravenous administration has been demonstrated [17]. It has also been shown that the amyloid binding specificity of LCO remains intact after changes to the thiophene backbone of the LCO, conjugation to PEGs or even as a targeting ligand on nanoparticles and porphyrins [6, 8, 18–22]. Based on previous experiments injecting the LCO in mice, we have seen the LCO accumulating in the brain over the first seven days [23].
Today, diagnosis of AD relies on clinical symptoms accompanied by brain imaging such as structural MRI to rule out other causes and to determine degree of neurodegeneration, and 18F-FDG PET is used to assess regional brain activity and changes in brain physiology [24]. While this is robust for diagnosing, it depends on neurodegeneration and physiological changes and is better at confirming the diagnosis based on clinical symptoms than for early detection. Amyloid PET, with contrast agents similar to our LCO construct, but PET-labelled, have also recently become in use in research settings [25]. These methods are promising for early detection and diagnosis, the drawback is the expense and availability of PET imaging.
In this study, we show that amyloid imaging using an MRI probe is feasible and should warrant further research to optimize probe design, MRI protocols for accurate detection and toxicity studies. Much is still unknown about the LCO-DOTA-Gd probe such as toxicity, protein binding, non-targeted binding to various brain regions and vascular plaque, and these are important values to determine. Also, as this study is the first proof of principle study, it is underpowered in the number of animals used. Future development of the probe will include more mice with more diverse ages to more accurately evaluate the probes’ ability to detect disease progression. This would make it possible to decide with higher certainty the detection limit of the probe and hence its clinical relevance. While we are clearly able to detect plaques by standard MRI imaging in a mice model with Aβ plaques, the detection limit for plaque load and relation to disease progression in a human patient remains to be determined. In conclusion, robust detection of Aβ plaques using MRI is clearly within reach of the scientific community and shows promise for clinical translation in the not-too-distant future.
ACKNOWLEDGMENTS
We would like to thank Sofie Snipstad (NTNU) and Annemieke van Wamel (NTNU) for technical assistance. Sectioning of brains was performed at CMIC NTNU, MRI was performed at the MR core facility at NTNU, tumor implantation and animal housing at CoMed NTNU. Confocal imaging was done at the core facility CAM NTNU.
FUNDING
The project was supported by The Central Norway Regional Health Authority, project number 46084000 and The Research Council of Norway project number 240316 and the Swedish Research Council (Grant number 2016-00748).
CONFLICT OF INTEREST
The authors have no conflict of interest to report.
DATA AVAILABILITY
Raw data will be made available upon request.
REFERENCES
[1] | Gong NJ , Chan CC , Leung LM , Wong CS , Dibb R , Liu CL ((2017) ) Differential microstructural and morphological abnormalities in mild cognitive impairment and Alzheimer’s disease: Evidence from cortical and deep gray matter, Hum Brain Mapp 38: , 2495–2508. |
[2] | Rose SE , Janke AL , Chalk JB ((2008) ) Gray and white matter changes in Alzheimer’s disease: A diffusion tensor imaging study, J Magn Reson Imaging 27: , 20–26. |
[3] | Bateman RJ , Xiong C , Benzinger TL , Fagan AM , Goate A , Fox NC , Marcus DS , Cairns NJ , Xie X , Blazey TM , Holtzman DM , Santacruz A , Buckles V , Oliver A , Moulder K , Aisen PS , Ghetti B , Klunk WE , McDade E , Martins RN , Masters CL , Mayeux R , Ringman JM , Rossor MN , Schofield PR , Sperling RA , Salloway S , Morris JC , Dominantly Inherited Alzheimer Network ((2012) ) Clinical and biomarker changes in dominantly inherited Alzheimer’s disease, N Engl J Med 367: , 795–804. |
[4] | Chételat G , Arbizu J , Barthel H , Garibotto V , Law I , Morbelli S , van de Giessen E , Agosta F , Barkhof F , Brooks DJ , Carrillo MC , Dubois B , Fjell AM , Frisoni GB , Hansson O , Herholz K , Hutton BF , Jack CR Jr , Lammertsma AA , Landau SM , Minoshima S , Nobili F , Nordberg A , Ossenkoppele R , Oyen WJG , Perani D , Rabinovici GD , Scheltens P , Villemagne VL , Zetterberg H , Drzezga A ((2020) ) Amyloid-PET and (18)F-FDG-PET in the diagnostic investigation of Alzheimer’s disease and other dementias, Lancet Neurol 19: , 951–962. |
[5] | Åslund A , Sigurdson CJ , Klingstedt T , Grathwohl S , Bolmont T , Dickstein DL , Glimsdal E , Prokop S , Lindgren M , Konradsson P , Holtzman DM , Hof PR , Heppner FL , Gandy S , Jucker M , Aguzzi A , Hammarström P , Nilsson KPR ((2009) ) Novel pentameric thiophenederivatives for in vitro and in vivo optical imaging of aplethora of protein aggregates in cerebral amyloidoses, ACSChem Biol 4: , 673–684. |
[6] | Nordeman P , Johansson LB , Bäck M , Estrada S , Hall Hk , Sjölander D , Westermark GT , Westermark P , Nilsson L , Hammarström P ((2016) ) 11C and 18F radiolabeling of tetra-and pentathiophenes as PET-ligands for amyloid protein aggregates, ACS Med Chem Lett 7: , 368–373. |
[7] | Lord A , Kalimo H , Eckman C , Zhang X-Q , Lannfelt L , Nilsson LN ((2006) ) The Arctic Alzheimer mutation facilitates early intraneuronal Aβ aggregation and senile plaque formation in transgenic mice, Neurobiol Aging 27: , 67–77. |
[8] | Johansson LB , Simon R , Bergström G , Eriksson M , Prokop S , Mandenius C-F , Heppner FL , Åslund AK , Nilsson KPR ((2015) ) An azide functionalized oligothiophene ligand–a versatile tool for multimodal detection of disease associated protein aggregates, Biosens Bioelectron 63: , 204–211. |
[9] | Sasaguri H , Nilsson P , Hashimoto S , Nagata K , Saito T , De Strooper B , Hardy J , Vassar R , Winblad B , Saido TC ((2017) ) APP mouse models for Alzheimer’s disease preclinical studies, EMBO J 36: , 2473–2487. |
[10] | Jenkinson M , Bannister P , Brady M , Smith S ((2002) ) Improved optimization for the robust and accurate linear registration and motion correction of brain images, Neuroimage 17: , 825–841. |
[11] | Smith SM , Jenkinson M , Woolrich MW , Beckmann CF , Behrens TE , Johansen-Berg H , Bannister PR , De Luca M , Drobnjak I , Flitney DE ((2004) ) Advances in functional and structural MR image analysis and implementation as FSL, Neuroimage 23: , S208–S219. |
[12] | Ullmann JF , Watson C , Janke AL , Kurniawan ND , Reutens DC ((2013) ) A segmentation protocol and MRI atlas of the C57BL/6J mouse neocortex, Neuroimage 78: , 196–203. |
[13] | Cheng Z , Zhang J , Liu H , Li Y , Zhao Y , Yang E ((2010) ) Central nervous system penetration for small molecule therapeutic agents does not increase in multiple sclerosis- and Alzheimer’s disease-related animal models despite reported blood-brain barrier disruption, Drug Metab Dispos 38: , 1355–1361. |
[14] | Gustafsson S , Lindström V , Ingelsson M , Hammarlund-Udenaes M , Syvänen S ((2018) ) Intact blood-brain barrier transport of small molecular drugs in animal models of amyloid beta and alpha-synuclein pathology, Neuropharmacology 128: , 482–491. |
[15] | Philipson O , Hammarstrom P , Nilsson KP , Portelius E , Olofsson T , Ingelsson M , Hyman BT , Blennow K , Lannfelt L , Kalimo H , Nilsson LN ((2009) ) A highly insoluble state of Abeta similar to that of Alzheimer’s disease brain is found in Arctic APP transgenic mice, Neurobiol Aging 30: , 1393–1405. |
[16] | Lord A , Philipson O , Klingstedt T , Westermark G , Hammarstrom P , Nilsson KP , Nilsson LN ((2011) ) Observations in APP bitransgenic mice suggest that diffuse and compact plaques form via independent processes in Alzheimer’s disease, Am J Pathol 178: , 2286–2298. |
[17] | Wegenast-Braun BM , Skodras A , Bayraktar G , Mahler J , Fritschi SK , Klingstedt T , Mason JJ , Hammarström P , Nilsson KP , Liebig C , Jucker M ((2012) ) Spectral discrimination of cerebral amyloid lesions after peripheral application of luminescent conjugated oligothiophenes, Am J Pathol 181: , 1953–1960. |
[18] | Lantz L , Shirani H , Klingstedt T , Nilsson KPR ((2020) ) Synthesis and characterization of thiophene-based donor–acceptor–donor heptameric ligands for spectral assignment of polymorphic amyloid-β deposits, Chemistry 26: , 7425–7432. |
[19] | Herrmann US , Schütz AK , Shirani H , Huang D , Saban D , Nuvolone M , Li B , Ballmer B , Åslund AK , Mason JJ ((2015) ) Structure-based drug design identifies polythiophenes as antiprion compounds, Sci Transl Med 7: , 299ra123–299ra123. |
[20] | Schütz AK , Hornemann S , Wälti MA , Greuter L , Tiberi C , Cadalbert R , Gantner M , Riek R , Hammarström P , Nilsson KPR ((2017) ) Binding of polythiophenes to amyloids: Structural mapping of the pharmacophore, ACS Chem Neurosci 9: , 475–481. |
[21] | Mpambani F , Åslund AK , Lerouge F , Nyström S , Reitan N , Huuse EM , Widerøe M , Chaput F , Monnereau C , Andraud C ((2018) ) Two-photon fluorescence and magnetic resonance specific imaging of Aβ amyloid using hybrid nano-GdF3 contrast media, ACS Appl Bio Mater 1: , 462–472. |
[22] | Arja K , Elgland M , Nilsson KPR ((2018) ) Synthesis and characterization of oligothiophene–porphyrin-based molecules that can be utilized for optical assignment of aggregated amyloid-β morphotypes, Front Chem 6: , 391. |
[23] | Calvo-Rodriguez M , Hou SS , Snyder AC , Dujardin S , Shirani H , Nilsson KPR , Bacskai BJ ((2019) ) In vivo detection of tau fibrils andamyloid beta aggregates with luminescent conjugated oligothiophenesand multiphoton microscopy, Acta Neuropathol Commun 7: , 171. |
[24] | Teipel SJ , Sabri O , Grothe M , Barthel H , Prvulovic D , Buerger K , Bokde AL , Ewers M , Hoffmann W , Hampel H ((2013) ) Perspectives for multimodal neurochemical and imaging biomarkers in Alzheimer’s disease, J Alzheimers Dis 33 Suppl 1: , S329–S347. |
[25] | Uzuegbunam BC , Librizzi D , Hooshyar Yousefi B ((2020) ) PET radiopharmaceuticals for Alzheimer’s disease and Parkinson’s disease diagnosis, the current and future landscape, Molecules 25: , 977. |


