
Rich-Club Connectivity of the Structural Covariance Network Relates to Memory Processes in Mild Cognitive Impairment and Alzheimer’s Disease
Abstract
Background:
Though mediotemporal lobe volume changes are well-known features of Alzheimer’s disease (AD), grey matter volume changes may be distributed throughout the brain. These distributed changes are not independent due to the underlying network structure and can be described in terms of a structural covariance network (SCN).
Objective:
To investigate how the cortical brain organization is altered in AD we studied the mutual connectivity of hubs in the SCN, i.e., the rich-club.
Methods:
To construct the SCNs, cortical thickness was obtained from structural MRI for 97 participants (normal cognition, n = 37; mild cognitive impairment, n = 41; Alzheimer-type dementia, n = 19). Subsequently, rich-club coefficients were calculated from the SCN, and related to memory performance and hippocampal volume using linear regression.
Results:
Lower rich-club connectivity was related to lower memory performance as well as lower hippocampal volume.
Conclusion:
Therefore, this study provides novel evidence of reduced connectivity in hub areas in relation to AD-related cognitive impairments and atrophy.
INTRODUCTION
Alzheimer’s disease (AD) is the most common cause of dementia. The neuropathological hallmarks of AD are the accumulation of amyloid-β plaques, the formation of tau tangles, and neurodegeneration. Moreover, volume changes of the hippocampus and the accompanying memory decline are well-known features of AD. Changes in cortical volume and thickness may also occur outside the mediotemporal lobe. These distributed alterations are not independent but may express as coherent changes due to the underlying network structure. Specific patterns of cortical thinning are a common finding in AD [1–4], which is suggested to be indicative of disease progression [5, 6]. Therefore, investigating cortical organization could provide additional insights into the disease progression of AD.
Previously, measures of brain morphology (e.g., the cortical thickness) have been shown to correlate across various brain regions [7]. These correlations are thought to be associated with functional and axonal connectivity, underlying the so-called structural covariance network (SCN). Previously, the SCN has already been shown to be less efficiently organized in AD as compared to healthy controls [8–10]. These studies were based on group-level SCNs, constructed by estimating the connection strength between brain regions from correlations of morphological measurements across a group of subjects. As a result, individual network characteristics were lacking, hampering further statistical analyses that can relate the SCNs to individual (e.g., demographic and clinical) factors and provide a better pathophysiology understanding. To overcome this limitation, several individual SCN methods have been introduced to estimate subject specific structural covariance connectivity. For example, Saggar et al. proposed a distance-based approach, where the contribution of a subject is estimated with respect to a reference group [11]. Furthermore, Tijms et al. [12] proposed an alternative method using a cube-based approach, where small 3D cubes represent nodes and connections are estimated by similarities in gray matter morphology. This individual SCN method extends upon previous work by showing that less efficiently organized SCNs relate to worse cognitive performance [13–16] and faster atrophy rates [17]. Furthermore, alterations in SCNs were shown to be related to amyloid [18] and tau [19] pathology, further showing their potential in AD-related research.
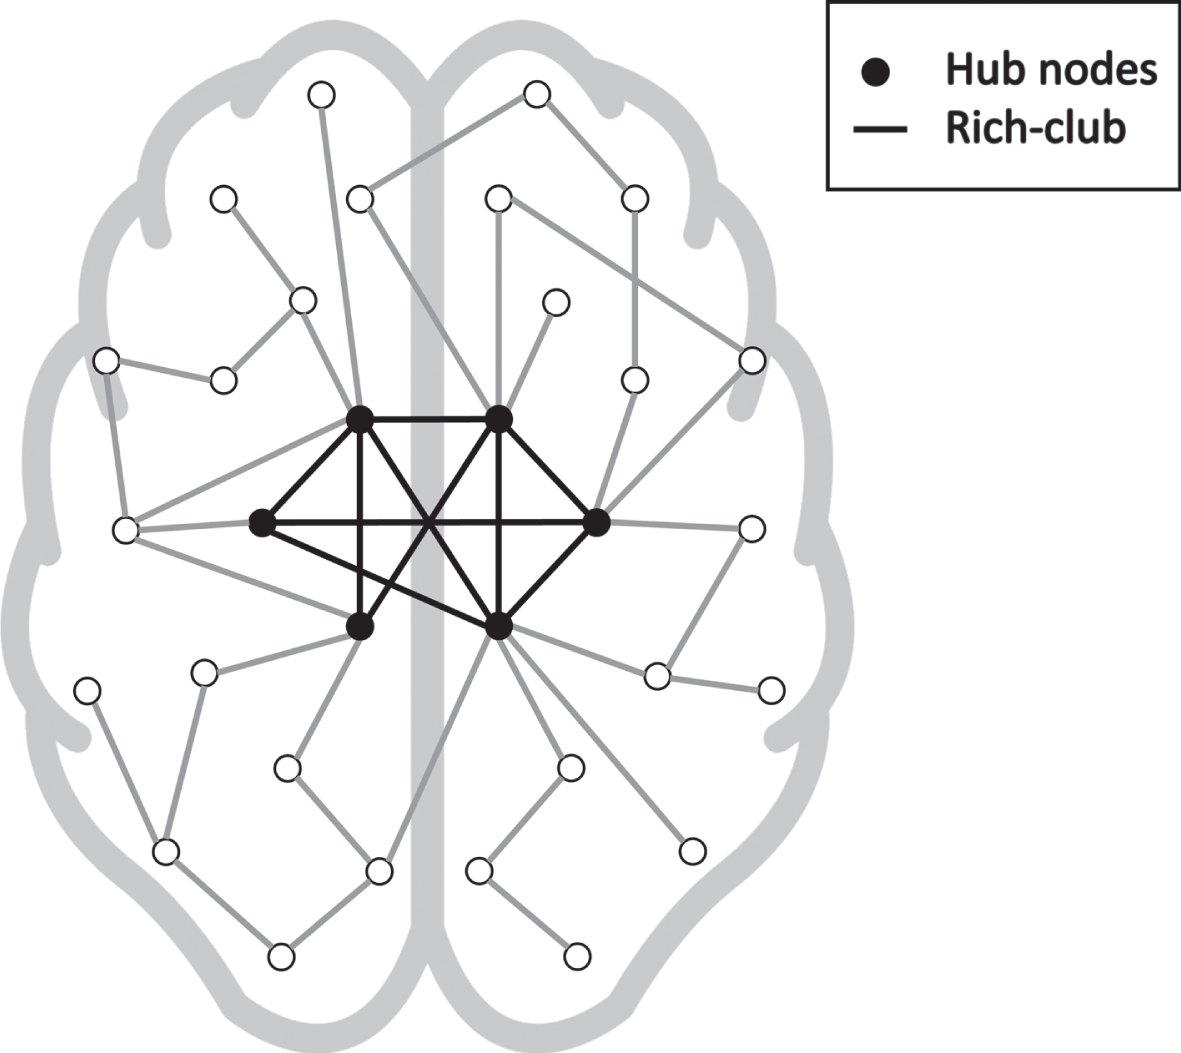
Functional and structural networks in the brain have extensively been shown to be organized as so-called small-world networks, which allow efficient information spreading with a low wiring cost. One of the main features separating random networks from such efficiently organized small-world networks is the presence of hub nodes. Hubs are nodes in a network that have a relative high number of connections to other nodes. Furthermore, in the brain network, these hubs tend to be interconnected, forming a so-called rich-club [20]. A graphical representation of the rich-club is shown in Fig. 1. The rich-club subnetwork has strong implications on the overall performance of a network. For example, the extent of rich-club configuration in the anatomical network has been associated to cognitive performance in healthy participants using diffusion tensor imaging [21], and more recently impaired functional connectivity of the rich-club was found in AD using functional MRI [22]. Moreover, white and gray matter lesions in patients with AD were found to be located more frequently in hub-regions compared to peripheral regions [23], emphasizing the potential involvement of hub nodes and rich-club configuration in AD. Hence, impaired connectivity of the rich-club subnetwork could have a strong implication on the progression of AD-related cognitive impairments and atrophy. Although currently, the influence that the rich-club might have on AD is underdetermined. Therefore, the current study aims to investigate whether a disrupted rich-club of the distance-based SCN is associated with memory performance and hippocampal volume in a memory clinic population.
Fig. 1
Graphical representation of a network with a rich-club configuration. The high nodes with high nodal degree (black in the graph) have a high number of connections between each other (indicated by the black edges).
METHODS
Participants
Ninety-seven participants with a varying range of cognitive performance were included in this study, including 41 individuals with mild cognitive impairment (MCI) (19 females, mean age 70 y), 19 with clinical AD (6 females, mean age 71 y), and 37 cognitively normal (CN) controls (14 females, mean age 72 y). MCI was diagnosed based on the following criteria: 1) concerns about cognitive functioning were reported by the patient or an informant, 2) cognitive impairment was detected on at least one cognitive domain, and 3) dementia was absent [24]. AD diagnosis was made when individuals met the NIA-AA core clinical criteria for AD [25]. MCI and AD patients were recruited from the Maastricht University Medical Center and Zuyderland Medical Center in Heerlen, while CN controls were recruited through local newspaper and online advertisements. In addition, the CN group consisted of individuals who visited the memory clinic and had received a diagnosis of subjective cognitive decline [26]. These individuals reported self-experienced cognitive decline in comparison with a previously normal status and unrelated to an acute event, but no objective cognitive impairment was detected on any of the neuropsychological tests [26]. For all participants, education level (8-level scale; [27]) was recorded. Furthermore, all participants underwent neuropsychological assessment, among which the Mini-Mental State Examination (MMSE) and the 15-word verbal learning task, the latter for the assessment of memory performance. Raw scores were converted to age-, sex-, and education-corrected z-scores (based on normative data) [28], and (objective) cognitive impairment was defined as z-score < –1.5. A summary of the group characteristics is provided in Table 1. A more detailed characterization of the sample, along with inclusion and exclusion criteria, is described in a prior study [29]. All participants gave written informed consent, and the study was carried out in accordance with the latest update of the Declaration of Helsinki and approved by the local medical ethics committee.
Table 1
Subject characteristics of cognitively normal (CN), mild-cognitive impaired (MCI), Alzheimer’s disease (AD), and reference (Ref) participants. Variables are summarized as mean±standard deviation or median [25th percentile; 75th percentile]. MMSE, Mini-Mental State Examination; VLT, total recall score of the 15-word verbal learning task; VLT-dr, delayed recall score of the 15-word verbal learning task. Note that the p-values denote differences between CN, MCI, and AD groups
| CN | MCI | AD | p | Ref | ||
| # | 37 | 41 | 19 | – | 55 | |
| Age (y) | 71±7 | 70±6 | 72±7 | 0.12 | 66±10 | |
| Sex (Male/Female) | 23/14 | 22/19 | 13/6 | 0.82 | 30/25 | |
| Education (level) | 4 [3 6] | 4 [2 6] | 6 [3 6] | 0.11 | – | |
| Cognitive performance (raw scores) | ||||||
| MMSE | 29.0 [28.7 30.0] | 27.0 [26.0 29.0] | 26.0 [21.0 27.3] | <0.01 | 29.0 [28.0 30.0] | |
| VLT | 45.6±9.2 | 33.7±11.0 | 27.7±8.3 | <0.01 | – | |
| VLT-dr | 9.2±2.9 | 5.0±3.8 | 2.9±1.9 | <0.01 | – | |
| Cognitive performance (z-scores) | ||||||
| VLT | 0.65±1.1 | –0.93±1.3 | –1.6±1.3 | <0.01 | – | |
| VLT-dr | 0.43±1.1 | –1.3±1.4 | –2.1±0.96 | <0.01 | – |
An additional reference group consisting of fifty-five healthy older controls (25 females, mean age66 y) [30] was included to perform the distance-based SCN analysis. These participants had no substantial global cognition impairment (MMSE > 25), and no major brain abnormalities.
MRI acquisition
All participants were scanned on a 3.0 Tesla unit (Philips, Achieva TX, Best, the Netherlands) using a 32-channel head coil. For all participants, T1-weighted 3D fast gradient-echo images were acquired with the following parameters: repetition time (TR) 8 ms, echo time (TE) 4 ms, inversion time (TI) 800 ms, flip angle 8°, and 1 mm cubic voxel size.
Structural covariance network
From the acquired T1-weighted images, the cortical thickness was determined using automated software (Freesurfer, version 5.1 [31]), combined with visual inspections and manual corrections. The brain was parcellated into 68 cortical regions using the Desikan-Killiany atlas [32] and the mean cortical thickness was calculated for each region. Additionally, the hippocampal volume, also determined using Freesurfer, was used as a measure of AD-related atrophy. Cortical thickness is known to decrease with age [33], to differ between sexes [34], and to scale with brain size. For each brain region, the cortical thickness values were therefore adjusted for age, sex, and total intercranial volume via multivariable linear regression models [35]. Subsequent SCN analyses are thus not biased by potential group differences in age, sex, and intercranial volume. An adjacency matrix, which represents the SCN, was calculated by the Pearson’s correlation coefficient between the corrected cortical thicknesses of each region pair.
To extract individual SCNs, the add-one-participant method was used [11, 36], in which the individual contribution of a participant was assessed by adding that participant to the reference group before calculating the adjacency matrix. Only significantly positive correlations (r > 0 and p < 0.05) were considered, since the involvement of negative correlations in the network is still unclear [37]. Furthermore, to avoid that statistical analysis would be driven by the total number of connections (edges) in the networks, the networks were thresholded such that each network has the same amount of connections. The individual SCN analysis was performed using in-house MATLAB code, made publicly accessible on GitHub https://github.com/GSDrenthen/SCN.
Rich-club analysis
To identify the hub nodes in the network, the nodal degree for each node in the network was first averaged over all subjects, obtaining an average degree per node. Hub nodes were defined as those nodes with a degree higher than the average degree plus one standard deviation [38]. The interconnectedness of hub nodes was determined using the weighted rich-club coefficient (RCC);
(1)
where Ehubs is the total connectivity strength between hubs and Nhubs is the number of hubs [20]. As such, the RCC provides a measure of the between-hub connectivity strength over the total number of possible connections between hubs, where a higher RCC indicates more interconnectedness between hubs. Subsequently, the RCC was normalized with respect to the mean RCC of 1000 random networks. To assess the stability of the rich-club analysis with respect to the hubs, the analysis was repeated where the amount of hub nodes was varied from 4 up to 64 with steps of 4.
Additionally, the connectivity strength of the so-called feeder connections (i.e., connections between hubs and other nodes) and local connections (i.e., connections between the nodes that are not hubs) were also assessed.
Statistical analysis
Potential group differences in age, and cognitive performance were assessed by one-way ANOVA test, while differences in the categorical variables sex and education were assessed using a chi-squared test. A one-way ANOVA test was performed to assess potential group differences in the RCC. Subsequently, the relation between RCC and memory performance was assessed using multivariable linear regression with the RCC as the dependent variable, and the raw VLT-dr scores as independent variable, correcting for age, sex, education level, and diagnostic group using two dummy variables representing MCI and AD. Similarly, the relation between RCC and hippocampal volume was assessed using multivariable linear regression, correcting for age, sex, total intracranial volume, and diagnostic group using two dummy variables representing MCI and AD. Furthermore, the potential relation of local and feeder connection strength with hippocampal volume and memory performance was assessed using similar regression models.
The statistical analyses were all performed using MATLAB (version R2019b) software. Statistical significance was inferred at p < 0.05.
RESULTS
The average nodal degree of all participants for the 68 nodes is 42 with a standard deviation of 12, resulting in 8 hub nodes. The average degree of all nodes is shown in Fig. 2, where the hub nodes are depicted in bold. In Fig. 3, the locations of the hub nodes are depicted on inflated cortical surfaces. Means and standard deviations of the RCC for each diagnostic group were 1.31±0.03 for CN, 1.29±0.05 for MCI, and 1.29±0.03 for AD. RCC did not differ significantly between the diagnostics groups (p = 0.39).
Fig. 2
Average nodal degree of all 68 nodes, where the 8 hub nodes are shown in bold.
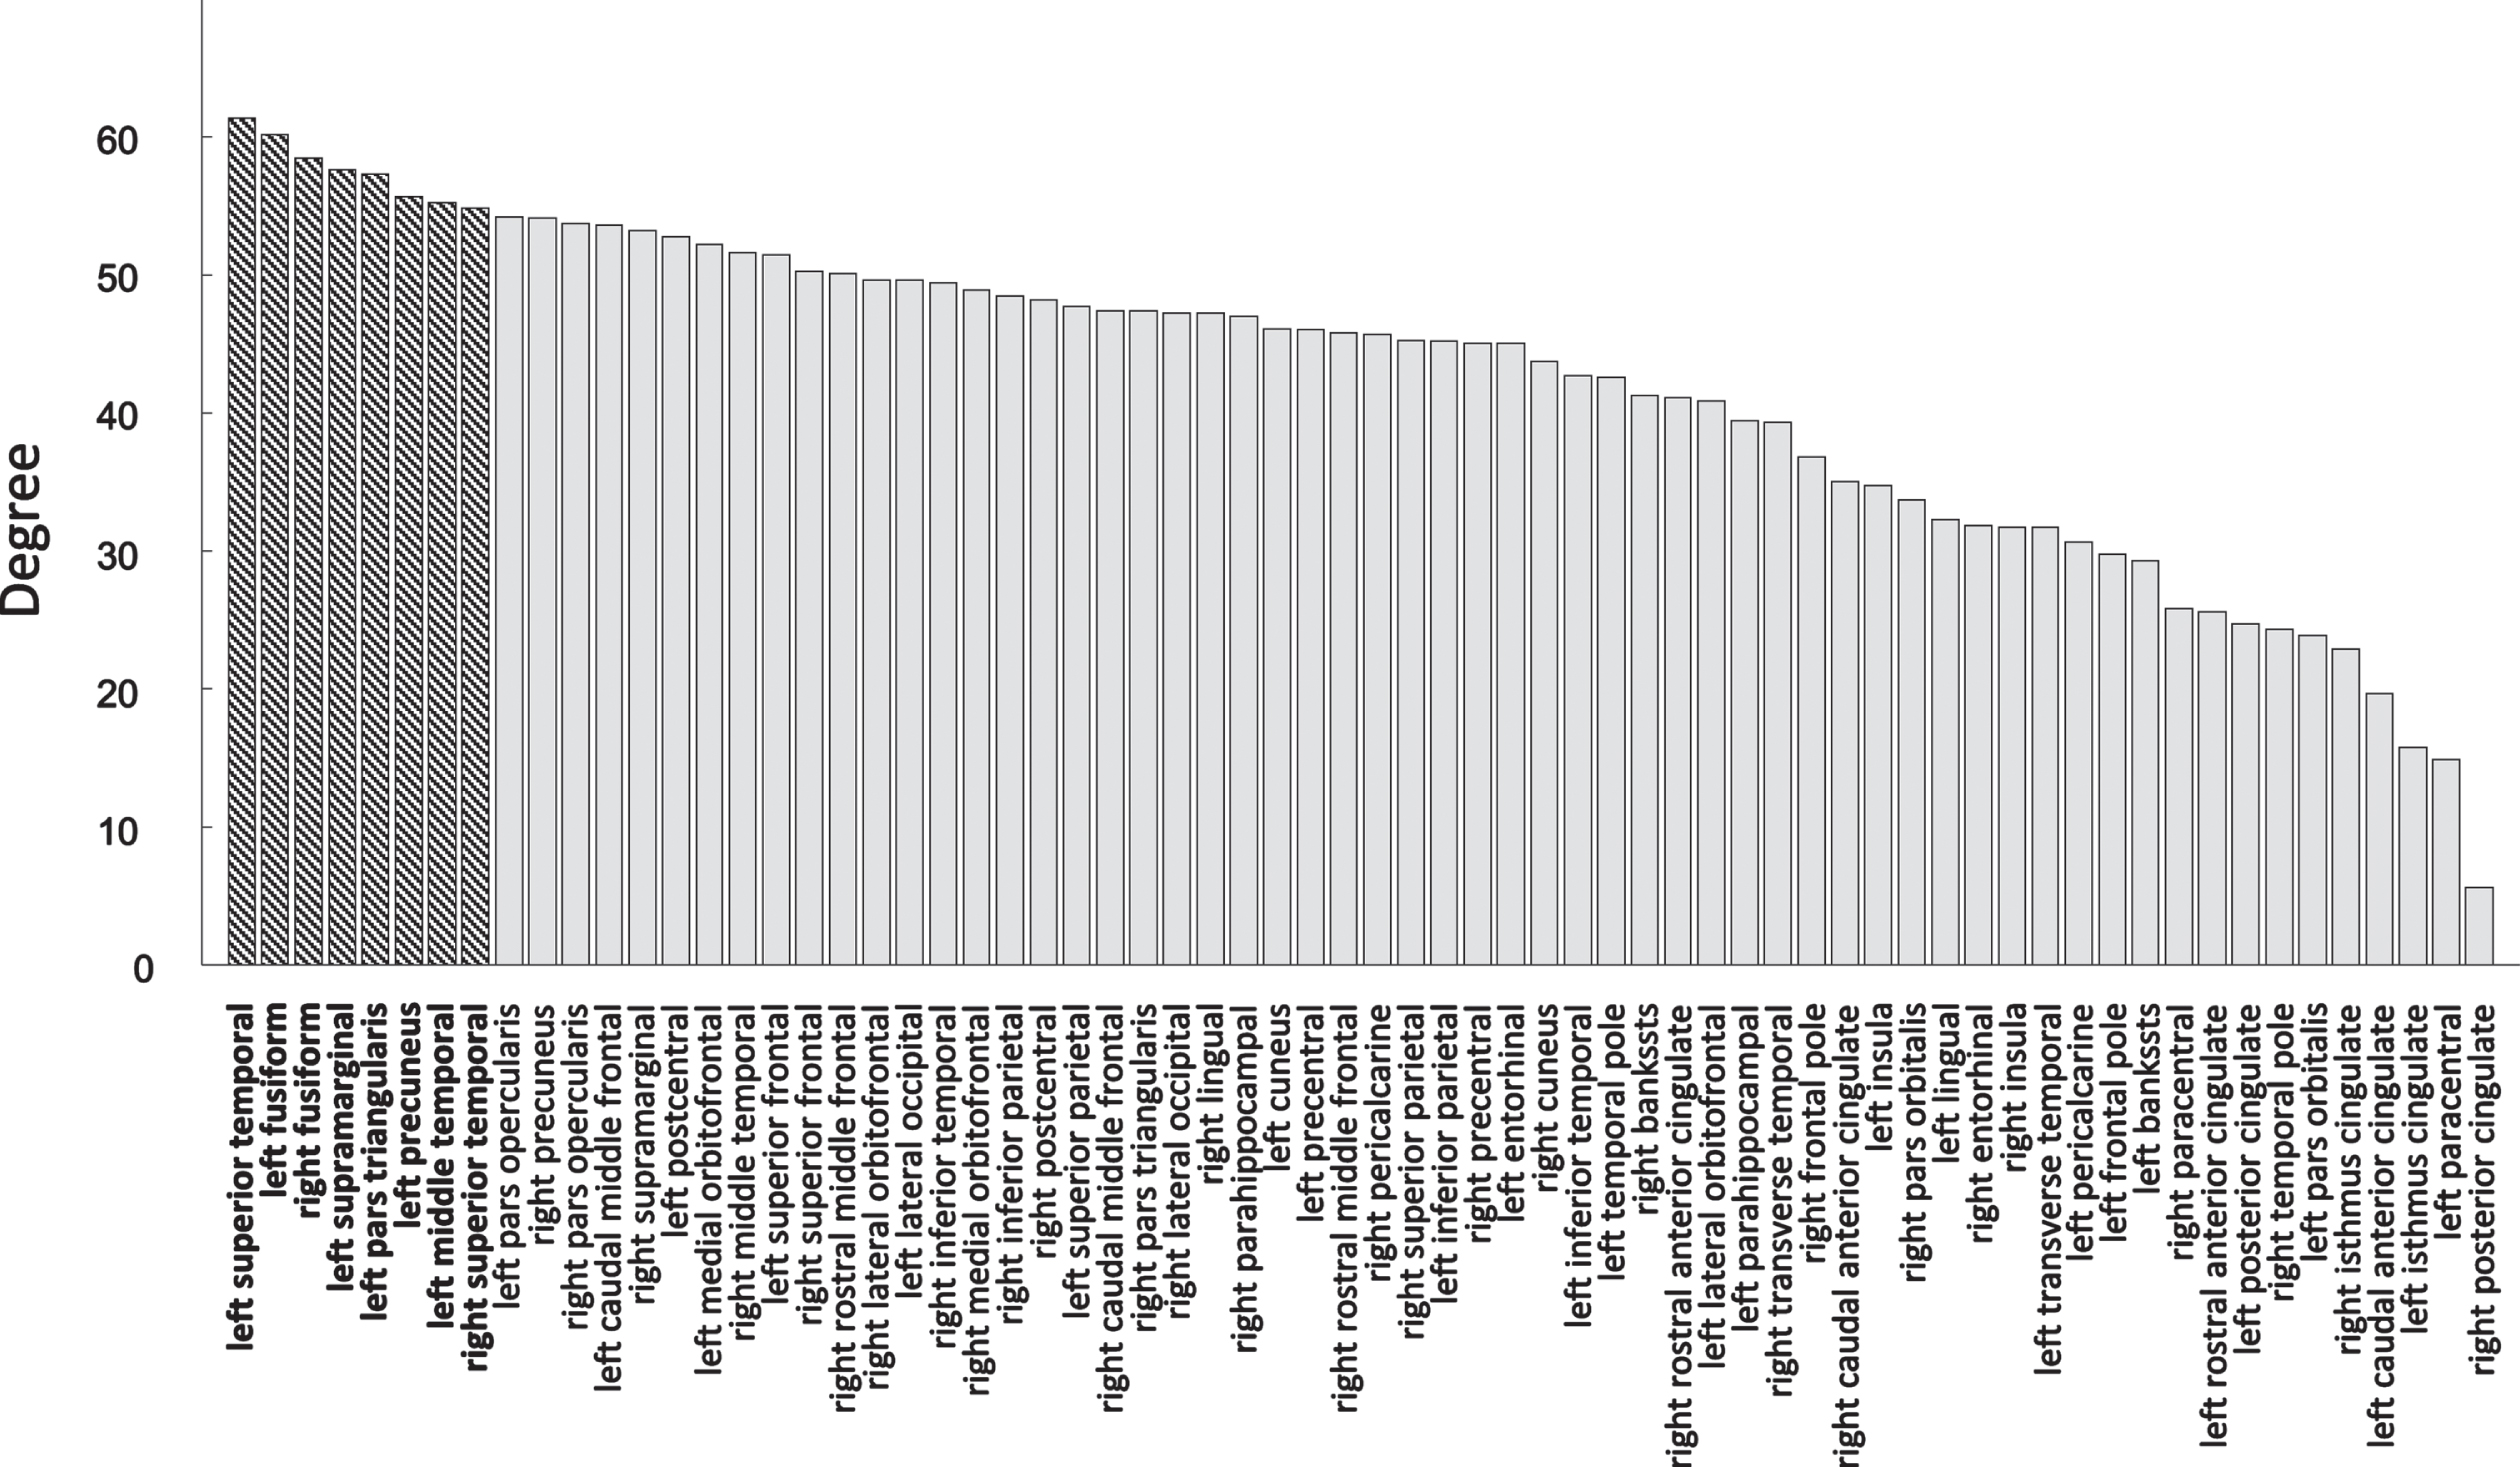
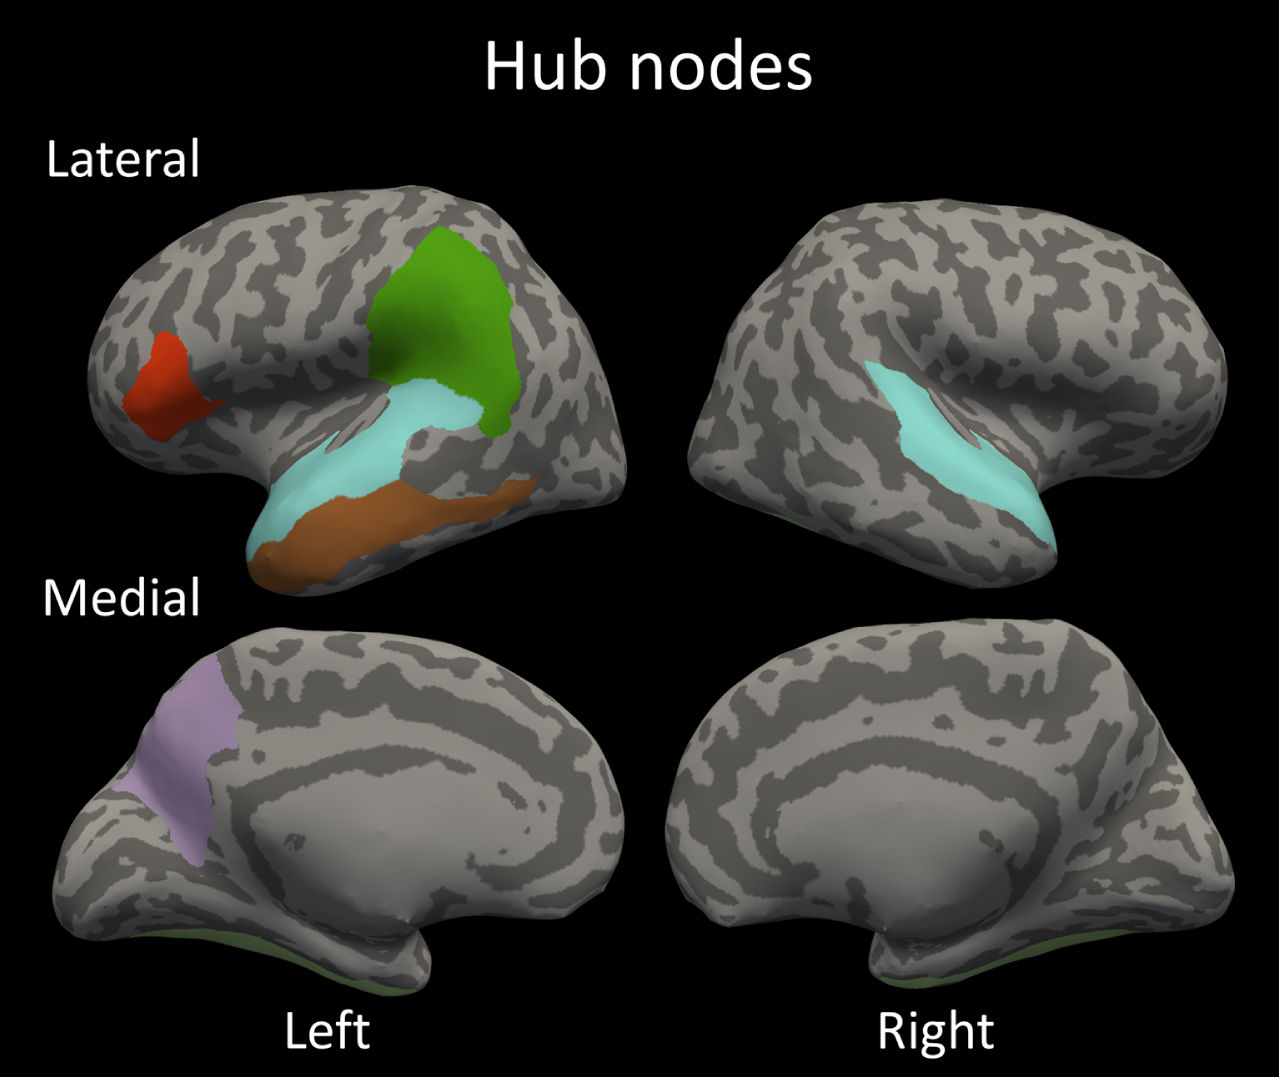
Fig. 3
The identified hub nodes in the structural covariance network; bilateral fusiform gyrus; bilateral superior temporal gyrus; left supramarginal gyrus; left opercular part of inferior frontal gyrus; left precuneus and left middle temporal gyrus.
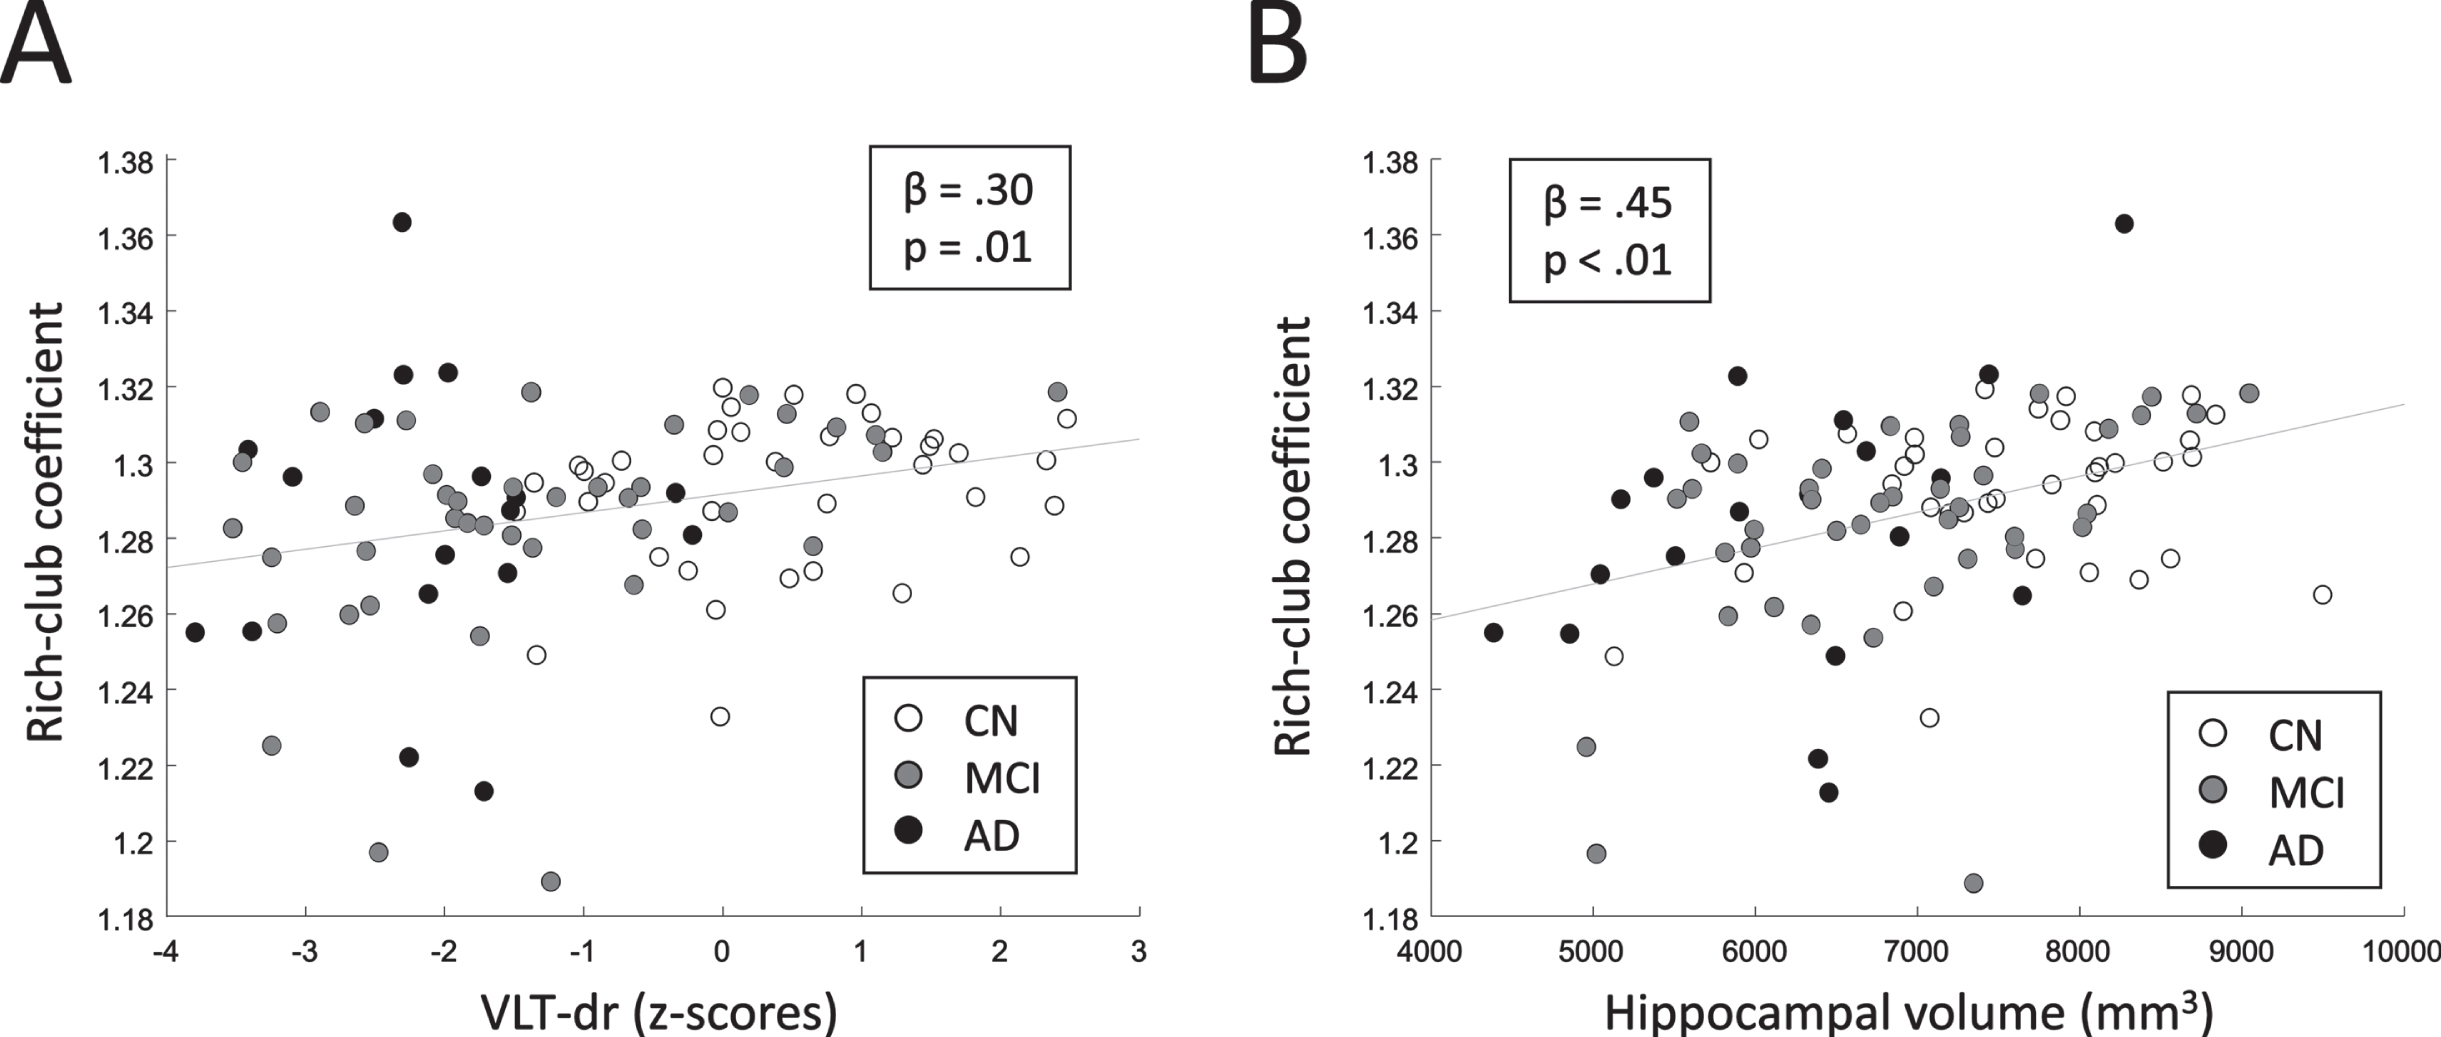
The multivariable linear regression model relating RCC to the VLT-dr raw-scores revealed a significant positive relationship (p = 0.03). Moreover, a significant positive relation was found between RCC and hippocampal volume (p < 0.01). These results indicate that networks with a larger extent of rich-club configuration relate to a better memory performance and a larger hippocampal volume. The relation of RCC and VLT-dr as well as RCC and hippocampal volume are shown in Fig. 4. Note that for visualization purposes, the age-, sex-, education corrected z-scores of the VLT-dr, instead of the raw scores, are shown in Fig. 4A. The feeder and local connection strengths did not relate to either the memory performance or the hippocampal volume.
Fig. 4
A) Relation between RCC and memory performance (VLT-dr). B) Relation between RCC and hippocampal volume. Standardized regression coefficients (β) and corresponding p-values are shown. Linear least-squares lines are fitted through the data points for visualization.
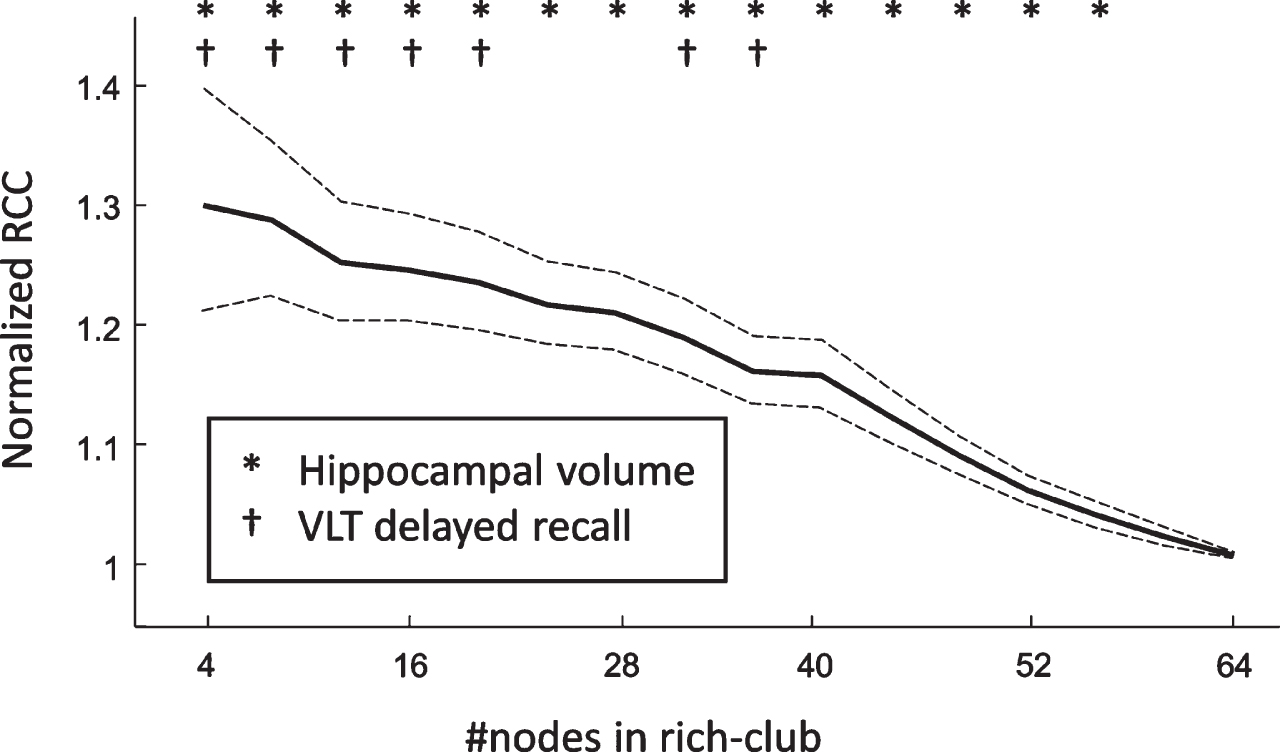
To assess the stability of the relations between RCC and VLT-dr as well as RCC and hippocampal volume with respect to the number of hubs, we have repeated the analysis for a varying rich-club size. We found that both relations could be found for rich-clubs consisting of up to 20 nodes. Moreover, the relation of RCC and hippocampal volume was reported to be even more robust, as it was still found to be significant with rich-clubs consisting of the 56 highest-degree nodes (Fig. 5).
Fig. 5
The average normalized rich-club coefficient with respect to the number of nodes in the rich-club subnetwork. The dashed lines represent the 95% confidence interval.
DISCUSSION
In this study we set out to characterize the cortical organization in cognitively impaired older individuals in terms of the rich-club subnetwork of the structural covariance network (SCN) and its association with cognitive function. The main finding of this study is that a loss of nodal degree in the rich-club subnetwork of the SCN relates to lower memory performance and a smaller hippocampal volume in a memory clinic sample.
One of the main attributes that separates random networks from efficiently organized networks such as the brain, is the presence of hub nodes. In our study we have identified 8 cortical regions as hubs in the SCN: bilateral fusiform gyrus; bilateral superior temporal gyrus; left supramarginal gyrus; left opercular part of inferior frontal gyrus; left precuneus and left middle temporal gyrus. Interestingly, prior studies employing diffusion tensor imaging have reported overlapping hubs, such as the precuneus [20, 39], the fusiform [39, 40], the inferior and superior temporal, and the supramarginal regions [40]. Thus, even though the SCNs only partly reflect the DTI-derived fiber connections [37], they share the same hub regions indicating the robustness and importance of these hubs regions in the brain network.
The hubs in the brain network tend to form a densely connected rich-club subnetwork, where a higher rich-club configuration relates to a larger number of connections between the hubs in the network. In the current study we have reported that a loss of rich-club configuration, i.e., a loss of connections between the hubs, relates to impaired cognitive performance in the memory domain, as well as loss of hippocampal volume. Previously, a lower nodal degree in the fronto-temporal regions of the SCN was associated with memory loss [14]. Here, we show that the effect of nodal degree and memory performance is more widespread through the brain, and specifically involves the connections between the hub nodes (i.e., the rich-club). The more densely connected hub regions have higher rates of neural processing and information flow, thus requiring increased blood flow and metabolic activity [38, 41, 42]. It has been previously debated that an increase of metabolic activity interacts with the tau pathology in AD [43]. Moreover, hub regions in patients with AD were found to be more prone to lesions compared to peripheral regions [23]. Combined, this demonstrates that the hub regions, and thus the rich-club subnetwork, are especially vulnerable in AD. Our results support this notion, and further indicate that the vulnerability of hubs could provide an underlying mechanism for problems related to memory retrieval in AD.
The rich-club phenomenon has been previously studied in relation to AD using DTI analysis, revealing that connections in the rich-club were affected in early-onset AD [39]. Interestingly, other DTI studies have reported that the extent of rich-club configuration remains largely intact in AD [44, 45]. This, combined with the results from the current study, imply that the SCN has the potential to provide unique knowledge on interregional cortical associations in subjects with cognitive impairments, and provide valuable information complementary to DTI.
Study considerations
A major strength of the SCN analysis is that it only requires structural T1-weighted images, which are generally available in clinical studies, and have a high resolution and image quality. Other neuroimaging techniques, such as DTI, that also relate to structural connectivity require a dedicated scan, increasing the total scan time, and more advanced hardware (i.e., stronger gradient systems). Therefore, the SCN approach provides an achievable way to model brain connectivity. There are multiple ways to construct individual SCNs, and they all share that they rely on the assumption that axonally connected regions have similarities in morphology, however each different method has the potential to provide unique information. For example, whereas the cube-based method estimates within-subject connectivity directly, the distance-based method is based on individual variations with respect to a group of subjects. As such, abnormal morphology with respect to a reference group relates to a loss of connection strength in the distance-based SCNs, making the distance-based SCN approach especially sensitive to network disruptions due to disease-related (e.g., AD-related) cortical atrophy. However, the distance-based SCN approach requires a reference group to construct the SCNs, thus generally requiring a larger sample (reference group of approximately 25 subjects is needed [11]) to maintain similar statistical power compared to direct individual SCN approaches. To circumvent this problem, we have proposed to calculate the distance-based SCNs with respect to a reference group from a prior study. Even though the reference group differed slightly in age, since we do not directly compare the reference group with the other groups, our between-group results are not biased by the differences between the reference group and NC, MCI, and AD groups. Furthermore, the effects of age on the cortical thickness are controlled for in the preprocessing steps. A limitation of this study is its cross-sectional design, which does not allow us to derive causal relationships between alterations in the SCN and memory performance and hippocampal volume. Furthermore, it cannot be excluded that drug use has had a bearing on the results of this study. Nonetheless, because the drugs were prescribed based on the individual clinical situation of subjects, the results in this study reflect a sample of memory clinic patients.
Concluding remark
The distance-based SCN is proposed as a quantitative MRI processing method, suitable for use in large population scale studies, that provides information on neurodegeneration and the underlying network of distributed dependent cortical regions in relation to cognitive function. We have shown that a decreased rich-club connectivity in the SCN relates to lower memory performance and hippocampal atrophy, indicating that a loss of degree in the rich-club subnetwork may be related to underlying memory loss in the context of MCI and dementia. This provides novel evidence that interconnectivity of hub regions relates to AD-related cognitive impairments and atrophy. Future, preferably longitudinal, prospective of retrospective studies should investigate whether rich-club connectivity could be a marker for disease progression.
ACKNOWLEDGMENTS
W.M. Freeze reports support from Alzheimer Nederland [grant WE.03-2018-13]. Heidi I.L. Jacobs reports support from Alzheimer Nederland [grant WE.09-2019-02] and the NIH-NIA R01AG06255. I.C.M. Verheggen reports support from the Dutch Research Council (NWO) [grant 406-15-031].
Authors’ disclosures available online (https://www.j-alz.com/manuscript-disclosures/22-0175r2).
REFERENCES
[1] | Drzezga A ((2018) ) The network degeneration hypothesis: Spread of neurodegenerative patterns along neuronal brain networks. J Nucl Med 59: , 1645–1648. |
[2] | Seeley WW , Crawford RK , Zhou J , Miller BL , Greicius MD ((2009) ) Neurodegenerative diseases target large-scale human brain networks. Neuron 62: , 42–52. |
[3] | Iaccarino L , Tammewar G , Ayakta N , Baker SL , Bejanin A , Boxer AL , Gorno-Tempini ML , Janabi M , Kramer JH , Lazaris A , Lockhart SN , Miller BL , Miller ZA , O’Neil JP , Ossenkoppele R , Rosen HJ , Schonhaut DR , Jagust WJ , Rabinovici GD ((2018) ) Local and distant relationships between amyloid, tau and neurodegeneration in Alzheimer’s disease. Neuroimage Clin 17: , 452–464. |
[4] | Sepulcre J , Schultz AP , Sabuncu M , Gomez-Isla T , Chhatwal J , Becker A , Sperling R , Johnson KA ((2016) ) In vivo tau, amyloid, and gray matter profiles in the aging brain. J Neurosci 36: , 7364–7374. |
[5] | Singh V , Chertkow H , Lerch JP , Evans AC , Dorr AE , Kabani NJ ((2006) ) Spatial patterns of cortical thinning in mild cognitive impairment and Alzheimer’s disease. Brain 129: , 2885–2893. |
[6] | Márquez F , Yassa MA ((2019) ) Neuroimaging biomarkers for Alzheimer’s disease. Mol Neurodegener 14: , 21. |
[7] | Evans AC ((2013) ) Networks of anatomical covariance. Neuroimage 80: , 489–504. |
[8] | He Y , Chen Z , Evans A ((2008) ) Structural insights into aberrant topological patterns of large-scale cortical networks in Alzheimer’s disease. J Neurosci 28: , 4756–4766. |
[9] | Li Y , Wang Y , Wu G , Shi F , Zhou L , Lin W , Shen D ((2012) ) Discriminant analysis of longitudinal cortical thickness changes in Alzheimer’s disease using dynamic and network features. Neurobiol Aging 33: , 427.e15–427.e30. |
[10] | Yao Z , Zhang Y , Lin L , Zhou Y , Xu C , Jiang T ((2010) ) Abnormal cortical networks in mild cognitive impairment and Alzheimer’s disease. PLoS Comput Biol 6: , e1001006. |
[11] | Saggar M , Hosseini SMH , Bruno JL , Quintin E-M , Raman MM , Kesler SR , Reiss AL ((2015) ) Estimating individual contribution from group-based structural correlation networks. Neuroimage 120: , 274–284. |
[12] | Tijms BM , Series P , Willshaw DJ , Lawrie SM ((2012) ) Similarity-based extraction of individual networks from gray matter MRI scans. Cereb Cortex 22: , 1530–1541. |
[13] | Tijms BM , Möller C , Vrenken H , Wink AM , de Haan W , van der Flier WM , Stam CJ , Scheltens P , Barkhof F ((2013) ) Single-subject grey matter graphs in Alzheimer’s disease. PLoS One 8: , e58921. |
[14] | Dicks E , Tijms BM , ten Kate M , Gouw AA , Benedictus MR , Teunissen CE , Barkhof F , Scheltens P , van der Flier WM ((2018) ) Gray matter network measures are associated with cognitive decline in mild cognitive impairment. Neurobiol Aging 61: , 198–206. |
[15] | Dicks E , Vermunt L , van der Flier WM , Barkhof F , Scheltens P , Tijms BM ((2020) ) Grey matter network trajectories across the Alzheimer’s disease continuum and relation to cognition. Brain Commun 2: , fcaa177. |
[16] | Verfaillie SCJ , Slot RER , Dicks E , Prins ND , Overbeek JM , Teunissen CE , Scheltens P , Barkhof F , van der Flier WM , Tijms BM ((2018) ) A more randomly organized grey matter network is associated with deteriorating language and global cognition in individuals with subjective cognitive decline. Hum Brain Mapp 39: , 3143–3151. |
[17] | Dicks E , van der Flier WM , Scheltens P , Barkhof F , Tijms BM ((2020) ) Single-subject gray matter networks predict future cortical atrophy in preclinical Alzheimer’s disease. Neurobiol Aging 94: , 71–80. |
[18] | Ten Kate M , Visser PJ , Bakardjian H , Barkhof F , Sikkes SAM , van der Flier WM , Scheltens P , Hampel H , Habert MO , Dubois B , Tijms BM ((2018) ) Gray matter network disruptions and regional amyloid beta in cognitively normal adults. Front Aging Neurosci 10: , 67. |
[19] | Sheng X , Chen H , Shao P , Qin R , Zhao H , Xu Y , Bai F ((2021) ) Brain structural network compensation is associated with cognitive impairment and Alzheimer’s disease pathology. Front Neurosci 15: , 630278. |
[20] | van den Heuvel MP , Sporns O ((2011) ) Rich-club organization of the human connectome. J Neurosci 31: , 15775–15786. |
[21] | Baggio HC , Segura B , Sala-Llonch R , Marti M-J , Valldeoriola F , Compta Y , Tolosa E , Junqué C ((2015) ) Cognitive impairment and resting-state network connectivity in Parkinson’s disease. Hum Brain Mapp 36: , 199–212. |
[22] | Dai Z , Lin Q , Li T , Wang X , Yuan H , Yu X , He Y , Wang H ((2019) ) Disrupted structural and functional brain networks in Alzheimer’s disease. Neurobiol Aging 75: , 71–82. |
[23] | Crossley NA , Mechelli A , Scott J , Carletti F , Fox PT , Mcguire P , Bullmore ET ((2014) ) The hubs of the human connectome are generally implicated in the anatomy of brain disorders. Brain 137: , 2382–2395. |
[24] | Petersen RC ((2004) ) Mild cognitive impairment as a diagnostic entity. J Intern Med 256: , 183–194. |
[25] | McKhann GM , Knopman DS , Chertkow H , Hyman BT , Jack CR , Kawas CH , Klunk WE , Koroshetz WJ , Manly JJ , Mayeux R , Mohs RC , Morris JC , Rossor MN , Scheltens P , Carrillo MC , Thies B , Weintraub S , Phelps CH ((2011) ) The diagnosis of dementia due to Alzheimer’s disease: Recommendations from the National Institute on Aging-Alzheimer’s Association workgroups on diagnostic guidelines for Alzheimer’s disease. Alzheimers Dement 7: , 263–269. |
[26] | Jessen F , Amariglio RE , Van Boxtel M , Breteler M , Ceccaldi M , Chételat G , Dubois B , Dufouil C , Ellis KA , Van Der Flier WM , Glodzik L , Van Harten AC , De Leon MJ , McHugh P , Mielke MM , Molinuevo JL , Mosconi L , Osorio RS , Perrotin A , Petersen RC , Rabin LA , Rami L , Reisberg B , Rentz DM , Sachdev PS , De La Sayette V , Saykin AJ , Scheltens P , Shulman MB , Slavin MJ , Sperling RA , Stewart R , Uspenskaya O , Vellas B , Visser PJ , Wagner M ((2014) ) A conceptual framework for research on subjective cognitive decline in preclinical Alzheimer’s disease. Alzheimers Dement 10: , 844–852. |
[27] | De Bie S ((1987) ) Voorstellen voor uniformering van vraagstellingen naar achtergrondkenmerken en interviews [Standard questions 1987: Proposal for uniformization of questions regarding background variables and interviews]. Leiden University Press, Leiden. |
[28] | Van der Elst W , van Boxtel MP , va. Breukelen GJ , Jolles J ((2005) ) Rey’s verbal learning test: Normative data for 1855 healthy participants aged 24-81 years and the influence of age, sex, education, and mode of presentation. J Int Neuropsychol Soc 11: , 290–302. |
[29] | Freeze WM , Jacobs HIL , de Jong JJ , Verheggen ICM , Gronenschild EHBM , Palm WM , Hoff EI , Wardlaw JM , Jansen JFA , Verhey FR , Backes WH ((2020) ) White matter hyperintensities mediate the association between blood-brain barrier leakage and information processing speed. Neurobiol Aging 85: , 113–122. |
[30] | Verheggen ICM , de Jong JJA , van Boxtel MPJ , Gronenschild EHBM , Palm WM , Postma AA , Jansen JFA , Verhey FRJ , Backes WH ((2020) ) Increase in blood–brain barrier leakage in healthy, older adults. Geroscience 42: , 1183–1193. |
[31] | Fischl B , Dale AM ((2000) ) Measuring the thickness of the human cerebral cortex from magnetic resonance images. Proc Natl Acad Sci U S A 97: , 11050–11055. |
[32] | Desikan RS , Ségonne F , Fischl B , Quinn BT , Dickerson BC , Blacker D , Buckner RL , Dale AM , Maguire RP , Hyman BT , Albert MS , Killiany RJ ((2006) ) An automated labeling system for subdividing the human cerebral cortex on MRI scans into gyral based regions of interest. Neuroimage 31: , 968–980. |
[33] | Magnotta VA , Andreasen NC , Schultz SK , Harris G , Cizadlo T , Heckel D , Nopoulos P , Flaum M ((1999) ) Quantitative in vivo measurement of gyrification in the human brain, Changes associated with aging.Cereb Cortex 9: , 151–160. |
[34] | Sowell ER , Peterson BS , Kan E , Woods RP , Yoshii J , Bansal R , Xu D , Zhu H , Thompson PM , Toga AW ((2007) ) Sex differences in cortical thickness mapped in 176 healthy individuals between 7 and 87 years of age. Cereb Cortex 17: , 1550–1560. |
[35] | Sanabria-Diaz G , Melie-García L , Iturria-Medina Y , Alemán-Gómez Y , Hernández-González G , Valdés-Urrutia L , Galán L , Valdés-Sosa P ((2010) ) Surface area and cortical thickness descriptors reveal different attributes of the structural human brain networks. Neuroimage 50: , 1497–1510. |
[36] | Drenthen GS , Backes WH , Rouhl RPW , Vlooswijk MCG , Majoie MHJM , Hofman PAM , Aldenkamp AP , Jansen JFA ((2018) ) Structural covariance networks relate to the severity of epilepsy with focal-onset seizures. Neuroimage Clin 20: , 861–867. |
[37] | Gong G , He Y , Chen ZJ , Evans AC ((2012) ) Convergence and divergence of thickness correlations with diffusion connections across the human cerebral cortex. Neuroimage 59: , 1239–1248. |
[38] | van den Heuvel MP , Sporns O ((2013) ) Network hubs in the human brain. Trends Cogn Sci 17: , 683–696. |
[39] | Daianu M , Mezher A , Mendez MF , Jahanshad N , Jimenez EE , Thompson PM ((2016) ) Disrupted rich club network in behavioral variant frontotemporal dementia and early-onset Alzheimer’s disease. Hum Brain Mapp 37: , 868–883. |
[40] | Kocher M , Gleichgerrcht E , Nesland T , Rorden C , Fridriksson J , Spampinato MV , Bonilha L ((2015) ) Individual variability in the anatomical distribution of nodes participating in rich club structural networks. Front Neural Circuits 9: , 16. |
[41] | Vaishnavi SN , Vlassenko AG , Rundle MM , Snyder AZ , Mintun MA , Raichle ME ((2010) ) Regional aerobic glycolysis in the human brain. Proc Natl Acad Sci U S A 107: , 17757–17762. |
[42] | Várkuti B , Cavusoglu M , Kullik A , Schiffler B , Veit R , Yilmaz Ö , Rosenstiel W , Braun C , Uludag K , Birbaumer N , Sitaram R ((2011) ) Quantifying the link between anatomical connectivity, gray matter volume and regional cerebral blood flow: An integrative MRI study. PLoS One 6: , e14801. |
[43] | Small SA , Swanson LW ((2018) ) A network explanation of Alzheimer’s regional vulnerability. Cold Spring Harb Symp Quant Biol 83: , 193–200. |
[44] | Daianu M , Jahanshad N , Nir TM , Jack CR , Weiner MW , Bernstein MA , Thompson PM ((2015) ) Rich club analysis in the Alzheimer’s disease connectome reveals a relatively undisturbed structural core network. Hum Brain Mapp 36: , 3087–3103. |
[45] | Cai S , Huang K , Kang Y , Jiang Y , von Deneen KM , Huang L ((2019) ) Potential biomarkers for distinguishing people with Alzheimer’s disease from cognitively intact elderly based on the rich-club hierarchical structure of white matter networks. Neurosci Res 144: , 56–66. |


