
Episodic Memory, Hippocampal Volume, and Function for Classification of Mild Cognitive Impairment Patients Regarding Amyloid Pathology
Abstract
Background:
Previous studies of hippocampal function and volume related to episodic memory deficits in patients with amnestic mild cognitive impairment (aMCI) have produced mixed results including increased or decreased activity and volume. However, most of them have not included biomarkers, such as amyloid-β (Aβ) deposition which is the hallmark for early identification of the Alzheimer’s disease continuum.
Objective:
We investigated the role of Aβ deposition, functional hippocampal activity and structural volume in aMCI patients and healthy elderly controls (HC) using a new functional MRI (fMRI) ecological episodic memory task.
Methods:
Forty-six older adults were included, among them Aβ PET PIB positive (PIB+) aMCI (N = 17), Aβ PET PIB negative (PIB–) aMCI (N = 15), and HC (N = 14). Hippocampal volume and function were analyzed using Freesurfer v6.0 and FSL for news headlines episodic memory fMRI task, and logistic regression for group classification in conjunction with episodic memory task and traditional neuropsychological tests.
Results:
The aMCI PIB+ and PIB–patients showed significantly worse performance in relation to HC in most traditional neuropsychological tests and within group difference only on story recall and the ecological episodic memory fMRI task delayed recall. The classification model reached a significant accuracy (78%) and the classification pattern characterizing the PIB+ included decreased left hippocampal function and volume, increased right hippocampal function and volume, and worse episodic memory performance differing from PIB–which showed increased left hippocampus volume.
Conclusion:
The main findings showed differential neural correlates, hippocampal volume and function during episodic memory in aMCI patients with the presence of Aβ deposition.
INTRODUCTION
Mild cognitive impairment (MCI) is a clinical syndrome with cognitive decline beyond what is expected for one’s age in the context of reasonably preserved daily living instrumental activities and absence of dementia [1–4]. Previous studies suggested that amnestic predominant MCI (aMCI) patients are more likely to convert to typical Alzheimer’s disease (AD), although subsequent findings have indicated that atypical AD phenotypes including nonamnestic and behavioral symptoms may convert to typical AD [5]. In 2018, the US National Institute on Aging (NIA) and the Alzheimer’s Association (AA) proposed the amyloid-β (Aβ), tau, neurodegeneration (A/T/N) research framework for the biological diagnosis of AD [6]. This research framework is based on the amyloid cascade hypothesis beginning with Aβ lesions and, subsequently, tau pathology, brain neurodegeneration and cognitive changes [6–9]. It has been used in research to identify and follow up unimpaired cognitive and MCI individuals within the AD continuum in the presence of Aβ deposition alone or in combination with tau pathology or neurodegeneration, even though other studies were unable to support this hypothesis [10–20]. A recently published recommendation of the International Working Group in 2021 on the AD diagnosis included its application to people who have positive biomarkers together with specific AD phenotypes, whereas biomarker-positive cognitively unimpaired individuals could be considered at-risk for progression to AD dementia [21].
Advances in biomarkers to identify MCI patients in the AD continuum have contributed to detect the pathological process related to Aβ deposition several years earlier than the AD onset. In particular, Aβ positron emission tomography (Aβ-PET) has been used in a number of studies showing Aβ-PET positivity (Aβ-PET+) in aMCI patients in comparison to age-matched cognitively normal individuals and non-aMCI [22–25]. However, other studies have not confirmed such Aβ-cognition relationship in non-dementia individuals [26–28]. Therefore, further research is needed to understand Aβ-cognition association in the early stages of the AD continuum, particularly in aMCI samples with or without the presence of Aβ deposition.
Previous publications on aMCI showed episodic memory deficits as the central memory impairment in this population [1–3, 29–31], particularly when new information is recalled after a delay period [32–35]. Those episodic memory deficits, usually assessed by wordlists or story recall laboratory tests, have been associated with hippocampal volume loss, although frontotemporal and parietal regions can also be implicated in aMCI affecting memory encoding, consolidation and recall processes [36–40]. However, there is a lack of studies investigating encoding and retrieval processes of episodic memory in aMCI patients with Aβ deposition in comparison to aMCI without Aβ deposition considering hippocampal volume and episodic memory tasks similar to real life difficulties including news events. This is crucial to disentangle the role of the different episodic memory processes inside and outside the AD continuum.
Another approach to investigate episodic memory processes in aMCI patients is by functional MRI (fMRI) and previous studies in MCI individuals have suggested that increased hippocampal activity can be associated with higher rates of cortical atrophy and more rapid cognitive decline suggesting possible neuronal compensation or evidence of excitotoxicity [41–44]. However, other studies have found decreased hippocampal activity in MCI patients using task-related fMRI as observed in patients with AD dementia [45–50]. Hence, these contradictory results related to decreased or increased hippocampal activity in MCI patients still need clarification.
Therefore, based on the above studies, our understanding of the mechanisms related to memory deficits in the AD continuum can be improved combining different approaches to investigate episodic memory processes in aMCI patients, including biomarkers such as Aβ deposition, hippocampal volume, and fMRI. However, there are no studies, to our knowledge, investigating episodic memory processes combining all these approaches using a more ecological cognitive fMRI task that reflects common real-life complaints of aMCI patients. We hypothesized that the inclusion of an ecological task in the assessment of episodic memory could be more sensitive to differentiate aMCI patients with Aβ deposition in comparison to aMCI without Aβ deposition and healthy controls in terms of cognitive profile, in addition to hippocampal activity and volume.
The aim of the current study was to investigate the role of Aβ deposition, functional hippocampal activity and structural volume in aMCI patients and healthy elderly controls using a new episodic memory task-related fMRI and traditional cognitive memory measures. A novel paradigm was developed for this study to explore episodic memory encoding and recall using newspaper headlines.
MATERIALS AND METHODS
Participants
Among the 46 older adults included in the study, 32 aMCI participants were recruited from the outpatient clinic of the Department of Neurology and Department of Psychiatry of the University of Sao Paulo Medical School and 14 healthy volunteers from the community. The sample consisted of Aβ PET PIB positive (PIB+) aMCI (N = 17), Aβ PET PIB negative (PIB–) aMCI (N = 15), and Healthy Controls (N = 14) (see below detailed description for the PET PIB and fMRI methods). All participants were right-handed. The diagnosis of MCI was made by a team of expert clinicians based on classic criteria [51, 52]. All patients with MCI met clinical criteria for amnestic MCI, single or multiple domains. The aMCI patient, and/or family member, reported a memory complaint, in the context of essentially intact activities of daily living, as assessed by the Functional Activities Questionnaire and Clinical Dementia Rating (CDR). In addition, they had to demonstrate no evidence of dementia, Mini-Mental State Examination (MMSE) score within expected range for education [53], CDR global score of 0.5, medically stable, no history of primary psychiatric disorder or depressive symptoms, assessed by the Neuropsychiatric Inventory and Geriatric Depression Scale [54, 55], and no substance or alcohol abuse within the past 2 years.
Controls were recruited from the community through advertising in local media or word of mouth. They had to perform in the normal range on all tests of the extended neuropsychological battery (see Table 1). The traditional tests and cognitive domains assessed consisted of estimated IQ from the WAIS-III using Vocabulary and Matrix Reasoning [56, 57]. For the memory domain, we used the Wechsler Memory Scale-Revised Logical Memory Test immediate (LM I) and delayed recall (LM II) [58], the Rey Auditory Verbal Learning Test immediate recall (RAVLT I) and delayed recall (RAVLT II) [59, 60] to assess verbal episodic memory, the Visual Reproduction immediate (VR I) and delayed recall (VR II, [58]) to assess visual episodic memory. The Boston Naming Test [61–63] was used to investigate naming ability, Phonemic (FAS), Semantic (Animals) Verbal Fluency, Trail Making A and B [60] to assess executive functions using education adjusted cut-off scores. Written informed consent was obtained prior to experimental procedures. The study was approved by the ethics committee of the Department of Neurology, University of São Paulo (CAPPesq 11264).
Table 1
Demographic, Cognitive, Behavior, and hippocampal imaging characteristics of Healthy Control subjects, aMCI PIB–and PIB+ MCI patients
| Controls | PIB– | PIB+ | ||||
| mean; n | (sd); % | mean; n | (sd); % | mean; n | (sd); % | |
| Number of participants | 14 | 32.61% | 15 | 30.43% | 17 | 36.96% |
| Gender (male) | 13 | 86.7% | 12 | 85.7% | 14 | 82.4% |
| Age | 70.87 | (6.85) | 69.14 | (4.70) | 75.35 | (5.68)c |
| Years of education | 13.75 | (4.06) | 11.50 | (4.20) | 10.67 | (5.40) |
| IQ | 104.90 | (7.40) | 99.00 | (12.66) | 96.93 | (6.80) |
| MMSE | 29.00 | (1.00) | 27.60 | (2.07) | 28.40 | (0.89) |
| ML I | 25.51 | (8.89)a | 23.07 | (5.84) | 17.13 | (3.78)c |
| ML II | 22.83 | (8.04)a | 17.93 | (5.45) | 10.80 | (3.76)c |
| RAVLT I | 44.92 | (7.88) | 38.57 | (9.68) | 37.87 | (9.24) |
| RAVLT II | 10.42 | (2.35)a,b | 7.43 | (2.77) | 6.93 | (3.11) |
| VR I | 34.00 | (3.74)a | 28.14 | (7.48) | 26.67 | (9.01) |
| VR II | 22.83 | (8.90)a | 16.36 | (8.21) | 12.73 | (8.90) |
| BNT | 52.33 | (4.87) a | 47.68 | (5.53) | 41.20 | (9.43) |
| Phonemic VF | 37.83 | (13.4) | 35.14 | (10.1) | 33.53 | (12.1) |
| Semantic VF | 20.33 | (5.19)a,b | 14.00 | (2.99) | 13.93 | (5.61) |
| TMT A | 35.17 | (10.7) | 52.80 | (22.7) | 57.83 | (30.9) |
| TMT B | 83.81 | (42.5)a,b | 167.89 | (81.0) | 165.75 | (72.3) |
| THI | 4.59 | (1.69) a,b | 2.94 | (1.59) | 3.0 | (1.78) |
| THD | 5.00 | (1.5)a,b | 3.07 | (1.50) | 2.7 | (1.3) |
| TSI | 10.16 | (5.59) a,b | 7.00 | (3.67) | 5.53 | (3.39) |
| TSD | 10,22 | (6.18)a,b | 7,06 | (3.93) | 4.73 | (3.12)c |
| L-Hipp Volume | 3523.4 | (252.2) | 3616.2c | (531.0) | 3184.2 | (449.4) |
| R-Hipp Volume | 3642.0 | (250.4) | 3576.2 | (611.8) | 3329.7 | (430.8) |
| L-Hipp BOLD | 8.3 | (10.2) | 7.0 | (9.7) | 8.0 | (13.1) |
| R-Hipp BOLD | 4.3 | (7.4) | 6.1 | (8.7) | 7.6 | (12.5) |
| TBV | 1002.1 | (73.4) | 986.4 | (86.9) | 933.9 | (92.4) |
PIB+, subjects above threshold affinity of Pittsburgh compound B (PIB); PIB–, subjects below the threshold affinity for PIB by PET scan; IQ, intellectual quotient; MMSE, Mini-Mental Status Examination; LM I, Logical Memory immediate recall; LM II, Logical Memory delayed recall; RAVLT I, Rey Auditory Verbal Learning Test immediate recall; RAVLT II, Rey Auditory Verbal Learning Test delayed recall; VR I, Visual Reproduction immediate recall; VR II, Visual Reproduction delayed recall; TMT, Trail Making Test; THI, total immediate number of headlines recall (maximum of 8); THD, total delayed number of headlines recall (maximum of 8); TSI, total immediate score out of 24; TSD, total delayed score out of 24; Hipp, hippocampus; BOLD, average blood oxygenation level-dependent signal; TBV, total brain volume (cm3); L, left; R, right. asignificant differences between PIB+ and control group (p < 0.05). bsignificant differences between PIB–and control group (p < 0.05). csignificant PIB+ and PIB–differences (p < 0.05, weighted by age).
Amyloid PET imaging acquisition
Aβ was measured by PET using Pittsburg compound-B (N-methyl-[11C]-2(4-methylaminophenyl)-6-hydroxybenzothiazole) (PET [11C] PiB), produced at the Centro de Medicina Nuclear of HC-FMUSP using an on-site cyclotron (PETtrace-880, GE-Healthcare) and PET/CT images were acquired using a Discovery-710 PET/CT-scanner (GE-Healthcare, Milwaukee, WI, USA). Before data acquisition, a CT scan from the skull was acquired and used for attenuation correction and anatomic localization, at: 120 kVp and 70 mA (140 mA and 0.5 s per rotation) for the [11C]PiB-PET data acquisitions.
Details of the [11C]PiB radiochemical production were described elsewhere [64]. For the acquisition of [11C]PiB -PET data, subjects were positioned with the brain in the center of the field of view of the PET equipment and [11C]PiB was injected intravenously (296–740 MBq). The acquisition started immediately after the beginning of tracer injection. Images were acquired for 70 min in a PET/ CT scanner (Discovery 710, GE Healthcare, Milwaukee, WI, USA) using a 256×256 mm matrix. Images from 40 to 70 min after injection were condensed in time creating a static [11C]PiB-PET showing extracellular Aβ deposits. Images were corrected for radioactive decay, dead time, attenuation, and scatter and reconstructed using the OSEM algorithm, 4 iterations and 16 subsets.
The protocol used for the classification of individuals as PIB+ or PIB–was previously described [65]. In summary, two certified nuclear medicine physicians with more than five years of experience in the field evaluated each [11C]PiB-PET dataset independently and blinded to diagnoses. Images were rated as “positive” if there was an increase in [11C]PiB uptake in cortical gray matter areas causing a loss of gray matter to white matter contrast in at least two of the six following areas: frontal, temporal, lateral parietal, anterior cingulate, and posterior cingulate cortices, and precuneus. They also rated the images as positive if only one single large cortical area had a strong diffuse [11C]PiB uptake. A scan was rated as “negative” when there was strong white matter uptake and no significant gray matter uptake. As a second step, each physician performed an analysis with the aid of the 3D-SSP semi-quantitative method designed for the clinical analysis of brain PET amyloid imaging (Cortex ID Suite software, GE healthcare), with the standard uptake values ratio (SUVr) of the cortical areas normalized to the cerebellar gray matter. A SUVr cutoff of 1.42 was used for PIB+ scoring for the composite of cortical areas, complementing the visual analysis. In cases of persisting discordance between the readers after the 3D-SSP analyses, consensus readings with both physicians were performed.
fMRI experimental paradigm and procedures
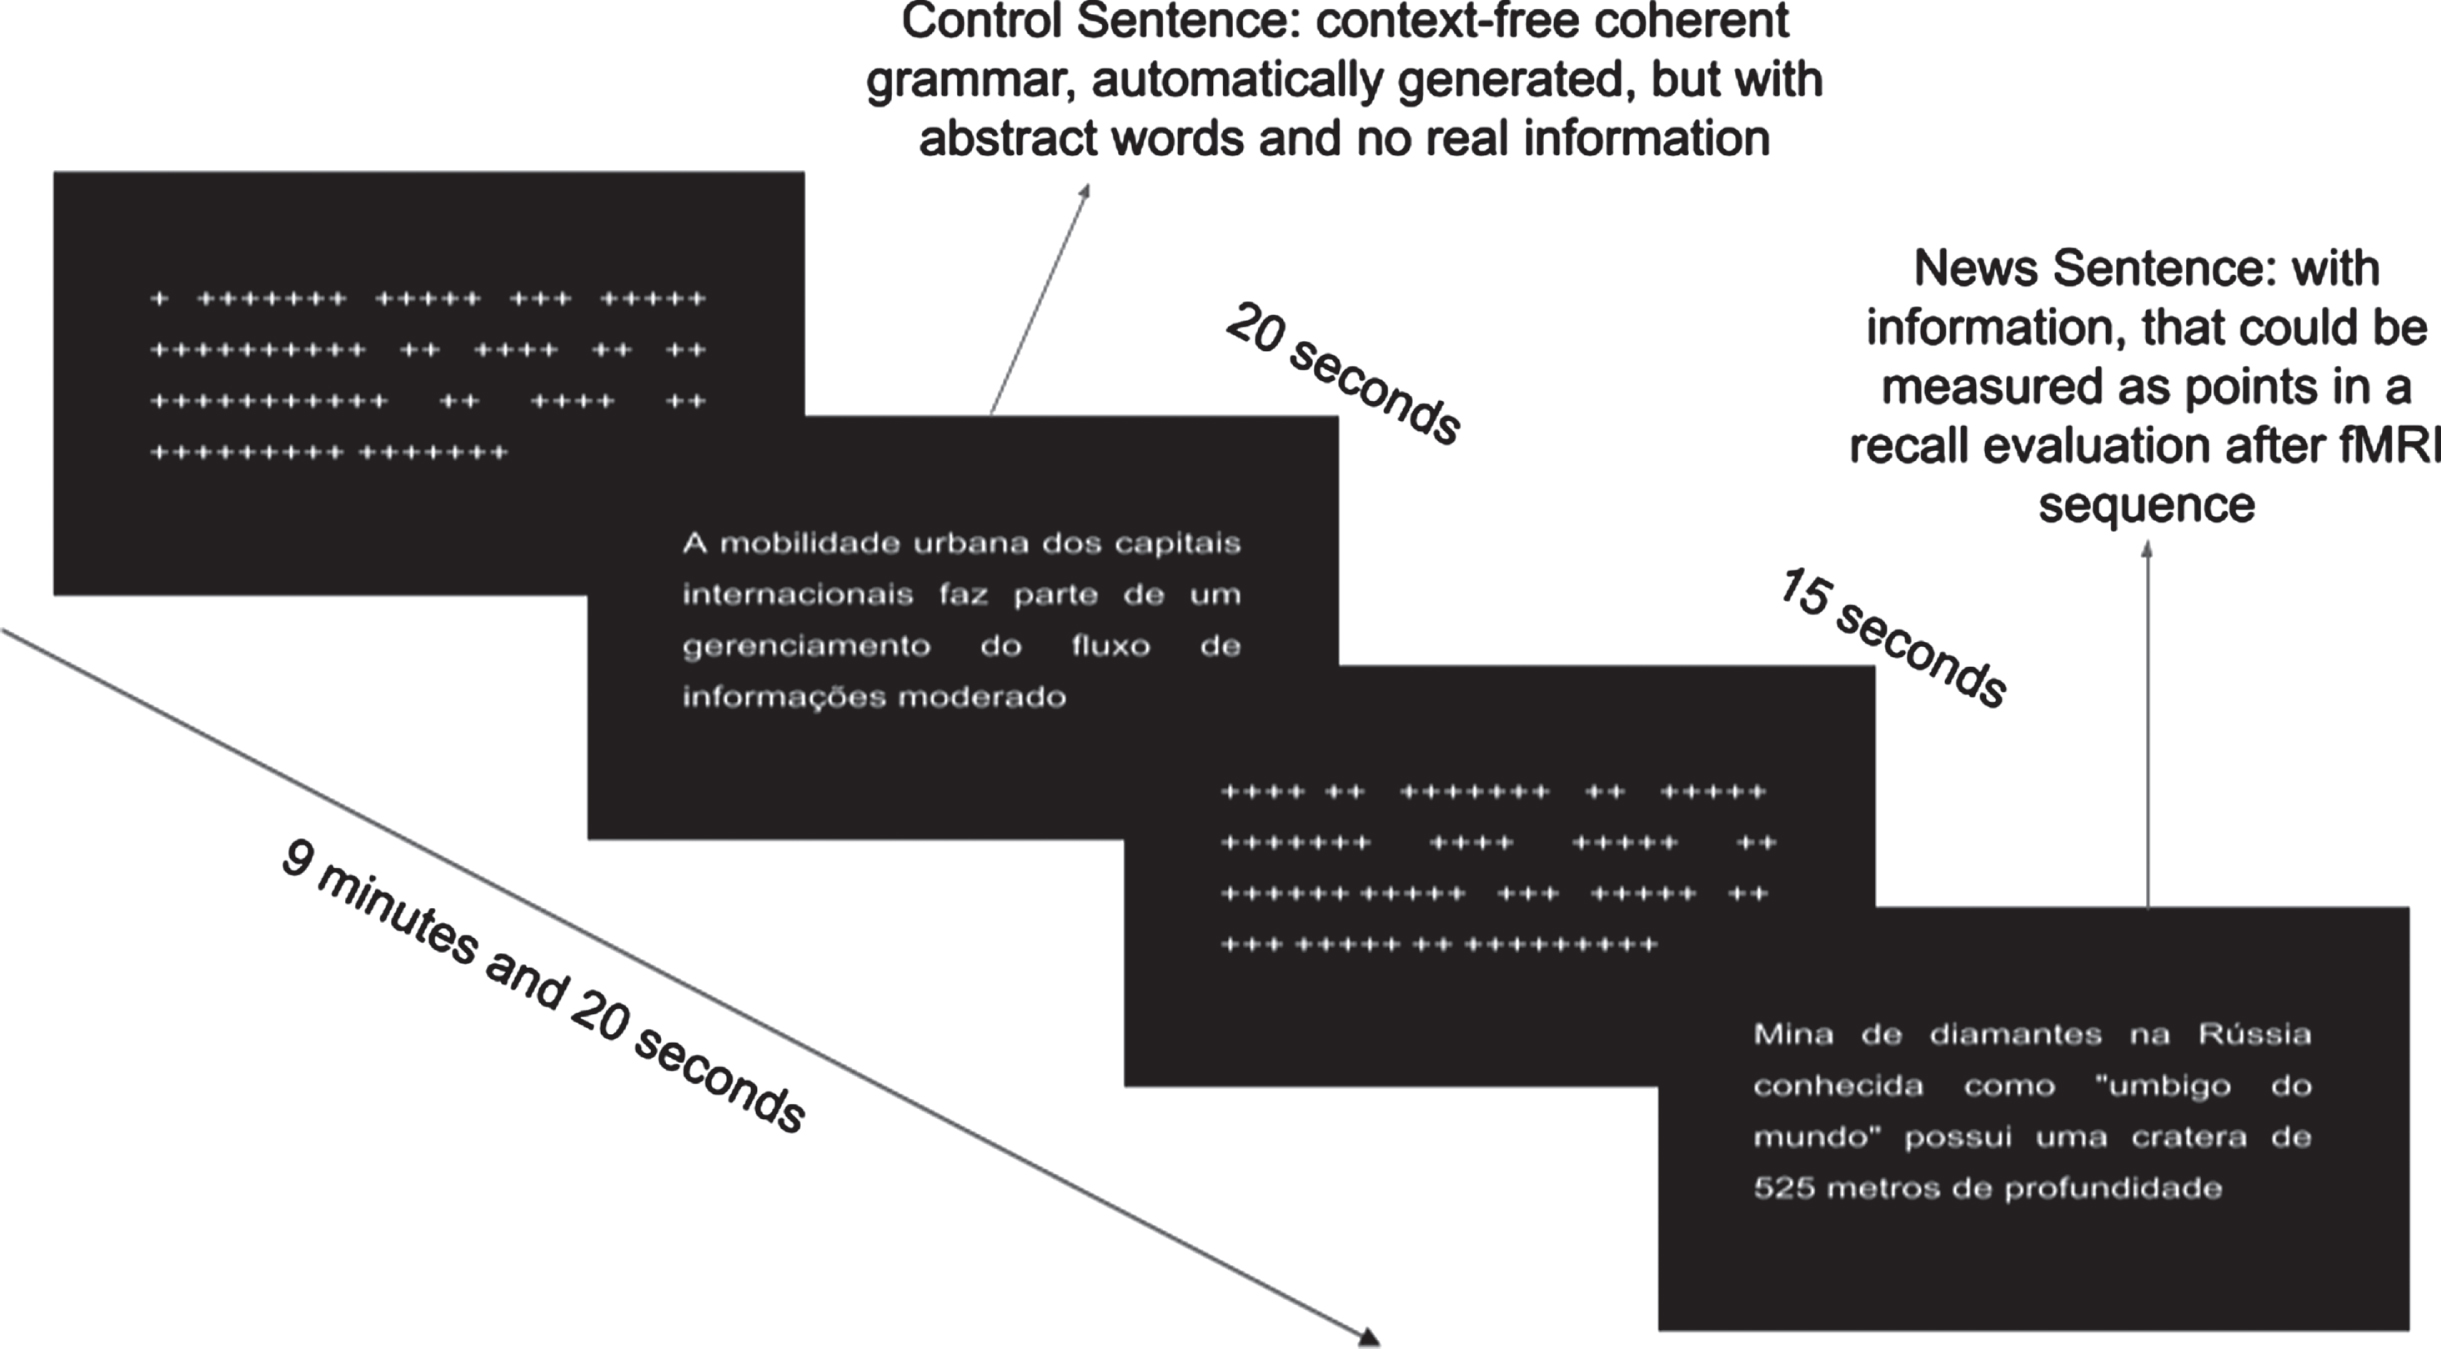
Volunteers performed an encoding memory paradigm during fMRI scan, in which they were instructed to read and memorize real news headlines obtained online through newspapers and magazines. The paradigm followed a block design. Two types of news headlines were used: real headlines, which contained objective information about recent news, curiosities of places and cultures; and unreal informationless headlines generated by an automatic text generator, which creates context-free sentences following grammar rules (https://lerolero.com). The informationless headlines used abstract subjects and objects, having almost zero objective information, making it difficult to memorize. A total of 8 real and 8 unreal news headlines were presented to participants. Both real and unreal news were the same for all participants. Each headline had approximately 18 words written in 24 Arial-font. Figure 1 shows examples of the unreal headlines, including “the urban mobility of the international capitals is part of a moderate information flow management” and the real headlines “diamond mine in Russian known as the navel of the world is more than 525 meters deep”. Each task block lasted 20 s. Between task blocks, there was a 15 s baseline condition, during which a series of “+” characters was presented in a sentence-like structure, replacing the letters to maintain similar visual stimulation. Each type of task block was presented 8 times, totaling 16 task blocks and 16 baseline blocks (see Fig. 1). Imaging acquisition was performed during presentation (encoding) of the headlines. Immediately after the paradigm task presentation and a 30 min later, participants were instructed to recall all headlines they could remember offline. Behavioral outcome measures included the total number of real headlines immediately (THI) recalled and after a 30 min delay (THD) out of 8 possible real headlines. In addition, each headline was scored in terms of the amount of information from 1 to 3 points, totalizing up to 24 points for the 8 headlines, immediately (TSI) and after a 30 min delay (TSD).
Fig. 1
fMRI paradigm task showing the block conditions during encoding.
Imaging acquisition
The MRI images were acquired with a 3T (Philips Achieva - Netherlands) scanner. Three types of images were acquired from each participant: a T1-weighted structural image (TR = 7 ms; TE = 3.2 ms, voxel size = 1×1×1 mm3, 240×240 slice matrix; 180 slices; flip angle = 8°, scan duration = 6 min 2 s), a BOLD (T2*-weighted) functional sequence (TR = 2 s; TE = 30 ms; voxel size = 3×3×3 mm3, with 0.3 mm gap between slices; 80×80 slice matrix; 40 slices; 280 volumes [plus 4 dummy scans], flip angle = 90°) and a T2-weighted FLAIR structural image (TR = 11 s; TE = 130 ms, voxel size = 0.65×0.87×4.50 mm3, with 0.5 mm gap between slices, 356×210 slice matrix; 28 slices; flip angle = 8°, scan duration = 3 min 51 s). The scanning session lasted approximately 15 min for the paradigm presentation. Clinical assessment and neuroimaging acquisition were carried out within 1 to 3 months interval.
Statistics
Demographic and behavioral data
ANOVA, T-Test, and MANOVA were used in between-group univariate analyses for normally distributed variables and Kruskal-Wallis otherwise and controlled for multiple comparisons.
fMRI task analysis
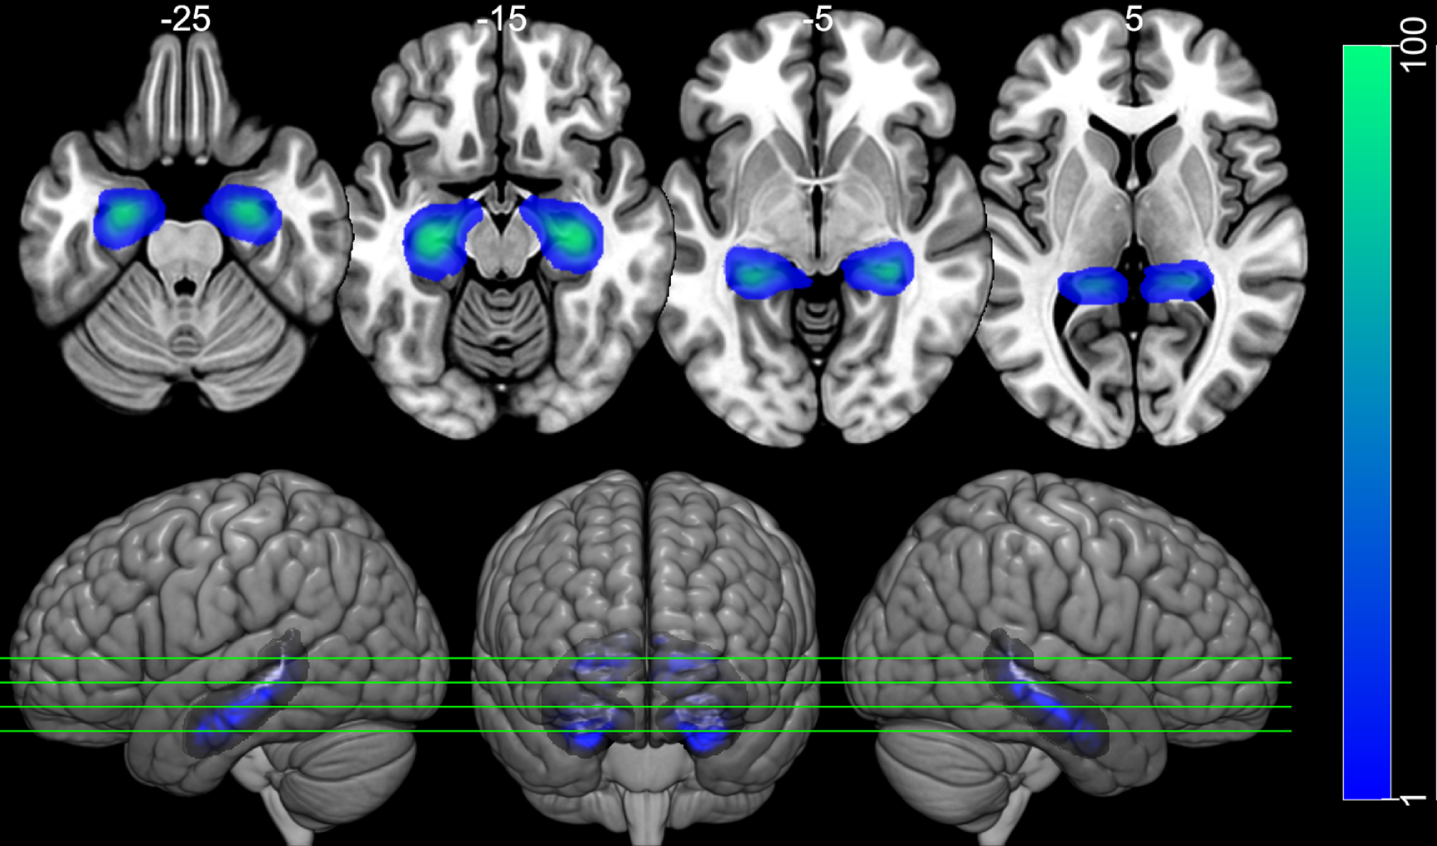
The fMRI data were preprocessed using FSL software version 6.0. The images were realigned with MCFLIRT and were slice-time corrected. Then, the estimated relative head movement parameters were used for scrubbing noisy volumes using the Artifact Detection Tools toolbox (RRID:SCR_005994; http://web.mit.edu/swg/software.htm ). The threshold for excessive head motion and excessive global signal were 0.9 mm, 5 standard deviations from the mean, respectively. Images were then spatially smoothed (FWHM = 5 mm), and high-pass filtered (filtering periods longer than 140 s). A general linear model in the first level of analysis was adopted using the timings of two types of task block (news sentence and control sentence) convolved with double-gamma hemodynamic response function to generate the regressors of the model. The first derivatives of these regressors were also included in the model, as well as the motion parameters and the scrubbing variables generated by the Artifact Detection Tools toolbox. To focus on the analysis of the hippocampus, two regions of interest (ROIs) were used, one in the left hippocampus and the other on the right hippocampus (Fig. 2), based on the Harvard-Oxford Cortical Atlas. The weighted average of the BOLD response to the news sentence task was extracted for each ROI, using the voxel probability of belonging to the hippocampus as weights. For group level analysis, these ROIs values were included in a logistic regression model.
Fig. 2
Hippocampal ROIs. Image of the left and right hippocampus ROIs over the MNI152 template. The ROIs were taken from the Harvard-Oxford Cortical Atlas. The ROIs have weights according to the probability of voxel belonging to the left or to the right hippocampus (left Blue-Green color scale). The top row shows 4 axial slides, taken from the positions indicated in the bottom row, which present 3D rendered images. Images are displayed following neurological convention.
Hippocampal volume
The 3DT1 acquisitions were automatically processed with the full longitudinal pipeline analysis in Freesurfer v6.0 (https://surfer.nmr.mgh.harvard.edu/) for cortical reconstruction and volumetric segmentation. The steps included motion correction, removal of non-brain tissue using a hybrid watershed/surface deformation procedure, automated Talairach transformation, segmentation of the subcortical white matter and deep gray matter volumetric structures (including hippocampus), intensity normalization, tessellation of the gray matter white matter boundary, automated topology correction and surface deformation, segmentation, and labeling of the subcortical structures. Automated output statistics were generated, including left and right hippocampal volumes, brain segmentation volume, and brain segmentation volume without ventricles, which were used in the logistic regression described below.
Classification procedure
For the group classification task, we used a specific design that followed standards and was performed with https://scikit-learn.org/stable tools and following the principles of clarity and transparency for reproducible experiments (https://nipy.org/). The pipeline included nested data normalization and the logistic regression (LR) fitting, using groups as outcome variable (with PIB+ as reference) and bilateral hippocampi volumes and headlines retrieval mean BOLD response, THD, TSD, LM II, and RAVLT II as predictors, based on previous literature showing consistent impairment on delayed recall of episodic memory tests [32–35]. Additionally, to avoid mixing total brain volume effect with hippocampal effects, two extra models were used: one included the total brain volume (TBV) as a factor; the other used TBV for standardization of hippocampus volume and BOLD signal [66–68]. These models were compared using log loss index, and the model with the smallest value (best fit) was selected.
The model was specially designed to explore subtle pattern differences: stratified k-fold and cross-validation procedures, for a good generalization of prediction also avoiding overfitting. Modeling started using standard hyperparameters (inverse of regularization: C = 1.0, not weighted by class ("groups"), intercept fit with scaling = 1, max_iter = 10000, auto multiclass modeling, L2 penalty, liblinear solver, random state = 10 and tolerance = 0.0001). Subsequently, the hyperparameters optimization was performed to tune an optimized model [69, 70] for the three designs. The search of hyperparameters is obtained during cross-validation using the permutation of all possible combination of values for selected hyperparameters (multi class = [‘multinomial’, ‘ovr’], solver = [‘liblinear’, ‘lbfgs’, ‘newton-cg’, ‘sag’, ‘saga’], penalty = [‘none’, ‘l1’, ‘l2’], C = [1e-5, 1e-4, 1e-3, 1e-2, 1e-1, 1, 10, 100]) to select the combination with best performance, by adopting an specific measure (balanced accuracy). The model is fitted with best hyperparameters and its performance and the adjustment for each design was evaluated by log loss. For better interpretability, model coefficients were transformed to represent the percentage variation for the chance of being classified to a given group ([odds-ratio - 1]*100) in relation to classification to any other group per one unit change in a predictor keeping the remaining predictors constant.
RESULTS
Demographic and behavioral data
The demographic and cognitive profile of patients and healthy subjects included in the study are shown in Table 1. The patient and control groups were matched for gender (p = 0.560), years of education (p = 0.406), mean IQ (p = 0.075) and MMSE (p = 0.200) according to ANOVA tests. The PIB+ group versus PIB–(p = 0.018) age comparison showed difference and this difference was considered in subsequent within and between-group analyses weighted by age for demographic and neuropsychological data.
The aMCI PIB+ patients showed significantly lower performance on LM I (p = 0.047) and LM II (p = 0.007) in relation to PIB–group. They also revealed significantly poor performance in relation to controls on LM I (p = 0.007), LM II (p = 0.001), RAVLT II (p = 0.008), VR I and VR II (p = 0.040 and p = 0.014, respectively), BNT (p = 0.001), semantic verbal fluency (p = 0.005), and Trail Making Test B (p = 0.011).
The aMCI PIB–patients demonstrated worse performance in relation to controls on RAVLT II (p = 0.029), semantic verbal fluency (p < 0.005), and Trail Making B (p < 0.010). No significant differences were found in between-group comparisons in the mean scores obtained for RAVLT I, LM I, LM II, phonemic verbal fluency, and Trail Making Test A.
Regarding differences in the fMRI task behavior, control subjects performed better in almost all measures compared to PIB+, including THI (p = 0.001), TSI (p = 0.004), THD (p = 0.002), and TSD (p = 0.001) and to PIB–in THI (p = 0.010), TSI (p = 0.040), THD (p = 0.030), with the exception of TSD (p = 0.060) for the latter. PIB+ showed significantly worse performance on TSD (p = 0.046) in comparison to PIB–patients. In all measures, the difference was accentuated for PIB+ patients, as demonstrated by lower alpha errors and greater coefficients.
Classification results
The resulting LR models reached the weighted average accuracy about 0.77 and p = 0.009 using the best hyperparameters found during cross-validation. The model without TBV correction has selected the hyperparameters: C = 0.01, multi_class = multinomial, penalty = L2, solver = newton-cg. The model using TBV as standardization has selected the following hyperparameters: C = 0.01, multi_class = ovr, penalty = l2, solver: lbfgs. The model using TBV as a factor in the analysis have selected the hyperparameters: C = 0.01, multi_class = multinomial, penalty = L2, solver = newton-cg. The comparison of the three models, evaluated by the log loss index, showed that the model that included brain volume as a model factor had the lowest index, meaning a better fit of the prediction to the real data than the models that did not considered the TBV or used it as standardization (0.53 versus 0.81 and 0.57, respectively).The classification patterns for each group by predictors in the best model (with TBV as factor) are presented in Table 2.
Table 2
Logistic estimates for aMCI patients into group classification: aMCI PIB+, aMCI PIB–patients and controls predicted by hippocampi ROI task-related BOLD signal and volumes and delayed recall performance
| con | PIB– | PIB+ | |
| l_hipp_volume | –0.15% | 0.40% | –0.25% |
| r_hipp_volume | 0.09% | –0.27% | 0.18% |
| l_hipp_meanbold | 1.81% | 1.29% | –3.03% |
| r_hipp_meanbold | –0.74% | –0.42% | 1.17% |
| TBV | 0.64% | –0.30% | –0.34% |
| THD | 5.36% | –1.34% | –3.80% |
| TSD | 14.07% | –2.53% | –10.06% |
| logic_mem_II | 3.23% | 5.88% | –8.51% |
| RAVLTII | 11.53% | –9.15% | –1.31% |
TBV, total brain volume; THD, total delayed number of headlines recall (maximum of 8); TSD, total delayed score out of 24; ROI, region of interest; BOLD, ROI average blood oxygenation level-dependent signal; R, right; L, left; H, hippocampus.
aMCI PIB+ patients results
In the present sample subjects the classification chances in PIB+ increases proportionally as predictor measures decrease, in general. The chance of belonging to the PIB+ group increases by 0.35% as TBV decrease 1 cm3, 0.25%, and 0.18% as left hippocampus volumes decrease and right hippocampal volumes increase 1 mm3, respectively. Similarly, with each unit of normalized change in the mean BOLD signal related to the headline’s retrieval in the left and right hippocampus modifies the chance of classification in PIB+ in –3.03% and 1.17%, respectively. Worse performance on the fMRI delayed recall tasks and neuropsychological memory tests was also related to an increased probability of PIB+ classification about 3.8% for THD, 10% for TSD, 8.51% for LM II and 1.31% for RAVLT II.
aMCI PIB–patients results
PIB–categorization probability increase with higher left hippocampal volumes in 0.4% and decreased TBV in 0.30% and in 0.27% with right hippocampus decrease; higher headlines retrieval means BOLD response in the left hippocampus in 1.29% and lower response in right in 0.42%, as well as, by changes for TSD in –2.53%, THD in –1.34%, LM II in 5.88%, and RAVLT II in –9.15%.
Healthy controls
Increased healthy controls classification was related as a whole to the increment of measurements, except for left hippocampal volume and right hippocampus headlines retrieval mean BOLD response in which decrement was 0.15% and 0.74% in its probability, respectively. The larger TBV, right hippocampal volume, and left hippocampus headlines retrieval mean BOLD response by unit, the categorization as controls increases in 0.64%, 0.09%, and 0.25% respectively; plus 5.36% for THD and 14.07% for TSD, 3.23% for LM II, and 11.53% to RAVLT II points.
DISCUSSION
In the current study, we investigated the effects of Aβ deposition, hippocampal function, and volume in patients with aMCI and healthy controls using traditional neuropsychological tests and a new ecological episodic memory fMRI task to assess encoding and recall of newspaper headlines. The main cognitive results showed significantly worse performance for aMCI PIB+ patients in comparison to aMCI PIB–patients on immediate and delayed verbal episodic memory recall measured by the LM I and II test and the TSD fMRI session task. PIB+ patients also demonstrated poorer performance in relation to controls on verbal and visual episodic memory tests (RAVLT II and VR I and II), naming (BNT) and executive functions (semantic fluency and Trail Making Test B). On the other hand, aMCI PIB–patients showed significant lower performance only in relation to controls on tests of delayed verbal memory recall (RAVLT II) and executive functions (semantic fluency and Trail Making B). Some previous studies investigating cognitive performance in aMCI patients with Aβ biomarker demonstrated similar results using traditional tests of episodic memory, language and executive functions [25, 30, 71, 72]. In our study, we found that an ecological measure (TSD), akin to everyday life complaints of these patients, was more sensitive to distinguish aMCI PIB+ from aMCI PIB–patients, which shows similarities to the traditional LM test in terms of memory recall of meaningful information [71, 72].
The neuroimaging results suggest that TBV was relevant in classifying the groups and ameliorate model adjustment. In the aMCI PIB+ patients this pattern was characterized by lower TVB and a dissociated laterality in terms of volume and function of the hippocampi. This pattern is characterized by a decrease in TBV, left hippocampal volume and function, with the inverse right hippocampus finding, related to worse episodic memory delayed recall performance. Taken together, these findings suggest that decreased function and volume in the left hippocampus and brain as a whole, associated with increase in the right hippocampus, may represent worse ability to encode and recall new information for the aMCI PIB+ patients, even if compensated by the latter finding. A possible explanation for our BOLD findings could be related to the tendency of left hippocampal volume reduction in the aMCI PIB+ group. These results support the notion of hippocampal decreased activity found in other studies conducted in MCI patients [45–50]. The issue related to decreased or increased hippocampal function in previous studies could also be affected by different inclusion criteria for MCI patients, such as early or late MCI and the lack of AD biomarkers which could lead to the inclusion of MCI participants with mixed and heterogeneous etiology other than AD.
The aMCI PIB–group classification was associated with similar TBV and inverted PIB+ group pattern. They showed increased left hippocampal volume and activity, decreased right hippocampal volume and activity associated with lower ability to encode and recall new information measured by fMRI recalling tasks, accompanied by lower TBV. These results suggest a double dissociation of lateralization of neural correlates between patient groups, beside of whole brain decrement, probably due to their unlike AD underlying pathology. Since the main objective of this study was to investigate these groups in a cross-sectional way, future longitudinal studies are needed to characterize further the aMCI PIB- group pathology.
As expected, for the control group, we found a better ability to encode and recall new information on the fMRI, THD and TSD tasks related to higher TBV. They also showed similarities with PIB–group for hippocampal volumes and with PIB+ group for hippocampal function for its classification.
These findings point to a particular set of classification by specific features based on episodic memory performance, structure and function of the hippocampus, in particular, a lateralization imbalance of hippocampus volume and function in the distinction between aMCI PIB+ and PIB–individuals, and also to healthy elderly people in a non-linear point of view. Our findings on the left hippocampus and whole brain corroborate the hypothesis of hippocampal activation course increasing from normal aging to early MCI and then gradually decreasing from middle-late MCI stage to AD in the presence of Aβ deposition [50, 73–75]. On the other hand, the pattern observed for right hippocampal activation was inverted. The aMCI PIB+ participants included in the current study were, possibly, in the middle-late MCI stage of AD due to their left hippocampal volume reduction indicating the presence of atrophy in this area and hence decreased activation. Inversely, the aMCI PIB–individuals have possible compensation effects on hippocampal volume which could possibly be related to a non-AD underlying etiology. Nevertheless, investigation of the trajectories of hippocampal function in distinct stages of MCI within and without the AD continuum is still ongoing.
The episodic memory deficits found in the present study measured by traditional neuropsychological tests, such as LM, RAVLT, and VR have considerable clinical predictive value and are largely used in the clinical and research context. However, it should be noted that those traditional episodic memory tests have several limitations including the use of unnatural elements, such as lists of words and geometric figures. The use of ecological episodic memory tasks that resembles real life activities, such as face-name association [75] and the newspaper events task used in the current study has the advantage of promoting meaningful associations to subjective and objective real-life complaints and face-validity. Future studies with larger samples and using such tasks off-scan in comparison with traditional tests can further clarify this issue.
Limitations of the current study include the modest cohort size, lack of other biomarkers such as tau deposition to understand possible pathology underlying the aMCI PIB–group and Aβ biomarker for the control group. Nevertheless, these individuals were carefully selected from the community using rigorous neurological and neuropsychological test criteria and the control group had no subjective cognitive complaint.
In conclusion, the main findings of the present study can contribute to the understanding of the differential neural correlates, hippocampal function and volume associated with episodic memory decline in aMCI patients with the presence or absence of Aβ deposition. They also point to the direction in terms of selection criteria of aMCI patients in future studies with biomarkers highlighting the importance of considering a homogeneous sample in terms of stage (early or late) during the course of MCI within the AD continuum and use of ecological tasks.
ACKNOWLEDGMENTS
This research was partially funded by the Sao Paulo Research Foundation (FAPESP) reference number 2012/50329-6 and 14/50873-3; National Council for Scientific and Technologic in Development (CNPQ) in Brazil reference number 465412/2014-9.
Authors’ disclosures available online (https://www.j-alz.com/manuscript-disclosures/22-0100r2).
REFERENCES
[1] | Petersen RC , Smith GE , Waring SC , Ivnik RJ , Tangalos EG , Kokmen E ((1999) ) Mild cognitive impairment: Clinical characterization andoutcome. Arch Neurol 56: , 303–308. |
[2] | Petersen RC ((2016) ) Mild cognitive impairment. Continuum (Minneap Minn) 22: , 404–418. |
[3] | Albert MS , DeKosky ST , Dickson D , Dubois B , Feldman HH , Fox NC , Gamst A , Holtzman DM , Jagust WJ , Petersen RC , Snyder PJ , Carrillo MC , Thies B , Phelps CH ((2011) ) The diagnosis of mild cognitive impairment due to Alzheimer’s disease: Recommendations from the National Institute on Aging-Alzheimer’s Association workgroups on diagnostic guidelines for Alzheimer’s disease. Alzheimers Dement 7: , 270–279. |
[4] | McKhann GM , Knopman DS , Chertkow H , Hyman BT , Jack CR , Kawas CH , Klunk WE , Koroshetz WJ , Manly JJ , Mayeux R , Mohs RC , Morris JC , Rossor MN , Scheltens P , Carrillo MC , Thies B , Weintraub S , Phelps CH ((2011) ) The diagnosis of dementia due to Alzheimer’s disease: Recommendations from the National Institute on Aging-Alzheimer’s Association workgroups on diagnostic guidelines for Alzheimer’s disease. Alzheimers Dement 7: , 263–269. |
[5] | Ossenkoppele R , Cohn-Sheehy BI , La Joie R , Vogel JW , Möller C , Lehmann M , van Berckel BNM , Seeley WW , Pijnenburg YA , Gorno-Tempini ML , Kramer JH , Barkhof F , Rosen HJ , van der Flier WM , Jagust WJ , Miller BL , Scheltens P , Rabinovici GD ((2015) ) Atrophy patterns in early clinical stages across distinct phenotypes of Alzheimer’s disease. Hum Brain Mapp 36: , 4421–4437. |
[6] | Jack CR Jr , Bennett DA , Blennow K , Carrillo MC , Dunn B , Haeberlein SB , Holtzman DM , Jagust W , Jessen F , Karlawish J , Liu E , Molinuevo JL , Montine T , Phelps C , Rankin KP , Rowe CC , Scheltens P , Siemers E , Snyder HM , Sperling R , Contributors ((2018) ) NIA–AA Research Framework: Toward a biological definition of Alzheimer’s disease. Alzheimers Dement 14: , 535–562. |
[7] | Hardy JA , Higgins GA ((1992) ) Alzheimer’s disease: The amyloid cascade hypothesis. Science 256: , 184–185. |
[8] | Sperling RA , Aisen PS , Beckett LA , Craft S , Fagan AM , Iwatsubo T , Jack CR , Kaye J , Montine TJ , Park DC , Reiman EM , Rowe CC , Siemers E , Stern Y , Yaffe K , Carrillo MC , Thies B , Morrison-Bogorad M , Wagster MV , Phelps CH ((2011) ) Toward defining the preclinical stages of Alzheimer’s disease: Recommendations from the National Institute on Aging–Alzheimer’s Association workgroups on diagnostic guidelines for Alzheimer’s disease. Alzheimers Dement 7: , 280–292. |
[9] | Jack CR Jr , Knopman DS , Jagust WJ , Petersen RC , Weiner MW , Aisen PS , Shaw LM , Vemuri P , Wiste HJ , Weigand SD , Lesnick TG , Pankratz VS , Donohue MC , Trojanowski JQ ((2013) ) Tracking pathophysiological processes in Alzheimer’s disease: An updated hypothetical model of dynamic biomarkers. Lancet Neurol 12: , 207–216. |
[10] | Bryan KJ , Lee H , Perry G , Smith MA , Casadesus G ((2009) ) Transgenic mouse models of alzheimer’s disease: Behavioral testing and considerations. In Methods of Behavior Analysis in Neuroscience, 2nd edition, BuccafuscoJJ, ed. CRC Press/Taylor & Francis, Boca Raton, FL. |
[11] | Kametani F , Hasegawa M ((2018) ) Reconsideration of amyloid hypothesis and tau hypothesis in Alzheimer’s disease. Front Neurosci 12: , 25. |
[12] | Kim J , Onstead L , Randle S , Price R , Smithson L , Zwizinski C , Dickson DW , Golde T , McGowan E ((2007) ) Abeta40 inhibits amyloid deposition. }. J Neurosci 27: , 627–633. |
[13] | Kim J , Chakrabarty P , Hanna A , March A , Dickson DW , Borchelt DR , Golde T , Janus C ((2013) ) Normal cognition in transgenic BRI2-Aβ mice. Mol Neurodegener 8: , 15. |
[14] | Ostrowitzki S , Deptula D , Thurfjell L , Barkhof F , Bohrmann B , Brooks DJ , Klunk WE , Ashford E , Yoo K , Xu ZX , Loetscher H , Santarelli L ((2012) ) Mechanism of amyloid removal in patients with Alzheimer disease treated with gantenerumab. Arch Neurol 69: , 198–207. |
[15] | Giacobini E , Gold G ((2013) ) Alzheimer disease therapy–moving from amyloid-β to tau. Nat Rev Neurol 9: , 677–686. |
[16] | Doody RS , Thomas RG , Farlow M , Iwatsubo T , Vellas B , Joffe S , Kieburtz K , Raman R , Sun X , Aisen PS , Siemers E , Liu-Seifert H , Mohs R ; Alzheimer’s Disease Cooperative Study Steering Committee; Solanezumab Study Group ((2014) ) Phase 3 trials of solanezumab for mild-to-moderate Alzheimer’s disease. N Engl J Med 370: , 311–321. |
[17] | Salloway S , Sperling R , Fox NC , Blennow K , Klunk W , Raskind M , Sabbagh M , Honig LS , Porsteinsson AP , Ferris S , Reichert M , Ketter N , Nejadnik B , Guenzler V , Miloslavsky M , Wang D , Lu Y , Lull J , Tudor IC , Liu E ((2014) ) Bapineuzumab 301 and 302 Clinical Trial Investigators. Two phase 3 trials of bapineuzumab in mild-to-moderate Alzheimer’s disease. N Engl J Med 370: , 322–333. |
[18] | Edison P , Archer H A , Hinz R , Hammers A , Pavese N , Tai Y F , Hotton G , Cutler D , Fox N , Kennedy A , Rossor M , Brooks DJ ((2007) ) Amyloid, hypometabolism, and cognition in Alzheimer disease: An [11C]PIB and [18F]FDG PET study. Neurology 68: , 501–508. |
[19] | Li Q , Gordon M , Etienne MA , Hammer RP , Morgan D ((2008) ) Contrasting effects of two peptide-based amyloid-beta protein aggregation inhibitors in a transgenic mouse model of amyloid deposition. }. Cell Transplantat 17: , 397–408. |
[20] | Chételat G ((2013) ) Alzheimer disease: Aβ-independentprocesses-rethinking preclinical AD. Nat Rev Neurol 9: , 123–124. |
[21] | Dubois B , Villain N , Frisoni GB , Rabinovici GD , Sabbagh M , Cappa S , Bejanin A , Bombois S , Epelbaum S , Teichmann M , Habert MO , Nordberg A , Blennow K , Galasko D , Stern Y , Rowe CC , Salloway S , Schneider LS , Cummings JL , Feldman HH ((2021) ) Clinical diagnosis of Alzheimer’sdisease: Recommendations of the International Working Group. Lancet Neurol 20: , 484–496. |
[22] | Jansen WJ , Ossenkoppele R , Tijms BM , Fagan AM , Hansson O , Klunk WE , van der Flier WM , Villemagne VL , Frisoni GB , Fleisher AS , LleóA , Mintun MA , Wallin A , Engelborghs S , Na DL , Chételat G , Molinuevo JL , Landau SM , Mattsson N , Kornhuber J , Sabri O , Rowe CC , Parnetti L , Popp J , Fladby T , Jagust WJ , Aalten P , Lee DY , Vandenberghe R , Resende de Oliveira C , Kapaki E , Froelich L , Ivanoiu A , Gabryelewicz T , Verbeek MM , Sanchez-Juan P , Hildebrandt H , Camus V , Zboch M , Brooks DJ , Drzezga A , Rinne JO , Newberg A , deMendonca A , Sarazin M , Rabinovici GD , Madsen K , Kramberger MG , Nordberg A , Mok V , Mroczko B , Wolk DA , Meyer PT , Tsolaki M , Scheltens P , Verhey FRJ , Visser PJ , Amyloid Biomarker Study Group, Aarsland D , Alcolea D , Alexander M , Almdahl IS , Arnold SE , BaldeirasI , Barthel H , van Berckel BNM , Blennow K , van Buchem MA , Cavedo E , Chen K , Chipi E , Cohen AD , Förster S , Fortea J , Frederiksen KS , Freund-Levi Y , Gkatzima O , Gordon MF , Grimmer T , Hampel H , Hausner L , Hellwig S , Herukka SK , Johannsen P , Klimkowicz-Mrowiec A , Köhler S , Koglin N , van Laere K , de Leon M , Lisetti V , Maier W , Marcusson J , Meulenbroek O , Møllergård HM , Morris JC , Nordlund A , Novak GP , Paraskevas GP , Perera G , Peters O , RamakersIHGB , Rami L , Rodríguez-Rodríguez E , Roe CM , Rot U , Rüther E , Santana I , Schröder J , Seo SW , Soininen H , Spiru L , Stomrud E , Struyfs H , Teunissen CE , Vos SJB , van Waalwijk vanDoorn LJC , Waldemar G , Wallin ÅK , Wiltfang J , Zetterberg H ((2018) ) Association of cerebral amyloid-β aggregation withcognitive functioning in persons without dementia. JAMAPsychiatry 75: , 84–95. |
[23] | Ciarmiello A , Tartaglione A , Giovannini E , Riondato M , Giovacchini G , Ferrando O , De Biasi M , Passera C , Carabelli E , Mannironi A , Foppiano F , Alfano B , Mansi L ((2019) ) Amyloid burden identifies neuropsychological phenotypes at increased risk of progression to Alzheimer’s disease in mild cognitive impairment patients. Eur J Nucl Med Mol Imaging 46: , 288–296. |
[24] | Sperling RA , Mormino EC , Schultz AP , Betensky RA , Papp KV , Amariglio RE , Hanseeuw BJ , Buckley R , Chhatwal J , Hedden T , Marshall GA , Quiroz YT , Donovan NJ , Jackson J , Gatchel JR , Rabin JS , Jacobs H , Yang HS , Properzi M , Kirn DR , Rentz DM , Johnson KA ((2019) ) The impact of amyloid-beta and tau on prospective cognitive decline in older individuals. Ann Neurol 85: , 181–193. |
[25] | Squarzoni P , Faria DP , Yassuda MS , Porto FHG , Coutinho AM , Costa NAD , Nitrini R , Forlenza OV , Duran FLS , Brucki SMD , Buchpiguel CA , Busatto GF ((2020) ) Relationship between PET-Assessed amyloid burden and visual and verbal episodic memory performance in elderly subjects. Dis 78: , 229–244. |
[26] | Jack CR , Lowe VJ , Senjem ML , Weigand SD , Kemp BJ , Shiung MM , Knopman DS , Boeve BF , Klunk WE , Mathis CA , Petersen RC ((2008) ) 11C PiB and structural MRI provide complementary information in imaging of Alzheimer’s disease and amnestic mild cognitive impairment. Brain 131: , 665–680. |
[27] | Storandt M , Mintun MA , Head D , Morris JC ((2009) ) Cognitive decline and brain volume loss as signatures of cerebral amyloid-beta peptide deposition identified with Pittsburgh compound B: Cognitive decline associated with Abeta deposition. Arch Neurol 66: , 1476–1481. |
[28] | Rowe CC , Ellis KA , Rimajova M , Bourgeat P , Pike KE , Jones G , Fripp J , Tochon-Danguy H , Morandeau L , O’Keefe G , Price R , Raniga P , Robins P , Acosta O , Lenzo N , Szoeke C , Salvado O , Head R , Martins R , Masters CL , Ames D , Villemagne VL ((2010) ) Amyloid imaging results from the Australian Imaging, Biomarkers and Lifestyle (AIBL) study of aging. Neurobiol Aging 31: , 1275–1283. |
[29] | Rountree SD , Waring SC , Chan WC , Lupo PJ , Darby EJ , Doody RS ((2007) ) Importance of subtle amnestic and nonamnestic deficits in mild cognitive impairment: Prognosis and conversion to dementia. Dement Geriat Cogn Disord 24: , 476–482. |
[30] | Tomadesso C , de La Sayette V , de Flores R , Bourgeat P , Villemagne VL , Egret S , Eustache F , Chételat G ((2018) ) Neuropsychology andneuroimaging profiles of amyloid-positive versus amyloid-negativeamnestic mild cognitive impairment patients. }. (Amst) 17: , 269–277. |
[31] | Emmert NA , Reiter KE , Butts A , Janecek JK , Agarwal M , Franczak M , Reuss J , Klein A , Wang Y , Umfleet LG ((2021) ) Hippocampal volumes in amnestic and non-amnestic mild cognitive impairment types using two common methods of MCI classification. J Int Neuropsychol Soc 16: , 1–10. |
[32] | Wolk DA , Dickerson BC ((2011) ) Fractionating verbal episodic memory in Alzheimer’s disease. NeuroImage 54: , 1530–1539. |
[33] | Albert MS ((2011) ) Changes in cognition. Neurobiol Aging 3: (Suppl 1), S58–S63. |
[34] | Putcha D , Brickhouse M , Wolk DA , Dickerson BC ; Alzheimer’s Disease Neuroimaging Initiative ((2019) ) Fractionating the Rey Auditory Verbal Learning Test: Distinct roles of large-scale cortical networks in prodromal Alzheimer’s disease. Neuropsychologia 129: , 83–92. |
[35] | Wong CG , Jeffers SL , Bell SA , Caldwell JZK , Banks SJ , Miller JB ((2021) ) Story memory impairment rates and association with hippocampal volumes in a memory clinic population. J Int Neuropsychol Soc 30: , 1–9. |
[36] | Whitwell JL , Shiung MM , Przybelski SA , Weigand SD , Knopman DS , Boeve B F , Petersen RC , Jack CR Jr ((2008) ) MRI patterns of atrophy associated with progression to AD in amnestic mild cognitive impairment. Neurology 70: , 512–520. |
[37] | Jak AJ , Bondi MW , Delano-Wood L , Wierenga CE , Corey-Bloom J , Salmon DP , Delis D ((2009) ) Quantification of five neuropsychological approaches to defining mild cognitive impairment. Am J Geriatr Psychiatry 17: , 368–375. |
[38] | Liu Y , Paajanen T , Zhang Y , Westman E , Wahlund LO , Simmons A , Tunnard C , Sobow T , Mecocci P , Tsolaki M , Vellas B , Muehlboeck S , Evans A , Spenger C , Lovestone S , Soininen H , AddNeuroMed Consortium ((2010) ) Analysis of regional MRI volumes and thicknesses as predictors of conversion from mild cognitive impairment to Alzheimer’s disease. Neurobiol Aging 31: , 1375–1385. |
[39] | Zhang H , Sachdev PS , Wen W , Kochan NA , Crawford JD , Brodaty H , Trollor J N ((2012) ) Gray matter atrophy patterns of mild cognitive impairment subtypes. J Neurol Sci 315: , 26–32. |
[40] | Csukly G , Sirály E , Fodor Z , Horváth A , Salacz P , Hidasi Z , Szabo Á ((2016) ) The differentiation of amnestic type MCI from thenon-amnestic types by structural MRI.. Front Aging Neurosci 8: , 1–10. |
[41] | O’Brien JL , O’Keefe KM , LaViolette PS , DeLuca AN , Blacker D , Dickerson BC , Sperling RA ((2010) ) Longitudinal fMRI in elderly reveals loss of hippocampal activation with clinical decline. Neurology 74: , 1969–1976. |
[42] | Putcha D , Brickhouse M , O’Keefe K , Sullivan C , Rentz D , Marshall G , Dickerson B , Sperling R ((2011) ) Hippocampal hyperactivation associated with cortical thinning in alzheimer’s disease signature regions in non-demented elderly adults. J Neurosci 31: , 17680–17688. |
[43] | Huijbers W , Mormino EC , Schultz AP , Wigman S , Ward AM , Larvie M , Amariglio RE , Marshall GA , Rentz DM , Johnson KA , Sperling RA ((2015) ) Amyloid-β deposition in mild cognitive impairment is associated with increased hippocampal activity, atrophy and clinical progression. Brain 138: , 1023–1035. |
[44] | Shu H , Chen G , Ward BD , Chen G , Wang Z , Liu D , Su F , Gu L , Xu Z , Li SJ , Zhang Z ; Alzheimer’s Disease Neuroimaging Initiative ((2022) ) Imminent cognitive decline in normal elderly individuals is associated with hippocampal hyperconnectivity in the variant neural correlates of episodic memory. Eur Arch Psychiatry Clin Neurosci 272: , 783–792. |
[45] | Machulda MM , Ward HA , Borowski B , Gunter JL , Cha RH , O’Brien PC , Petersen RC , Boeve BF , Knopman D , Tang-Wai DF , Ivnik RJ , Smith GE , Tangalos EG , Jack CR Jr ((2003) ) Comparison of memory fMRI response among normal, MCI, and Alzheimer’s patients. Neurology 61: , 500–506. |
[46] | Petrella JR , Krishnan S , Slavin MJ , Tran TT , Murty L , Doraiswamy PM ((2006) ) Mild cognitive impairment: Evaluation with 4-T functional MR imaging. Radiology 240: , 177–186. |
[47] | Trivedi MA , Murphy CM , Goetz C , Shah RC , Gabrieli JDE , Whitfield-Gabrieli S , Turner DA , Stebbins GT ((2008) ) fMRI activation changes during successful episodic memory encoding and recognition in amnestic mild cognitive impairment relative to cognitively healthy older adults. Dement Geriatr Cogn Disord 26: , 123–137. |
[48] | Hanseeuw B , Dricot L , Kavec M , Grandin C , Seron X , Ivanoiu A ((2011) ) Associative encoding deficits in amnestic mild cognitive impairment: A volumetric and functional MRI study. Neuroimage 56: , 1743–1748. |
[49] | Engels MM , Hillebrand A , van der Flier WM , Stam CJ , Scheltens P , van Straaten EC ((2016) ) Slowing of hippocampal activity correlates with cognitive decline in early onset Alzheimer’s disease. An MEG study with virtual electrodes. Front Hum Neurosci 10: , 238. |
[50] | Langella S , Mucha PJ , Giovanello KS , Dayan E , for the Alzheimer’s Disease Neuroimaging Initiative ((2021) ) The association between hippocampal volume and memory in pathological aging is mediated by functional redundancy. Neurobiol Aging 108: , 179–188. |
[51] | Petersen RC ((2004) ) Mild cognitive impairment as a diagnostic entity. J Intern Med 256: , 183–194. |
[52] | Petersen RC , Morris JC ((2005) ) Mild cognitive impairment as a clinical entity and treatment target. Arch Neurol 62: , 1160–1163. |
[53] | Brucki SM , Nitrini R , Caramelli P , Bertolucci PH , Okamoto IH ((2003) ) Suggestions for utilization of the mini-mental state examination in Brazil. Arq Neuropsiquiatr 61: , 777–781. |
[54] | Yesavage JA , Brink TL , Rose TL , Lum O , Huang V , Adey M , Leirer VO , (1982–1983) Development and validation of a geriatric depression screening scale: A preliminary report. J Psychiatr Res 17: , 37–49. |
[55] | Cummings J , Mega M , Gray K , Rosenberg-Thompson S , Carusi DA , Gornbein J ((1994) ) The Neuropsychiatric Inventory: Comprehensive assessment of psychopathology in dementia. Neurology 44: , 2308–2314. |
[56] | Wechsler D (1997)Wechsler Adult Intelligence Scale, Technical Manual, 3rd Edition, Psychological Corporation, San Antonio.. |
[57] | Nascimento E (2004) ê, Adaptação e padronização de uma amostra brasileira. Casa do Psicólogo, São Pauloncia Wechsler para Adultos: Manual David Wechsler. |
[58] | Wechsler D (1987) WMS-R Wechsler Memory Scale- Revised: Manual, Psychological Corporation. Harcourt Brace Jovanovich, San Antonio. |
[59] | Rey A (1958) L’Examen Clinique en Psychologie, Press Universitaire de France, Paris. |
[60] | Strauss E , Sherman EMS , Spreen O (2006) A compendium of neuropsychological tests: Administration, norms, and commentary, 3rd Edition, Oxford University Press, Oxford. |
[61] | Kaplan EF , Goodglass H , Weintraub S (1983) The Boston Naming Test, Lea & Fibiger, Philadelphia. |
[62] | Mansur LL , Radanovic M , Araújo GC , Taquemori LY , Greco LV ((2006) ) Teste de nomeação de Boston: Desempenho de umapopulação de São Paulo. Pro Fono 18: , 13–20. |
[63] | Miotto EC , Sato J , Lucia MCS , Camargo CHP , Scaff M ((2010) ) Development of an adapted version of the Boston Naming Test for Portuguese speakers. Braz J Psychiatry 32: , 279–282. |
[64] | Faria DP , Duran FL , Squarzoni P , Coutinho AM , Garcez AT , Santos PP , Brucki SM , de Oliveira MO , Trés ES , Forlenza OV , Nitrini R , Buchpiguel CA , Busatto Filho G ((2019) ) Topography of 11C-Pittsburghcompound B uptake in Alzheimer’s disease: A voxel-basedinvestigation of cortical and white matter regions. Braz JPsychiatry 41: , 101–111. |
[65] | Coutinho AM , Busatto GF , de Gobbi Porto FH , de Paula Faria D , Ono CR , Garcez AT , Squarzoni P , de Souza Duran FL , de Oliveira MO , Tres ES , Brucki SMD , Forlenza OV , Nitrini R , Buchpiguel CA ((2020) ) BrainPET amyloid and neurodegeneration biomarkersin the context of the 2018 NIA-AA research framework: An individualapproach exploring clinical-biomarker mismatches andsociodemographic parameters.. Eur J Nucl Med Mol Imaging 47: , 2666–2680. |
[66] | John JP , Lukose A , Bagepally BS , Halahalli HN , Moily NS , Vijayakumari AA , Jain S ((2015) ) A systematic examination of brain volumetric abnormalities in recent-onset schizophrenia using voxel-based, surface-based and region-of-interest-based morphometric analyses. J Negat Results Biomed 14: , 11. |
[67] | Kijonka M , Borys D , Psiuk-Maksymowicz K , Gorczewski K , Wojcieszek P , Kossowski B , Marchewka A , Swierniak A , Sokol M , Bobek-Billewicz B ((2020) ) Whole brain and cranial size adjustments in volumetric brain analyses of sex- and age-related trends. Front Neurosci 14: , 278. |
[68] | Cieri F , Zhuang X , Cordes D , Kaplan N , Cummings J , Caldwell J ((2022) ) Relationship of sex differences in cortical thickness and memory among cognitively healthy subjects and individuals with mild cognitive impairment and Alzheimer disease. Alzheimers Res Ther 14: , 1–12. |
[69] | Bergstra J , Bengio Y ((2012) ) Random search for hyper-parameter optimization. J Mach Learn Res 13: , 281–305. |
[70] | Dadi K , Rahim M , Abraham A , Chyzhyk D , Milham M , Thirion B , Varoquaux G ; Alzheimer’s Disease Neuroimaging Initiative ((2019) ) Benchmarking functional connectome-based predictive models for resting-state fMRI. Neuroimage 192: , 115–134. |
[71] | Alves L , Cardoso S , Silva D , Mendes T , Marôco J , Nogueira J , Lima M , Tábuas-Pereira M , Baldeiras I , Santana I , deMendonca A , Guerreiro M ((2021) ) Neuropsychological profile ofamyloid-positive versus amyloid-negative amnestic mild cognitiveimpairment. J Neuropsychol 15: , 41–52. |
[72] | Bruno D , Mueller K D , Betthauser T , Chin N , Engelman CD , Christian B , Koscik RL , Johnson SC ((2021) ) Serial position effects in the Logical Memory Test: Loss of primacy predicts amyloid positivity. J Neuropsychol 15: , 448–461. |
[73] | Jack CR Jr , Knopman DS , Jagust WJ , Shaw LM , Aisen PS , Weiner MW , Petersen RC , Trojanowski JQ ((2010) ) Hypothetical model of dynamic biomarkers of the Alzheimer’s pathological cascade. Lancet Neurol 9: , 119–128. |
[74] | Aizenstein HJ , Klunk WE ((2015) ) Where is hippocampal activity in the cascade of Alzheimer’s disease biomarkers? . Brain 138: , 831–833. |
[75] | Sperling RA , Bates JF , Cocchiarella AJ , Schacter DL , Rosen BR , Albert MS ((2001) ) Encoding novel face-name associations: A functional MRI study. Hum Brain Mapp 14: , 129–139. |


