
DNA Damage Increases Secreted Aβ40 and Aβ42 in Neuronal Progenitor Cells: Relevance to Alzheimer’s Disease
Abstract
Background:
Recent studies suggest a strong association between neuronal DNA damage, elevated levels of amyloid-β (Aβ), and regions of the brain that degenerate in Alzheimer’s disease (AD).
Objective:
To investigate the nature of this association, we tested the hypothesis that extensive DNA damage leads to an increase in Aβ40 and Aβ42 generation.
Methods:
We utilized an immortalized human neuronal progenitor cell line (NPCs), ReN VM GA2. NPCs or 20 day differentiated neurons were treated with hydrogen peroxide or etoposide and allowed to recover for designated times. Sandwich ELISA was used to assess secreted Aβ40 and Aβ42. Western blotting, immunostaining, and neutral comet assay were used to evaluate the DNA damage response and processes indicative of AD pathology.
Results:
We determined that global hydrogen peroxide damage results in increased cellular Aβ40 and Aβ42 secretion 24 h after treatment in ReN GA2 NPCs. Similarly, DNA double strand break (DSB)-specific etoposide damage leads to increased Aβ40 and Aβ42 secretion 2 h and 4 h after treatment in ReN GA2 NPCs. In contrast, etoposide damage does not increase Aβ40 and Aβ42 secretion in post-mitotic ReN GA2 neurons.
Conclusion:
These findings provide evidence that in our model, DNA damage is associated with an increase in Aβ secretion in neuronal progenitors, which may contribute to the early stages of neuronal pathology in AD.
INTRODUCTION
Alzheimer’s disease (AD) is the most common form of dementia, representing roughly 50 million annual worldwide cases [1]. Numerous studies have focused on characteristic pathological changes in AD patient brains and mouse models, including intracellular amyloid-β (Aβ) monomers and oligomers and extracellular Aβ plaques; intracellular tau aggregation and neurofibrillary tangles; evidence of oxidative stress and inflammation reflective of mitochondrial dysfunction; synaptic dysfunction; and neuronal loss [2–7]. These studies reflect a progressive neurodegenerative disease that originates 10–20 years prior to diagnosis (reviewed in [8]). Although numerous treatments have been proposed, including monoclonal antibodies specific for Aβ and tau, all have failed to show significant efficacy in clinical trials, with no evidence to date that synaptic and neuronal loss in the hippocampus and cerebral cortex in later stages of AD is preventable [9–13]. Thus, there is a critical need to improve our understanding of the early mechanisms at play in AD.
One such mechanism may relate to DNA damage, a common consequence of oxidative stress. Oxidative stress is defined as an imbalance between pro-oxidant and anti-oxidant levels in favor of pro-oxidants, and it is a global cellular event (reviewed in [14]). A major source of reactive oxygen species (ROS) and oxidative damage in the brain is oxidative phosphorylation occurring in the mitochondria due to the massive ATP requirements of neurons and their synaptic activity [15]. ROS can result in damage to numerous cellular elements such as synapses, mitochondria, plasma membranes, and the cytoskeleton, as well as DNA [16–18]. Numerous studies have found a regional association in the brain between increased levels of oxidative damage and high levels of Aβ in late stage AD [19–22].
Oxidative damage can lead to DNA double strand breaks (DSBs), the most deleterious of DNA lesions. Stability of the genome is essential to ensure faithful DNA replication and cell survival. Inefficient and unfaithful DNA repair can lead to cell cycle arrest, accumulation of detrimental mutations, innate immune system activation, and cell death (reviewed in [23]). Efficient DSB repair is especially important in neuronal progenitors which differentiate into post-mitotic neurons with the proper signals and growth factors (reviewed in [24]). Recent studies have shown the accumulation of DNA DSBs in astrocytes and neurons in AD patient hippocampi and in 5xFAD mice [25]. Given the association between oxidative DNA damage and high levels of Aβ, this damage may be driving the Aβ increase, or Aβ may be causing the damage or preventing its repair. In fact, treatment of primary rodent neuronal cultures with Aβ42 has also been shown to significantly increase DNA DSBs and downregulate associated DNA DSB repair proteins [25, 26]. Numerous other studies have shown deficits in the DNA damage response (DDR) associated with AD pathology in postmortem human brain samples and animal studies, including reduced homologous recombination (HR)-associated BRCA1 protein in the hippocampus of AD patient samples, reduced early DDR response protein ATM in AD mouse models, and reduced TC-HR associated RAD52 protein and recruitment in primary rat cortical cultures [26–28]. We and others have hypothesized that these deficits might lead to the accumulation of Aβ [26].
There is a significant dearth of knowledge on how AD initially develops, especially regarding neural stem cells and neuronal precursors/progenitors. In the adult mammalian brain, neural stem cells are found in distinct neurogenic niches: the subventricular zone (SVZ) of the lateral ventricles, the subgranular zone (SGZ) of the dentate gyrus (DG) in the hippocampus, and, as has been more recently suggested, the striatum [29–32]. These stem cells are capable of proliferation, self-renewal, and generation of post-mitotic neurons, astrocytes, and oligodendrocytes [33]. Whether neuronal progenitor cells (NPCs) are present in significant quantities in the adult human brain is still highly controversial; however, there are studies supporting the significant effect of Aβ on neural stem cells and NPCs. A key study has shown increased neurogenesis in the SGZ and grandular zone (GZ) of the hippocampus in postmortem brains of AD patients [34]. Another study demonstrated increased neurogenesis of post-mitotic neurons from cultured neural stem cells derived from the murine hippocampus and striatum after treatment with increasing concentrations of Aβ [35]. The rate of proliferating neural stem cells is unchanged after Aβ treatment, indicating that the effect of Aβ is on neurogenic precursors rather than neural stem cells, forcing them to differentiate rather than proliferate, increasing the total number of post-mitotic neurons. One relevant study has also shown decreased proliferating NPCs and neural stem cells in the hippocampus and SVZ in a 2-month-old transgenic AD mouse model [36]. Collectively, these studies demonstrate the importance of investigating neural stem cells and NPCs in the early stages of AD pathology before the onset of clinical symptoms. Therefore, for our studies we utilized the ReN GA2 immortalized human neuronal progenitor cell line which stably expresses a GFP reporter and contains familial AD-related genes encoding human amyloid-β precursor protein (AβPP) with both the K670N/M671L (Swedish) and V717L (London) mutations. These mutations lead to overexpression of AβPP and altered subcellular localization of AβPP and an overall increase in Aβ generation [37]. The ReN GA2 cell line has been extensively researched and profiled as a cell culture system for studying neuronal progenitors, differentiating neurons, and post-mitotic neurons [38]. These cells are useful in establishing a detectable Aβ baseline.
Aβ is a 38–43 amino acid long peptide that is produced from the cleavage of AβPP. When sequentially cleaved by β-secretase (BACE1) and γ-secretase, Aβ40 and Aβ42 monomers are secreted into the extracellular matrix. Previous reports have shown that oxidative stress enhances the activity of BACE1, and that γ-secretase mediates this oxidative stress-induced activity, resulting in increased Aβ secretion [39, 40]. Other studies have shown that increases in oxidative stress precede Aβ deposition in AD brains and in cell culture, reflected in increased levels of modified nucleoside 8-hydroxyguanosine (8-OHG) [7] or in lipid peroxidation resulting from AβPP-dependent copper reduction [41]. Although these studies suggest a causal association between neuronal oxidative DNA damage and the accumulation of Aβ, a direct link has not been established experimentally. To test the hypothesis that DNA damage directly induces Aβ secretion, here we determined the effect of global oxidative damage and specific DSB DNA damage on Aβ generation in the ReN GA2 cell line, an immortalized human NPC line that can be differentiated into neurons. We sought to determine whether mitotic cells and post-mitotic neurons are differentially affected by DNA damage, with a consequent effect on Aβ generation. We determined that global peroxide damage following treatment with hydrogen peroxide leads to increased Aβ40 and Aβ42 secretion 24 h after treatment in ReN GA2 NPCs. Pre-treatment with the anti-oxidant α-tocopherol rescues the effect on Aβ generation. Using the topoisomerase II inhibitor etoposide to induce specific DNA damage, we then investigated whether DSBs contribute to this increase in Aβ secretion, leading to our finding that etoposide damage induced a significant increase in Aβ40 and Aβ42 secretion in ReN GA2 NPCs 2 h and 4 h after treatment, but not in post-mitotic neurons. These results support a direct causal relationship between DNA DSBs, which can arise with oxidative stress from endogenous and exogenous sources, and the consequent production of toxic Aβ species that accumulate and contribute to the development of AD pathology.
MATERIALS AND METHODS
Cell culture and neuronal differentiation
The human ReN VM GA2 immortalized neuronal progenitor cell line was a kind gift of R.E. Tanzi (Harvard University, Cambridge, MA). ReN VM GA2 stably expresses a GFP reporter and contains Familial AD-related genes encoding human AβPP with both the K670N/M671L (Swedish) and V717L (London) mutations. These mutations lead to overexpression of AβPP, altered subcellular localization of AβPP, and increased Aβ42 generation, and were generated as previously described [37]. We used these cells to provide a basal level of Aβ detectable by ELISA; this would not have been possible without these ReN GA2 cells. NPCs were cultured in 2D Matrigel coated T75 flasks or 6-well plates (Fisher Scientific, 354230) in proliferation media: Dulbecco’s Modified Eagle Medium/Nutrient Mixture F-12 (Thermo Fisher, 10565042) supplemented with heparin (Sigma-Aldrich, H3393), B-27 (Gibco, 17504044), human fibroblast growth factor basic protein (bFGF) (Fisher Scientific, GF003AF100UG), and human recombinant epidermal growth factor protein (hEGF) (Millipore Sigma, GF144) at 37°C, 5% CO2, and 5% O2. For differentiation into neurons, NPCs were passaged at 500,000 cells/well in 2D Matrigel coated 6-well plates or 3.5 cm dishes in proliferation media for 24 h at 37°C, 5% CO2, and 5% O2. Proliferation media was then exchanged for Dulbecco’s Modified Eagle Medium/Nutrient Mixture F-12 and B-27 with ½ media changes every 3 days for 20 days.
DNA damage assays
Ren GA2 NPCs were passaged at 500,000–700,000 cells/mL on 2D Matrigel coated 6-well plates or 3.5 cm dishes and allowed to grow for 48 h at 37°C, 5% CO2, and 5% O2. (Neurons were differentiated as outlined above.) For peroxide experiments, cells were treated with or without α-tocopherol, an oxygen radical scavenger. Where the scavenger was used, cells were pre-treated with 5μM α-tocopherol (Sigma-Aldrich, T3251), or 0.5% DMSO control. 5μM α-tocopherol was then maintained throughout peroxide damage treatment and recovery time courses. Cells were then treated with 2.5μM peroxide for 0.5 h, washed with 1 X PBS, the media was replaced, and the cells were allowed to recover for noted time courses at 37°C, 5% CO2, and 5% O2. 5μM α-tocopherol was maintained throughout recovery time courses. For etoposide treatments, cells were treated with 0.5μM, 1.0μM, 5.0μM, 10μM, and 20μM etoposide or DMSO control (0.02% DMSO for etoposide treatment alone) for 6 h at 37°C. Cells were then washed with 1 X PBS, the media was replaced, and the cells were allowed to recover for noted time courses at 37°C, 5% CO2, and 5% O2. Both α-tocopherol and etoposide were re-suspended in 100% DMSO prior to dilutions.
Immunostaining
ReN GA2 NPCs or neurons were grown on 2D Matrigel coated 12 mm diameter coverslips in 6-well plates or 3.5 cm dishes for immunostaining. For endogenous GFAP, MAP2, Tuj1, and Ki67 staining, coverslips were washed with 1 X PBS and fixed with 4% paraformaldehyde with 4% sucrose for 15 min at room temperature. The fixed cells were rinsed three times with 1 X PBS, permeabilized with 0.2% Triton for 10 min at room temperature, then rinsed three times with 1 X PBS. Cells were blocked with 10% goat serum in 1 X PBS for 1 h at room temperature. For primary antibody staining, coverslips were incubated with primary antibody in 10% goat serum overnight at 4°C in a humidity chamber. Coverslips were then washed three times with 1 X PBS and incubated with 1:1000 DAPI and secondary antibody Alexa Fluor 694/555 goat anti-mouse -rabbit immunoglobulin G conjugate (Invitrogen) in 10% goat serum for 1 h at room temperature. Coverslips were washed three times with 1 X PBS, once with Millipore water, then mounted with ProLong Diamond Antifade Mountant (Fisher Scientific, P36961) onto microscope slides. Primary antibodies used were anti-GFAP (1:1000, Fisher Scientific, 01-670-261), anti-MAP2 (1:1000, Millipore, MAB378), anti-Tuj1 (1:1000, Abcam, ab18207), and anti-Ki67 (1:1000, Fisher Scientific, PA5-19462). Fluorescence images were captured with a Nikon Eclipse Ti2 confocal laser scanning microscope (Nikon Instruments, Inc.).
Neutral comet assay
The neutral comet assay was performed using the Comet Assay Kit (Abcam, ab238544) according to the manufacturer’s protocol. DNA damage resolves as a comet that can be quantified by calculating the “% tail DNA”, or percentage of fragmented DNA in the tail relative to the total amount of DNA [42, 43]. In brief, after treatment, ReN GA2 NPCs or 20-day neurons were trypsinized, centrifuged at 700 g for 2 min, and washed once with ice cold 1 X PBS. After re-centrifugation, the pellet was suspended at 1×10⁵ cells/ml in ice-cold 1 X PBS. Cell samples were mixed with comet agarose in a 1/10 ratio (v/v) and immediately transferred onto the slides previously coated with comet agarose base layer. After incubating with pre-chilled lysis buffer for 2 h at 4°C, then pre-chilled alkaline buffer for 0.5 h at 4°C, the slides were subjected to electrophoresis in TBE Electrophoresis Solution for 40 min at approximately 35 V on ice. After electrophoresis, the slides were incubated with Vista Green DNA dye. Images were obtained with a Nikon Eclipse Ti2 confocal laser scanning microscope (Nikon Instruments, Inc.) using the FITC filter. Approximately 3–6 images (5–20 cells per image) were randomly taken, and the % tail DNA (100 x Tail DNA intensity/Cell DNA intensity) of 30 cells was calculated using the OpenComet plugin of ImageJ analysis software ver. 2.0.0.
Lysate preparation and western blot
ReN GA2 NPCs or 20-day neurons were grown on 2D Matrigel coated 6-well plates or 3.5 cm dishes and treated as described in the DNA damage assays. After treatments and recovery time courses, media was removed and spun at 13000 rpm for 10 min at 4°C to pellet dead cells and debris. Supernatant was then removed. For sAβPPβ detection, 30μL of supernatant with 4% β-meracaptoethanol in 4 X Non-Reducing LDS Sample Buffer (Thermo Scientific, 84788) was used. Cells were washed with pre-warmed 1 X PBS, then detached from the plate using diluted trypsin (0.05%). Cell pellets were spun at 13000 rpm for 10 min at 4°C. Cell lysates were prepared with 100μL of ice cold RIPA lysis buffer per sample (25 mM Tris HCL pH 7.6, 150 mM NaCl, 1% NP-40, 1% sodium deoxycholate, 0.1% SDS) with 1 X protease inhibitor (Sigma-Aldrich, 04693116001) and 25–30 U benzonase (Sigma-Aldrich, 70746-3). Total protein concentrations of the lysates were determined by Bicinchoninic Acid (BCA) assays. Samples were prepared for western blot using a lysate dilution that would yield 25–40μg total protein (NPCs) or 20μg total protein (differentiated cells) with 4% β-meracaptoethanol in 2 X Novex Tris-Glycine SDS Sample Buffer (Life Technologies, LC2676). Samples were heated to 70°C for 10 min while shaking at 800 rpm, then run on 4%–20% Novex Wedge Well Tris-Glycine gels (Thermo Fisher, XP04205BOX) in 1 X Tris/Glycine/SDS running buffer (Thermo Fisher, BP13414) at 80 V for 10 min, then 100 V for 2 h. The protein was transferred to a nitrocellulose membrane using the Invitrogen Power Blotter System (Thermo Fisher, PB0012) and 80% pre-made transfer buffer stock (5.85 g glycine, 11.6 g Tris, 0.375 g SDS, milliQ water to 1 L) with 20% ethanol at a constant 25 V for 45 min. Blots were stained with Ponceau (5% acetic acid, 0.1% Ponceau stain) for 5 min to quantify total protein. Blots were then blocked in TBST with 5% milk, and immunoblotted overnight at 4°C using the following antibodies at a 1:1000 dilution in 5% milk and TBST: anti-γH2AX (Abcam, ab26350), anti-6E10 (Biolegend, 803001), anti-BACE1 (Abcam, ab108394); at 2μg/mL dilution in 5% milk and TBST: anti-sAβPPβ-sw (6A1) (IBL, 10321); and at 1:10000 dilution in 5% milk and TBST: anti-β-Actin (Sigma-Aldrich, A5441), and anti-GAPDH (Sigma-Aldrich, G9545). Blots were washed three times with TBST for 5 min each, then probed with appropriate secondary antibodies (anti-Mouse IgG Horseradish Peroxidase HRP or anti-Rabbit IgG HRP) in a 1:5000 dilution in 5% milk and TBST for 1 h at room temperature. Following secondary antibody probing, blots were rinsed twice, then washed for 10 min in TBST, then rinsed twice and washed for 10 min in TBS. Blots were imaged using ECL substrate or SuperSignal West Femto Maximum Sensitivity Substrate in the Bio-Rad ChemiDoc. Bands were quantified utilizing ImageJ analysis software ver. 2.0.0.
Aβ enzyme-linked immunosorbent assay (ELISA assay)
Secreted Aβ40 and Aβ42 levels were determined by standard sandwich ELISA using end-specific antibodies provided by Janssen Pharmaceutica as previously described [44]. Briefly, media from cultures was centrifuged at 15000 rpm for 10 min at 4°C to pellet dead cells and debris. Supernatant was then removed. 96-well plates were coated with 1.5 ug/mL Aβ40 and Aβ42 monoclonal antibodies (JRFcAb40/28 and JRFcAb42/26), which recognize the C terminus of Aβ species terminating at amino acid 40 or 42, respectively, in coating buffer (10 mM Tris HCl, 10 mM NaCl, 10 mM NaN3) overnight at 4°C. Plates were washed five times with 1 X PBS and 0.05% Tween and blocked with 0.1% casein buffer for 4 h, then washed five times with 1 X PBS and 0.5% Tween. Diluted standards were made with Aβ40 and Aβ42 antibodies (rPeptide, A-1163-1) (rPeptide, A-1153-1) in experimental media. Supernatant samples were diluted accordingly (1:2, 1:3, 1:6, and/or 1:10) in experimental media. Standards and samples were mixed with detection antibody horseradish peroxidase (HRP)-conjugated JRFAbN25 (1:6000 for Aβ40, 1:4000 for Aβ42) and incubated overnight at 4°C. Plates were washed five times with 1 X PBS and 0.5% Tween, then developed with 100 mM NaAc buffer with 3, 3’, 5, 5’-tetramethylbenzidine (TMB) (Sigma-Aldrich, T2885) and 30% peroxide for 5–10 min in the dark. The reaction was stopped with an equal volume of 2N H2SO4, and plates were read at 450 nm using a BioTek Synergy Neo 2 microplate reader. Assays were performed in triplicate with two technical replicates each.
Measurement of cellular apoptosis
Cell death of ReN GA2 NPCs and differentiated neurons was measured using a Click-IT TUNEL Alexa Fluor 647 imaging assay (C10247, Thermo Fisher) following the manufacturer’s instructions. Briefly, cells seeded on coverslips were treated with experimental conditions. Cells were then fixed with 4% paraformaldehyde in 1 X PBS for 15 min and rinsed three times with 1 x PBS. Cells were permeabilized with 0.25% Triton-X 100 in 1 X PBS for 20 min, then rinsed twice with DI. Each coverslip was incubated with 100μL of TdT reaction buffer for 10 min at room temperature, then removed. Cells were incubated in 100μL TdT reaction cocktail for 1 h at 37°C in a humidity chamber. Cells were washed twice in 3% BSA in 1 X PBS for 2 min, then incubated with Click-IT reaction buffer with additive for 30 min in the humidity chamber protected from the light. Cells were rinsed with DI and counterstained with Hoechst 33342, and mounted with ProLong Diamond Antifade Mountant (Fisher Scientific, P36961) onto microscope slides. Fluorescence images were captured with a Nikon Eclipse Ti2 confocal laser scanning microscope (Nikon Instruments, Inc.) at 20 X magnification. Experiments were performed in duplicate with at least 200 cells counted manually per experiment for each condition. ImageJ (2.0.0-rc-69/1.52p) software was used for image analysis.
Statistical analysis
Data are presented as mean±SD. Statistical analysis was performed using GraphPad Prism version 9.0.0. Differences between means were assessed by Students T-test, one-way analysis of variance (ANOVA), or two-way analysis of variance (ANOVA) with Tukey’s multiple comparisons test. All experiments were completed with a minimum of two to three replicates unless indicated in the figure legends. p < 0.05 was considered significant.
RESULTS
Global peroxide damage induces increased Aβ40 and Aβ42 secretion in ReN GA2 NPCs 24 h after treatment
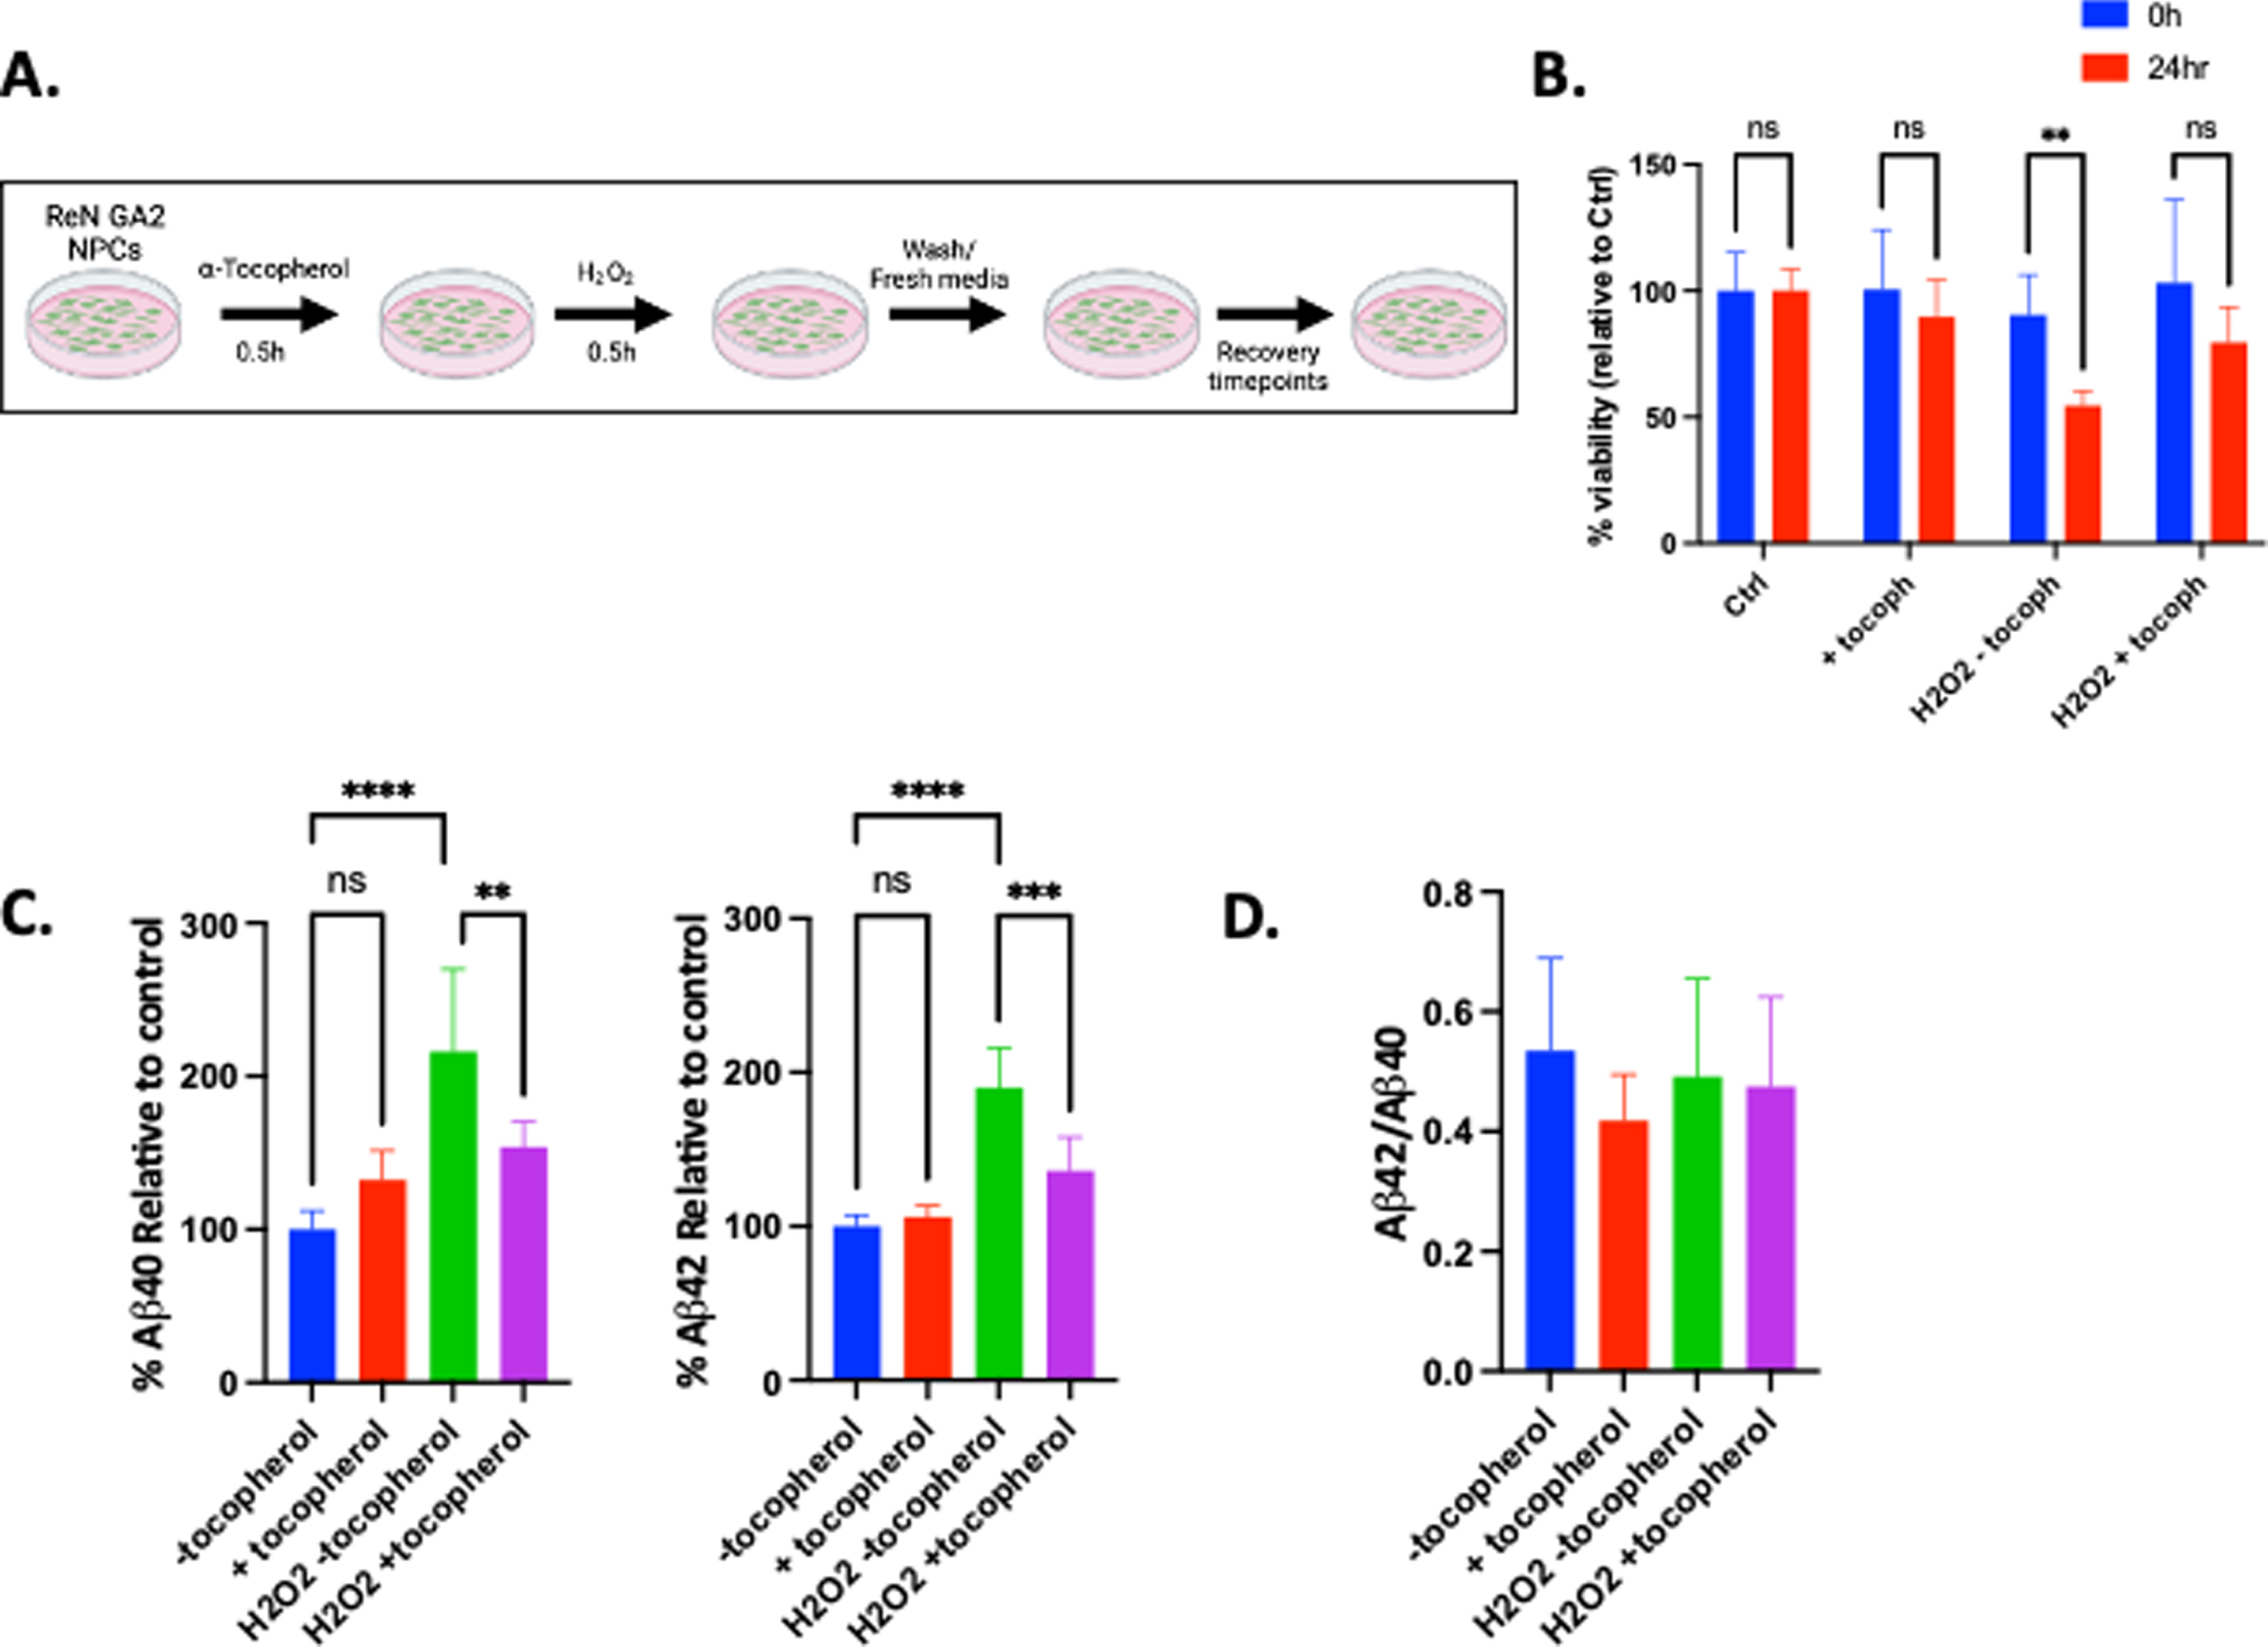
A direct mechanistic link between oxidative damage and the induction of Aβ secretion has yet to be elucidated. Therefore, we sought to investigate whether global peroxide damage induces secretion of Aβ40 and Aβ42 in human NPCs. We pre-treated ReN GA2 NPCs with and without 5μM of the antioxidant α-tocopherol for 0.5 h. α-Tocopherol, the most biologically active form of vitamin E, is a lipid soluble antioxidant that acts as a chain-breaking antioxidant by scavenging lipid peroxyl and alkoxyl radicals [45, 46]. Cells were then treated with and without 2.5μM hydrogen peroxide for 0.5 h. Cells were allowed to recover with and without α-tocopherol for 2 h, 8 h, and 24 h (Fig. 1A). We found that treatment with hydrogen peroxide significantly reduced cell viability 24 h after treatment (Fig. 1B). Secretion of both Aβ40 and Aβ42 significantly increased 24 h following hydrogen peroxide treatment compared to controls. This increase in Aβ40 and Aβ42 secretion was mitigated by α-tocopherol pre-treatment (Fig. 1C). Hydrogen peroxide treatment did not alter the ratio of Aβ42/Aβ40 (Fig. 1D). Together, these results indicate that peroxide damage directly leads to increased Aβ40 and Aβ42 generation in ReN GA2 NPCs, and that anti-oxidant treatment directly prevents the elevation in Aβ generation. (For all timepoints, see Supplementary Figure 1A-C.)
Fig. 1
Hydrogen peroxide damage increases Aβ40 and Aβ42 secretion in ReN GA2 NPCs, an effect that is mitigated by α-tocopherol treatment. A) Schematic of ReN GA2 NPC experimental design. ReN GA2 NPCs were treated with and without 5μM α-tocopherol prior to treatment with and without 2.5μM hydrogen peroxide for 0.5 h and allowed to recover for 24 h. (Schematic created in BioRender, 2021.) B) Cell viability was determined after indicated treatment and 24 h recovery time. C) Percent secreted Aβ40 and Aβ42 relative to controls after designated treatments and 24 h recovery time. D) Aβ42/Aβ40 ratio calculated from raw values. Error bars represent means±SD of three separate experiments, and the p values were determined using 2-way ANOVA and Tukey’s multiple comparisons test. **p < 0.01, ***p < 0.001, ****p < 0.0001.
Etoposide damage induces increased Aβ40 and Aβ42 secretion in ReN GA2 NPCs 2 h and 4 h after treatment
The two major endogenous sources of direct DNA damage in the human brain arise with ROS from metabolic activity and activity-dependent transcription that induces DSBs [15, 47]. Peroxide alone does not damage DNA but can give rise to highly reactive OH- radicals that damage DNA in a process known
as the Haber-Weiss and Fenton reaction [48]. Due to the global and complex nature of peroxide damage, we questioned whether peroxide-induced DSBs could be the contributing factor to increased secretion of Aβ40 and Aβ42 in ReN GA2 NPCs. To determine whether peroxide damage induces DNA DSBs in ReN GA2 NPCs, we performed a neutral comet assay, which can be used to measure single strand breaks (SSBs) and DSBs in single cells (Supplementary Figure 2). In our study, the neutral comet assay indicates that peroxide damage induces significant DNA damage including, SSBs and DSBs, as compared to untreated controls, and that α-tocopherol treatment mitigates this damage (Supplementary Figure 2A).
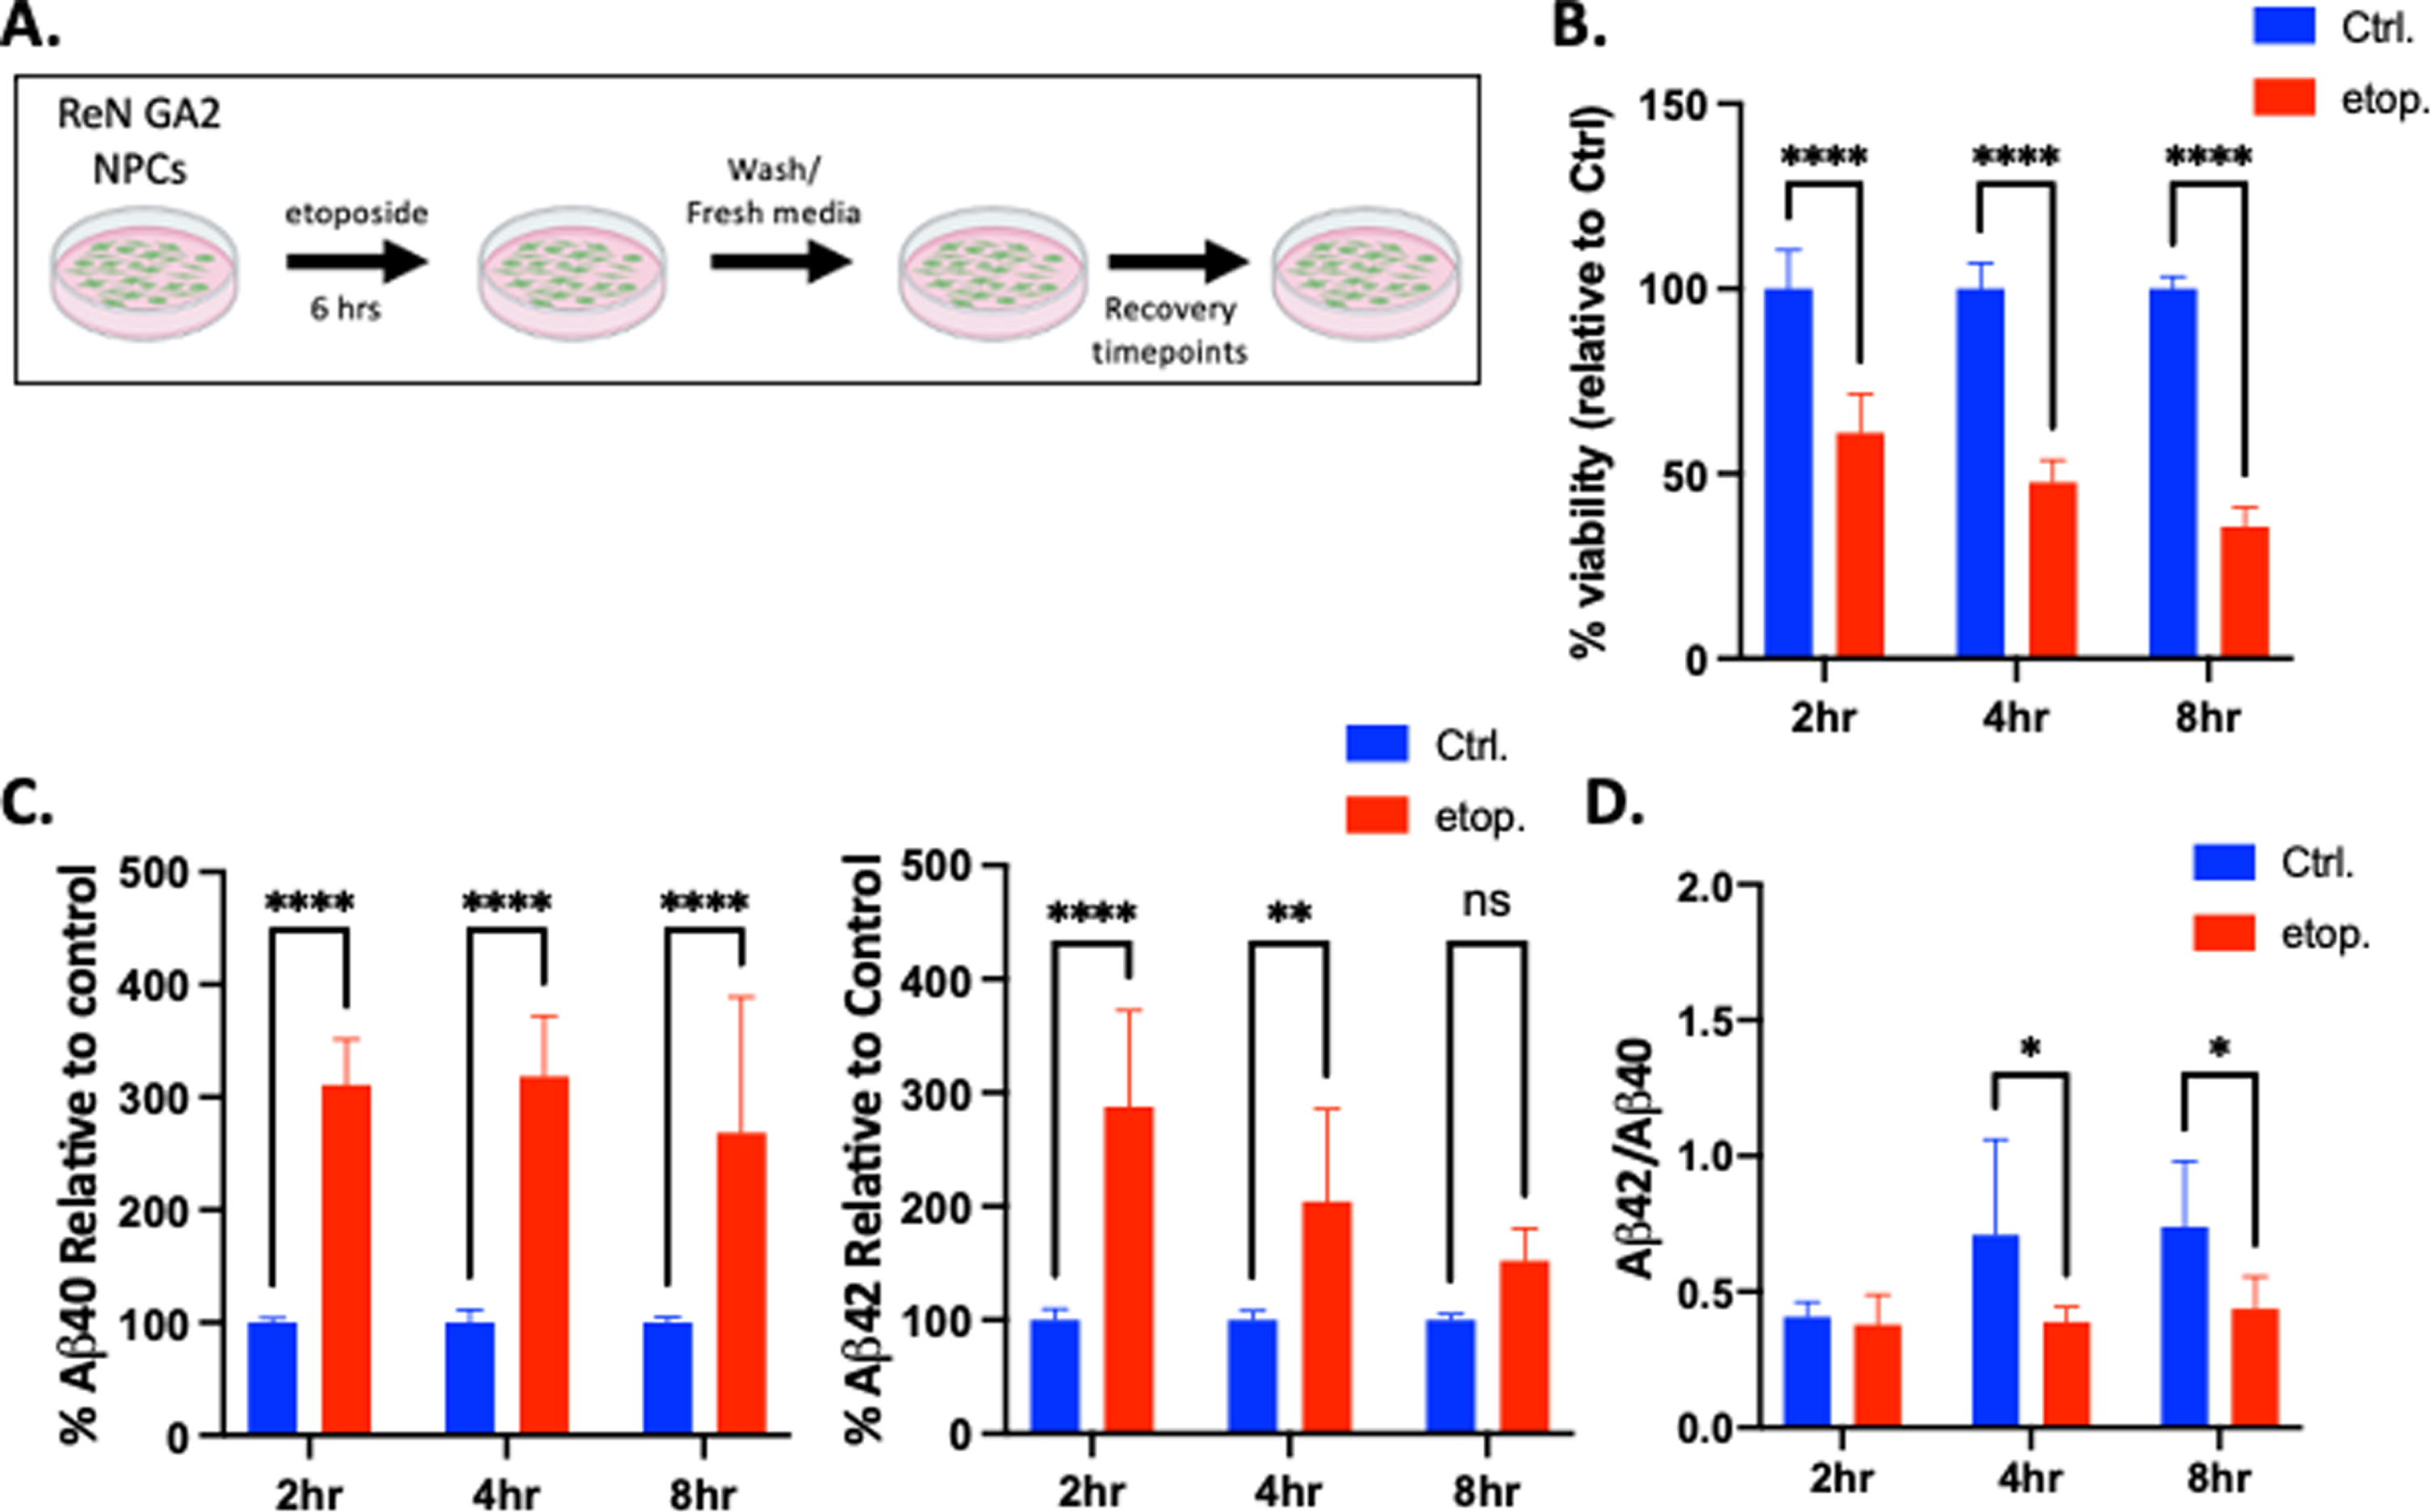
During neuronal development, neuronal activity triggers the activation of numerous transcription factors and early response genes near promoter regions [49]. To prevent topological constraints in these regions, topoisomerase IIβ resolves DNA tangles and supercoils that may occur during DNA transcription and replication by generating transient DSBs, and then re-ligating the broken DNA strands [50]. We incubated ReN GA2 NPCs with etoposide, a topoisomerase II inhibitor, which maintains these induced DSBs by binding DNA at topoisomerase II-DNA cleavage sites and inhibiting the re-ligation process [51]. After a 6 h treatment with 10μM etoposide, ReN GA2 NPCs were allowed to recover for 2 h, 4 h, and 8 h (Fig. 2A). We found that after treatment with etoposide, cell viability was significantly reduced after all recovery times (Fig. 2B). However, a dose response curve showed no significant increase in apoptosis as indicated by TUNEL staining (Supplementary Figure 3B). ReN GA2 NPCs also accumulated significant quantities of DNA DSBs as indicated by the neutral comet assay and increased expression of the DSB-associated histone variant γ-H2AX (Supplementary Figures 2B and 3A). Secretion of Aβ40 significantly increased after 2 h, 4 h, and 8 h of recovery following etoposide treatment, while secretion of Aβ42 increased after 2 h and 4 h of recovery compared to controls (Fig. 2C). In this system, etoposide treatment significantly alters the ratio of Aβ42/Aβ40 only when compared to controls in ReN GA2 NPCs (Fig. 2D).
Fig. 2
Etoposide damage increases Aβ40 and Aβ42 secretion after 2 h and 4 h recovery in ReN GA2 NPCs. A) Treatment schematic for ReN GA2 NPCs treated with and without 10μM etoposide for 6 h and allowed to recover for designated times. (Schematic created in BioRender, 2021.) B) Percent cell viability after 6 h etoposide treatment and designated recovery times. C) Percent secreted Aβ40 and Aβ42 relative to controls after designated treatments and recovery times. D) Aβ42/Aβ40 ratio calculated from raw values. Error bars represent means±SD of three separate experiments, and the p values were determined using 2-way ANOVA and Tukey’s multiple comparisons test. *p < 0.05, **p < 0.01, ****p < 0.0001, ns: not significant.
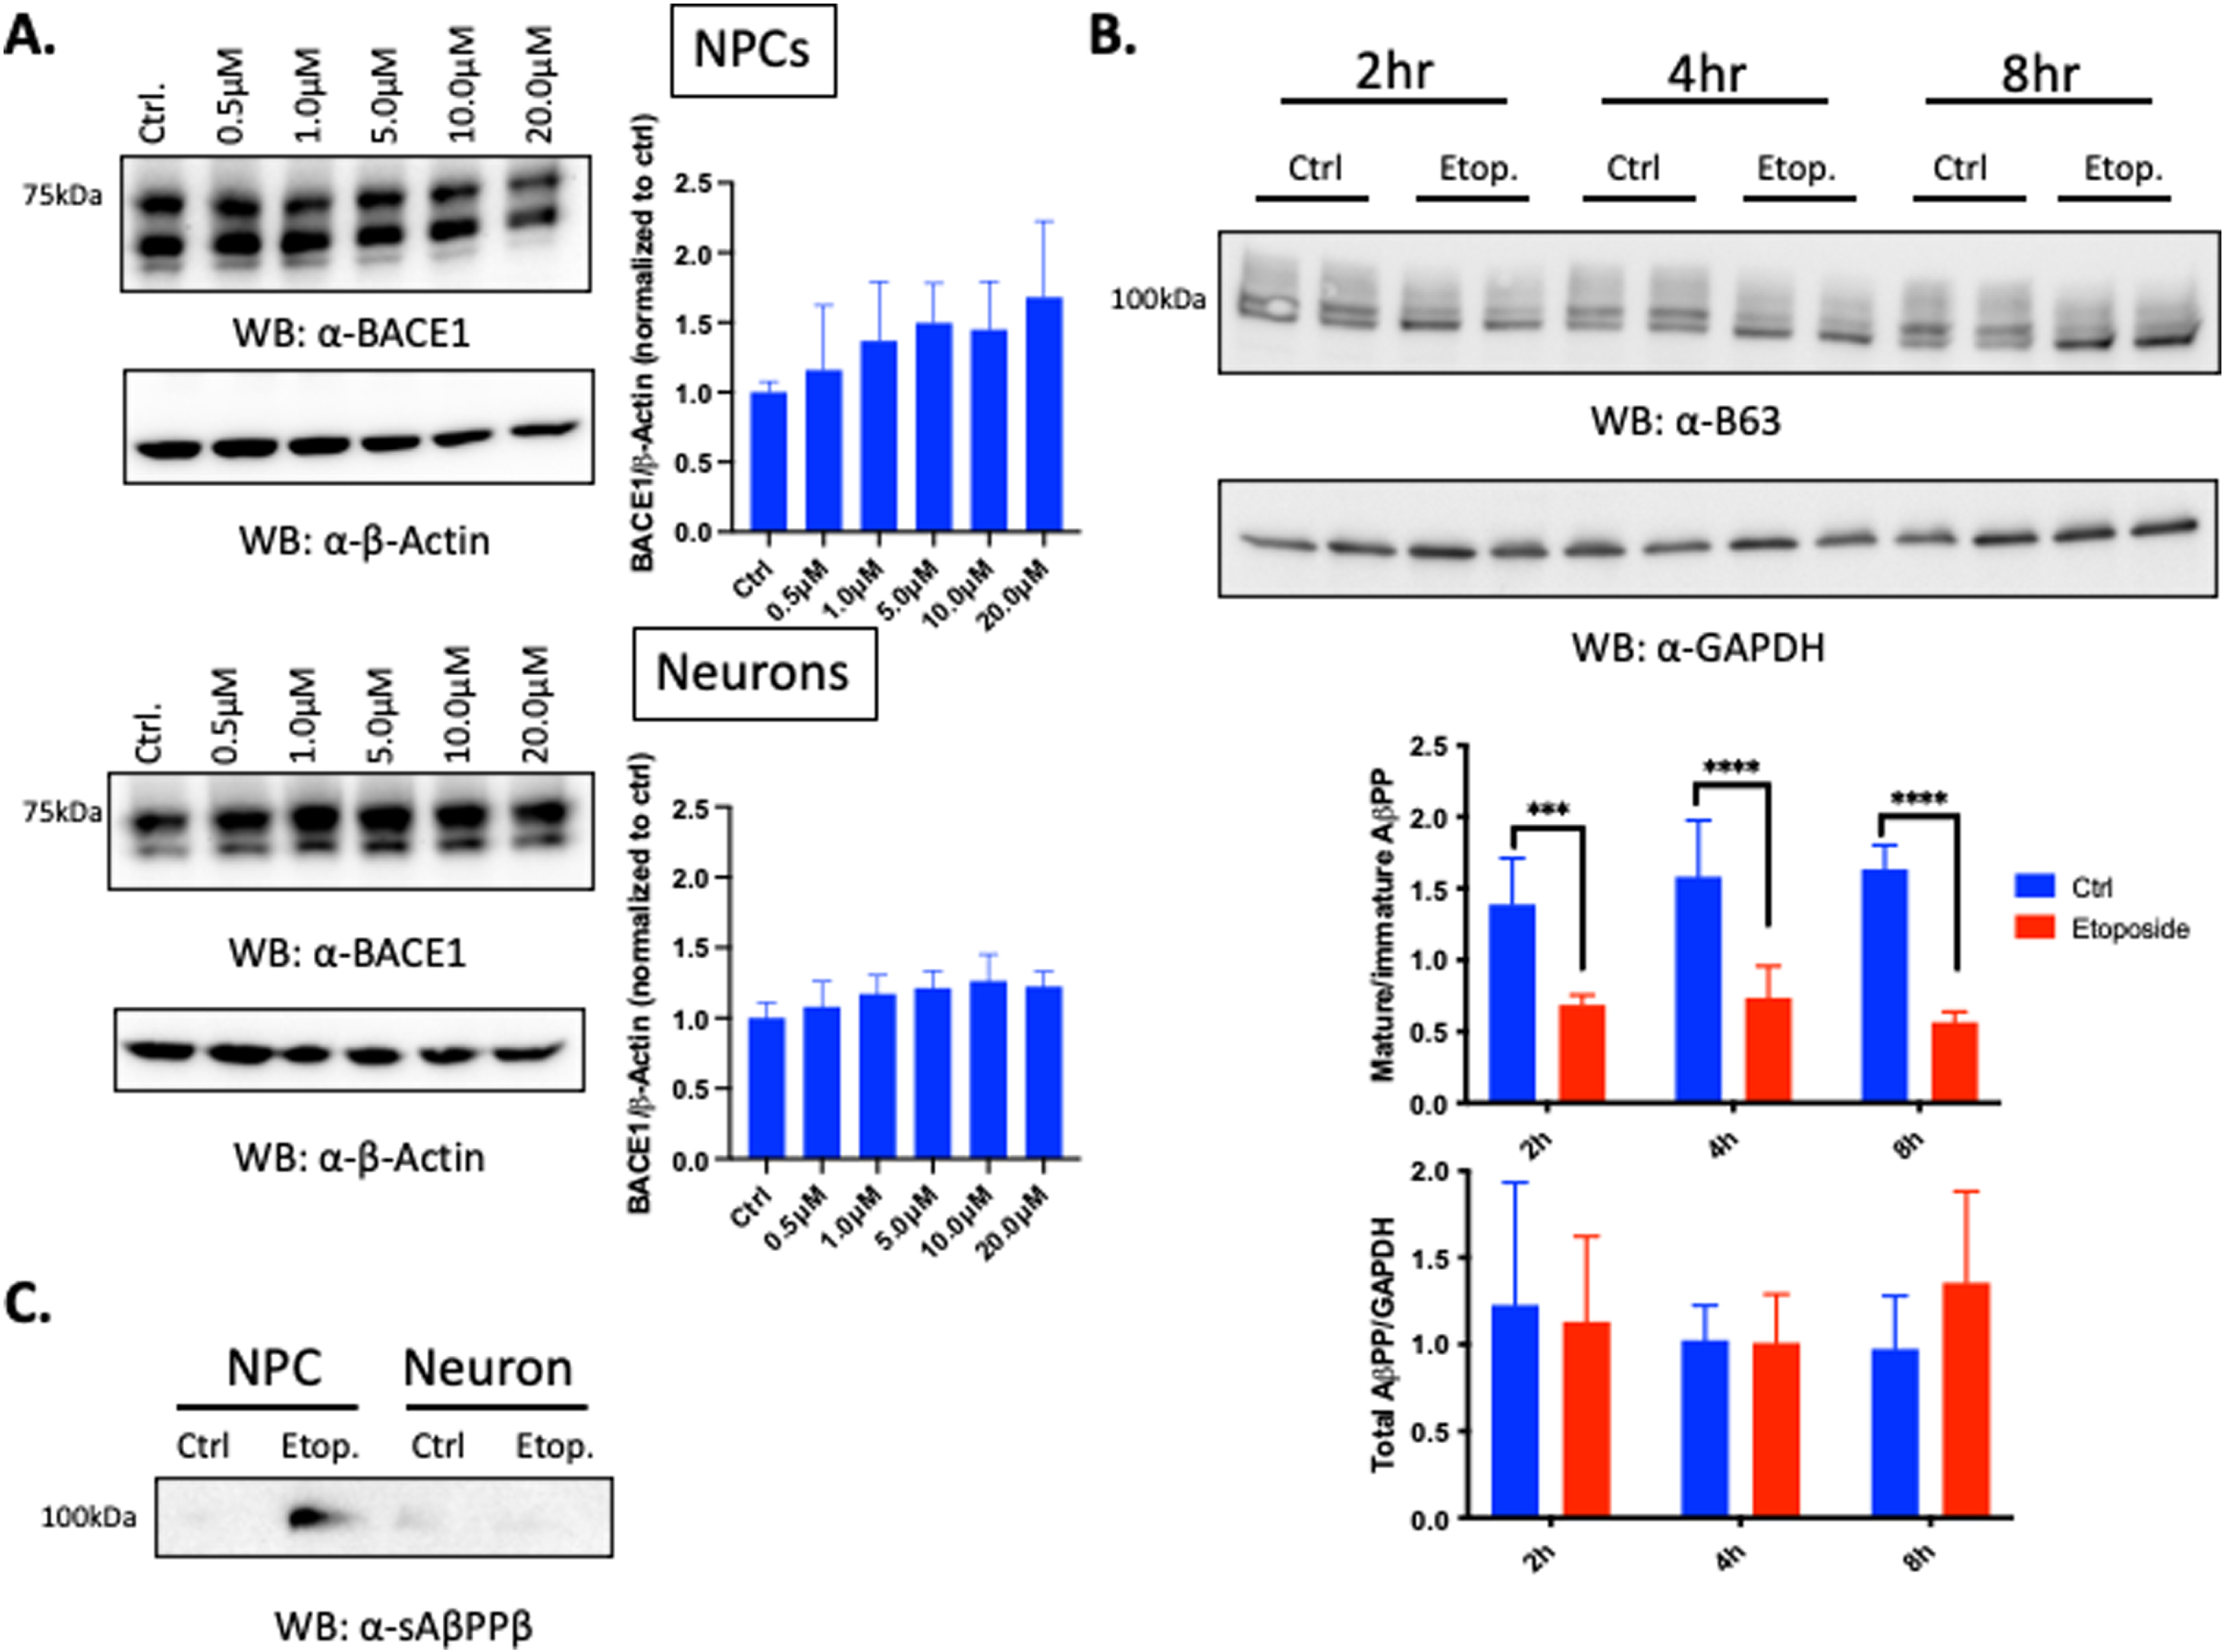
Previous reports in neurons have shown that treatment with hydrogen peroxide or 4-Hydroxenonenal (4-HNE), an aldehydic product of lipid peroxidation, leads to upregulation of the expression of BACE1, the rate limiting enzyme in the amyloidogenic process that cleaves AβPP, which results in an increase in intracellular and secreted Aβ, as well as activation of the apoptotic pathway [52–54]. Given our observed reduction in cell viability at all timepoints of recovery following 6 h treatment with etoposide (Fig. 2B), we therefore asked whether the increase in Aβ40 and Aβ42 secretion after etoposide treatment was due to the secretion of Aβ from living cells or the release of intracellular Aβ upon cell death (Fig. 3). We probed GA2 NPC cell lysates with antibodies specific for AβPP and BACE1 and probed the supernatant with antibodies specific for sAβPPβ, the cleavage product of BACE1. We found no significant increase in BACE1 expression after etoposide treatment compared to controls (Fig. 3A). However, sAβPPβ levels were increased 2 h after recovery following etoposide treatment in ReN GA2 NPCs (Fig. 3C). Total AβPP expression did not change at any recovery timepoint in ReN GA2 NPCs despite the increase in sAβPPβ and differential expression of mature and immature AβPP (upper and lower bands, respectively), which may indicate changes in intracellular AβPP trafficking (Fig. 3B). These results indicate that etoposide treatment does not affect BACE1 expression or total AβPP expression throughout the recovery timecourse. However, DNA damage, specifically DSBs, increases BACE1’s production of sAβPPβ and consequent increase in Aβ40 and Aβ42 secretion in ReN GA2 NPCs. This result may reflect increased processing of mature AβPP by BACE1 with a depletion of the pool of immature AβPP. In any case, the absence of an effect upon total AβPP supports our conclusion that this increase in secreted Aβ which we have found is not due to the release of Aβ upon cell death. Further investigation into the specific activity of BACE1 and other secretases involved in the production of Aβ40 and Aβ42 such as γ-secretase, as well as the intracellular trafficking of AβPP after etoposide damage, is necessary in order to fully define the mechanism of DSB induction of Aβ40 and Aβ42 secretion.
Fig. 3
DSBs increase sAβPPβ, but not total AβPP in ReN GA2 NPCs. A) Western blot of endogenous BACE1 expression in ReN GA2 NPCs and 20 day differentiated neurons treated with and without designated concentrations of etoposide for 6 h and allowed to recover for 2 h. B) Western blot of endogenous AβPP expression in ReN GA2 NPCs treated with and without 10μM etoposide for 6 h and allowed to recover for designated times. C) Western blot of sAβPPβ in ReN GA2 NPCs and 20 day differentiated neurons with and without 10μM of etoposide treatment for 6 h and allowed to recover for 2 h. Error bars represent means±SD of two to three separate experiments, and the p values were determined using two-way ANOVA and Tukey’s multiple comparisons test. ***p < 0.001, ****p < 0.0001.
Etoposide damage does not induce increased Aβ40 and Aβ42 secretion in differentiated ReN GA2 neurons
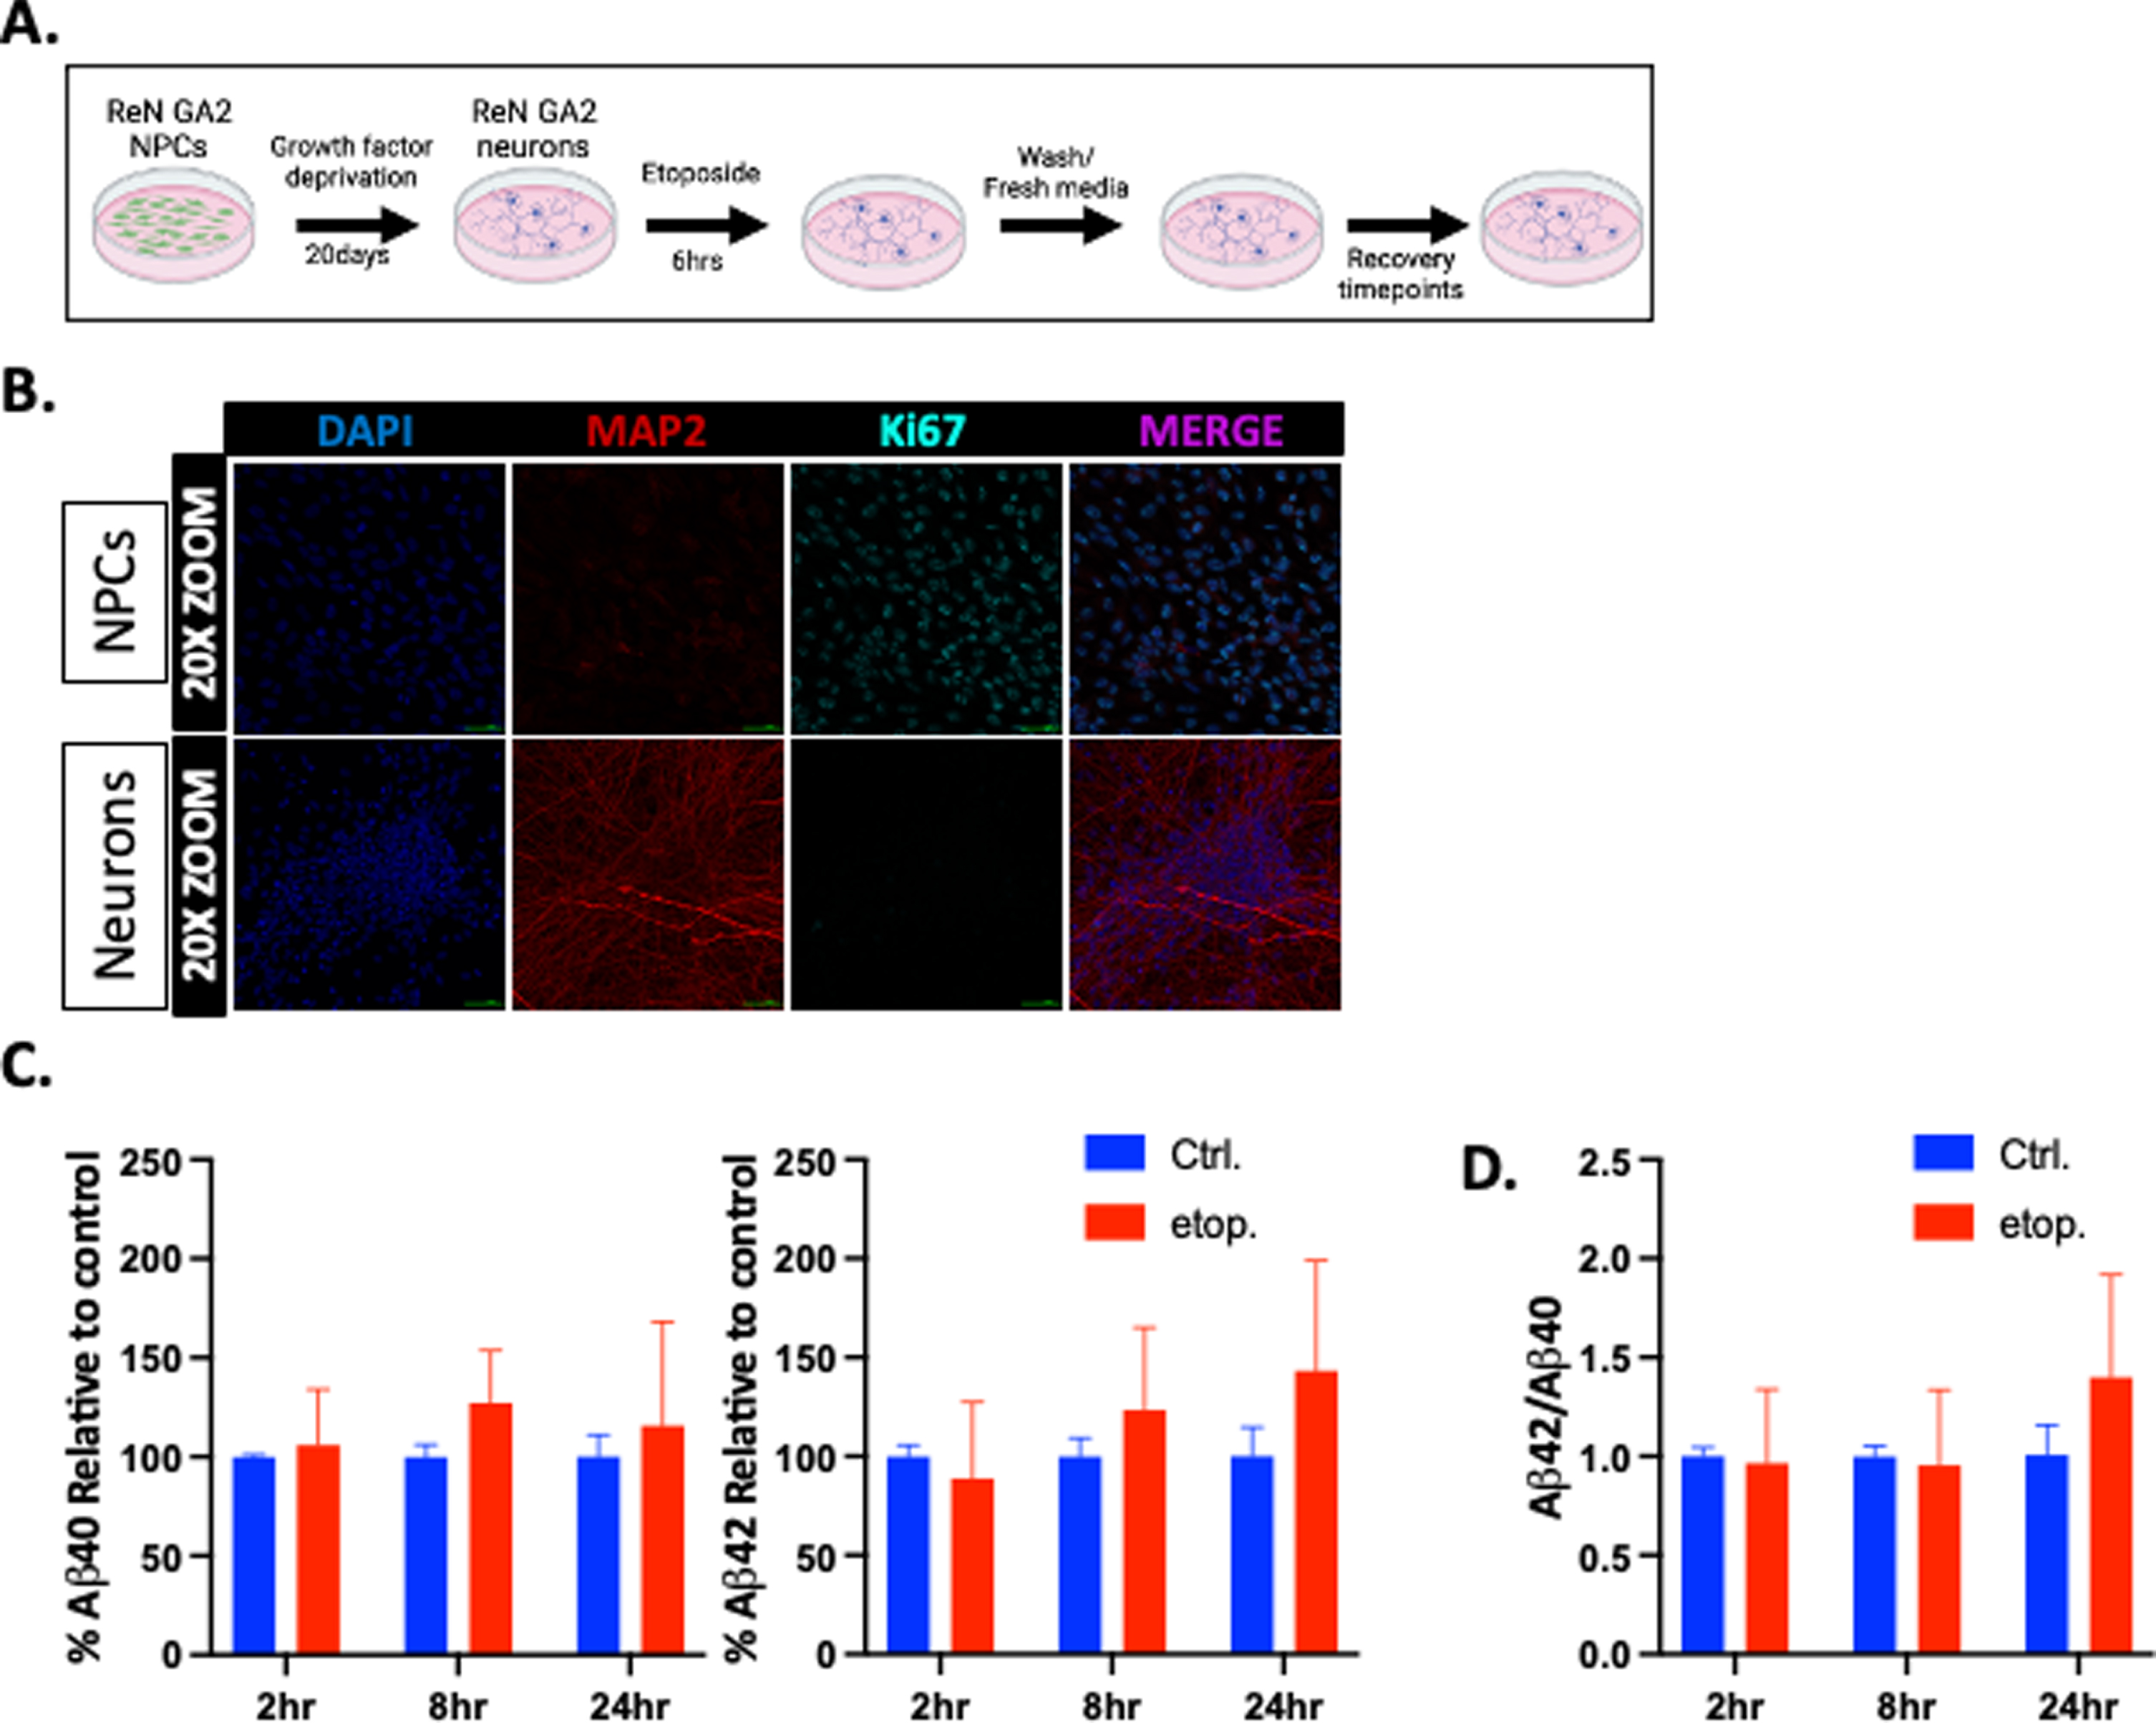
Mitotic and post-mitotic neurons maintain genomic integrity after induction of DSBs through different DDR mechanisms due primarily to the lack of a sister chromatid template for canonical homologous recombination (HR) in post-mitotic neurons [55]. Research has also shown that DNA DSBs are increased in human AD and 5xFAD mouse hippocampal astrocytes and neurons [25]. We therefore sought to determine whether DNA DSBs affect Aβ40 and Aβ42 generation in post-mitotic ReN GA2 neurons as well as NPCs. First, we differentiated the ReN GA2 NPCs into neurons using a previously established protocol for 20 days [37] (Fig. 4A). The ReN GA2 neurons were then fixed and immunolabeled with antibodies specific for the neuronal markers MAP2 and Tuj1, the astrocyte marker GFAP, and the nuclear protein proliferation marker Ki67 (Fig. 4B and Supplementary Figure 4A, B). The 20-day-differentiated ReN GA2 neurons showed distinct neuronal morphology, expressed the neuronal marker protein MAP2, did not express the astrocyte marker GFAP, and were non-proliferating (Ki67 negative). We then treated the ReN GA2 neuronal cultures with 10μM etoposide for 6 h and allowed them to recover for 2 h, 8 h, and 24 h (Fig. 4C). We confirmed increased DSBs in ReN GA2 neurons after etoposide treatment via a neutral comet assay as well as increased expression of the DSB-associated histone variant γ-H2AX (Supplementary Figures 2B and 3A). A dose response curve showed no significant increase in apoptosis after etoposide treatments compared to basal levels of controls as indicated by TUNEL staining (Supplementary Figure 3B). We found that after induction of DSBs, the post-mitotic 20-day ReN GA2 neurons do not secrete significantly increased amounts of Aβ40 and Aβ42. The ratio of Aβ42/Aβ40 also remained unchanged after etoposide treatment and recovery (Fig. 4D). BACE1 and sAβPPβ expression levels did not increase after etoposide treatment compared to controls (Fig. 3A). These results indicate that etoposide-induced DNA DSBs do not lead to increased secretion of Aβ40 and Aβ42 in 20-day differentiated ReN GA2 cells.
Fig. 4
Etoposide damage does not increase Aβ40 and Aβ42 secretion in differentiated ReN GA2 neurons. A) Treatment schematic for differentiating ReN GA2 neurons and treatment with and without 10μM etoposide for 6 h and designated recovery times. (Schematic created in BioRender, 2021.) B) Immunofluorescent staining of ReN GA2 NPCs and 20-day differentiated neurons with antibodies for anti-MAP2 (neuron) and anti-Ki67 (proliferation marker). C) Percent secreted Aβ40 and Aβ42 relative to controls after 6 h etoposide treatment and designated recovery times. D) Aβ42/Aβ40 ratio calculated from raw values. Error bars represent means±SD of three separate experiments.
DISCUSSION
Many authors have hypothesized that excessive damage to neuronal DNA and the resultant accumulation of DNA DSBs might be a significant contributing factor to the development of AD [25, 56]. Our studies experimentally support the causal relationship between DNA damage and Aβ accumulation. We found that Aβ production is increased following peroxide treatment of ReN GA2 NPCs and also by induction of DSBs via etoposide. We first discovered that global peroxide damage induces significantly increased Aβ40 and Aβ42 secretion in ReN GA2 NPCs 24 h after treatment. This effect is mitigated by the anti-oxidant α-tocopherol. Upon further investigation into whether this increase in Aβ secretion is due to direct DNA damage, using the topoisomerase II inhibitor etoposide, we found that ReN GA2 NPCs increase Aβ40 and Aβ42 secretion most significantly 2 h and 4 h following etoposide treatment. However, 20-day differentiated ReN GA2 neurons do not secrete increased Aβ40 and Aβ42 regardless of recovery time, including 24 h post damage induction, despite accumulating comparable amounts of DSBs after etoposide treatment.
DNA susceptibility, damage, and secretion of Aβ40 and Aβ42
Neuronal progenitors and post-mitotic cells are differentially susceptible to DNA damage and therefore secrete varying amounts of Aβ40 and Aβ42 in response to this damage as evidenced by novel data from this study. In the first section, we showed that global peroxide damage and etoposide treatments induce DNA DSBs in NPCs and neurons (Supplementary Figure 2A, B). Peroxide treatment results in the production of free radicals and oxidative stress that can affect proteins, lipids, and membranes, as well as resulting in numerous DNA lesions such as SSBs and DSBs.
Etoposide, which specifically inhibits topoisomerase II from re-ligating induced DSBs, differentially affects mitotic and post-mitotic cells. In mitotic cells, topoisomerase II also acts to prevent supercoiling of DNA during replication (reviewed in [57]). Supported by our comet assay data, progenitor cells experience DSBs induced by etoposide due to vulnerability at both replication sites and active transcription sites (Supplementary Figure 2B). However, topoisomerase II is only active in post-mitotic cells near the promoters at active transcription sites [58]. This leaves progenitor cells hypothetically more vulnerable to etoposide-induced DSBs. Moreover, in contrast to our results showing that mature ReN GA2 neurons do not accumulate increased Aβ despite having etoposide-induced DSBs, the brain in sporadic AD is marked by DSBs and Aβ, with most neurons being post-mitotic. It may be that the cellular milieu of ReN GA2 NPCs is more supportive of BACE1 increased processing of AβPP and Aβ accumulation than the cellular milieu of mature ReN GA2 neurons.
The DNA damage repair pathways also differ between the two cell types. Post-mitotic cells are unable to utilize the more error-free DSB repair pathway of HR due to the lack of a sister chromatid, but, like progenitor cells, they are capable of utilizing the RNA templated repair pathway TC-HR for DSB repair [26, 59]. Our prior research has shown that in terminally differentiated rat cortical neurons, high concentrations of extracellular Aβ42 oligomers reduce the concentration of the transcription-coupled homologous recombination (TC-HR)-associated repair protein RAD52, and also inhibit its recruitment to DNA damage sites [26]. A recent characterization of the neuronal transcriptome has also shown that persistent and unrepaired DNA damage leads to the downregulation of RAD52 [60]. Other studies have shown that extracellular Aβ42 oligomers reduce the HR-associated protein BRCA1 and increase the DSB-associated histone modification y-H2AX [27]. For neuronal progenitors that differentiate into post-mitotic neurons, our model hypothetically reflects the human brain where neural progenitors in the hippocampus and the cerebral cortex actively replicate early in life [61, 62]. Taken together, these observations strongly suggest that once Aβ accumulates, DNA damage repair is compromised. Additionally, with an increase in neuronal activity, activity-induced DSBs unrepaired by topoisomerase II must be repaired through either the HR or TC-HR pathways. In AD, these pathways would be inhibited by Aβ42 oligomers, which would be increased by DSBs as found in this study. Given the fact that AD appears to be initiated 10–20 years before memory and cognition decline, when NPCs may still be present in vulnerable regions of the brain, our NPC data is of particular interest. With neuronal progenitors secreting increased Aβ after DNA damage and the resultant increase in the more toxic effects of Aβ such as increased ROS, this could lead to a feedback loop of further DNA SSB and DSB accumulation, especially if acute or chronic DNA damage is experienced early in life or in regions of the brain where the progenitor cell population is more robust. This consequent feedback loop would contribute to further DNA damage, more production of Aβ, inhibition of repair, and finally the collapse of neuronal genomic integrity. Thus, it may be that the Aβ seen in symptomatic AD had its origin in NPCs years before symptoms, when Aβ accumulation and AD began.
Aβ40 and Aβ42 toxicity
The two most abundant forms of Aβ, Aβ40 and Aβ42, are typically found in the human brain in the ratio Aβ42/Aβ40 of approximately 1:9 [63]. In the inherited form of early onset familial AD for which there are multiple known mutations, this ratio can shift to a higher percentage of Aβ42. The increased ratio is associated with a more aggressive form of neurodegeneration than sporadic AD and negatively affects synaptic activity, neuronal viability, and memory formation in mouse models [64–66]. Aβ42 is reported to be more fibrillogenic and forms more neurotoxic assemblies than Aβ40 [67, 68]. Late-stage AD cerebrospinal fluid samples typically indicate lower Aβ42/Aβ40 ratios compared to non-AD patient samples. This is potentially due to neuronal loss, aggregated Aβ42 retained in plaques in the brain, clearance rates of Aβ40 and Aβ42, and variance among individuals (reviewed in [69]). Initially, ReN GA2 NPCs cells secrete Aβ40 up to three times higher in concentration than Aβ42 [62]. In our study utilizing ReN GA2 NPCs, etoposide-induced DNA DSBs led to increased secretion of both Aβ40 and Aβ42 species, altering the overall ratio (Fig. 2D). From a biological standpoint, it is difficult to ascertain if the shift in the Aβ42/Aβ40 ratio is relevant due to the difference in experimental technique (cell culture versus human cerebrospinal fluid sampling).
Summary and limitations
In summary, while many authors have hypothesized that neuronal DNA DSBs might induce Aβ, our study is the first to demonstrate this experimentally in a cell-based model. The increased secretion of Aβ40 and Aβ42 after induction of DNA DSBs in neuronal progenitors points to the need to focus on the mechanism of development of AD many years before extensive neuronal loss and the accumulation of Aβ plaques typically seen once patients present with AD-associated symptoms at diagnosis. While our results indicate that DNA damage induces the production of Aβ, and Aβ likely contributes to AD pathology, other etiologies might also induce Aβ production, whether or not Aβ is the primary cause of AD, a contributing cause, or an epiphenomenon. Further, the interpretation of data generated in our model, based on DNA damage in ReN GA2 NPCs and neurons, may be limited by the fact that these cells have mutations that lead to high concentrations of Aβ before any extrinsic DNA damage. However, in our study, we would not have had a detectable Aβ baseline by ELISA without these cells. Moreover, our study does not establish whether DNA damage induces neuronal hyper-secretion of Aβ in the brain itself, given the physiologic complexity of this organ, and this question might be addressed in brain organoids [70]. If, in fact, Aβ accumulation is primarily caused by damage to DNA, the age-dependence of most cases of AD would be consistent with a lifetime of oxidative metabolic activity, especially in people with a genetic susceptibility to damage or to the lack of damage repair. This would be especially relevant in NPCs and neural stem cells which differentiate into post-mitotic neurons. If the accumulation of Aβ begins at early stages in development when NPCs are more populous, then mitigating the effects of acute or chronic DNA damage at those stages would be an effective approach to AD prevention. Moreover, future research that clarifies the role of Aβ in the DDR may provide preventive therapeutic strategies to combat the progression of AD before its irreversible pathologies emerge.
ACKNOWLEDGMENTS
We would like to thank Dr. Karl Herrup for his kind help in revising the final manuscript, and offering experience and advice throughout the study.
This study was supported by R01AG058851 (AT), a NINDS T32 NS086749 Training Grant (SW), and institutional cash funds.
Authors’ disclosures available online (https://www.j-alz.com/manuscript-disclosures/22-0030r1).
SUPPLEMENTARY MATERIAL
[1] The supplementary material is available in the electronic version of this article: https://dx.doi.org/10.3233/JAD-220030.
REFERENCES
[1] | ((2021) ) 2021 Alzheimer’s disease facts and figures. Alzheimers Dement 17: , 327–406. |
[2] | Long JM , Holtzman DM ((2019) ) Alzheimer disease: An update on pathobiology and treatment strategies. Cell 179: , 312–339. |
[3] | Elder GA , Gama Sosa MA , de Gasperi R ((2010) ) Transgenic mouse models of Alzheimer’s disease. Mt Sinai J Med 77: , 69–81. |
[4] | Esquerda-Canals G , Montoliu-Gaya L , Güell-Bosch J , Villegas S ((2017) ) Mouse models of Alzheimer’s disease. J Alzheimers Dis 57: , 1171–1183. |
[5] | Sengupta U , Nilson AN , Kayed R ((2016) ) The role of amyloid-β oligomers in toxicity, propagation, and immunotherapy. EBioMedicine 6: , 42–49. |
[6] | Gonneaud J , Arenaza-Urquijo EM , Mézenge F , Landeau B , Gaubert M , Bejanin A , de Flores R , Wirth M , Tomadesso C , Poisnel G , Abbas A , Desgranges B , Chételat G ((2017) ) Increased florbetapir binding in the temporal neocortex from age 20 to 60 years. Neurology 89: , 2438–2446. |
[7] | Nunomura A , Perry G , Aliev G , Hirai K , Takeda A , Balraj EK , Jones PK , Ghanbari H , Wataya T , Shimohama S , Chiba S , Atwood CS , Petersen RB , Smith MA ((2001) ) Oxidative damage is the earliest event in Alzheimer disease. J Neuropathol Exp Neurol 60: , 759–767. |
[8] | Fan L , Mao C , Hu X , Zhang S , Yang Z , Hu Z , Sun H , Fan Y , Dong Y , Yang J , Shi C , Xu Y ((2020) ) New insights into the pathogenesis of Alzheimer’s disease. Front Neurol 10: , 1312. |
[9] | Cummings JL , Cohen S , van Dyck CH , Brody M , Curtis C , Cho W , Ward M , Friesenhahn M , Rabe C , Brunstein F , Quartino A , Honinhberg LA , Fuji RN , Clayton D , Mortensen D , Ho C , Paul R ((2018) ) A phase 2 randomized trial of crenezumab in mild to moderate Alzheimer disease. Neurology 90: , E1889–E1897. |
[10] | Arndt JW , Qian F , Smith BA , Quan C , Kilambi KP , Bush MW , Walz T , Pepinsky RB , Bussière T , Hamann S , Cameron TO , Weinreb PH ((2018) ) Structural and kinetic basis for the selectivity of aducanumab for aggregated forms of amyloid-β. Sci Rep 8: , 6412. |
[11] | Sigurdsson EM ((2018) ) Tau immunotherapies for Alzheimer’s disease and related tauopathies: Progress and potential pitfalls. J Alzheimers Dis 64: , S555–S565. |
[12] | Selkoe DJ ((2019) ) Alzheimer disease and aducanumab: Adjusting our approach. Nat Rev Neurol 15: , 365–366. |
[13] | Alam R , Driver D , Wu S , Lozano E , Key SL , Hole JT , Hayashi ML , Lu J ((2017) ) Preclinical characterization of an antibody [LY3303560] targeting aggregated tau. Alzheimers Dement 13: , P592–P593. |
[14] | Valko M , Leibfritz D , Moncol J , Cronin MTD , Mazur M , Telser J ((2007) ) Free radicals and antioxidants in normal physiological functions and human disease. Int J Biochem Cell Biol 39: , 44–84. |
[15] | Nguyen D , Alavi Mv. , Kim KY , Kang T , Scott RT , Noh YH , Lindsey JD , Wissinger B , Ellisman MH , Weinreb RN , Perkins GA , Ju WK ((2011) ) A new vicious cycle involving glutamate excitotoxicity, oxidative stress and mitochondrial dynamics. Cell Death Dis 2: , e240. |
[16] | Pizzino G , Irrera N , Cucinotta M , Pallio G , Mannino F , Arcoraci V , Squadrito F , Altavilla D , Bitto A ((2017) ) Oxidative stress: Harms and benefits for human health. Oxid Med Cell Longev 2017: , 841676. |
[17] | Ward JF , Evans JW , Limoli CL , Calabro-Jones PM ((1987) ) Radiation and hydrogen peroxide induced free radical damage to DNA. Br J Cancer 55: , 105–112. |
[18] | Perry G , Nunomura A , Hirai K , Takeda A , Aliev G , Smith MA ((2000) ) Oxidative damage in Alzheimer’s disease: The metabolic dimension. Int J Dev Neurosci 18: , 417–421. |
[19] | Schippling S , Kontush A , Arlt S , Buhmann C , Stürenburg HJ , Mann U , Müller-Thomsen T , Beisiegel U ((2000) ) Increased lipoprotein oxidation in Alzheimer’s disease. Free Radic Biol Med 28: , 351–360. |
[20] | Lovell MA , Markesbery WR ((2007) ) Oxidative DNA damage in mild cognitive impairment and late-stage Alzheimer’s disease. Nucleic Acids Res 35: , 7497–7504. |
[21] | Bassett CN , Montine TJ ((2003) ) Lipoproteins and lipid peroxidation in Alzheimer’s disease. J Nutr Health Aging 7: , 24–29. |
[22] | Picklo MJ , Montine TJ , Amarnath V , Neely MD ((2002) ) Carbonyl toxicology and Alzheimer’s disease. Toxicol Appl Pharmacol 184: , 187–197. |
[23] | Lin X , Kapoor A , Gu Y , Chow MJ , Peng J , Zhao K , Tang D ((2020) ) Contributions of DNA damage to Alzheimer’s disease. Int J Mol Sci 21: , 1666. |
[24] | Edlund T , Jessell TM ((1999) ) Progression from extrinsic to intrinsic signaling in cell fate specification: A view from the nervous system. Cell 96: , 211–224. |
[25] | Thadathil N , Delotterie DF , Xiao J , Hori R , McDonald MP , Khan MM ((2021) ) DNA double-strand break accumulation in Alzheimer’s disease: Evidence from experimental models and postmortem human brains. Mol Neurobiol 58: , 118–131. |
[26] | Welty S , Teng Y , Liang Z , Zhao W , Sanders LH , Greenamyre JT , Rubio ME , Thathiah A , Kodali R , Wetzel R , Levine AS , Lan L ((2018) ) RAD52 is required for RNA-templated recombination repair in post-mitotic neurons. J Biol Chem 293: , 1353–1362. |
[27] | Suberbielle E , Djukic B , Evans M , Kim DH , Taneja P , Wang X , Finucane M , Knox J , Ho K , Devidze N , Masliah E , Mucke L ((2015) ) DNA repair factor BRCA1 depletion occurs in Alzheimer brains and impairs cognitive function in mice. Nat Commun 6: , 8897. |
[28] | Shen X , Chen J , Li J , Kofler J , Herrup K ((2016) ) Neurons in vulnerable regions of the Alzheimer’s disease brain display reduced ATM signaling. eNeuro 3: , 167–179. |
[29] | Altman J , Das GD ((1965) ) Post-natal origin of microneurones in the rat brain. Nature 207: , 953–956. |
[30] | Ernst A , Alkass K , Bernard S , Salehpour M , Perl S , Tisdale J , Possnert G , Druid H , Frisén J ((2014) ) Neurogenesis in the striatum of the adult human brain. Cell 156: , 1072–1083. |
[31] | Kempermann G ((2014) ) Off the beaten track: New neurons in the adult human striatum. Cell 156: , 870–871. |
[32] | Magnusson JP , Göritz C , Tatarishvili J , Dias DO , Smith EMK , Lindvall O , Kokaia Z , Frisén J ((2014) ) A latent neurogenic program in astrocytes regulated by Notch signaling in the mouse. Science 346: , 237–241. |
[33] | Clarke DL , Johansson CB , Wilbertz J , Veress B , Nilsson E , Karlström H , Lendahl U , Frisén J ((2000) ) Generalized potential of adult neural stem cells. Science 288: , 1660–1663. |
[34] | Jin K , Peel AL , Mao XO , Xie L , Cottrell BA , Henshall DC , Greenberg DA ((2004) ) Increased hippocampal neurogenesis in Alzheimer’s disease. Proc Natl Acad Sci U S A 101: , 343–347. |
[35] | López-Toledano MA , Shelanski ML ((2004) ) Neurogenic effect of beta-amyloid peptide in the development of neural stem cells. J Neurosci 24: , 5439–5444. |
[36] | Demars M , Hu YS , Gadadhar A , Lazarov O ((2010) ) Impaired neurogenesis is an early event in the etiology of familial Alzheimer’s disease in transgenic mice. J Neurosci Res 88: , 2103. |
[37] | Kim YH , Choi SH , D’Avanzo C , Hebisch M , Sliwinski C , Bylykbashi E , Washicosky KJ , Klee JB , Brüstle O , Tanzi RE , Kim DY ((2015) ) A 3D human neural cell culture system for modeling Alzheimer’s disease. Nat Protoc 10: , 985–1006. |
[38] | Song Y , Subramanian K , Berberich MJ , Rodriguez S , Latorre IJ , Luria CM , Everley R , Albers MW , Mitchison TJ , Sorger PK ((2019) ) A dynamic view of the proteomic landscape during differentiation of ReNcell VM cells, an immortalized human neural progenitor line. Sci Data 6: , 190016. |
[39] | Jo DG , Arumugam TV , Woo HN , Park JS , Tang SC , Mughal M , Hyun DH , Park JH , Choi YH , Gwon AR , Camandola S , Cheng A , Cai H , Song W , Markesbery WR , Mattson MP ((2010) ) Evidence that γ-secretase mediates oxidative stress-induced β-secretase expression in Alzheimer’s disease. Neurobiol Aging 31: , 917–925. |
[40] | Tamagno E , Bardini P , Obbili A , Vitali A , Borghi R , Zaccheo D , Pronzato MA , Danni O , Smith MA , Perry G , Tabaton M ((2002) ) Oxidative stress increases expression and activity of BACE in NT2 neurons. Neurobiol Dis 10: , 279–288. |
[41] | White AR , Multhaup G , Maher F , Bellingham S , Camakaris J , Zheng H , Bush AI , Beyreuther K , Masters CL , Cappai R ((1999) ) The Alzheimer’s disease amyloid precursor protein modulates copper-induced toxicity and oxidative stress in primary neuronal cultures. J Neurosci 19: , 9170–9179. |
[42] | Ostling O , Johanson KJ ((1984) ) Microelectrophoretic study of radiation-induced DNA damages in individual mammalian cells. Biochem Biophys Res Commun 123: , 291–298. |
[43] | Olive PL , Banáth JP ((2006) ) The comet assay: A method to measure DNA damage in individual cells. Nat Protoc 1: , 23–29. |
[44] | Huang Y , Skwarek-Maruszewska A , Horré K , Vandewyer E , Wolfs L , Snellinx A , Saito T , Radaelli E , Corthout N , Colombelli J , Lo AC , van Aerschot L , Callaerts-Vegh Z , Trabzuni D , Bossers K , Verhaagen J , Ryten M , Munck S , D’Hooge R , Swaab DF , Hardy J , Saido TC , de Strooper B , Thathiah A ((2015) ) Loss of GPR3 reduces the amyloid plaque burden and improves memory in Alzheimer’s disease mouse models. Sci Transl Med 7: , 309ra164. |
[45] | Carr AC , Zhu BZ , Frei B ((2000) ) Potential antiatherogenic mechanisms of ascorbate (vitamin C) and α-tocopherol (vitamin E). Circ Res 87: , 349–354. |
[46] | Haq SH , Nounou H , Alamro AA ((2018) ) Neuroprotective role of alpha-tocopherol in H2O2 induced oxidative stress in neonatal sheep’s brain tissue culture. J Neurol Neurobiol 4: , doi: 10.16966/2379-7150.145 |
[47] | Suberbielle E , Sanchez PE , Kravitz A v. , Wang X , Ho K , Eilertson K , Devidze N , Kreitzer AC , Mucke L ((2013) ) Physiologic brain activity causes DNA double-strand breaks in neurons, with exacerbation by amyloid-β. Nat Neurosci 16: , 613–621. |
[48] | Shcherbakova I , Mitra S , Beer RH , Brenowitz M ((2006) ) Fast Fenton footprinting: A laboratory-based method for the time-resolved analysis of DNA, RNA and proteins. Nucleic Acids Res 34: , e48. |
[49] | Madabhushi R , Gao F , Pfenning AR , Pan L , Yamakawa S , Seo J , Rueda R , Phan TX , Yamakawa H , Pao PC , Stott RT , Gjoneska E , Nott A , Cho S , Kellis M , Tsai LH ((2015) ) Activity-induced DNA breaks govern the expression of neuronal early-response genes. Cell 161: , 1592–1605. |
[50] | Berger JM , Gamblin SJ , Harrison SC , Wang JC ((1996) ) Structure and mechanism of DNA topoisomerase II. Nature 379: , 225–232. |
[51] | Burden DA , Kingma PS , Froelich-Ammon SJ , Bjornsti MA , Patchan MW , Thompson RB , Osheroff N ((1996) ) Topoisomerase II-etoposide interactions direct the formation of drug- induced enzyme-DNA cleavage complexes. J Biol Chem 271: , 29238–29244. |
[52] | Gervais FG , Xu D , Robertson GS , Vaillancourt JP , Zhu Y , Huang JQ , LeBlanc A , Smith D , Rigby M , Shearman MS , Clarke EE , Zheng H , van der Ploeg LHT , Ruffolo SC , Thornberry NA , Xanthoudakis S , Zamboni RJ , Roy S , Nicholson DW ((1999) ) Involvement of caspases in proteolytic cleavage of Alzheimer’s amyloid-β precursor protein and amyloidogenic Aβ peptide formation. Cell 97: , 395–406. |
[53] | Tan J-L , Li Q-X , Ciccotosto GD , Crouch PJ , Culvenor JG , White AR , Evin G ((2013) ) Correction: Mild oxidative stress induces redistribution of BACE1 in non-apoptotic conditions and promotes the amyloidogenic processing of Alzheimer’s disease amyloid precursor protein. PLoS One 8: , e61246. |
[54] | Tamagno E , Parola M , Bardini P , Piccini A , Borghi R , Guglielmotto M , Santoro G , Davit A , Danni O , Smith MA , Perry G , Tabaton M ((2005) ) β-Site APP cleaving enzyme up-regulation induced by 4-hydroxynonenal is mediated by stress-activated protein kinases pathways. J Neurochem 92: , 628–636. |
[55] | Wei L , Levine AS , Lan L ((2016) ) Transcription-coupled homologous recombination after oxidative damage. DNA Repair (Amst) 44: , 76–80. |
[56] | Shanbhag NM , Evans MD , Mao W , Nana AL , Seeley WW , Adame A , Rissman RA , Masliah E , Mucke L ((2019) ) Early neuronal accumulation of DNA double strand breaks in Alzheimer’s disease. Acta Neuropathol Commun 7: , 77. |
[57] | Nitiss JL ((2009) ) DNA topoisomerase II and its growing repertoire of biological functions. Nat Rev Cancer 9: , 327–337. |
[58] | Lee JH , Berger JM ((2019) ) Cell cycle-dependent control and roles of DNA topoisomerase II. Genes (Basel) 10: , 859. |
[59] | Wei L , Nakajima S , Böhm S , Bernstein KA , Shen Z , Tsang M , Levine AS , Lan L ((2015) ) DNA damage during the G0/G1 phase triggers RNA-templated, Cockayne syndrome B-dependent homologous recombination. Proc Natl Acad Sci U S A 112: , E3495–E3504. |
[60] | Vazquez-Villasenor I , Garwood CJ , Simpson JE , Heath PR , Mortiboys H , Wharton SB ((2021) ) Persistent DNA damage alters the neuronal transcriptome suggesting cell cycle dysregulation and altered mitochondrial function. Eur J Neurosci 54: , 6987–7005. |
[61] | Corbin JG , Gaiano N , Juliano SL , Poluch S , Stancik E , Haydar TF ((2008) ) Regulation of neural progenitor cell development in the nervous system. J Neurochem 106: , 2272–2287. |
[62] | Choi SH , Kim YH , Hebisch M , Sliwinski C , Lee S , D’Avanzo C , Chen H , Hooli B , Asselin C , Muffat J , Klee JB , Zhang C , Wainger BJ , Peitz M , Kovacs DM , Woolf CJ , Wagner SL , Tanzi RE , Kim DY ((2014) ) A three-dimensional human neural cell culture model of Alzheimer’s disease. Nature 515: , 274–278. |
[63] | Pauwels K , Williams TL , Morris KL , Jonckheere W , Vandersteen A , Kelly G , Schymkowitz J , Rousseau F , Pastore A , Serpell LC , Broersen K ((2012) ) Structural basis for increased toxicity of pathological Aβ42:Aβ40 ratios in Alzheimer disease. J Biol Chem 287: , 5650–5660. |
[64] | Duff K , Eckman C , Zehr C , Yu X , Prada CM , Perez-Tur J , Hutton M , Buee L , Harigaya Y , Yager D , Morgan D , Gordon MN , Holcomb L , Refolo L , Zenk B , Hardy J , Younkin S ((1996) ) Increased amyloid-β42(43) in brains of mice expressing mutant presenilin 1. Nature 383: , 710–713. |
[65] | Scheuner D , Eckman C , Jensen M , Song X , Citron M , Suzuki N , Bird TD , Hardy J , Hutton M , Kukull W , Larson E , Levy-Lahad E , Viitanen M , Peskind E , Poorkaj P , Schellenberg G , Tanzi R , Wasco W , Lannfelt L , Selkoe D , Younkin S ((1996) ) Secreted amyloid β-protein similar to that in the senile plaques of Alzheimer’s disease is increased in vivo by the presenilin 1 and 2 and APP mutations linked to familial Alzheimer’s disease. Nat Med 2: , 864–870. |
[66] | Hellström-Lindahl E , Viitanen M , Marutle A ((2009) ) Comparison of Aβ levels in the brain of familial and sporadic Alzheimer’s disease. Neurochem Int 55: , 243–252. |
[67] | Yoshiike Y , Chui DH , Akagi T , Tanaka N , Takashima A ((2003) ) Specific compositions of amyloid-β peptides as the determinant of toxic β-aggregation. J Biol Chem 278: , 23648–23655. |
[68] | Kuperstein I , Broersen K , Benilova I , Rozenski J , Jonckheere W , Debulpaep M , Vandersteen A , Segers-Nolten I , van der Werf K , Subramaniam V , Braeken D , Callewaert G , Bartic C , D’Hooge R , Martins IC , Rousseau F , Schymkowitz J , de Strooper B ((2010) ) Neurotoxicity of Alzheimer’s disease Aβ peptides is induced by small changes in the Aβ42 to Aβ40 ratio. EMBO J 29: , 3408–3420. |
[69] | Hansson O , Lehmann S , Otto M , Zetterberg H , Lewczuk P ((2019) ) Advantages and disadvantages of the use of the CSF Amyloid β (Aβ) 42/40 ratio in the diagnosis of Alzheimer’s disease. Alzheimers Res Ther 11: , 34. |
[70] | Velasco S , Kedaigle AJ , Simmons SK , Nash A , Rocha M , Quadrato G , Paulsen B , Nguyen L , Adiconis X , Regev A , Levin JZ , Arlotta P ((2019) ) Individual brain organoids reproducibly form cell diversity of the human cerebral cortex. Nature 570: , 523–527. |


