
Alterations in Retinal Signaling Across Age and Sex in 3xTg Alzheimer’s Disease Mice
Abstract
Background:
Visual disturbances often precede cognitive dysfunction in patients with Alzheimer’s disease (AD) and may coincide with early accumulation of amyloid-β (Aβ) protein in the retina. These findings have inspired critical research on in vivo ophthalmic Aβ imaging for disease biomarker detection but have not fully answered mechanistic questions on how retinal pathology affects visual signaling between the eye and brain.
Objective:
The goal of this study was to provide a functional and structural assessment of eye-brain communication between retinal ganglion cells (RGCs) and their primary projection target, the superior colliculus, in female and male 3xTg-AD mice across disease stages.
Methods:
Retinal electrophysiology, axonal transport, and immunofluorescence were used to determine RGC projection integrity, and retinal and collicular Aβ levels were assessed with advanced protein quantitation techniques.
Results:
3xTg mice exhibited nuanced deficits in RGC electrical signaling, axonal transport, and synaptic integrity that exceeded normal age-related decrements in RGC function in age- and sex-matched healthy control mice. These deficits presented in sex-specific patterns among 3xTg mice, differing in the timing and severity of changes.
Conclusion:
These data support the premise that retinal Aβ is not just a benign biomarker in the eye, but may contribute to subtle, nuanced visual processing deficits. Such disruptions might enhance the biomarker potential of ocular amyloid and differentiate patients with incipient AD from patients experiencing normal age-related decrements in visual function.
INTRODUCTION
Alzheimer’s disease (AD) is an age-related neurodegenerative condition that irreparably damages cognition, memory, and executive function. Over 6M people in the United States are currently diagnosed with AD, and these rates are expected to double over the next 30 years [1, 2]. This is a serious public health problem because AD is fatal, and no validated, widely deployable disease-modifying therapies are available. While advanced age (65+ years) is the primary risk factor for the most common form of AD, the most promising therapies will likely target early pathophysiological changes that occur during presymptomatic or prodromal stages of disease before irreparable loss of cognition and memory. This is a challenge because diagnosis often occurs after the disease have advanced to cause substantial cognitive deficits and neuropathology. The past 10 years has seen tremendous technological advances in brain imaging and blood-biomarker diagnostics for AD, but these methods are typically applied after cognitive symptom presentation and not proactively for disease screening. This underscores a critical need for sensitive detection of the earliest clinical signs of AD, which will likely include non-cognitive indicators such as sensory disruption.
There is increasing evidence that early sensory disruptions precede cognitive deficits in dementia patients, and when combined with other major AD risk factors, may enhance the prediction of incipient dementia [3–5]. For over 35 years, disturbances in normal visual function have been documented among the earliest clinical signs in pre-symptomatic and early-symptomatic AD patients [6–8]. However, these clinical observations have not received much emphasis because visual symptoms reported in early AD patients do not present as overt blindness or loss of visual field, but as subtle, nuanced, changes in vision [9–11]. These changes include selective impairments in contrast sensitivity [11–16], color discrimination [9, 11–13, 16, 17], movement detection [18–20], object tracking [21], depth perception [22], and feature recognition [19] as well as deficits in light-based circadian rhythm entrainment [23]. While these sensory alterations are far less disabling than overt blindness, they still negatively impact AD patients, reducing their quality of life and even exacerbating cognitive deficits [11, 14, 24, 25].
A possible mechanism for visual disturbances in AD may involve accumulation of damaging amyloid-β (Aβ) peptides and tau fibrils in the retina and along its primary projection to the brain via the optic nerve [8, 26, 27]. These neuropathological hallmarks of AD are shown to accumulate in the eyes of dementia patients at early disease stages, thus inciting much research on their potential as predictive biomarkers [27–30]. The foundational studies in this area of research support two potential roles for ocular Aβ: 1) as a preclinical indicator of incipient AD, and 2) as a monitor of advancing disease progression. This work provided evidence of ocular Aβ accumulation prior to brain amyloid deposition in patients with mild cognitive impairment [31] and early-stage AD [29, 32], as well as in several AD mouse models [29, 33, 34]. Additional studies showed that with advancing disease stage, retinal Aβ levels became correlated with brain amyloid levels [28, 35–37]. As research continues to progress in this area, new findings have emerged that amyloid deposition in the retinal vasculature, which can also be visualized via ophthalmic imaging, may add predictive strength to the relationship between ocular and brain amyloid levels, and even suggests a potential originating source for Aβ entry into the eye [38–40]. Collectively, past and present research on ocular amyloid indicates that the visual system may provide a unique, non-invasive option for detecting and monitoring disease progression in AD [28, 30, 41–43].
While extensive translational research exploring diagnostic ocular amyloid imaging is ongoing, many questions remain to be investigated regarding the consequential relationship of Aβ on retinal health. The retina contains several types of neurons and glial cells that are vulnerable to the damaging effects of AD proteins, and of these, retinal ganglion cells (RGCs) may be most susceptible. RGCs are metabolically demanding neurons that play a critical role relaying incoming sensory information from photoreceptors along their axons in the optic nerve to the visual information-processing center of the brain [44, 45]. Thus, RGCs and their optic nerve pathways to the brain may serve as potential targets for pathological disruption of vision and as possible anatomical conduits for the spread of pathological proteins from the eye to the brain [46]. This is supported by data from early studies of postmortem human eye tissue from AD patients that showed the disease process was damaging RGCs—as evidenced by thinning of the nerve fiber layer [44, 45, 47], optic nerve degeneration [8], and overt loss of RGCs [48, 49]. Subsequent studies using both human clinical tissue samples [29] and transgenic AD mouse models found Aβ protein accumulation in the vicinity of such RGC damage [23, 29, 41, 42, 50, 51].
In neurodegenerative disease, functional deficits often precede structural loss in neurons [52–55]. RGCs use electrical signaling to quickly relay incoming visual information to the brain, and in early stages of various retinal diseases (e.g., glaucoma, diabetic retinopathy) this electrical communication can be disrupted [56–62]. There is also some evidence of this in AD where studies of early-stage dementia patients have shown decreased electroretinogram responses to visual stimuli [63–66]. Studies in experimental AD models (such as 3xTg mice and other genetic AD strains) have also reported retinal signaling aberrations along with evidence of axonal transport deficits and neurotransmission failure along the retinofugal projection [67–70]. However, these animal studies have produced inconsistent results, which are likely due to genetic variations between models, methodological differences in visual system measurement, lack of comparison between disease models and healthy age-matched control mice, and failure to use sex-stratified designs, which can obscure detection of sex-divergent effects in data [71–74]. The goal of this study was to provide a carefully designed sex-stratified contrast of retinal structure and function across both healthy aging (C57BL/6J mice) and pathological aging using 3xTg mice, a well-characterized disease model that’s visual system is known to be impacted by AD pathology.
MATERIALS AND METHODS
Subjects
3xTg mice (B6;129-Psen1tm1Mpm Tg(APPSwe,tauP301L)1Lfa/Mmjax) were used in this study because they are shown to develop pathological AD proteins in retina, optic nerve, and visual brain structures—predominantly Aβ, but also neurofibrillary tau and significant neuroinflammation [51, 67, 75]. 3xTg mice were developed to express transgenes for three human mutations associated with hereditary AD (APP KM670/671NL, MAPT P301L, and PSEN1 M146V), but are considered among the most clinically generalizable rodent models of AD pathology [76–78].
Mice were grouped into disease stage-based age groups supported by published characterizations of neuropathological progression corresponding to specific ages in 3xTg mice [53, 76], as well as in consideration of reported sex differences in severity/timing of pathological phenotype in this model [79–82].
1) Baseline (2–4 months), a young age group representing presymptomatic/early disease stages characterized by little hippocampal Aβ accumulation and modest retinal Aβ levels.
2) Progressing (8–10 months), an intermediate age group characterized by increasing retinal and brain Aβ accumulation and neuroinflammation, as well as emerging cognitive deficits.
3) Pervasive (12–14 months), an advanced age group characterized by significant retinal and brain Aβ accumulation, neuroinflammation, emergence of neurofibrillary tau protein in brain, and pronounced cognitive deficits.
Age- and sex-matched wildtype (WT) C57BL/6J mice were used for control comparisons. While C57BL/6J (C57) mice are commonly used as controls for 3xTg mice [83–87], the original 3xTg mouse model used was developed on a hybrid C57BL/6J + 129S1/SvlmJ background and thus, we performed some initial pilot studies to confirm that the primary retinal projection did not fundamentally differ between the B6129S/J hybrid background (n = 8) and C57 controls (n = 8). As such, no differences in RGC density or retinofugal axonal transport were indicated between these strains (see Supplementary Figure 1 for summary of these data); thus, we proceeded with using C57 mice as our primary controls for the remainder of experiments due to their more broadly characterized visual system features [88, 89].
Both 3xTg and C57 control mice were stratified by sex into equivalent samples of disease-age comparison groups to increase the sensitivity for detecting sex-specific patterns in the data [90–92]. Specific group/sample sizes are provided with the description of each experimental procedure below; groups include sex, genotype, and age. Each subject has two retinal projections, and both are included as data points in relevant analyses [93]. All 3xTg and C57 control mice were bred at the Northeast Ohio Medical University (NEOMED) from founders that were originally obtained from Jax Mice/MMRC. All mice were housed in the same room under identical environmental conditions. All experimental procedures were approved by the NEOMED Institutional Animal Care and Use Committee (protocol number 20-07-272) and conducted in accordance with the Guide for Care and Use of Laboratory Animals published by the National Institutes of Health, USA.
Pattern electroretinogram (PERG) recordings
PERG recordings were used to assess the functional status of RGC signaling in response to visual stimuli in 3xTg and control mice (n = 108 mice; ∼7–9 per sex/genotype/age group). Generation of a PERG response requires functional RGCs, and thus, can be used as an index of RGC impairment or loss caused by disease, injury, or even normal advanced aging [57, 94–99]. Prior to the procedure, mice were anesthetized with a ketamine (100 mg/kg)/xylazine (10 mg/kg) (i.p.) solution and 1% tropicamide solution was applied directly to the eye to dilate pupils. PERG recordings were obtained using a Celeris electroretinography system with automated stimulus presentation and signal recording that included dual light guide electrodes, 32-bit low-noise amplifiers, and Espion stimulus presentation and recording software (Diagnosys LCC, Lowell, MA). Anesthetized mice were placed onto a thermostatic (37°C) platform and GenTeal eye gel was applied to mouse eyes for lubrication. The Celeris stimulating and recording electrodes were also lubricated with GenTeal to facilitate electrode conductance. Electrodes were placed against each eye per manufacturer instructions; the reference electrode was initially placed against the left eye and the pattern-generating stimulus electrode was placed against the right eye; this order was reversed to complete the testing session. Both eyes were tested to generate two data points per subject. The stimulus electrode was designed to deliver visual stimuli directly at the level of the cornea in order to reduce potential refractive error that can occur when stimuli are placed further from the eye. Impedance was measured to ensure values of less than 5μΩ prior to onset of recording. Each recording session lasted approximately 8 minutes per eye. Validated programs generated by Espion software (V6.61.12) were used to present visual stimuli at a spatial frequency of 0.155 cycles/degree in which bars alternated at a frequency of 2.1 reversals per second at a constant luminance of 50 cd/m2. PERG responses from each eye were filtered and averaged over 600 sweeps. Espion software automatically detected and identified individual components of each overall PERG waveform and computed peak amplitudes and latencies. In rodents, the PERG waveform is comprised of a small amplitude negative deflection (N1) that occurs around 50 ms post-stimulus, followed by large amplitude positive (P1) and negative (N2) peaks that correspond to specific RGC subpopulation responses [100]. These designations differ from peaks reported in primates (including humans) for PERG, and may not necessarily be analogous [74, 85, 86]; thus our PERG results only describe these waveforms in reference to the rodent nomenclature. Values were exported from Espion software for statistical analysis.
Photopic flash electroretinogram (fERG) recordings
To account for the influence of either pathological or normal age-related changes in outer retinal cell (i.e., photoreceptor and bipolar cells) function on PERG, full-field fERG responses [107] under light adaptation were recorded in a total of 28 mice (3-4 per group and 1-2 retina were tested/mouse) that occupied either the youngest (baseline) or oldest (pervasive disease) age groups. As PERG is purported to be a light-adapted response, fERG was tested under photopic conditions to assess cone photoreceptor (a-wave) and downstream bipolar cell (b-wave) functionality [57, 103]. Light-adapted mice were anesthetized with a ketamine (100 mg/kg)/xylazine (10 mg/kg) solution and positioned into the Celeris apparatus as previously described for the PERG procedure. Contact lens-type fERG stimulators with built in recording electrodes were placed in contact with the cornea of each eye to provide full-field stimulus presentation similar to Ganzfeld bowls [104], and Espion software was used to execute preset programs for photopic fERG testing. Strobe flashes at two luminance intensities of 5.5 cd.s/m2 and 18.3 cd.s/m2 were used as stimuli; data from the higher luminance stimulus showed lower within-subject variability and were thus used for analysis. Under each luminance, 6 trials were completed per step at a pulse frequency of 1 and sample frequency of 2000 Hz. Following the trials, animals were returned to their home cage and allowed to recover. Espion software was used to automatically identify/compute response amplitudes (peak to trough) and latencies (waveform time to peak) for a-waves, which are the initial response of cone photoreceptor to light flash, and b-waves, which are a measure of downstream bipolar cell response to photoreceptor input [105]. Values were exported for statistical analysis.
Intravitreal injections of cholera toxin subunit β
Anterograde tract tracing was used to assess the functional status of axonal transport from RGC soma via the optic nerve to synaptic terminals in their primary synaptic target, the superior colliculus (SC). After electroretinogram recordings were complete, a cohort of anesthetized 3xTg and C57 control mice distributed across the three age groups were placed into a stereotaxic apparatus and 0.1% anterograde tract tracer cholera toxin subunit B (CTB) conjugated to Alexa Fluor 488 (#C22841, Invitrogen; Carlsbad, CA) dissolved in saline was intravitreally injected into each eye at a volume of 1.5μl/eye via Hamilton syringe [93]. After tracer injections, topical antibiotic (vetropolycin) was applied to each eye and mice were allowed to recover for 48 h before sacrifice for tissue collection. At this time, mice were given an overdose of anesthetic (Fatal Plus; 100 mg/kg i.p.) and were transcardially perfused with phosphate buffered saline (PBS) followed by 4% paraformaldehyde. Brains were dissected from the skull, post-fixed overnight, and then transferred to a 20% sucrose/PBS solution for cryoprotection. Brains were sectioned coronally at 50μm on a sliding freezing microtome. Retinas were dissected from each eye cup and flattened with relief cuts. Vitreous humor was carefully removed from the retinal surface and retinas were post-fixed for 30 min to prepare them for immunofluorescent staining as flat-mounts. For each subject (n = 48), 1-2 retinas were obtained for histological analysis.
Histopathology of brain and retina
Immunofluorescent (IF) staining was used to label RGC somata, their synaptic terminals, and Aβ in brain or retina. Fixed coronal tissue sections across the rostrocaudal extent of the superior colliculus were taken from CTB-injected mice and labeled for RGC synaptic terminals using vesicular glutamate transporter 2 (VGlut2; 1:500) to allow co-visualization of these structures with CTB transport. Flat-mount retinas were assayed to label retinal ganglion cells using RNA binding protein with multiple splicing (RBPMS; 1:200), and Aβ (1:200). Tissue sections were incubated in a blocking solution of 5% normal donkey serum, 0.1% Triton-X100, and PBS for two hours, followed by 48-h incubation in primary antibody solution containing combinations of the antibodies listed above (product and source information for antibodies is provided in Supplementary Table 1). Tissue sections were then washed in PBS 3x for 10-min before being incubated in a solution containing a 1:200 dilution of Alexa Fluor-conjugated secondary antibodies (Jackson Immunoresearch, West Grove; PA) in different fluorescent channels (594, 647, and 755) that allowed co-labeling of multiple antigens in the same tissue. After this incubation, tissue was washed in PBS (3×10 min), sections were mounted onto glass slides and cover-slipped using Fluoromount-G (Southern Biotech) in preparation for microscopy.
Microscopy and quantification of RGC density and axonal transport
Microscopy of collicular sections and retina was performed on a Zeiss Axio Imager M2 epifluorescent microscope equipped with 5X/0.16, 10X/0.3, 20X/0.8, and 63X/1.4 objective lenses, a motorized Z and X-Y stage, and Zen 2 operating software with deconvolution, tiling, and extended-depth-of-focus modules. A Hamamatsu ORCA-Flash4.0 V3 Digital CMOS camera (C13440-20CU; Hamamatsu City, Japan) was used for image acquisition. Retina and SC sections were imaged under multiple fluorescent channels and regions of tissue to capture co-label of relevant markers.
SC images were taken with a 5x objective at a resolution of 1.3μm×1.3μm per pixel. Integrity of axonal transport was determined by percent area fraction coverage of CTB tracer across the rostrocaudal extent of superficial SC and was computed using a custom-built macro [93, 106] for NIH Image J [93, 106]; this macro is freely available for use via this reference [93]. The integrity of RGC synaptic terminal distribution across the superficial SC was determined by computing percent area fraction of VGlut2 label in the same way [107].
Retinal images were taken under a 20x objective at a resolution of 0.325μm×0.325μm×0.55μm with an optical step size of 0.55μm. RGC density was computed from automated counts of RBPMS+ cells in retinal flat-mounts and measurement of retinal area using Image Pro Premier (Media Cybernetics) software [93] A minimum of 12 images per retina were taken across each of the four quadrants of retina (inferior, superior, nasal, and temporal) for quantification of RGC density.
Visualization of retinal amyloid with in vivo ophthalmic imaging
A Micron IV fluorescent ophthalmoscope (Phoe-nix Technology Group; Pleasanton, CA) was used to visualize the amyloid fragments in the fundus of live anesthetized mice (n = 40 mice) in a similar manner as conducted by Koronyo-Hamaoui and colleagues [29], but after implementation of a pilot technique to use intravitreal injection of fluorophore-conjugated Aβ antibody to label amyloid fragments [29]. Forty-eight hours prior to imaging, mice were anesthetized with 3.5% isoflurane via nosecone, placed into a stereotaxic holder, and intravitreal injections (1μl) of a 6E10 Aβ antibody conjugated to Alexa Fluor 488 (Biolegend; San Diego, CA, item #803013) diluted in sterile saline (at a concentration of 10μl/ml) were administered to each eye. Mice were allowed to recover for 48 h prior to the imaging procedure, at which point they were again anesthetized with inhaled 3.5% isoflurane, their pupils were dilated with a 1% tropicamide solution, and GenTeal eye gel was applied to keep the eyes lubricated during the procedure. Mice were placed onto the platform of the Micron imager and the ophthalmoscope was slowly lowered to contact the lubricated eye. For spatial consistency across animals, the field of view was centered around the optic disk. Images were taken under brightfield and fluorescence at a resolution of 3μm, allowing visualization of both retinal vasculature and Aβ-488 fluorescent signal, respectively. Brightness and gain levels were kept consistent across animals. After the procedure, a small subset of mice (n = 24) were sacrificed for immunohistological detection of amyloid signal in fixed retinal tissue (see Supplementary Figure 2).
Amyloid protein quantitation in retina and superior colliculus homogenates
Quantitative measurement of retinal and collicular Aβ protein content was conducted using magnetic-bead based multiplexing assays. A separate cohort of baseline, progressing, and pervasive-pathology aged 3xTg (n = 24 mice; 3-4 per sex/age group) mice were used to acquire fresh tissue for these assays (tissue was also collected from four C57 mice and used as negative controls for assays). Mice were decapitated under 4% isoflurane anesthesia and both right/left retina and superior colliculus lobes were dissected out and immediately frozen on dry ice (as previously detailed in [108, 109]). Tissue samples were stored at –80°C until protein extraction. After thawing samples on ice, T-Per Tissue Protein Extraction Reagent (Catalogue #78510; Fisher Scientific) containing 2x Halt Protease Inhibitor Cocktail (100x; Catalogue #78446; Fisher Scientific) was added to each sample and then samples were homogenized by sonication at 40% amplitude in three 2-s bursts. Homogenized samples were centrifuged at 4°C (20,000 g) for 10 min to collect supernatants. Total protein concentrations were measured by bicinchoninic acid (BCA) assay according to manufacturer’s instructions (Thermo Fisher Scientific). Multiplex assays for Aβ fragments (Aβ40 and Aβ42) were conducted in flat-bottom 96-well plates using standardized reagent kits designed for one of two assay platforms: MESO QuickPlex SQ 120 instrument (V-PLEX Aβ Peptide Panel 1 Kit #K15199E-1; MesoScale Discovery) or a Magpix Luminex 200 platform (Life Technologies, Grand Island, NY, USA; hAmyloid Beta Magnetic Bead Panel #HNABTMAG-68K, Millipore Sigma). Accessibility issues necessitated the use of two platforms; so female cohort samples were analyzed on the Luminex platform and Xponent software as described in Wilson et al. (2016) [109], and male samples were analyzed with the Mesoscale device and Discovery Workbench software in accordance with the methods provided in Simons et al. (2021) [46]. Protein levels were normalized to total protein content. While both platforms generated quantitative data on protein concentration in tissue homogenates and were cross-validated using a subset of female samples on both platforms, the absolute quantitative values produced by each platform differed. Therefore, no conclusions could be made about sex differences in the relative amounts of Aβ in each structure; only within-sex comparisons across age groups/genotypes are described for this variable.
Statistical analysis
Analysis of sex-stratified datasets was performed using IBM SPSS 26 Software. Prior to analysis, data were screened for outliers and normalcy using boxplots and frequency distributions. For each stratum, factorial analyses of variance (ANOVAs) were used to test for main effects of genotype (3xTg, control), age group (baseline, progressing, pervasive) as well as genotype x age interactions on outcome variables. Bonferroni-corrected univariate ANOVAs were used to clarify any subgroup relationships for significant main effects; for discerning subgroup effects in significant interactions, the SPLIT function was used in SPSS software to subdivide samples prior to post-hoc ANOVA analysis. Axonal transport and protein data were analyzed with univariate ANOVA and Fishers LSD tests. Pearson Product Moment Correlations were used to determine whether RGC soma density changed linearly with PERG amplitude across a continuously-coded age variable in mice.
RESULTS
Antibody-based labeling identified Aβ protein in retina of live mice during ophthalmic imaging
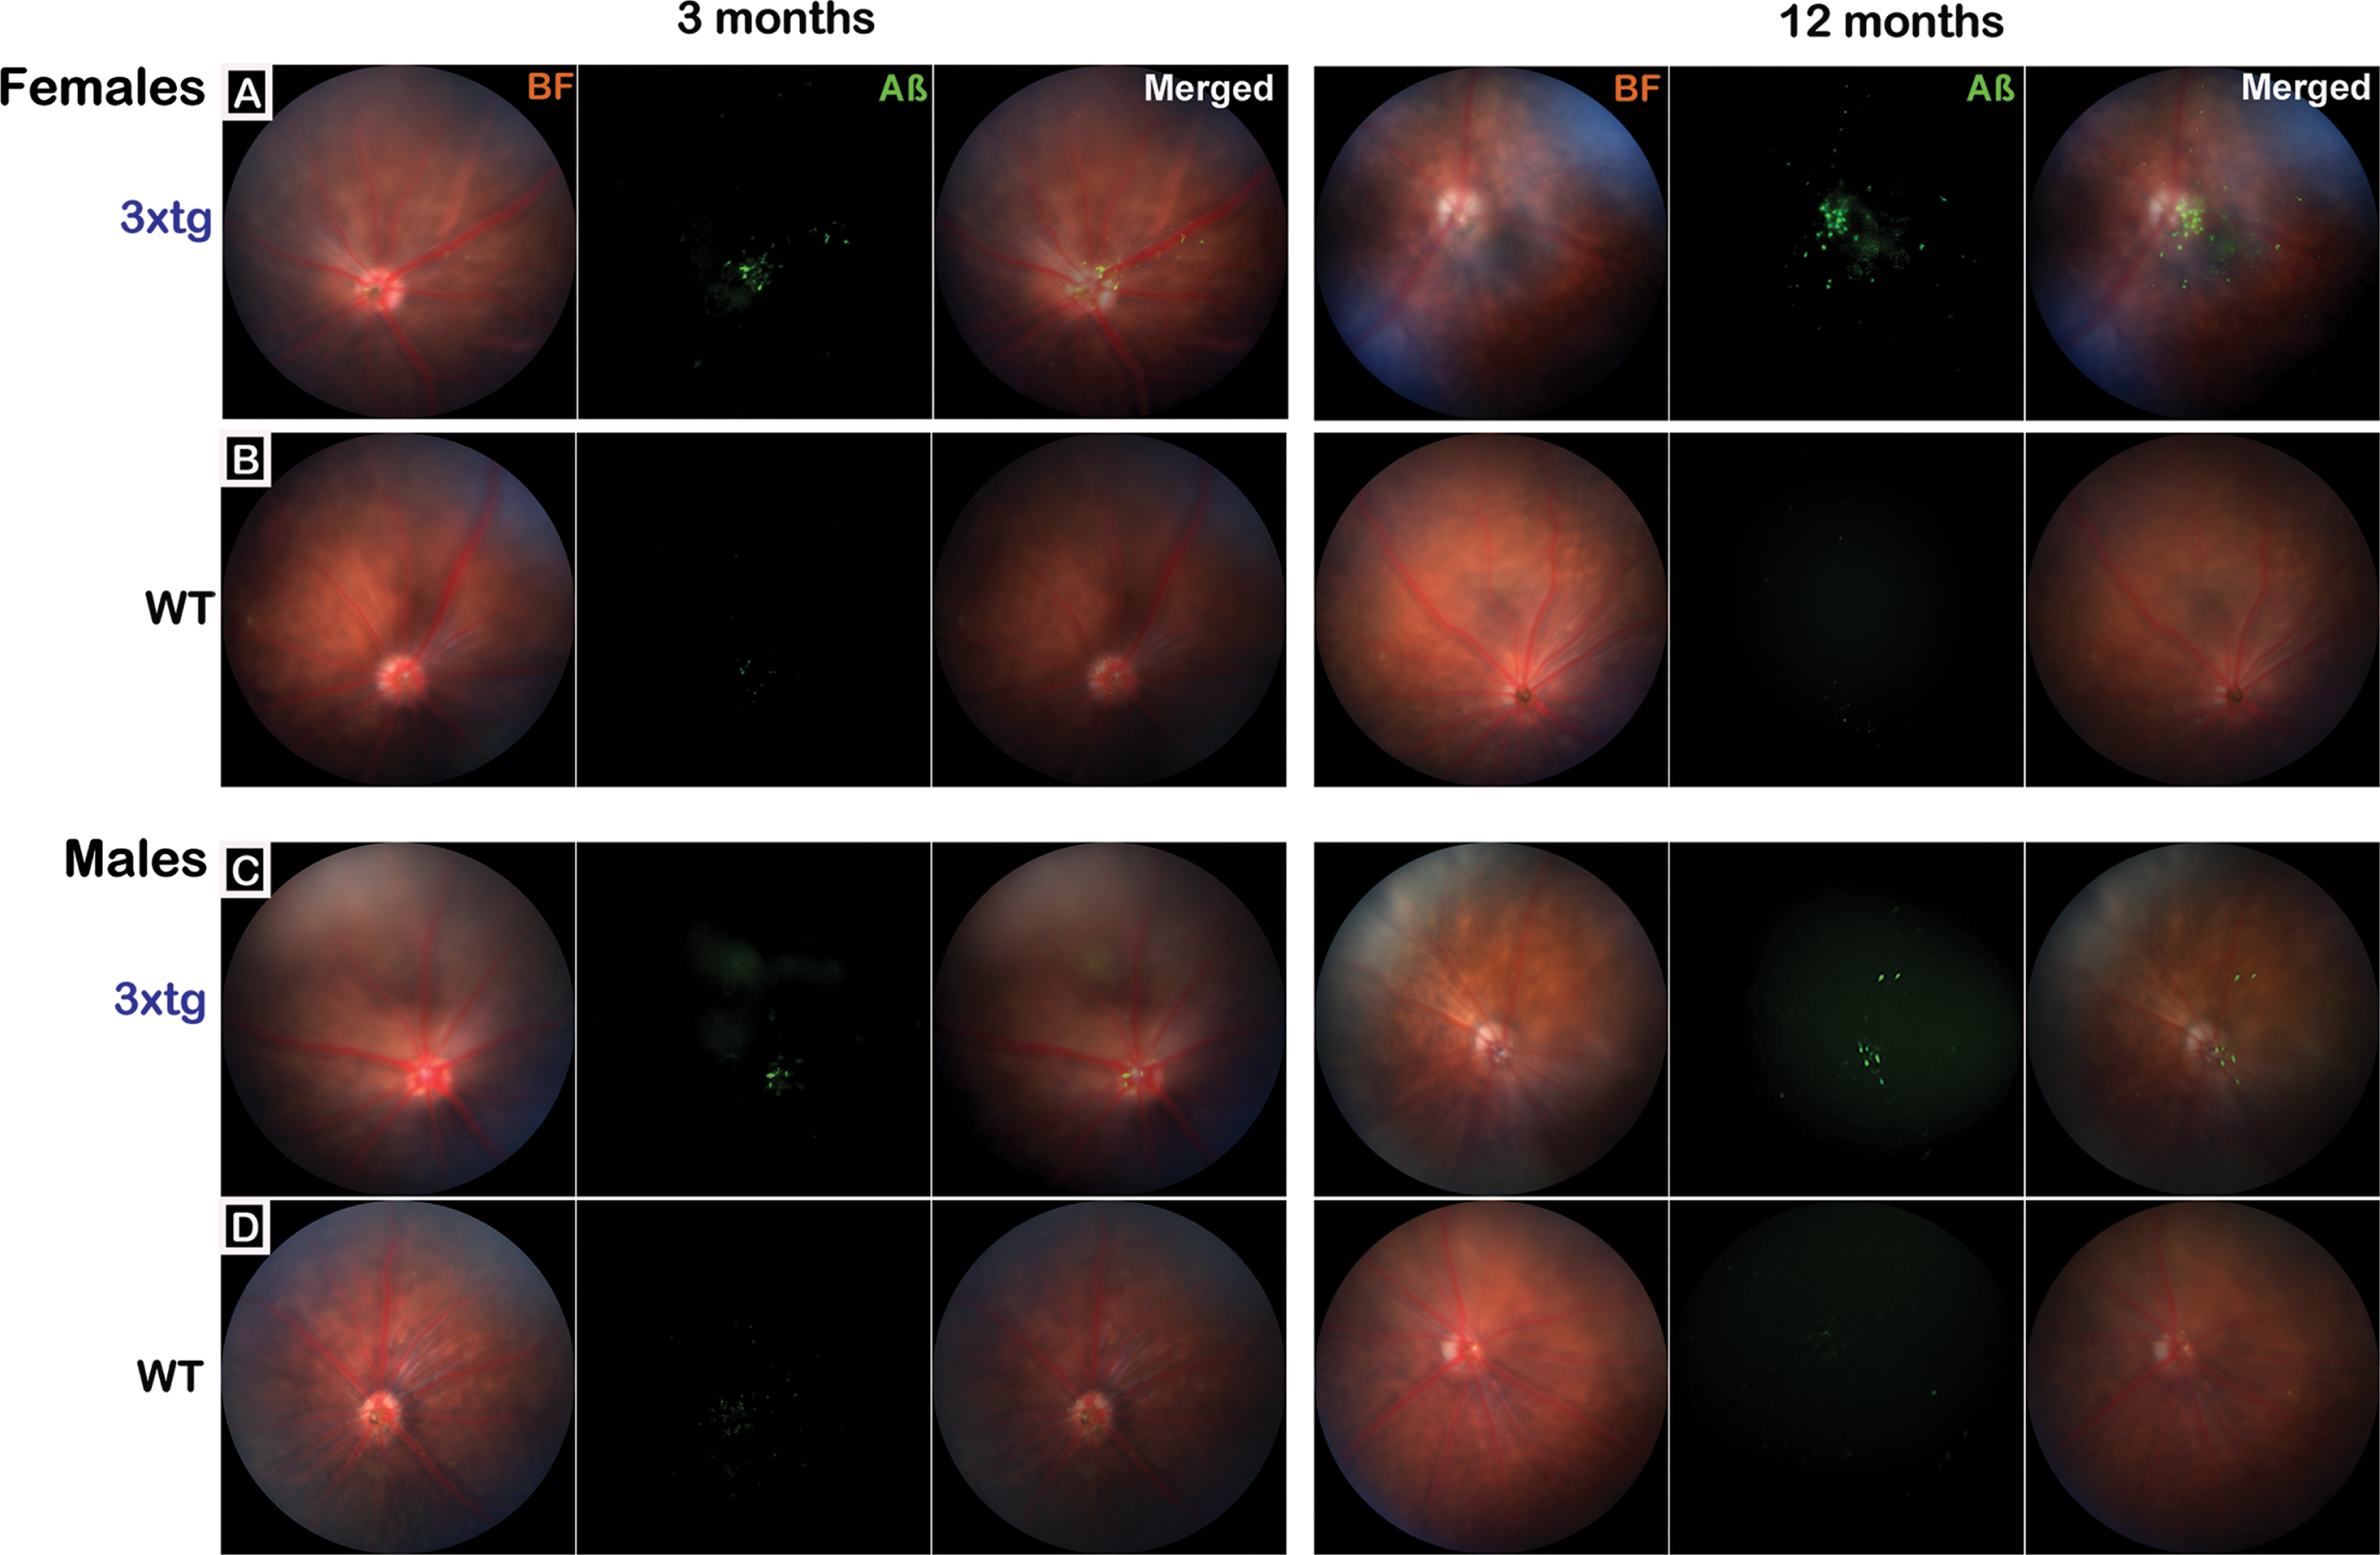
Intravitreal injections of fluorescence-conjugated 6E10 Aβ-antibody clearly and reliably labeled amyloid beta in the eye for in vivo retinal imaging under the Micron IV ophthalmoscope (Fig. 1). Aβ was visible in the retina as early as the baseline age (2–4 months) in both female and male 3xTg mice; by 12–14 months, greater amounts of Aβ were visualized in females. Within the retina, Aβ signal was concentrated along the vasculature with some diffuse distribution in other areas of retina (Fig. 1, merged images). No Aβ signal above background was detected in ophthalmic images taken from control mice. To compare Aβ labeling with the antibody-based in vivo Aβ labeling, perfusion-fixed flat-mount retina and hippocampal tissue sections (which served as a positive control for known Aβ immunoreactivity) were taken from a representative group of age- and sex-matched 3xTg and C57 control mice and assayed immunohistochemically with the same conjugated Aβ antibody (see Supplementary Figure 2). No amyloid signal above background was detected in control retinal samples.
Fig. 1
Visualization of retinal amyloid-β in 3xTg mice with in vivo ophthalmic imaging. The Micron IV ophthalmoscope was used to obtain representative retinal fundus images for baseline/early pathological stage (3 months) and pervasive pathological stage (12 months) 3xTg (rows A&C; n = 20 mice total; 10 mice/group) and age-matched wildtype (WT) C57BL/6J control mice (rows B&D; n = 20 mice total; 10 mice/group). Representative images from female (A&B) and male (C&D) mice from each genotype are presented. Brightfield (BF) images show retinal vasculature and optic disk; fluorescence (Aβ) images show signal detected after intravitreal injection of an AlexFluor-488 conjugated antibody that bound to retinal Aβ. Merged images overlay BF + Aβ. Images show that Aβ signal is detectable in 3xTg mice at 3 months of age but is more pronounced at 12 months (rows A&C). While present in both sexes, Aβ signal appears more abundant in female 3xTg mice. In merged images, Aβ can be seen distributed largely around the optic disc and vasculature with additional deposits in the periphery. No Aβ signal above background was detected in wildtype mouse retina (rows B&D).
Amyloid-β protein distribution in 3xTg retina and superior colliculus varies by age and sex
Multiplexed protein assays were used to quantify Aβ protein in 3xTg retina and SC, the main target of RGC axonal projections in mice. Two main isotypes of amyloid protein were quantified: Aβ42, a fragment known for its propensity to form neurotoxic aggregations, and the more abundant, less-damaging Aβ40 fragment. Protein assays did not differentiate soluble oligomeric from insoluble fibrillar Aβ42 species; however, according to published literature, both soluble oligomers and insoluble fibril assemblies of Aβ42 are shown to have deleterious consequences on visual system structures [34, 110]. To account for differences in relative distribution of each isoform, the ratio of Aβ42 to Aβ40 was plotted to create an index of pathological amyloid load that could be contrasted across conditions [111, 112]. Mean group values for amyloid variables are presented in Fig. 2.∥
Fig. 2
Quantitative assessment of amyloid-β protein in retina and its primary projection target, superior colliculus, in 3xTg mice. Multiplexed protein quantification assays for Aβ40 and Aβ42 fragments were conducted using fresh tissue homogenates of micro-dissected retina and superior colliculus samples from 3xTg mice (n = tissue from 24 mice total; 3-4 retina and 3-4 colliculi samples per sex/age group). Data are presented as ratio of Aβ42 to Aβ40 (pathological load; large bar graph) and individually by amyloid fragment (small bar graphs) for retina and superior colliculus. Aβ42/Aβ40 ratios in female 3xTg mouse retina (A) and superior colliculus (B) were significantly increased in pervasive pathology-stage mice compared to baseline and intermediate (progressive) pathology stages. Aβ42/Aβ40 ratio in male 3xTg retina increased with advancing disease age (C). Aβ42/Aβ40 ratio in male 3xTg colliculus (D) increased significantly in the oldest (pervasive) group relative to the two younger age groups. Asterisks indicate significant differences between bracketed age-groups. For Aβ42/Aβ40 ratio, data points for individual samples are plotted as black circles. Error bars represent s.e.m. Legend labels groups based on disease stages & corresponding age. Note that because female and male amyloid proteins were measured on two different platforms (Magpix and Luminex), their values are not on the same scale and thus, are not directly comparable.
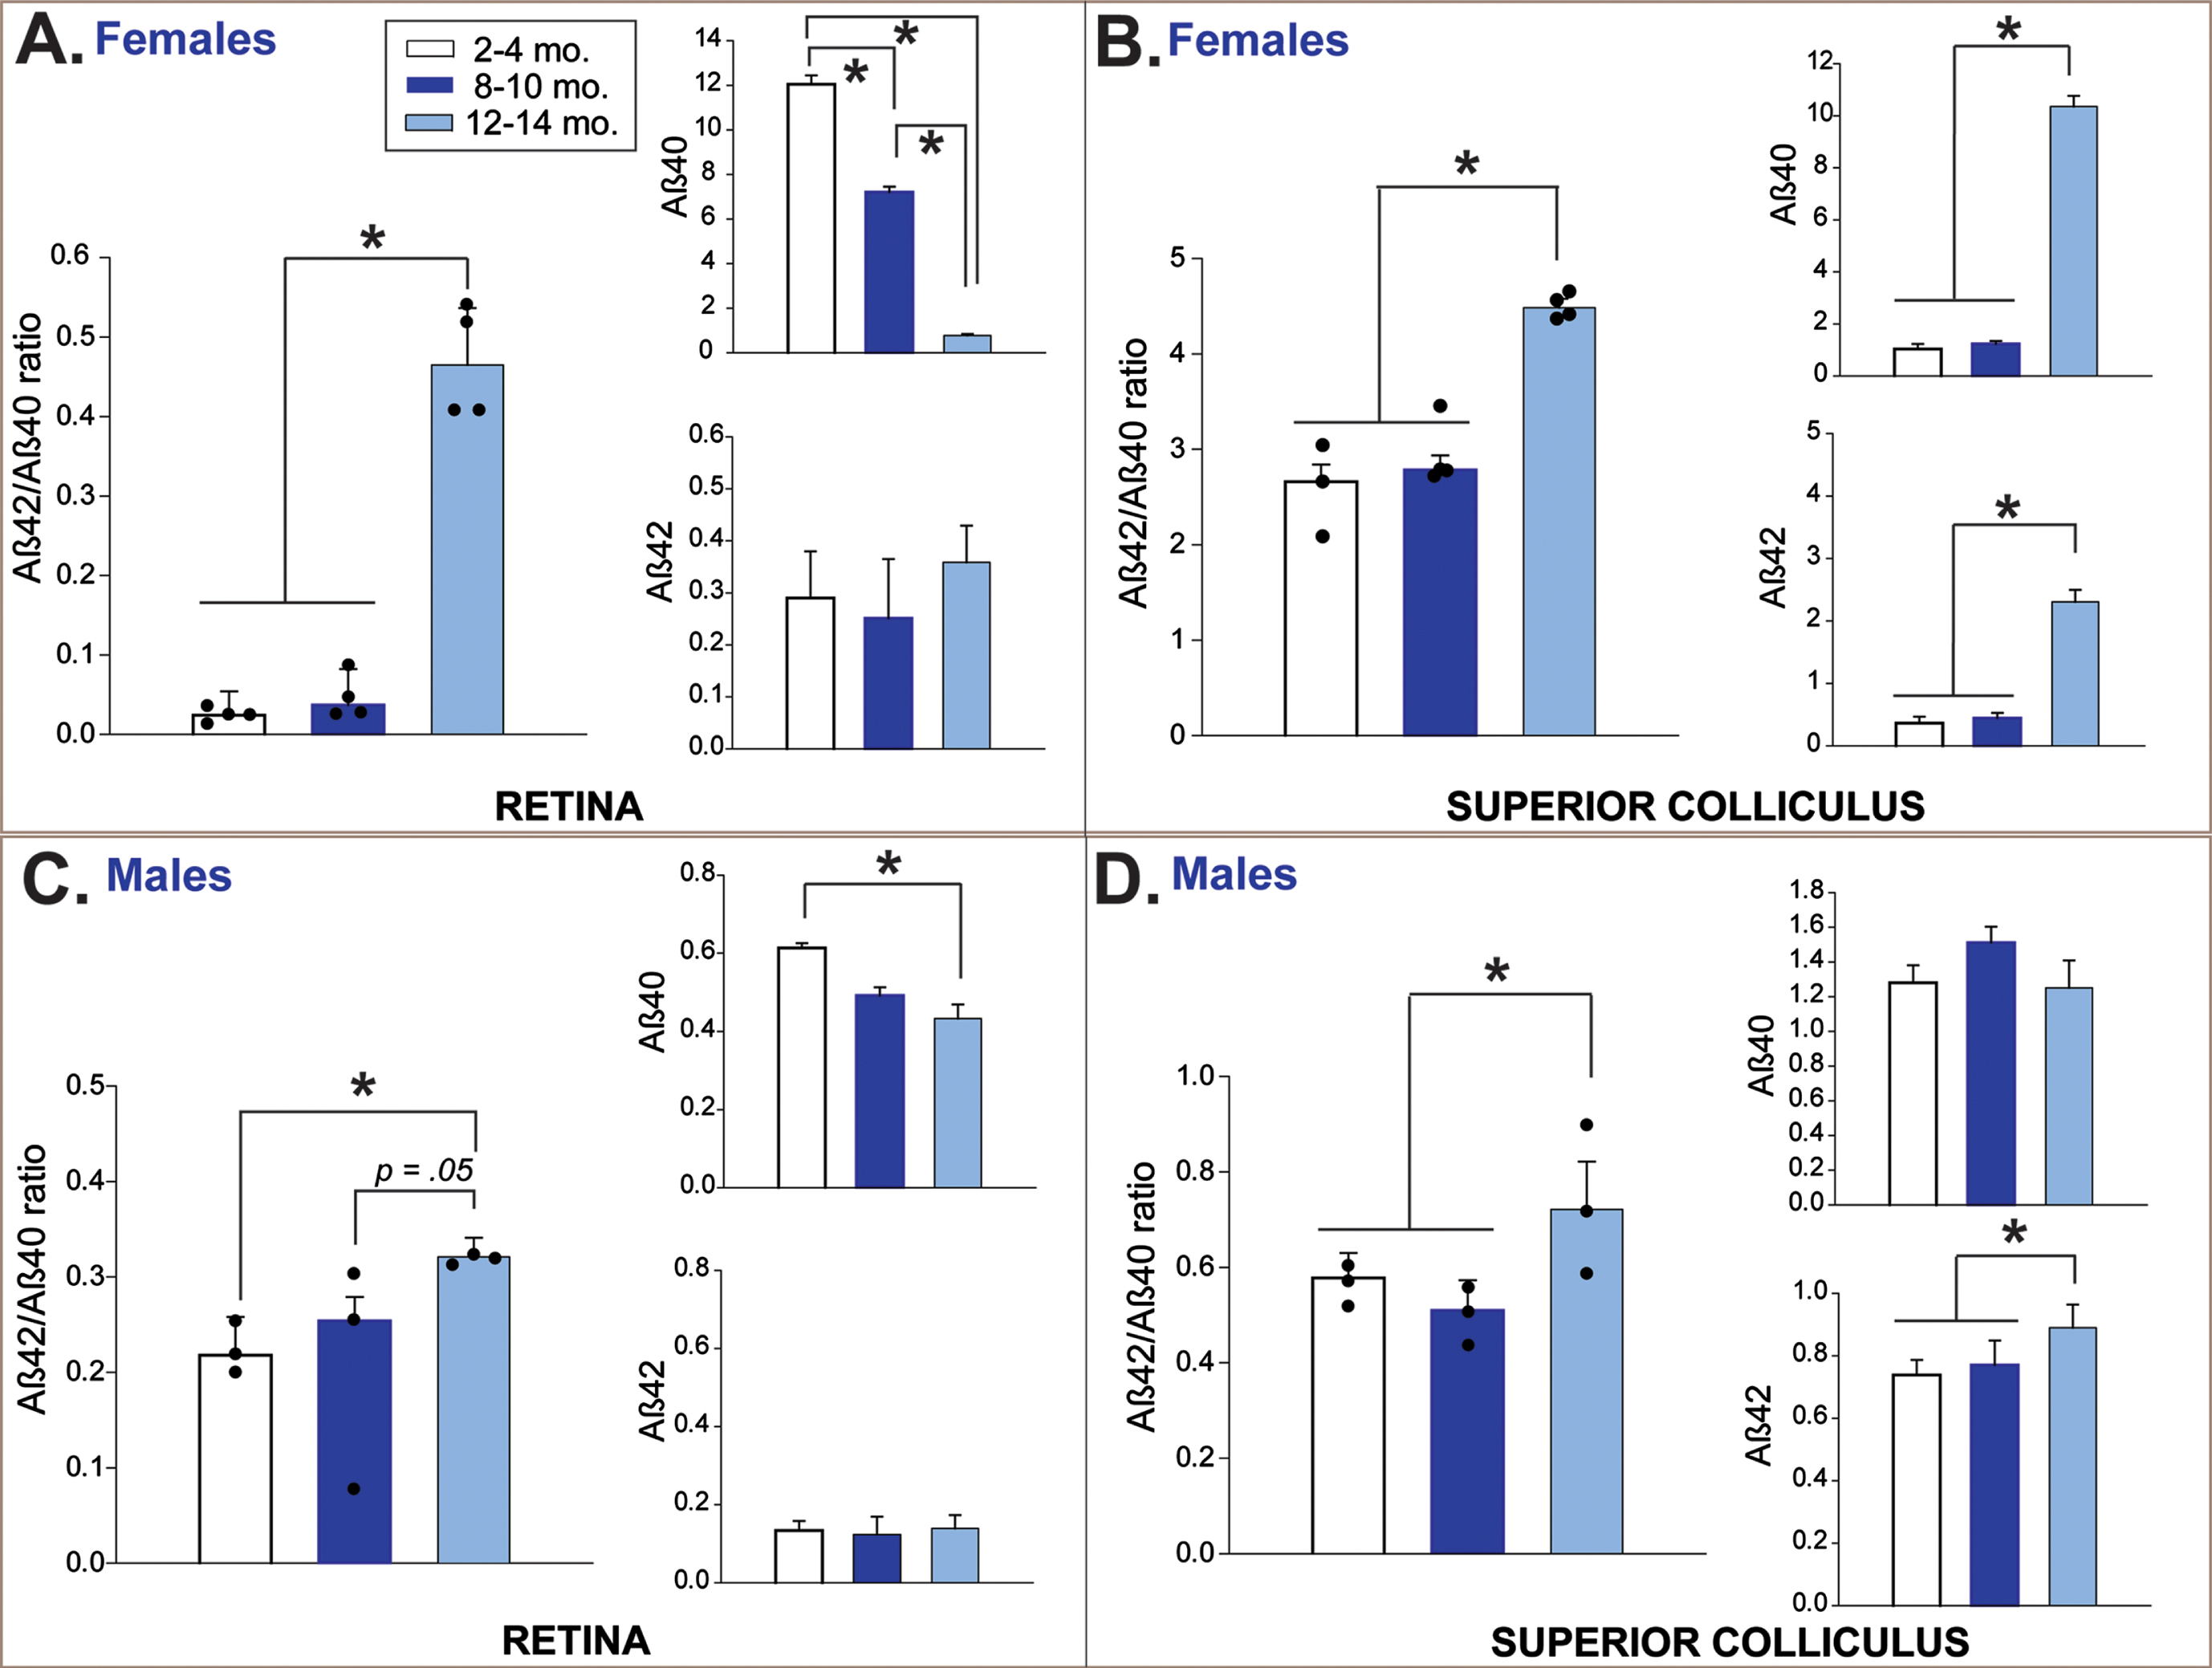
In female 3xTg mice, pathological retinal Aβ load sharply increased in the oldest age group (12–14 months) compared to both baseline and progressing (8–10 months) disease-staged mice (F2,9 = 95.5, p < 0.01; Fisher’s LSD post hoc tests p < 0.01 in both comparisons; Fig. 2A). This effect coincided with a significant age-related reduction in levels of the Aβ40 isotype (F2,9 = 52.57, p < 0.01), as Aβ42 levels remained stable across time. In male 3xTg mice, retinal Aβ load gradually increased from baseline across the 8–10 and 12-14-month age groups (F2,6 = 7.73, p = 0.02; Fisher’s LSD post hoc tests p = 0.008; Fig. 2C), and this also appeared to be driven by age-related reduction in Aβ40 (F2,6 = 37.53, p < 0.001).
In SC of female 3xTg mice, Aβ load increased abruptly in the 12-14-month age group after remaining stable at younger ages (F2,8 = 32.45, p < 0.01; Fisher’s LSD post hoc tests p < 0.01 in both comparisons; Fig. 2B). Aβ load in male 3xTg also increased significantly in 12-14-month-old mice (F2,6 = 10.46, p = 0.01; Fisher’s LSD post hoc tests p < 0.01; Fig. 2D). In female mice, pathological amyloid load in SC was associated with age-related increases in both Aβ42 (F2,8 = 32.10, p < 0.01) and Aβ40 (F2,8 = 32.10, p < 0.01); in males, only significant increases in collicular Aβ42 were indicated (F2,6 = 9.57, p = 0.01).
Functional assessment of RGCs: PERG
The functional status of RGCs in 3xTg and control mice was assessed via PERG. Response amplitudes and latencies for P1 and N2 peaks were targeted for analysis; in rodents, P1 is thought to represent the function of ON retinal ganglion cells which respond to increases in luminance; N2 corresponds to OFF retinal ganglion cells that fire in response to decreases in luminance [102]. Factorial ANOVAs were used to compare mean N1, P1, and N2 amplitudes in 3xTg and WT mice across age and group (statistics for these omnibus analyses are provided in Supplementary Table 2). Significant model effects were found for the dependent variables of P1 and N2 amplitude in both female and male datasets; there were no significant findings for N1 amplitude or any of the peak latency variables among mice of either sex. Significant model effects are described in detail below and are graphically presented in Fig. 3.
Fig. 3
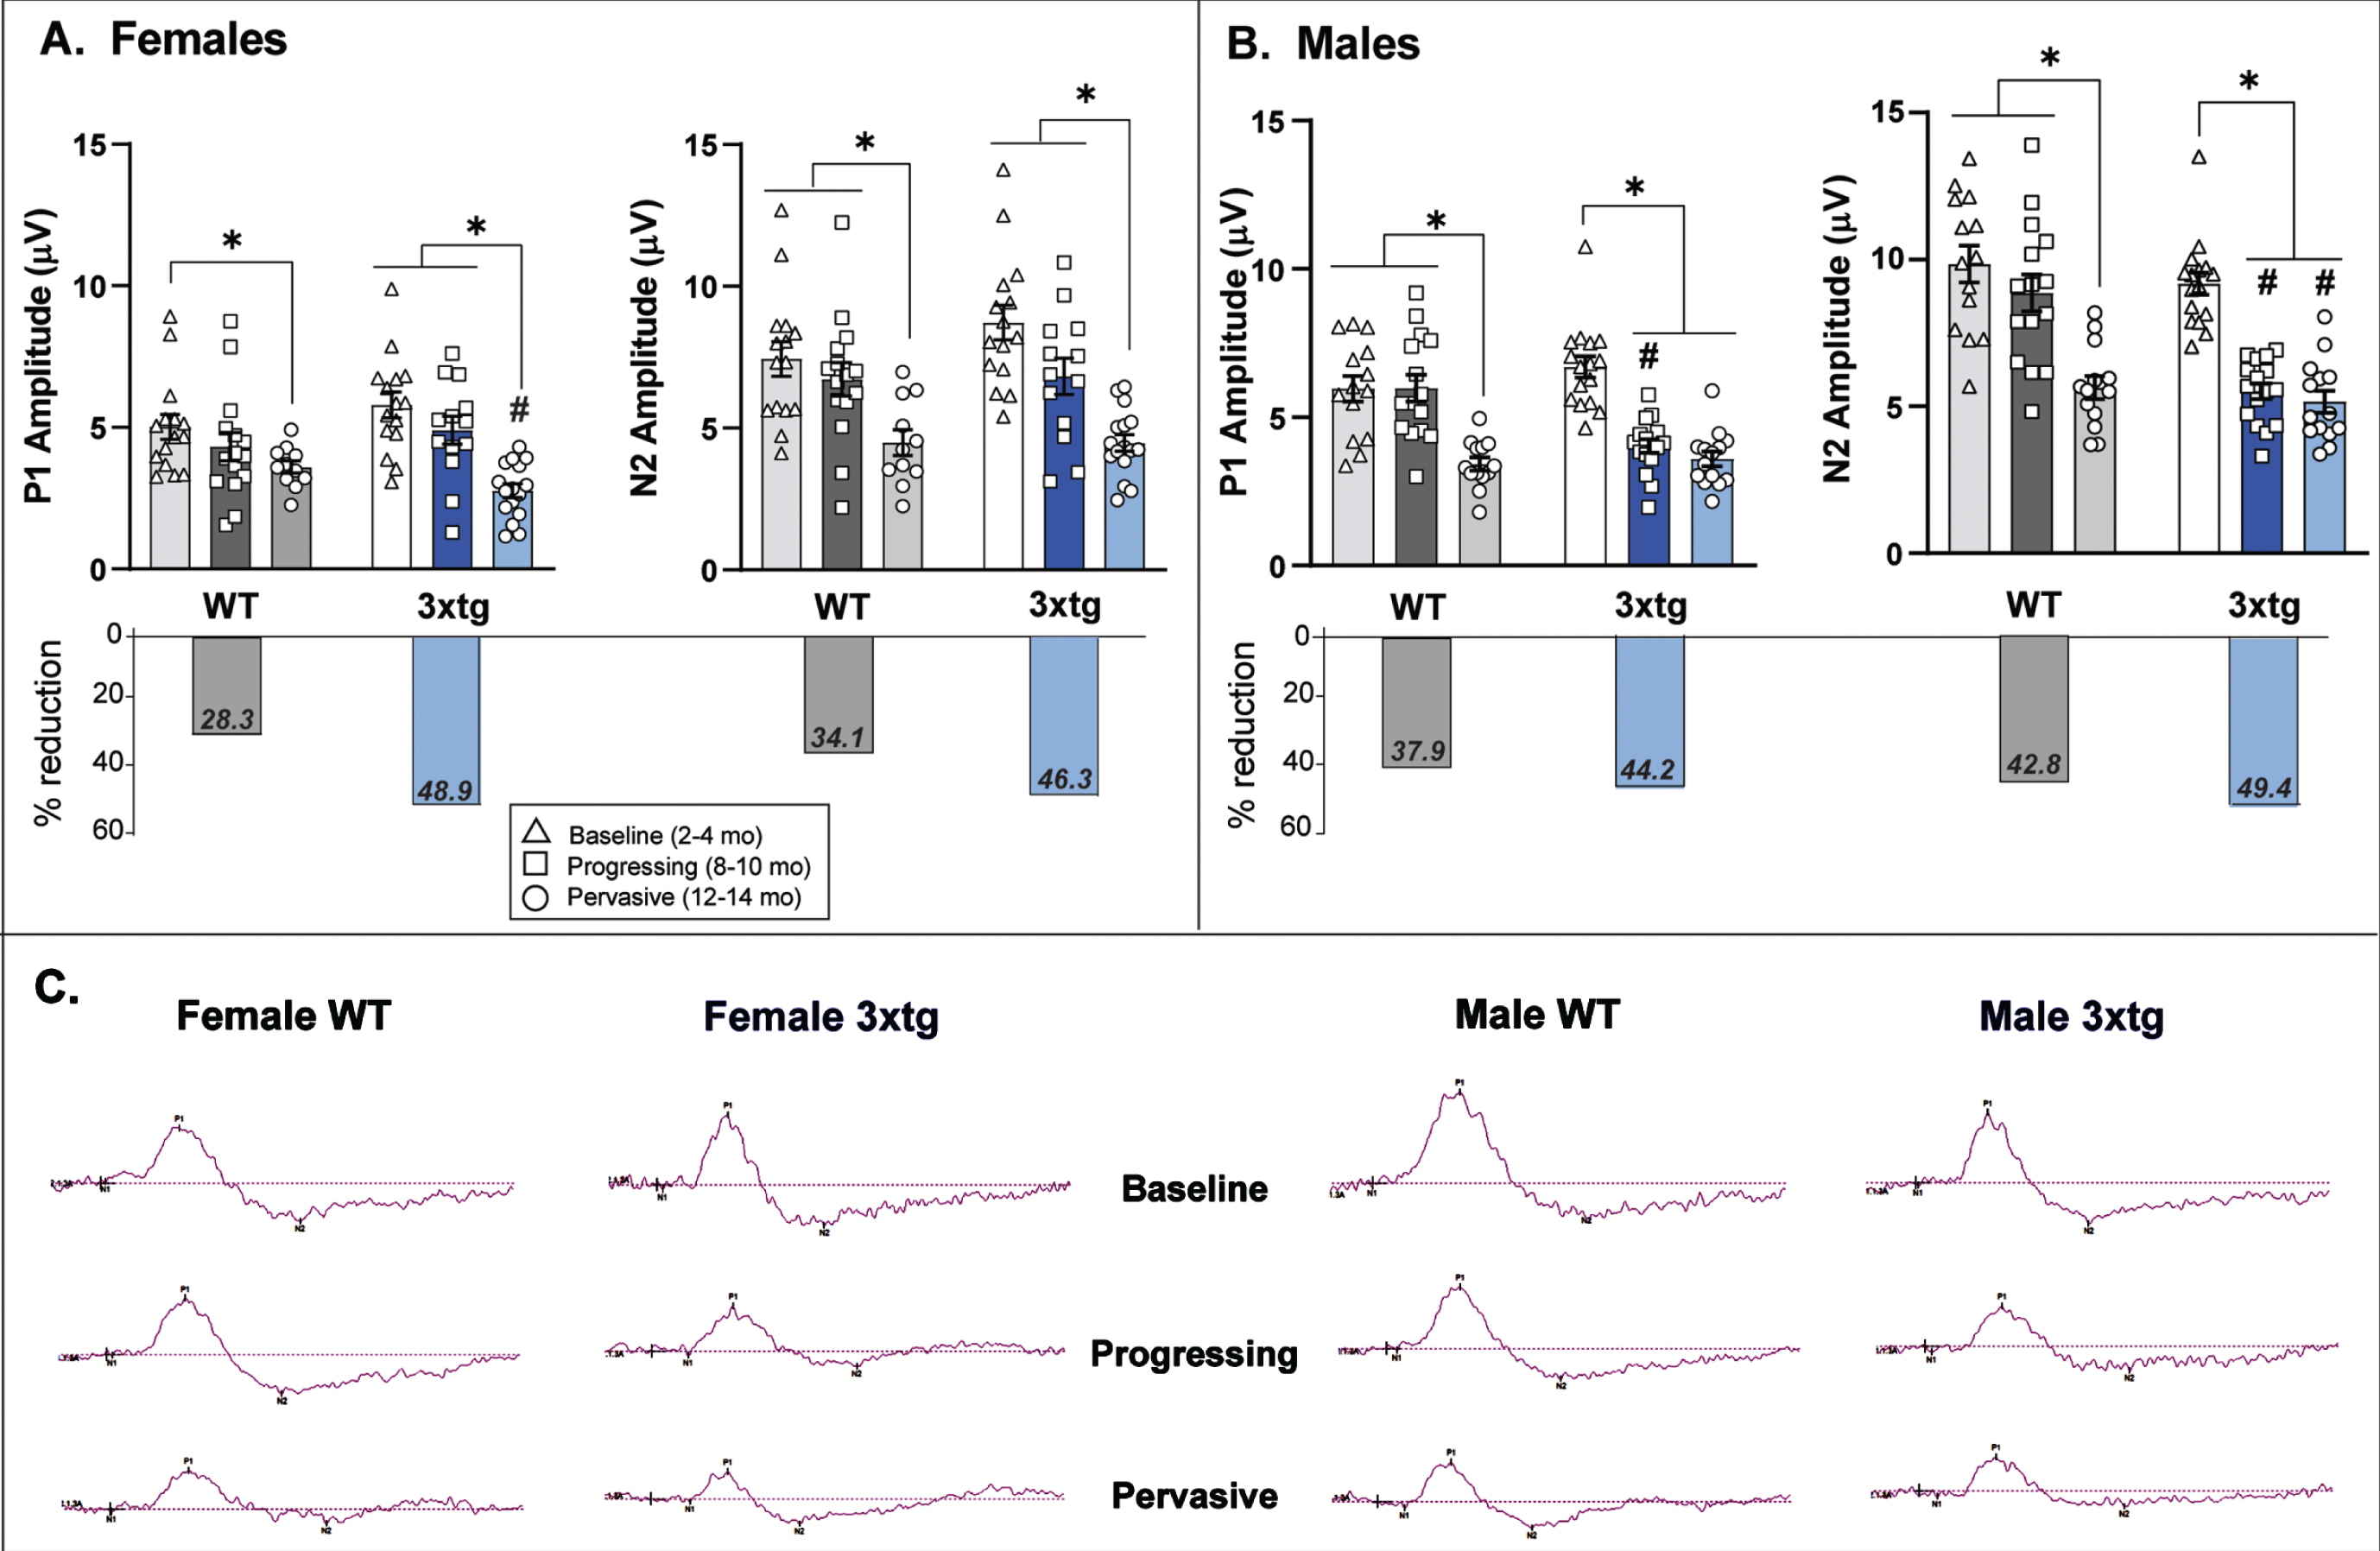
Pattern electroretinogram (PERG) response across increasing disease stage/age in 3xTg and wildtype (WT) control mice. Mean (bar) and individual (symbol) amplitudes for P1 and N2 peaks in the PERG waveform are depicted for female (A) and male (B) 3xTg and WT mice. The overall percent reduction in waveform amplitude across the entire tested age-span of mice is summarized for each sex and genotype in the lower set of bar graphs. A) P1 amplitude in female mice significantly decreases with age in both genotypes; however, the magnitude of this (% reduction) is much greater in 3xTg mice. N2 amplitude also decreased with age in both female 3xTg and WT mice—also to a greater extent in 3xTg mice. B) Both P1 and N2 amplitude were significantly reduced in male 3xTg mice in the 8-10-month age group—this reduction in PERG response occurred much earlier than normal age-related decrements in male WT mice. While these amplitude reductions occurred earlier in male 3xTg mice, the overall magnitude of these response decrements were roughly comparable between the two genotypes. *indicates significant age differences within genotype (p < 0.05); #indicates significant differences between age-matched 3xTg and WT mice (p < 0.05). Error bars represent s.e.m. Note: N2 amplitude data are negative values but were plotted as absolute values for ease of visual comparison. Data are from 108 total mice (n = 7–9 mice per sex/genotype/age group x 1-2 retina tested per mouse. C) Representative traces of the entire PERG waveform (amplitude x time) are plotted for 3xTg and WT mice by age and sex.
Age-related reduction in P1 amplitude was more severe in female 3xTg mice compared to female controls
P1 amplitude did not differ between genotypes at the baseline observation age (2–4 months) or at the progressing pathology stage (8–10 months). Both 3xTg (F2,40 = 25.8, p < 0.01) and control mice (F2,38 = 5.12, p = 0.01) experienced significant age-related reductions in P1 amplitude, however, this reduction was more severe in the oldest (12–14 months) female 3xTg mice compared to age-matched controls (F1,26 = 5.8, p = 0.02; Fig. 3A). When examining the overall percent reduction in P1 amplitude across the entire age-span tested, female 3xTg mice experienced a far greater loss of P1 response amplitude (∼50%) than female control mice (28.3%).
Age-related reduction in P1 amplitude occurs earlier in male 3xTg mice than controls, but is roughly comparable in magnitude
There were no baseline differences in P1 amplitude between genotypes in male mice. Both 3xTg and control mice exhibited age-related decrements in P1 amplitude; however, this occurred notably earlier in male 3xTg mice with a significant decrease in P1 amplitude between the baseline and 8-10-month age groups (F2,42 = 42.01, p < 0.01; Fig. 3B). Male control mice did not show significant age-related decreases in P1 amplitude from baseline until 12–14 months of age (F2,39 = 11.23, p < 0.01). While P1 amplitude reduction in 3xTg mice occurred at younger ages than controls, both genotypes experienced a similar degree of P1 amplitude loss across the entire tested age-span (3xTg: 44%; controls: 38%; Fig. 3B).
Female 3xTg mice show normal age-related changes in N2 amplitude
Baseline N2 amplitude did not differ by genotype in female mice. Both 3xTg (F2,41 = 18.15, p < 0.01) and control females (F2,38 = 6.33, p = 0.004) experienced significant age-related reductions in N2 amplitude (Fig. 3A). The overall decrease in N2 amplitude across the entire age-span tested trended higher in female 3xTg mice (46%) compared to controls (34%) but this finding was not statistically supported.
Male 3xTg mice exhibit earlier and more severe age-related reductions in N2 amplitude than male controls
Baseline N2 amplitudes in male mice were also comparable between the two genotypes. However, male 3xTg mice experienced a significant decrease in N2 amplitude between the baseline and intermediate age group (F2,43 = 63.10, p < 0.01; p < .01); this contrasts with N2 reduction in male control mice that occurred later between the intermediate and oldest age groups (F2,38 = 15.46, p < 0.01). Notably, the overall magnitude of N2 reduction across the entire tested age-span was greater in male 3xTg (49.4%) mice compared to controls (42.8%; Fig. 3B), with significantly lower N2 amplitudes in 3xTg mice compared to controls in both the progressing (F1,28 = 24.88, p < 0.01) and pervasive (F1,25 = 5.13, p = 0.03) pathology disease age groups.
Summary of PERG findings
PERG responses in healthy control mice show normal age-related reductions in ON RGC (P1) and OFF RGC (N2) response amplitudes. However, in female 3xTg mice, the magnitude of ON RGC changes far exceeded what occurred in normal aging; in male 3xTg mice, these changes occurred earlier but to the same degree as male controls. In contrast, changes in OFF RGC responses were consistent with normal aging in female 3xTg mice. However, OFF RGC responses seemed to be more strongly influenced by genotype in male mice, with male 3xTg mice experiencing both earlier and greater N2 amplitude reductions than aging male controls. Representative PERG waveform data for female and male mice of each strain and age-group are depicted in Fig. 3C.
3.9Full-field fERG confirms integrity of inner retinal cell function in 3xTg mice
The potential impact of photoreceptor and bipolar cell inputs on RGC PERG responses was assessed via fERG under photopic conditions. Peak amplitudes and response latencies for a-waves (representing cone photoreceptor activity) and b-waves (representing bipolar cell activity) were compared between genotypes and across the youngest and oldest age groups of mice for each sex strata using univariate ANOVA, and these data are presented in Fig. 4.
Fig. 4
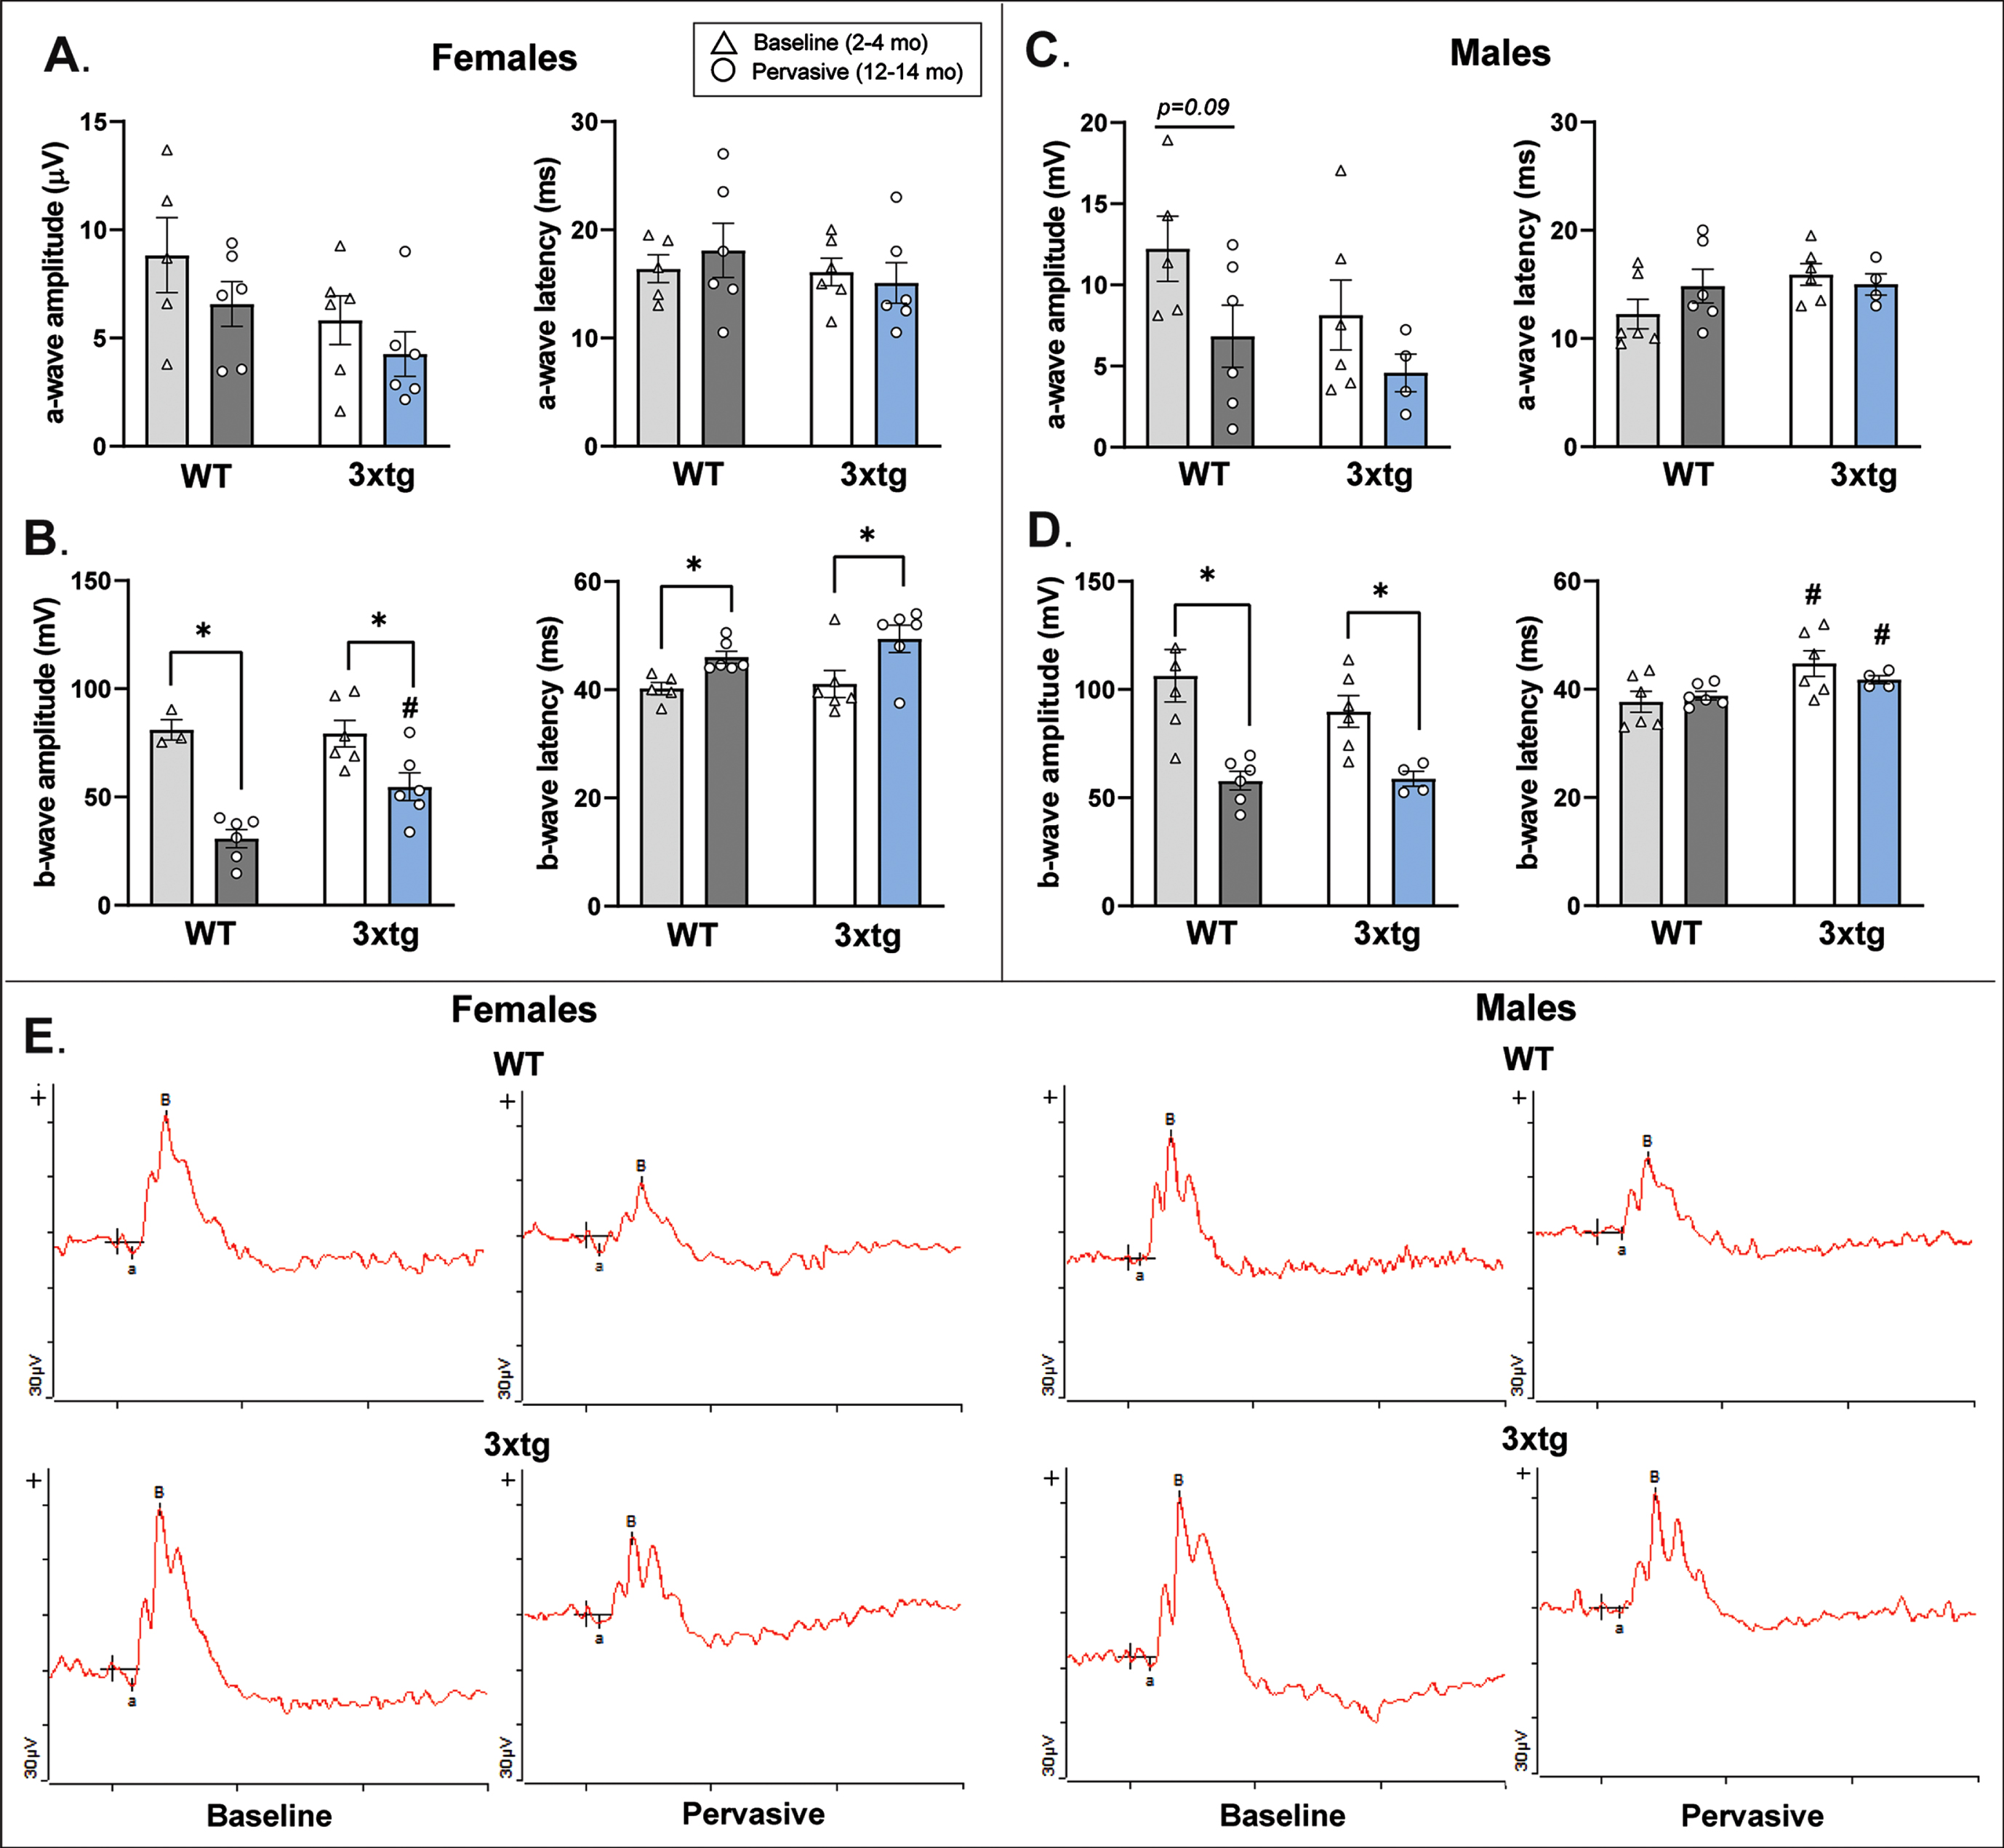
Full field flash electroretinogram (fERG) responses across baseline and the oldest age groups of 3xTg and wildtype (WT) control mice. Mean (bar) and individual (symbol) amplitudes and latencies for a-wave and b-wave fERG responses provide information regarding the functional integrity of inner retinal cells such as cone photoreceptors (a-wave) and bipolar cells (b-wave), as changes in the function of these input cells could influence retinal ganglion cell-based PERG responses. In both female (A) and male (C) 3xTg and C57 samples, there were no significant changes in photoreceptor a-wave response as a function or genotype or age. In female mice (B), b-wave amplitude significantly decreased with age in both genotypes, but in the oldest age group, female 3xTg mice actually demonstrated significantly increased b-wave amplitude relative to WT controls. In male mice (D), b-wave amplitude decreased with age in both genotypes but b-wave latencies were significantly longer in male 3xTg mice across young and old ages. The relevance of this finding is unclear. Overall, these fERG response data suggest that photoreceptor and bipolar cell function is intact in 3xTg mice and do not likely drive the alterations observed in 3xTg PERG response. *indicates significant age differences within genotype (p < 0.05); #indicates significant differences between genotypes in that age category (p < 0.05). Error bars depict s.e.m. Data were collected from 28 mice (n = 3-4 mice per sex/genotype/age group and 1-2 retina per mouse). Representative fERG waveform traces are provided for female and male mice (E).
Female 3xTg mice exhibit normal photoreceptor response amplitudes; aged female 3xTg mice show slightly enhanced bipolar cell responses relative to controls
Female mice did not differ by genotype in a-wave amplitude or latency (Fig. 4A). Both female 3xTg and control mice demonstrated an age-related downward trend in a-wave amplitude which has been shown to be a normal feature of photoreceptor aging in mice [113, 114]. Thus, these results suggest that changes observed in female 3xTg PERG response were not attributable to impaired photoreceptor transduction of light. With regard to bipolar cell function (Fig. 4B), b-wave amplitudes showed normal age-related decreases in both genotypes of female mice (3xTg: F1,10 = 7.45, p = 0.021; control: F1,7 = 53.45, p < 0.001) that were concomitant with increased b-wave response latencies (3xTg: F1,10 = 5.51, p = 0.041; controls: F1,9 = 12.84, p = 0.006). However, one interesting discrepancy between genotypes in bipolar cell function was that in the oldest age group of mice, female 3xTg b-wave amplitude was significantly increased relative to female controls (F1,10 = 9.66, p = 0.01). No genotype differences in b-wave response latency were observed (Fig. 4B). While the increased b-wave amplitude in female 3xTg mice was an intriguing nuance, these results still support both genotypes of mice retaining functional bipolar cells that likely do not account for alterations in female 3xTg PERG response. Examples of fERG waveform data for female mice are provided in Fig. 4E.
Male 3xTg mice exhibit normal photoreceptor and bipolar cell response amplitudes
Male a-wave response amplitudes and latencies were similar to those shown in the female dataset (Fig. 4C), thus confirming integrity of photoreceptor function in both genotypes. Similar to females, male 3xTg (F1,8 = 10.737, p = 0.011) and control mice (F1,10 = 14.374, p = 0.004) exhibited significant but comparable age-related reductions in b-wave amplitudes, also indicating that bipolar cell response did not drive genotype differences in PERG response (Fig. 4D). One difference that was detected was that b-wave latencies were slightly (but significantly) longer in male 3xTg mice compared to controls across both of the tested age groups (Fig. 4D). However, this difference occurred in both baseline-aged (F1,10 = 5.362, p = 0.043) and the oldest age groups (F1,8 = 6.144, p = 0.038) of mice, so it is hard to determine the impact of this finding on changes in RGC function observed only in older male 3xTg mice. Overall, these fERG response data confirm that alterations in male 3xTg RGC signaling measured by PERG (recall Fig. 3) do not likely result from changes in bipolar cell inputs. Examples of fERG waveform data for male mice are provided in Fig. 4E.
Age-related reduction in RGC density is enhanced in 3xTg mice and tracks linearly with decreases in PERG amplitude
A) Female 3xTg mice show earlier, more severe age-related RGC soma loss than controls
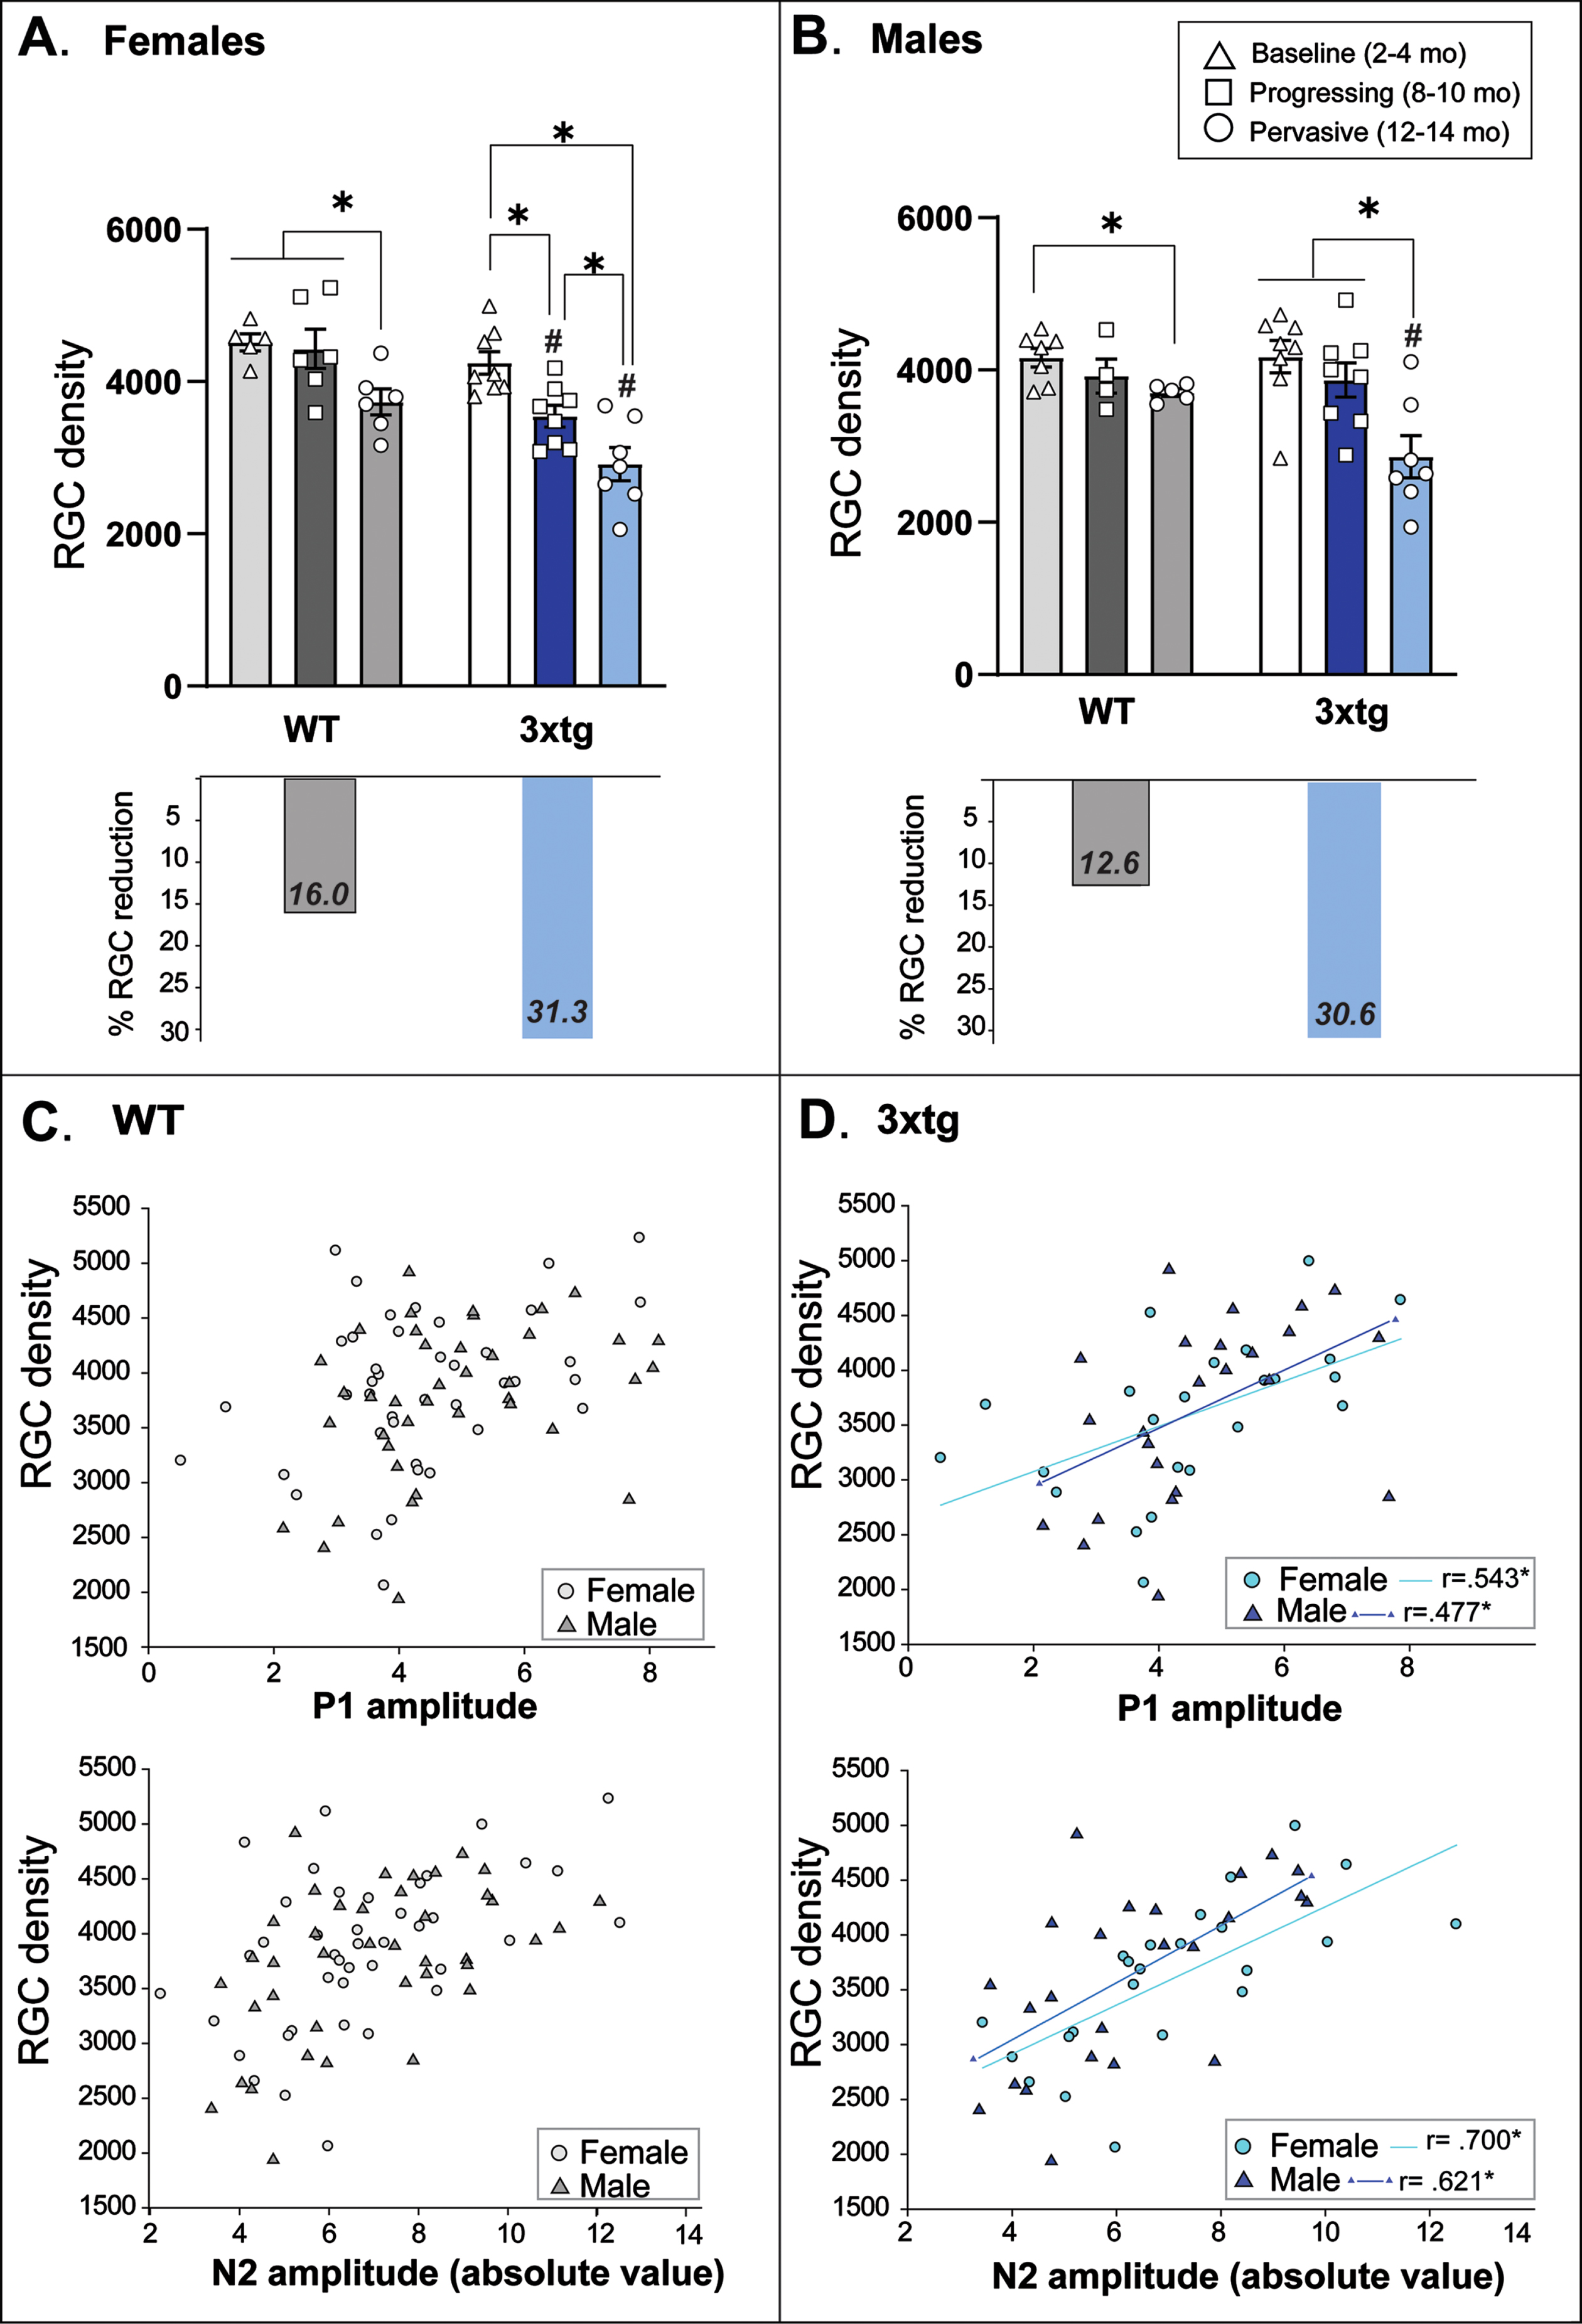
At baseline ages (2–4 months), there were no differences in RGC soma density as a function of mouse genotype for either sex (Fig. 5A, B). However, in 8-10-month-old (F112 = 10.27, p = 0.008) and 12-14-month-old (F1,11 = 8.40, p = 0.014) female mice, 3xTg RGC density was significantly reduced relative to age-matched controls (Fig. 5A). RGC density decreased from baseline in both the intermediate and oldest age groups of female 3xTg mice (F2,20 = 15.30, p < 0.0; p < 0.01 in all post-hoc comparisons). Across the entire tested age-span, female 3xTg mice experienced a 31.3% loss in RGC soma density. This is in contrast to female control mice which only experienced a 16% overall loss in RGCs (Fig. 5A).
Fig. 5
Retinal ganglion cell (RGC) density in 3xTg and wildtype (WT) control mice. Mean (bars) and individual (symbols) RGC densities (computed by total number of RBPMS-positive cells in flat-mount retina divided by total retina area sampled) are plotted for each sex and genotype across pathological stage/age groups. A) Female 3xTg mice experience a significant loss in RGC density as early as 8–10 months of age; normal age-related RGC loss does not appear in WT mice until 12–14 months of age. RGC density did not differ between 3xTg and WT mice at baseline but was significantly reduced in female 3xTg mice at each subsequent age group. Across the entire age-span tested, female 3xTg mice experienced an overall 31.3% loss of RGCs compared to female WT mice which only experience a 16% loss over the same time period. B) Similar to females, male 3xTg and WT mice showed age-related loss of RGCs by the oldest tested age; however, the magnitude of RGC loss was significantly greater in male 3xTg mice. Across the entire age-span tested, male 3xTg mice experienced an overall 30.6% reduction in RGC density compared to a 12.6% reduction in male WT mice across the same time period. *Indicates significant difference between age groups at p < 0.05; #indicates significant difference between genotypes at p < 0.05. Error bars represent s.e.m. C, D) Scatterplots depict RGC density and amplitude for each PERG peak (P1 and N2) in female (circle symbols) and male (triangle symbols) mice across chronological age. 3xTg mice (D) demonstrate moderate to strong linear relationships between RGC density and each peak PERG amplitude; these linear relationships are not present in WT mice (C). Correlation coefficients are presented as Pearson r values. Data were collected from 54 mice (n = 4–6 mice per sex/genotype/age group and 1-2 retina per mouse).
B) Male 3xTg mice show more severe age-related RGC soma loss than controls
As depicted in Fig. 5B, RGC density did not significantly decrease in male 3xTg mice until 12–14 months (F2,21 = 8.67, p = 0.002), coinciding with a normal age-related RGC decrease observed in male C57 control mice (F2,14 = 4.95, p = 0.03; p < 0.01). However, this loss was more severe in male 3xTg mice (30.6%) compared to controls (12.6%; F1,11 = 9.32, p = 0.011).
C) RGC density decreases linearly with PERG amplitude across age in 3xTg mice
Pearson Correlation coefficients were computed to determine whether RGC soma density changed linearly with PERG amplitude across chronological age in mice. In control mice of both sexes, RGC density was not correlated with either PERG peak waveform amplitude (Fig. 5C). However, we found moderately strong positive linear relationships between RGC density and P1 amplitude in both female (r = 0.543, p = 0.007) and male (r = 0.477, p = 0.018) 3xTg mice, and strong positive correlations between RGC density and N2 amplitude in both female (r = –0.700, p = 0.001) and male (r = –0.621, p = 0.001) 3xTg mice (Fig. 5D). Thus, RGC loss coincided with decrements in PERG response across increasing pathological age in 3xTg mice.
RGC axonal transport is impaired early in 3xTg mice and most profoundly in females
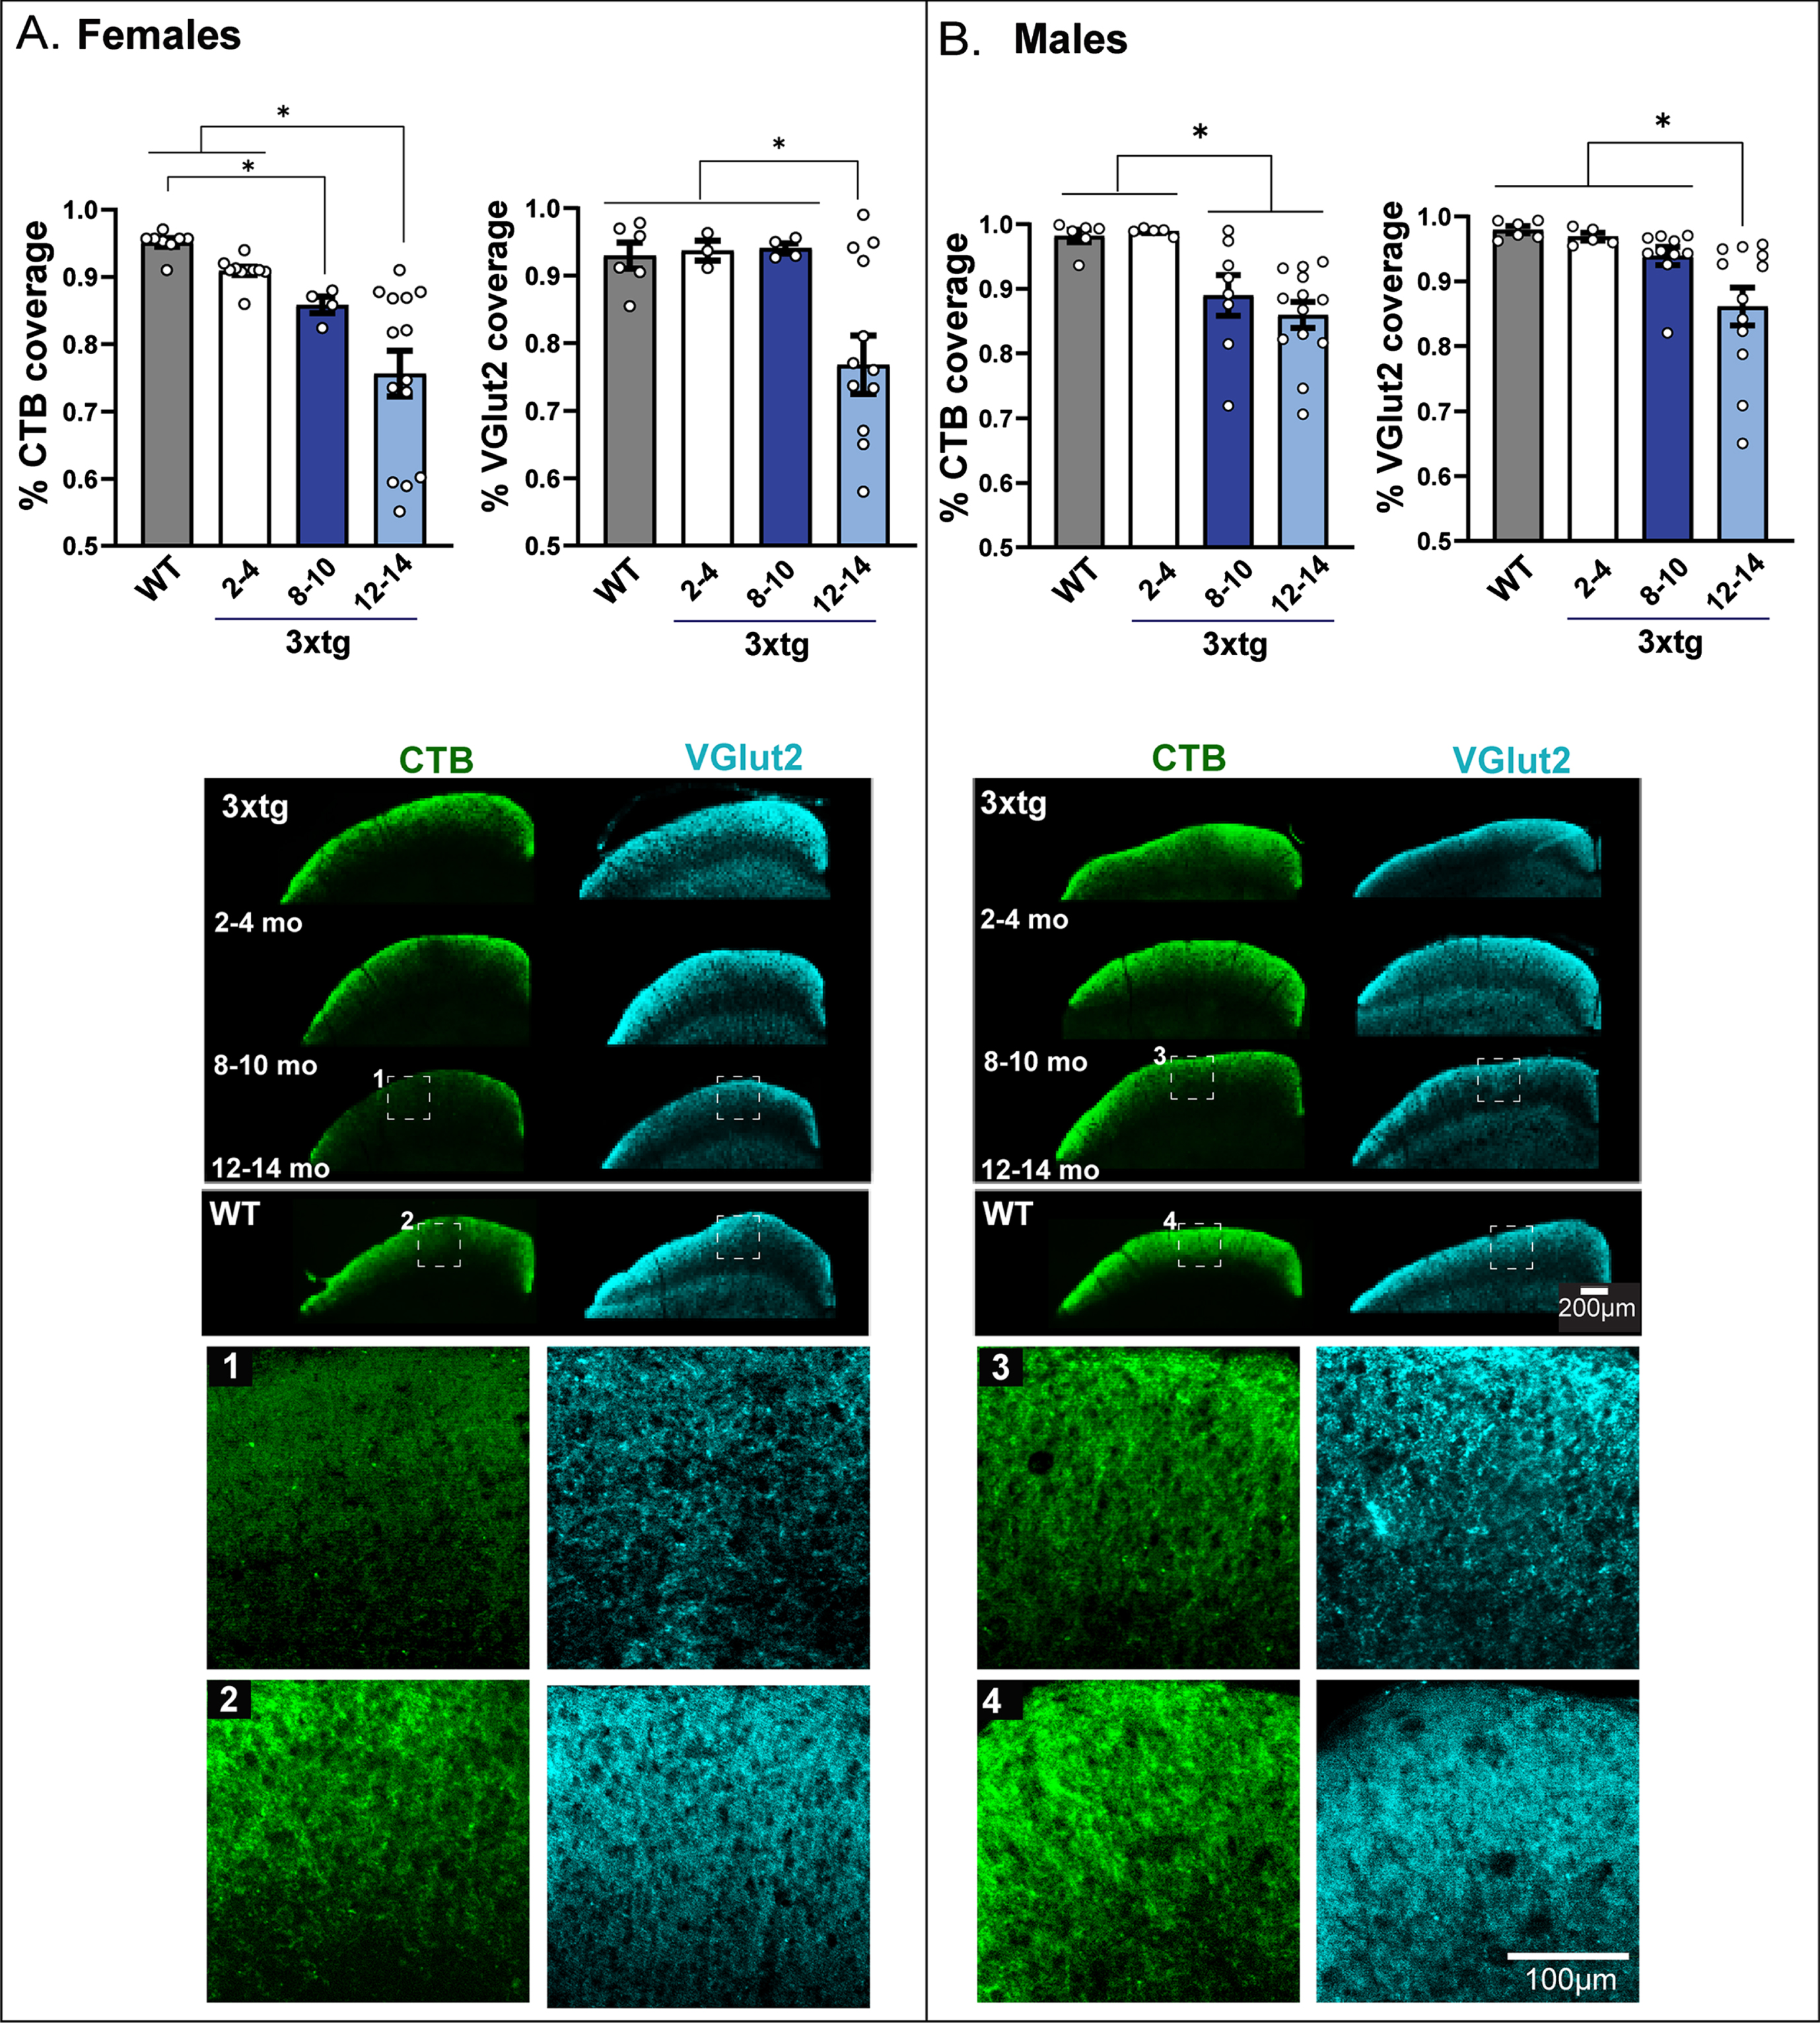
CTB transport from eye to brain was measured to assess integrity of RGC axonal transport along the optic nerve to projection targets in superficial SC. Figure 6 provides graphic depiction of these data along with representative micrographs of CTB-labeled SC. No differences in retinocollicular axonal transport are typically seen across the 2-14-month age-span in control mice [107], and preliminary examination of our data indicated no differences in CTB or VGlut2 label in SC across these ages in C57 mice. Therefore, to consolidate analyses, transport data from the oldest group of control mice (12–14 months) was used as a benchmark comparison for 3xTg mice. Results showed that that axonal transport was intact in both sexes of 3xTg mice at baseline ages relative to aged healthy controls (Fig. 6A, B). However, by 8–10 months, both female (F3,32 = 12.66, p < 0.01; Fig. 6A) and male (F3,31 = 5.41, p = 0.004; Fig. 6B) 3xTg mice exhibited significant reductions in CTB transport compared to baseline 3xTg mice and control benchmark data. Across the entire age-span tested, female 3xTg mice experienced an 18% loss in retinocollicular axon transport compared to a 10% loss respective loss in male 3xTg mice.
Fig. 6
Altered functional and structural integrity of the retinocollicular projection in 3xTg mice. A&B left bar graphs: The integrity of axonal transport along retinal ganglion cell projections between the eye and brain was determined by percent area fraction of intact fluorescent CTB label across the rostrocaudal extent of the superficial superior colliculus (SC). A&B, right bar graphs: The density of intact RGC synaptic terminals was plotted as percent area fraction of VGlut2 fluorescence across the superficial SC. Data are compared across age groups of 3xTg mice; benchmark data from 12-14-month-old wildtype (WT) mice (which do not exhibit transport loss at this age) are presented for comparison. Female 3xTg mice (A, left) show evidence of retinocollicular transport loss as early as 8–10 months of age with maximal loss at 12–14 months. Male 3xTg (B, left) mice show significant transport loss at 8–10 months as well, but unlike their female counterparts, this loss is not exacerbated with age. Overall, female 3xTg mice show a greater maximal transport loss than male 3xTg mice. Both female (A, right) and male (B, right) 3xTg mice showed significant loss of RGC terminals in oldest (12–14 months) age group; but the magnitude of this loss appeared to be greater in females. Asterisks (*) indicate significant difference between groups at p < 0.05. Error bars represent s.e.m. C) Micrographs of coronal SC sections showing coverage of CTB (green) and VGlut2 (blue) label in female and male 3xTg mice across each age group and in comparison to 12–14 months. WT mice that do not show transport or terminal loss at this age. Scale bar = 200μm. Colored bars to the left of micrographs correspond to the age groups coded in the legend above. Representative high magnification micrographs of the boxed areas shown in 1–4 depict staining pattern for CTB and VGlut2 in 12-14-month-old 3xTg (1 and 3) and WT mice (2 and 4). Data are taken from 48 mice (n = 4–7 mice per sex/three age group for 3xg mice; 6 per sex/one age group for controls). Each mouse provides up to 2 retina projection (SC hemifield) data points.
Collicular RGC synaptic density is reduced in the oldest 3xTg mice and most severely in females
Changes in glutamatergic RGC synaptic terminal density in superficial SC were measured by quantifying immunohistochemical labeling of VGlut2. RGC terminal density was significantly reduced in 12-14-month-old female (F2,25 = 4.42, p = 0.014; Fig. 6A) and male (F2,34 = 3.05, p = 0.04; Fig. 6B) 3xTg mice relative to all other age groups and control benchmark data. Across the entire tested age-span, female 3xTg experienced an 18% loss in RGC terminals; in contrast, this loss only amounted to 8% in male 3xTg mice.
DISCUSSION
Our data support a relationship between retinal Aβ accumulation and compromised retinofugal pathway integrity across increasing disease stages in 3xTg-AD mice. These findings provide further evidence that the visual system may be subject to damage by AD pathogenesis, and that deficits in visual function may provide additional information on AD progression [22, 23, 87–95].
In this study, we observed discrete functional changes in 3xTg mouse eye-brain communication that were more clinically consistent with the subtle, specific changes in visual response reported in early-stage AD patients [96]. These findings are in contrast to other reports of visual system changes in 3xTg mice which show extensive impairments in retinofugal integrity that may not approximate the more subtle deficits observed in clinical populations [51, 116, 117]. Differences between these and our results may stem from variations in 3xTg genotype, as the study by Chiasseu and colleagues reported that their 3xTg mice produced wildtype littermates; however, the standard 3xTg genotype used by our laboratory and others breeds true and does not produce WT siblings [53, 76, 78, 82]. Our findings are important because the clinical presentation of visual system changes in AD rarely involve large-scale visual impairments or blindness; most are manifested as decreases in visual acuity and visual field [7], loss of contrast sensitivity [97], impaired visual attention [98], altered color sensitivity [13], impaired object or face recognition [99], and/or increased saccade latency when orienting to visual stimuli [19, 100]. While these visual disturbances are not profoundly disabling, they can significantly decrease quality of life in dementia patients [101, 102] and potentially exacerbate cognitive deficits by blunting sensory input that would normally facilitate recognition [13, 19]. While it is hard to determine the impact of such subtle visual deficits on 3xTg mice given their overall low visual acuity, any decrements in retinal communication of visual information to the brain could potentially disrupt visually-driven behaviors; for example, escape responses to threatening (i.e., looming) stimuli [103, 104].
As such, the major findings of our study showed discernable impairments in 3xTg RGC function (as measured by PERG) that exceeded normal age-related decreases in retinal function experienced by healthy control mice. Deficits in PERG response have been previously reported in pre-clinical [96] and early-symptomatic AD patients [64] as reduced peak amplitudes and increased peak latencies [12, 43, 44, 46, 107]. In this study, significant reductions in PERG P1 and N2 amplitudes occurred at younger ages in 3xTg mice, and with greater severity than age-matched controls. These perturbations in 3xTg mouse RGC function did not likely result from upstream loss of outer retinal cell input to RGCs, as our fERG data confirmed that 3xTg mice exhibited normal photoreceptor responses [105, 106]. Additionally, fERG data indicated that both 3xTg and control mice exhibited normal age-related changes in the function of bipolar cells—the interneurons conveying visual signals between photoreceptors and RGCs [114]. While we observed some minor differences between 3xTg and control mice bipolar cell signaling—such as increased b-wave amplitude in the oldest female 3xTg mice compared to controls [68], these minor alterations could not account for the enhanced age-related decrements in PERG response shown among 3xTg mice, nor the sex-specific manner in which these decrements presented (recall Fig. 4). Other research groups such as Chiquita et al. [68] observed similar findings of increased photopic b-wave amplitudes in 4-12-month-old 3xTg mice relative to controls and overall increased b-wave latencies in male 3xTg mice across all ages and did not find that these alterations impacted PERG.
Reduction in PERG amplitude can be indicative of decreased RGC function or overt loss of RGCs [88, 127–129]. As such, our data revealed a strong linear relationship between decreased RGC density and PERG amplitude reduction (including P1 and N2 peaks) across all ages of both female and male 3xTg mice. This relationship was not observed in healthy control mice—even though the oldest control mice exhibited modest but significant RGC loss (13–16%) from baseline age—a finding consistent with normal aging shown in other studies [88]. In contrast, both female and male 3xTg mice experienced a steady, significant decline in RGC density at earlier ages than controls that resulted in a 31% loss in RGCs across the entire observed age-span of the study.
In healthy control mice, retinofugal axonal transport remains intact with aging [107]. In contrast, 3xTg mice experienced significant reductions in RGC transport between soma and superficial SC as early as 8–10 months of age. Axonal transport deficits are reported early in the progression of other neurodegenerative disorders such as multiple sclerosis [130], amyotrophic lateral sclerosis [131], and glaucoma [93, 107]. In glaucoma, retinofugal transport deficits precede loss of RGC structure, with pathological changes first occurring distally in the SC and then progressing back towards RGC soma in the retina [80, 113–116]. In 3xTg mice, transport deficits coincided with but did not precede significant RGC loss, indicating that dysfunctional changes likely arise either from the retina itself, or simultaneously within retina and its distal projection targets in the brain. This supports the idea that retinal Aβ is an early influencer of pathology that may eventually occur along the distal RGC projection. Supporting this, our research group recently showed that intravitreal injections of Aβ42 oligomers in wildtype mice triggered pathological inflammatory changes that began in the retina but over time, extended to optic nerve, SC, and even visual cortex [46].
While we detected changes in retinal amyloid levels across increasing disease stage in 3xTg mice, our assays were limited in that they did not differentiate soluble Aβ42 oligomers from insoluble fibrils, so we cannot fully ascertain the specific pathogenic impact of these findings [148]. However, the role of specific amyloid species and assemblies in the visual system are not fully understood. Some studies have indicated that soluble amyloid oligomers are more neurotoxic in the retina than insoluble fibrils—which are often observed in relatively low levels in this structure [110, 136]. Other studies indicate that multiple amyloid configurations can exert deleterious effects on the visual system [34], and recent work has even shown the characteristically “less neurotoxic” Aβ40 fragment is the most abundantly expressed form in and around retinal vasculature in early disease stages [137]. This is important because perivascular Aβ—throughout the brain—is shown to damage capillary endothelium and impair the blood-brain barrier [35, 138]. Thus, the highly vascularized retina may be an especially vulnerable site for early emergence of AD pathology [35].
The relevance of this study’s sex-divergent findings on retinal function in 3xTg mice must be emphasized in light of an increasing body of research identifying sex differences in disease mechanisms among animal models of AD [139]. Clinical studies were the first to emphasize the importance of sex-divergent patterns in AD incidence, presentation, and treatment response as critical to the mechanistic etiology of dementia. Women are disproportionately diagnosed with AD [140] and are shown to carry greater pathological burdens [141]; phenotype severity is often greater in female AD mice, including the 3xTg strain used in the current study [79, 82, 139, 142]. In the current study, we observed notable sex differences in PERG that may be supported by sex-specific vulnerability of specific RGC populations. Our data showed that female 3xTg mice had greater P1 amplitude reductions than males, while male 3xTg mice showed larger decrements in N2 amplitude. Each peak amplitude in the PERG waveform represents the activity of different RGC subpopulations: P1 is generated by RGCs that fire in response to the onset of light (i.e., ON cells), and N2 largely represents the activity of “OFF” RGCs that fire in response to offset or decrease in illumination [102]. Thus, sex differences in PERG amplitude responses of 3xTg mice could be driven by damage to specific RGC populations [102]. The idea of selective vulnerability of RGC subtypes to AD pathology is not new. Aβ deposition is shown to be distributed more in superior and inferior retinal quadrants [29], and melanopsin RGCs which are involved in regulating circadian rhythm are shown to be exceptionally vulnerable to AD pathology [23]. A potential explanation for this selective RGC vulnerability may be supported by recent compelling data published on intrinsic, genetic-based sex differences in AD mouse model receptor function [71]. Abd-Elrahman and colleagues [71] found that mGluR in the brains of APP/PS1 AD model mice respond to pathological Aβ in a highly sex-specific manner. Specifically, mGluR5 from male APP/PS1 mice pathologically bind to Aβ oligomers, whereas female APP/PS1 mGluR5 do not. This impacted therapeutic response to mGluR5 antagonism, reducing Aβ burden in male but not female APP/PS1 mice [71]. With regard to the retina [86], ON and OFF RGCs express different types of glutamate receptors (GluRs): for ON cells, they are metabotropic (m) GluR6, and for OFF cells, they are ionotropic AMPA/kainate GluRs [143]. While a direct analogy cannot be made between mGluR5 and retina-specific mGluR6 pharmacology (i.e., they signal via different downstream pathways), the findings of Abd-Elrahman’s [71] pivotal study are provocative and would support the idea of sex-specific Aβ vulnerability of RGC subtypes.
While the current study focused on the the impact of Aβ in the visual system, we recognize that neurofibrillary tau pathology has an important impact on visual function in AD as well [144]. Other studies have shown tau accumulations and neurofibrillary tangles in postmortem retinas from AD patients [28] as well as in AD mouse retina [28, 51, 67]. Therefore, it is possible that amyloid peptides, tau fibrils, and inflammatory pathology have synergistic effects on retinal function; but from a biomarker perspective, retinal amyloid is currently best characterized in temporal association with changes to RGC function. Future work would benefit by expanding characterization to additional models and pathology forms.
In conclusion, our study contributes to the foundational knowledge on the consequences of ocular pathology on retinal function in AD. Our data provide evidence of clinically-relevant alterations in retinal communication to the brain in 3xTg mice that exceed normal age-related decreases in retinal signaling observed in control mice. Additionally, this study illuminated sex-specific patterns in the onset and severity of functional RGC deficits in 3xTg mice–findings that have clinical relevance to the increasing number of reports on sexually-divergent symptom presentations, pathological burdens, and responses to potential therapeutics that are emerging from clinical and experimental research on AD and other forms of dementia. Studies of the impact of AD pathology on the visual system may provide a unique vantage point for identifying new ways to diagnose early disease changes and fuel support for precision medicine approaches to deploy preventative and therapeutic strategies for specific patient subpopulations at greatest risk for dementia.
ACKNOWLEDGMENTS
We would like to thank Katie Bretland and Dr. Sarah Terrill for proofreading the manuscript, Dr. Emily Simons for her technical support with optimizing the PERG apparatus, and Sohi Mistry and Koshala Selvakumar for assisting with initial data collection. This work was supported by Prevent Blindness Ohio and Ohio Lions Eye Research Foundation Fellowships to G.F., an Ohio Lions Eye Research Grant to C.M.D.C., and departmental start-up funds to C.M.D.C.
Authors’ disclosures available online (https://www.j-alz.com/manuscript-disclosures/22-0016r1).
SUPPLEMENTARY MATERIAL
[1] The supplementary material is available in the electronic version of this article: https://dx.doi.org/10.3233/JAD-220016.
REFERENCES
[1] | Brookmeyer R , Johnson E , Ziegler-Graham K , Arrighi HM ((2007) ) Forecasting the global burden of Alzheimer’s disease. Alzheimers Dement 3: , 186–191. |
[2] | Hickman RA , Faustin A , Wisniewski T ((2016) ) Alzheimer disease and its growing epidemic: Risk factors, biomarkers, and the urgent need for therapeutics. Neurol Clin 34: , 941–953. |
[3] | Devanand DP , Liu X , Tabert MH , Pradhaban G , Cuasay K , Bell K , de Leon MJ , Doty RL , Stern Y , Pelton GH ((2008) ) Combining early markers strongly predicts conversion from mild cognitive impairment to Alzheimer’s disease. Biol Psychiatry 64: , 871–879. |
[4] | Gates GA , Anderson ML , Feeney MP , McCurry SM , Larson EB ((2008) ) Central auditory dysfunction in older persons with memory impairment or Alzheimer dementia. Arch Otolaryngol Head Neck Surg 134: , 771–777. |
[5] | Lin FR , Metter EJ , O’Brien RJ , Resnick SM , Zonderman AB , Ferrucci L ((2011) ) Hearing loss and incident dementia. Arch Neurol 68: , 214–220. |
[6] | Armstrong R , Kergoat H ((2015) ) Oculo-visual changes and clinical considerations affecting older patients with dementia. Ophthalmic Physiol Opt 35: , 352–376. |
[7] | Cogan DG ((1985) ) Visual disturbances with focal progressive dementing disease. Am J Ophthalmol 100: , 68–72. |
[8] | Hinton DR , Sadun AA , Blanks JC , Miller CA ((1986) ) Optic-nerve degeneration in Alzheimer’s disease. N Engl J Med 315: , 485–487. |
[9] | Rizzo M , Anderson SW , Dawson J , Nawrot M ((2000) ) Vision and cognition in Alzheimer’s disease. Neuropsychologia 38: , 1157–1169. |
[10] | Cronin-Golomb A , Rizzo JF , Corkin S , Growdon JH ((1991) ) Visual function in Alzheimer’s disease and normal aging. Ann N Y Acad Sci 640: , 28–35. |
[11] | Katz B , Rimmer S ((1989) ) Ophthalmologic manifestations of Alzheimer’s disease. Surv Ophthalmol 34: , 31–43. |
[12] | Cronin-Golomb A , Corkin S , Rizzo JF , Cohen J , Growdon JH , Banks KS ((1991) ) Visual dysfunction in Alzheimer’s disease: Relation to normal aging. Ann Neurol 29: , 41–52. |
[13] | Polo V , Rodrigo MJ , Garcia-Martin E , Otin S , Larrosa JM , Fuertes MI , Bambo MP , Pablo LE , Satue M ((2017) ) Visual dysfunction and its correlation with retinal changes in patients with Alzheimer’s disease. Eye 31: , 1034–1041. |
[14] | Risacher SL , WuDunn D , Pepin SM , MaGee TR , McDonald BC , Flashman LA , Wishart HA , Pixley HS , Rabin LA , Paré N , Englert JJ , Schwartz E , Curtain JR , West JD , O’Neill DP , Santulli RB , Newman RW , Saykin AJ ((2013) ) Visual contrast sensitivity in Alzheimer’s disease, mild cognitive impairment, and older adults with cognitive complaints. Neurobiol Aging 34: , 1133–1144. |
[15] | Sadun AA , Borchert M , DeVita E , Hinton DR , Bassi CJ ((1987) ) Assessment of visual impairment in patients with Alzheimer’s disease. Am J Ophthalmol 104: , 113–120. |
[16] | Salobrar-Garcia E , De Hoz R , Rojas B , Ramirez AI , Salazar JJ , Yubero R , Gil P , Triviño A , Ramirez JM ((2015) ) Ophthalmologic psychophysical tests support OCT findings in mild Alzheimer’s disease. J Ophthalmol 2015: , 736949. |
[17] | Salamone G , Di Lorenzo C , Mosti S , Lupo F , Cravello L , Palmer K , Musicco M , Caltagirone C ((2009) ) Color discrimination performance in patients with Alzheimer’s disease. Dement Geriatr Cogn Disord 27: , 501–507. |
[18] | Liu Y , Feng D , Wang H ((2019) ) Distinct forms of motion sensitivity impairments in Alzheimer’s disease. Sci Rep 9: , 12931. |
[19] | Rizzo M , Nawrot M ((1998) ) Perception of movement and shape in Alzheimer’s disease. Brain 121: , 2259–2270. |
[20] | Gilmore GC , Wenk HE , Naylor LA , Koss E ((1994) ) Motion perception and Alzheimer’s disease. , P. J Gerontol 49: , 52–57. |
[21] | Hutton JT , Nagel JA , Loewenson RB ((1984) ) Eye tracking dysfunction in Alzheimer-type dementia. Neurology 34: , 99–102. |
[22] | Mendez MF , Cherrier MM , Meadows RS ((1996) ) Depth perception in Alzheimer’s disease. Percept Mot Skills 85: , 987–995. |
[23] | La Morgia C , Ross-Cisneros FN , Koronyo Y , Hannibal J , Gallassi R , Cantalupo G , Sambati L , Pan BX , Tozer KR , Barboni P , Provini F , Avanzini P , Carbonelli M , Pelosi A , Chui H , Liguori R , Baruzzi A , Koronyo-Hamaoui M , Sadun AA , Carelli V ((2016) ) Melanopsin retinal ganglion cell loss in Alzheimer disease. Ann Neurol 79: , 90–109. |
[24] | Jackson GR , Owsley C ((2003) ) Visual dysfunction, neurodegenerative diseases, and aging. Neurol Clin 21: , 709–728. |
[25] | Molitor RJ , Ko PC , Ally BA ((2015) ) Eye movements in Alzheimer’s disease. J Alzheimers Dis 44: , 1–12. |
[26] | Blanks JC , Schmidt SY , Torigoe Y , Porrello KV , Hinton DR , Blanks RHI ((1996) ) Retinal pathology in Alzheimer’s disease. II. Regional neuron loss and glial changes in GCL. Neurobiol Aging 17: , 385–395. |
[27] | den Haan J , Morrema THJ , Verbraak FD , de Boer JF , Scheltens P , Rozemuller AJ , Bergen AAB , Bouwman FH , Hoozemans JJ , Morrema J TH , Verbraak FD , de Boer JF , Scheltens P , Rozemuller AJ , Bergen B AA , Bouwman FH , Hoozemans JJ ((2018) ) Amyloid-beta and phosphorylated tau in post-mortem Alzheimer’s disease retinas. Acta Neuropathol Commun 6: , 147. |
[28] | Koronyo Y , Biggs D , Barron E , Boyer DS , Pearlman JA , Au WJ , Kile SJ , Blanco A , Fuchs DT , Ashfaq A , Frautschy S , Cole GM , Miller CA , Hinton DR , Verdooner SR , Black KL , Koronyo-Hamaoui M ((2017) ) Retinal amyloid pathology and proof-of-concept imaging trial in Alzheimer’s disease. JCI Insight 2: , e93621. |
[29] | Koronyo-Hamaoui M , Koronyo Y , Ljubimov A V , Miller CA , Ko MK , Black KL , Schwartz M , Farkas DL ((2011) ) Identification of amyloid plaques in retinas from Alzheimer’s patients and noninvasive in vivo optical imaging of retinal plaques in a mouse model. Neuroimage 54: (Suppl 1), S204–217. |
[30] | Snyder PJ , Snyder HM , Bain LJ ((2020) ) Retinal imaging think tank convened by the Alzheimer’s Association to examine its promise in the early detection of Alzheimer’s. Alzheimers Dement 16: , 244–244. |
[31] | Dumitrascu OM , Lyden PD , Torbati T , Sheyn J , Sherzai A , Sherzai D , Sherman DS , Rosenberry R , Cheng S , Johnson KO , Czeszynski AD , Verdooner S , Frautschy S , Black KL , Koronyo Y , Koronyo-Hamaoui M ((2020) ) Sectoral segmentation of retinal amyloid imaging in subjects with cognitive decline. Alzheimers Dement (Amst) 12: , e12109. |
[32] | More SS , Beach JM , Vince R ((2016) ) Early detection of amyloidopathy in Alzheimer’s mice by hyperspectral endoscopy. Investig Ophthalmol Vis Sci 57: , 3231–3238. |
[33] | Criscuolo C , Cerri E , Fabiani C , Capsoni S , Cattaneo A , Domenici L ((2018) ) The retina as a window to early dysfunctions of Alzheimer’s disease following studies with a 5xFAD mouse model. Neurobiol Aging 67: , 181–188. |
[34] | Habiba U , Descallar J , Kreilaus F , Adhikari UK , Kumar S , Morley JW , Bui BV , Hamaoui MK , Tayebi M ((2021) ) Detection of retinal and blood Aβ oligomers with nanobodies. Alzheimers Dement (Amst) 13: , e12193. |
[35] | Shi H , Koronyo Y , Rentsendorj A , Regis GC , Sheyn J , Fuchs DT , Kramerov AA , Ljubimov A V , Dumitrascu OM , Rodriguez AR , Barron E , Hinton DR , Black KL , Miller CA , Mirzaei N , Koronyo-Hamaoui M ((2020) ) Identification of early pericyte loss and vascular amyloidosis in Alzheimer’s disease retina. Acta Neuropathol 139: , 813–836. |
[36] | Lee S , Jiang K , McIlmoyle B , To E , Xu Q , Hirsch-Reinshagen V , Mackenzie IR , Hsiung GYR , Eadie BD , Sarunic MV , Beg MF , Cui JZ , Matsubara JA ((2020) ) Genetic variability in response to amyloid beta deposition influences Alzheimer’s disease risk. Front Neurosci 14: , 758. |
[37] | Schultz N , Byman E , Wennström M ((2020) ) Levels of retinal amyloid-β correlate with levels of retinal IAPP and hippocampal amyloid-β in neuropathologically evaluated individuals. J Alzheimers Dis 73: , 1201–1209. |
[38] | Shi H , Koronyo Y , Rentsendorj A , Fuchs DT , Sheyn J , Black KL , Mirzaei N , Koronyo-Hamaoui M ((2021) ) Retinal vasculopathy in Alzheimer’s disease. Front Neurosci 15: , 731614. |
[39] | Sharafi SM , Sylvestre JP , Chevrefils C , Soucy JP , Beaulieu S , Pascoal TA , Arbour JD , Rhéaume MA , Robillard A , Chayer C , Rosa-Neto P , Mathotaarachchi SS , Nasreddine ZS , Gauthier S , Lesage F ((2019) ) Vascular retinal biomarkers improves the detection of the likely cerebral amyloid status from hyperspectral retinal images. Alzheimers Dement (N Y) 5: , 610–617. |
[40] | Dumitrascu OM , Rosenberry R , Sherman DS , Khansari MM , Sheyn J , Torbati T , Sherzai A , Sherzai D , Johnson KO , Czeszynski AD , Verdooner S , Black KL , Frautschy S , Lyden PD , Shi Y , Cheng S , Koronyo Y , Koronyo-Hamaoui M ((2021) ) Retinal venular tortuosity jointly with retinal amyloid burden correlates with verbal memory loss: A pilot study. Cells 10: , 2926. |
[41] | Edwards MM , Rodríguez JJ , Gutierrez-Lanza R , Yates J , Verkhratsky A , Lutty GA ((2014) ) Retinal macroglia changes in a triple transgenic mouse model of Alzheimer’s disease. Exp Eye Res 127: , 252–260. |
[42] | Song G , Steelman ZA , Finkelstein S , Yang Z , Martin L , Chu KK , Farsiu S , Arshavsky VY , Wax A ((2020) ) Multimodal coherent imaging of retinal biomarkers of Alzheimer’s disease in a mouse model. Sci Rep 10: , 7912. |
[43] | Tadokoro K , Yamashita T , Kimura S , Nomura E , Ohta Y , Omote Y , Takemoto M , Hishikawa N , Morihara R , Morizane Y , Abe K , Ono K ((2021) ) Retinal amyloid imaging for screening Alzheimer’s disease. J Alzheimers Dis 83: , 927–934. |
[44] | Blanks JC , Hinton DR , Sadun AA , Miller CA ((1989) ) Retinal ganglion cell degeneration in Alzheimer’s disease. Brain Res 501: , 364–372. |
[45] | Sadun AA , Bassi CJ ((1989) ) Optic nerve damage in Alzheimer’s disease. Opthalmology 97: , 9–17. |
[46] | Simons ES , Smith MA , Dengler-Crish CM , Crish SD ((2021) ) Retinal ganglion cell loss and gliosis in the retinofugal projection following intravitreal exposure to amyloid-beta. Neurobiol Dis 147: , 105146. |
[47] | Iseri PK , Altinaş Ö , Tokay T , Yüksel N ((2006) ) Relationship between cognitive impairment and retinal morphological and visual functional abnormalities in Alzheimer disease. J Neuroophthalmology 26: , 18–24. |
[48] | Rawlyk B , Chauhan BC ((2021) ) Retinal ganglion cell loss in postmortem tissue of Alzheimer disease, glaucoma, and healthy normal subjects. Can J Ophthalmol 56: , e66–e70. |
[49] | Blanks JC , Torigoe Y , Hinton DR , Blanks RHI ((1996) ) Retinal pathology in Alzheimer’s disease. I. Ganglion cell loss in foveal/parafoveal retina. Neurobiol Aging 17: , 377–384. |
[50] | Alexandrov PN , Pogue A , Bhattacharjee S , Lukiw WJ ((2011) ) Retinal amyloid peptides and complement factor H in transgenic models of Alzheimer’s disease. Neuroreport 22: , 623–627. |
[51] | Grimaldi A , Brighi C , Peruzzi G , Ragozzino D , Bonanni V , Limatola C , Ruocco G , Di Angelantonio S ((2018) ) Inflammation, neurodegeneration and protein aggregation in the retina as ocular biomarkers for Alzheimer’s disease in the 3xTg-AD mouse model. Cell Death Dis 9: , 685. |
[52] | Larson J , Lynch G , Games D , Seubert P ((1999) ) Alterations in synaptic transmission and long-term potentiation in hippocampal slices from young and aged PDAPP mice. Brain Res 840: , 23–35. |
[53] | Oddo S , Caccamo A , Shepherd JD , Murphy MP , Golde TE , Kayed R , Metherate R , Mattson MP , Akbari Y , Laferla FM ((2003) ) Triple-transgenic model of Alzheimer’s Disease with plaques and tangles: Intracellular Aβ and synaptic dysfunction. Neuron 39: , 409–421. |
[54] | Styr B , Slutsky I ((2018) ) Imbalance between firing homeostasis and synaptic plasticity drives early-phase Alzheimer’s disease. Nat Neurosci 21: , 463–473. |
[55] | Müller-Thomsen L , Borgmann D , Morcinek K , Schröder S , Dengler B , Moser N , Neumaier F , Schneider T , Schröder H , Huggenberger S ((2020) ) Consequences of hyperphosphorylated tau on the morphology and excitability of hippocampal neurons in aged tau transgenic mice. Neurobiol Aging 93: , 109–123. |
[56] | Sharma P , Sample PA , Zangwill LM , Schuman JS ((2008) ) Diagnostic tools for glaucoma detection and management. Surv Ophthalmol 53: Suppl1(SUPPL1), S17–32. |
[57] | Porciatti V , Saleh M , Nagaraju M ((2007) ) The pattern electroretinogram as a tool to monitor progressive retinal ganglion cell dysfunction in the DBA/2J mouse model of glaucoma. Investig Ophthalmol Vis Sci 48: , 745–751. |
[58] | Santina Della L , Inman DM , Lupien CB , Horner PJ , Wong ROL ((2013) ) Differential progression of structural and functional alterations in distinct retinal ganglion cell types in a mouse model of glaucoma. J Neurosci 33: , 17444–17457. |
[59] | Chang RCA , Shi L , Huang CCY , Kim AJ , Ko ML , Zhou B , Ko GYP ((2015) ) High-fat diet—induced retinal dysfunction. Investig Ophthalmol Vis Sci 56: , 2367–2380. |
[60] | Rajagopal R , Bligard GW , Zhang S , Yin L , Lukasiewicz P , Semenkovich CF ((2016) ) Functional deficits precede structural lesions in mice with high-fat diet-induced diabetic retinopathy. Diabetes 65: , 1072–1084. |
[61] | Smith MA , Plyler ES , Dengler-Crish CM , Meier J , Crish SD ((2018) ) Nodes of ranvier in glaucoma. Neuroscience 390: , 104–118. |
[62] | Risner ML , Pasini S , Cooper ML , Lambert WS , Calkins DJ ((2018) ) Axogenic mechanism enhances retinal ganglion cell excitability during early progression in glaucoma. Proc Natl Acad Sci U S A 115: , E2393–E2402. |
[63] | Katz B , Rimmer S , Iragui V , Katzman R ((1989) ) Abnormal pattern electroretinogram in Alzheimer’s disease: Evidence for retinal ganglion cell dysfunction? . Ann Neurol 26: , 221–225. |
[64] | Krasodomska K , Lubinski W , Lubinski L , Potemkowski A , Honczarenko K ((2010) ) Pattern electroretinogram (PERG) and pattern visual evoked potential (PVEP) in the early stages of Alzheimer’s disease. Doc Ophthalmol 121: , 111–121. |
[65] | Nesher R , Trick GL ((1991) ) The pattern electroretinogram in retinal and optic nerve disease - A quantitative comparison of the pattern of visual dysfunction. Doc Ophthalmol 77: , 225–235. |
[66] | Trick GL , Nesher R , Cooper DG , Shields SM ((1992) ) The human pattern ERG: Alteration of response properties with aging. Optom Vis Sci 69: , 122–128. |
[67] | Chiasseu M , Alarcon-Martinez L , Belforte N , Quintero H , Dotigny F , Destroismaisons L , Velde Vande C , Panayi F , Louis C , Di Polo A ((2017) ) Tau accumulation in the retina promotes early neuronal dysfunction and precedes brain pathology in a mouse model of Alzheimer’s disease. Mol Neurodegener 12: , 58. |
[68] | Chiquita S , Rodrigues-Neves AC , Baptista FI , Carecho R , Moreira PI , Castelo-Branco M , Ambrósio AF ((2019) ) The retina as a window or mirror of the brain changes detected in Alzheimer’s disease: Critical aspects to unravel. Mol Neurobiol 58: , 5416–5435. |
[69] | King JL , Wong AA , Brown RE ((2018) ) Age-related changes in the spatial frequency threshold of male and female 3xTg-ad mice using optomotry. J Alzheimers Dis 62: , 591–596. |
[70] | Ngoo QZ , Wan Hitam WH , Ab Razak A ((2019) ) Evaluation of retinal nerve fiber layer thickness, electroretinogram and visual evoked potential in patients with Alzheimer’s disease. J Ophthalmol 2019: , 6248185. |
[71] | Abd-Elrahman KS , Albaker A , de Souza JM , Ribeiro FM , G SM , Tiberi M , Hamilton A , Ferguson SSG ((2020) ) Aβ oligomers induce pathophysiological mGluR5 signaling in Alzheimer’s disease model mice in a sex-selective manner. Sci Signal 13: , eabd2494. |
[72] | Filon JR , Intorcia AJ , Sue LI , Vazquez Arreola E , Wilson J , Davis KJ , Sabbagh MN , Belden CM , Caselli RJ , Adler CH , Woodruff BK , Rapscak SZ , Ahern GL , Burke AD , Jacobson S , Shill HA , Driver-Dunckley E , Chen K , Reiman EM , Beach TG , Serrano GE ((2016) ) Gender differences in Alzheimer disease: Brain atrophy, histopathology burden, and cognition. J Neuropathol Exp Neurol 75: , 748–754. |
[73] | Koran MEI , Wagener M , Hohman TJ ((2017) ) Sex differences in the association between AD biomarkers and cognitive decline. Brain Imaging Behav 11: , 205–213. |
[74] | Holland D , Desikan RS , Dale AM , McEvoy LK ((2013) ) Higher rates of decline for women and apolipoprotein e ɛ4 carriers. Am J Neuroradiol 34: , 2287–2293. |
[75] | Salobrar-García E , Rodrigues-Neves AC , Ramírez AI , De Hoz R , Fernández-Albarral JA , López-Cuenca I , Ramírez JM , Ambrósio AF , Salazar JJ ((2020) ) Microglial activation in the retina of a triple-transgenic Alzheimer’s disease mouse model (3xTg-AD). Int J Mol Sci Artic 21: , 816. |
[76] | Belfiore R , Rodin A , Ferreira E , Velaquez R , Branca C , Caccamo A , Oddo S ((2019) ) Temporal and regional progression of Alzheimer’s disease-like pathology in 3xTg-AD mice. Aging Cell 18: , e12873. |
[77] | Billings LM , Oddo S , Green KN , McGaugh JL , LaFerla FM ((2005) ) Intraneuronal Abeta causes the onset of early Alzheimer’s disease-related cognitive deficits in transgenic mice. Neuron 45: , 675–688. |
[78] | Oddo S , Caccamo A , Kitazawa M , Tseng BP , Laferla FM ((2003) ) Amyloid deposition precedes tangle formation in a triple transgenic model of Alzheimer’s disease. Neurobiol Aging 24: , 1063–1070. |
[79] | Carroll JC , Rosario ER , Kreimer S , Villamagna A , Gentzschein E , Stanczyk FZ , Pike CJ ((2010) ) Sex differences in β-amyloid accumulation in 3xTg-AD mice: Role of neonatal sex steroid hormone exposure. Brain Res 1366: , 233–245. |
[80] | Hirata-Fukae C , Li HF , Hoe HS , Gray AJ , Minami SS , Hamada K , Niikura T , Hua F , Tsukagoshi-Nagai H , Horikoshi-Sakuraba Y , Mughal M , Rebeck GW , LaFerla FM , Mattson MP , Iwata N , Saido TC , Klein WL , Duff KE , Aisen PS , Matsuoka Y ((2008) ) Females exhibit more extensive amyloid, but not tau, pathology in an Alzheimer transgenic model. Brain Res 1216: , 92–103. |
[81] | Kapadia M , Mian MF , Michalski B , Azam AB , Ma D , Salwierz P , Christopher A , Rosa E , Zovkic IB , Forsythe P , Fahnestock M , Sakic B ((2018) ) Sex-dependent differences in spontaneous autoimmunity in adult 3xTg-AD mice. J Alzheimers Dis 63: , 1191–1205. |
[82] | Kane AE , Shin S , Wong AA , Fertan E , Faustova NS , Howlett SE , Brown RE ((2018) ) Sex differences in healthspan predict lifespan in the 3xTg-AD Mouse model of Alzheimer’s disease. Front Aging Neurosci 10: , 172. |
[83] | Movsesyan N , Ghochikyan A , Mkrtichyan M , Petrushina I , Davtyan H , Olkhanud PB , Head E , Biragyn A , Cribbs DH , Agadjanyan MG ((2008) ) Reducing AD-like pathology in 3xTg-AD mouse model by DNA epitope vaccine - A novel immunotherapeutic strategy. PLoS One 3: , e2124. |
[84] | Sah SK , Lee C , Jang JH , Park GH ((2017) ) Effect of high-fat diet on cognitive impairment in triple-transgenic mice model of Alzheimer’s disease. Biochem Biophys Res Commun 493: , 731–736. |
[85] | Sterniczuk R , Antle MC , LaFerla FM , Dyck RH ((2010) ) Characterization of the 3xTg-AD mouse model of Alzheimer’s disease: Part 2. Behavioral and cognitive changes. Brain Res 1348: , 149–155. |
[86] | Bevan RJ , Hughes TR , Williams PA , Good MA , Morgan BP , Morgan JE ((2020) ) Retinal ganglion cell degeneration correlates with hippocampal spine loss in experimental Alzheimer’s disease. Acta Neuropathol Commun 8: , 216. |
[87] | Wang SE , Wu CH ((2015) ) Physiological and histological evaluations of the cochlea between 3xTg-AD mouse model of Alzheimer’s diseases and R6/2 mouse model of Huntington’s diseases. Chin J Physiol 58: , 359–366. |
[88] | Danias J , Lee KC , Zamora MF , Chen B , Shen F , Filippopoulos T , Su Y , Goldblum D , Podos SM , Mittag T ((2003) ) Quantitative analysis of retinal ganglion cell (RGC) loss in aging DBA/2NNIA glaucomatous mice: Comparison with RGC loss in aging C57/BL6 mice. Investig Ophthalmol Vis Sci 44: , 5151–5162. |
[89] | Salinas-Navarro M , Jiménez-López M , Valiente-Soriano FJ , Alarcón-Martínez L , Avilés-Trigueros M , Mayor S , Holmes T , Lund RD , Villegas-Pérez MP , Vidal-Sanz M ((2009) ) Retinal ganglion cell population in adult albino and pigmented mice: A computerized analysis of the entire population and its spatial distribution. Vision Res 49: , 637–647. |
[90] | Beery AK ((2018) ) Inclusion of females does not increase variability in rodent research studies. Curr Opin Behav Sci 23: , 143–149. |
[91] | Becker JB , Arnold AP , Berkley KJ , Blaustein JD , Eckel LA , Hampson E , Herman JP , Marts S , Sadee W , Steiner M , Taylor J , Young E ((2005) ) Strategies and methods for research on sex differences in brain and behavior. Endocrinology 146: , 1650–1673. |
[92] | Bretland KA , Lin L , Bretland KM , Smith MA , Fleming SM , Dengler-Crish CM ((2021) ) Irisin treatment lowers levels of phosphorylated tau in the hippocampus of pre-symptomatic female but not male htau mice. Neuropathol Appl Neurobiol 47: , 967–978. |
[93] | Dengler-Crish CM , Smith MA , Inman DM , Wilson GN , Young JW , Crish SD ((2014) ) Anterograde transport blockade precedes deficits in retrograde transport in the visual projection of the DBA/2J mouse model of glaucoma. Front Neurosci 8: , 290. |
[94] | Ventura LM , Porciatti V , Ishida K , Feuer WJ , Parrish Ii RK , Parrish RK ((2005) ) Pattern electroretinogram abnormality and glaucoma. Ophthalmology 112: , 10–19. |
[95] | Talla V , Yang C , Shaw G , Porciatti V , Koilkonda RD , Guy J ((2013) ) Noninvasive assessments of optic nerve neurodegeneration in transgenic mice with isolated optic neuritis. Investig Ophthalmol Vis Sci 54: , 4440–4450. |
[96] | Jafarzadehpour E , Radinmehr F , Pakravan M , Mirzajani A , Yazdani S ((2013) ) Pattern electroretinography in glaucoma suspects and early primary open angle glaucoma. J Ophthalmic Vis Res 8: , 199–206. |
[97] | Maffei L , Fiorentini A ((1981) ) Electroretinographic responses to alternating gratings before and after section of the optic nerve. Science 211: , 953–955. |
[98] | Sandalon S , Ofri R ((2012) ) Age-related changes in the pattern electroretinogram of normal and glatiramer acetate-immunized rats. Investig Ophthalmol Vis Sci 53: , 6532–6540. |
[99] | Lek JJ , Nguyen BN , McKendrick AM , Vingrys AJ ((2019) ) An electrophysiological comparison of contrast response functions in younger and older adults, and those with glaucoma. Investig Ophthalmol Vis Sci 60: , 442–450. |
[100] | Porciatti V ((2014) ) Electrophysiological assessment of retinal ganglion cell function. Exp Eye Res 141: , 164–170. |
[101] | Luo X , Frishman LJ ((2011) ) Retinal pathway origins of the pattern electroretinogram (PERG). Investig Ophthalmol Vis Sci 52: , 8571–8584. |
[102] | Miura G , Wang MH , Ivers KM , Frishman LJ ((2009) ) Retinal pathway origins of the pattern ERG of the mouse. Exp Eye Res 89: , 49–62. |
[103] | Benchorin G , Calton M , Beaulieu M , Vollrath D ((2017) ) Assessment of murine retinal function by electroretinography. Bio Protocol 7: , e2218. |
[104] | Kremers J , Tanimoto N ((2018) ) Mouse Retinal Phenotyping, Springer New York, New York. |
[105] | Leinonen H , Lipponen A , Gurevicius K , Tanila H ((2016) ) Normal amplitude of electroretinography and visual evoked potential responses in AβPP/PS1 mice. J Alzheimers Dis 51: , 21–26. |
[106] | Crish SD , Schofield BR ((2018) ) Anterograde tract tracing for assaying axonopathy and transport deficits in glaucoma. Methods Mol Biol 1695: , 171–185. |
[107] | Crish SD , Sappington RM , Inman DM , Horner PJ , Calkins DJ ((2010) ) Distal axonopathy with structural persistence in glaucomatous neurodegeneration. Proc Natl Acad Sci U S A 107: , 5196–5201. |
[108] | Wilson GN , Inman DM , Dengler Crish CM , Denger-Crish CM , Smith MA , Crish SD ((2015) ) Early pro-inflammatory cytokine elevations in the DBA/2J mouse model of glaucoma. J Neuroinflammation 12: , 176. |
[109] | Wilson GN , Smith MA , Inman DM , Dengler-Crish CM , Crish SD ((2016) ) Early cytoskeletal protein modifications precede overt structural degeneration in the DBA/2J mouse model of glaucoma. Front Neurosci 10: , 494. |
[110] | Naaman E , Ya’ari S , Itzkovich C , Safuri S , Macsi F , Kellerman L , Mimouni M , Mann I , Gazit E , Adler-Abramovich L , Zayit-Soudry S ((2020) ) The retinal toxicity profile towards assemblies of Amyloid-β indicate the predominant pathophysiological activity of oligomeric species. Sci Rep 10: , 20954. |
[111] | Dolev I , Fogel H , Milshtein H , Berdichevsky Y , Lipstein N , Brose N , Gazit N , Slutsky I ((2013) ) Spike bursts increase amyloid-β 40/42 ratio by inducing a presenilin-1 conformational change. Nat Neurosci 16: , 587–595. |
[112] | Doustar J , Rentsendorj A , Torbati T , Regis GC , Fuchs DT , Sheyn J , Mirzaei N , Graham SL , Shah PK , Mastali M , Van Eyk JE , Black KL , Gupta VK , Mirzaei M , Koronyo Y , Koronyo-Hamaoui M ((2020) ) Parallels between retinal and brain pathology and response to immunotherapy in old, late-stage Alzheimer’s disease mouse models. Aging Cell 19: , e13246. |
[113] | Lim JKH , Li QX , He Z , Vingrys AJ , Chinnery HR , Mullen J , Bui BV , Nguyen CTO ((2020) ) Retinal functional and structural changes in the 5xFAD mouse model of Alzheimer’s disease. Front Neurosci 14: , 862. |
[114] | Ferdous S , Liao KL , Gefke ID , Summers VR , Wu W , Donaldson KJ , Kim YK , Sellers JT , Dixon JA , Shelton DA , Markand S , Kim SM , Zhang N , Boatright JH , Nickerson JM ((2021) ) Age-related retinal changes in wild-type C57BL/6J mice between 2 and 32 months. Investig Ophthalmol Vis Sci 62: , 9. |
[115] | Asanad S , Felix CM , Fantini M , Harrington MG , Sadun AA , Karanjia R ((2021) ) Retinal ganglion cell dysfunction in preclinical Alzheimer’s disease: An electrophysiologic biomarker signature. Sci Rep 11: , 6344. |
[116] | Chiasseu M , Cueva Vargas JL , Destroismaisons L , Velde Vande C , Leclerc N , Di Polo A ((2016) ) Tau accumulation, altered phosphorylation, and missorting promote neurodegeneration in glaucoma. J Neurosci 36: , 5785–5798. |
[117] | Chiquita S , Campos EJ , Castelhano J , Ribeiro M , Sereno J , Moreira PI , Castelo-Branco M , Ambrósio AF , Francisco Ambrósio A ((2019) ) Retinal thinning of inner sub-layers is associated with cortical atrophy in a mouse model of Alzheimer’s disease: A longitudinal multimodal in vivo study. Alzheimers Res Ther 11: , 90. |
[118] | Javaid FZ , Brenton J , Guo L , Cordeiro MF ((2016) ) Visual and ocular manifestations of Alzheimer’s disease and their use as biomarkers for diagnosis and progression. Front Neurol 7: , 55. |
[119] | Crawford TJ , Devereaux A , Higham S , Kelly C ((2015) ) The disengagement of visual attention in Alzheimer’s disease: A longitudinal eye-tracking study. Front Aging Neurosci 7: , 118. |
[120] | Greene JDW , Hodges JR ((1996) ) Identification of famous faces and famous names in early Alzheimer’s disease: Relationship to anterograde episodic and general semantic memory. Brain 119: , 111–128. |
[121] | Fletcher WA , Sharpe JA ((1986) ) Saccadic eye movement dysfunction in Alzheimer’s disease. Ann Neurol 20: , 464–471. |
[122] | Uhlmann RF , Larson EB , Koepsell TD , Rees TS , Duckert LG ((1991) ) Visual impairment and cognitive dysfunction in Alzheimer’s disease. J Gen Intern Med 6: , 126–132. |
[123] | Koch JM , Datta G , Makhdoom S , Grossberg GT ((2005) ) Unmet visual needs of Alzheimer’s disease patients in long-term care facilities. J Am Med Dir Assoc 6: , 233–237. |
[124] | Parisi V , Restuccia R , Fattapposta F , Mina C , Bucci MG , Pierelli F ((2001) ) Morphological and functional retinal impairment in Alzheimer’s disease patients. Clin Neurophysiol 112: , 1860–1867. |
[125] | Joseph Phillips M , Webb-Wood S , Faulkner AE , Jabbar SB , Biousse V , Newman NJ , Do VT , Boatright JH , Wallace DC , Pardue MT ((2010) ) Retinal function and structure in ant1-deficient mice. Investig Ophthalmol Vis Sci 51: , 6744–6752. |
[126] | Porciatti V , Chou TH , Feuer WJ ((2010) ) C57BL/6J, DBA/2J, and DBA/2J.gpnmb+ mice have different visual signal processing in the inner retina. Mol Vis 16: , 2939–2947. |
[127] | Evans DW , Hosking SL , Gherghel D , Bartlett JD ((2003) ) Contrast sensitivity improves after brimonidine therapy in primary open angle glaucoma: A case for neuroprotection. Br J Ophthalmol 87: , 1463–1465. |
[128] | Johnson MA , Drum BA , Quigley HA , Sanchez RM , Dunkelberger GR ((1989) ) Pattern-evoked potentials and optic nerve fiber loss in monocular laser-induced glaucoma. Investig Ophthalmol Vis Sci 30: , 897–907. |
[129] | Sehi M , Grewal DS , Goodkin ML , Greenfield DS ((2010) ) Reversal of retinal ganglion cell dysfunction after surgical reduction of intraocular pressure. Ophthalmology 117: , 2329–2336. |
[130] | Sorbara CD , Wagner NE , Ladwig A , Nikić I , Merkler D , Kleele T , Marinković, P , Naumann R , Godinho L , Bareyre FM , Bishop D , Misgeld T , Kerschensteiner M ((2014) ) Pervasive axonal transport deficits in multiple sclerosis models. Neuron 84: , 1183–1190. |
[131] | Marinković P , Reuter MS , Brill MS , Godinho L , Kerschensteiner M , Misgeld T ((2012) ) Axonal transport deficits and degeneration can evolve independently in mouse models of amyotrophic lateral sclerosis. Proc Natl Acad Sci U S A 109: , 4296–4301. |
[132] | Howell GR , Libby RT , Jakobs TC , Smith RS , Phalan FC , Barter JW , Barbay JM , Marchant JK , Mahesh N , Porciatti V , Whitmore AV , Masland RH , John SWM ((2007) ) Axons of retinal ganglion cells are insulted in the optic nerve early in DBA/2J glaucoma. , 1523-. J Cell Biol 179: , 1537. |
[133] | Saleh M , Nagaraju M , Porciatti V ((2007) ) Longitudinal evaluation of retinal ganglion cell function and IOP in the DBA/2J mouse model of glaucoma. Investig Ophthalmol Vis Sci 48: , 4564–4572. |
[134] | Buckingham BP , Inman DM , Lambert W , Oglesby E , Calkins DJ , Steele MR , Vetter ML , Marsh-Armstrong N , Horner PJ ((2008) ) Progressive ganglion cell degeneration precedes neuronal loss in a mouse model of glaucoma. J Neurosci 28: , 2735–2744. |
[135] | Smith MA , Xia CZ , Dengler-Crish CM , Fening KM , Inman DM , Schofield BR , Crish SD ((2016) ) Persistence of intact retinal ganglion cell terminals after axonal transport loss in the DBA/2J mouse model of glaucoma. J Comp Neurol 524: , 3503–3517. |
[136] | Yin H , Chen L , Chen X , Liu X ((2008) ) Soluble amyloid β oligomers may contribute to apoptosis of retinal ganglion cells in glaucoma. Med Hypotheses 71: , 77–80. |
[137] | Gravina SA , Ho L , Eckman CB , Long KE , Otvos L , Younkin LH , Suzuki N , Younkin SG ((1995) ) Amyloid β protein (Aβ) in Alzheimer’s disease brain. Biochemical and immunocytochemical analysis with antibodies specific for forms ending at Aβ40 or Aβ42(43). J Biol Chem 270: , 7013–7016. |
[138] | Nikolakopoulou AM , Zhao Z , Montagne A , Zlokovic BV ((2017) ) Regional early and progressive loss of brain pericytes but not vascular smooth muscle cells in adult mice with disrupted platelet-derived growth factor receptor-β signaling. PLoS One 12: , e0176225. |
[139] | Dennison JL , Ricciardi NR , Lohse I , Volmar CH , Wahlestedt C ((2021) ) Sexual Dimorphism in the 3xTg-AD mouse model and its impact on pre-clinical research. J Alzheimers Dis 80: , 41–52. |
[140] | Barnes LL , Wilson RS , Bienias JL , Schneider JA , Evans DA , Bennett DA ((2005) ) Sex differences in the clinical manifestations of Alzheimer disease pathology. Arch Gen Psychiatry 62: , 685–691. |
[141] | Shokouhi S , Taylor WD , Albert K , Kang H , Newhouse PA ((2020) ) In vivonetwork models identify sex differences in the spread of tau pathology across the brain. Alzheimers Dement (Amst) 12: , e12016. |
[142] | Marchese M , Cowan D , Head E , Ma D , Karimi K , Ashthorpe V , Kapadia M , Zhao H , Davis P , Sakic B ((2014) ) Autoimmune manifestations in the 3xTg-AD model of Alzheimer’s disease. J Alzheimers Dis 39: , 191–210. |
[143] | DeVries SH ((2000) ) Bipolar cells use kainate and AMPA receptors to filter visual information into separate channels. Neuron 28: , 847–856. |
[144] | Rodrigues-Neves AC , Carecho R , Correia SC , Carvalho C , Campos EJ , Baptista FI , Moreira PI , Ambrósio AF ((2021) ) Retina and brain display early and differential molecular and cellular changes in the 3xTg-AD mouse model of Alzheimer’s disease. Mol Neurobiol 58: , 3043–3060. |

