
Montreal Cognitive Assessment: Normative Data for Cognitively Healthy Swedish 80- to 94-Year-Olds
Abstract
Background:
The Montreal Cognitive Assessment (MoCA) is sensitive to cognitive impairment; however, it is also sensitive to demographic and socio-cultural factors. This necessitates reliable sub-population norms, but these are often lacking for older adults.
Objective:
To present demographically adjusted regression-based MoCA norms for cognitively healthy Swedish older adults.
Methods:
A pseudo-random sample of community-dwelling 80- to 94-year-olds, stratified by age and gender, was invited to the study. Initial telephone interviews and medical records searches (n = 218) were conducted to screen for cognitive impairment. N = 181 eligible participants were administered a protocol including the Swedish version of the MoCA and assessments of global cognition (Mini-Mental State Examination, MMSE) and depression (Patient Health Questionnaire-9, PHQ-9). Individuals scoring in the range of possible cognitive impairment on the MMSE or more than mild depression on the PHQ-9 were excluded (n = 23); three discontinued the test-session.
Results:
Norms were derived from the remaining n = 158. They were evenly distributed by gender, on average 85 years old, and with a mean education of 11 years. MoCA scores were independently influenced by age and education, together explaining 17.2% of the total variance. Higher age and lower education were associated with lower performance and 46% performed below the original cut-off (< 26/30).
Conclusion:
The negative impact of increasing age on MoCA performance continues linearly into the nineties in normal aging. Demographic factors should be considered when interpreting MoCA performance and a tool for computing demographically corrected standard scores is provided.
INTRODUCTION
Since its introduction in 2005, the Montreal Cognitive Assessment (MoCA) [1] has proven an able detector of mild cognitive impairment (MCI), with decidedly better sensitivity than the more commonly used Mini-Mental State Examination (MMSE) [2]. It has therefore become widely used internationally with a wide range of patient populations, in clinical work as well as in research. It has, however, become clear that the MoCA is sensitive not just to MCI, but also to factors such as normal aging and educational attainment [3–5], which reduces specificity.
A one-point correction for≤12 years of education is integrated in the scoring procedure but has been found not to fully correct for the educational attainment [3]. In addition, the small number of normative studies including individuals 80 years or older have typically found large proportions performing below the traditional cutoff (< 26/30) used to indicate possible cognitive impairment [1]. A recent and large American normative study [6] for example found that 53–100% of their participants aged 75 or older scored below 26 points on the MoCA, depending on ethnicity and educational level, and 10th percentile predicted scores for 85-year-olds ranged from 14 to 22. Similarly, mean MoCA performance in 80- to-89-year-olds was 25.1 in the study by Malek-Ahmadi et al. [3], and education-adjusted cut-offs for MCI (computed as one standard deviation below the mean [7]), would in their sample fall between < 20/30 to < 23/30. Suggested cut-offs specifically for individuals at or above their eighties are rare—wider age-spans are typically reported—but this is roughly in line with findings from other American and European studies including octogenarians [8–11]. A recent meta-analysis [12] pinpointed < 23/30 as the cutoff with best diagnostic accuracy for general differentiation between MCI and normal aging, and others have come to similar conclusions [13, 14]. Variance across samples is however significant [3, 4, 6, 15–18], most likely reflecting not only educational, but also socio-demographical and cultural, as well as methodological, differences. There have also been indications that the rate of age-related decline in the cognitively healthy, as reflected by MoCA scores, accelerates after around the age of 80 [19]. Taken together, a common recommendation is therefore to rely on demographically adjusted norms for specific populations rather than general cutoffs, and this does seem to help improve diagnostic accuracy [14].
Despite the extensive research conducted on the MoCA, norms are, however, still scarce for cognitively healthy older adults (i.e., at or above age 80). This is concerning in view of its low specificity in these age-groups, combined with the increasing use of the MoCA in dementia investigations [20]. The purpose of the present study was therefore to present carefully collected regression-based normative data for a sample of cognitively healthy Swedish 80- to 94-year-olds.
METHODS
The data reported below were collected as part of a larger normative study including A Quick Test of Cognitive Speed (AQT) [21] and Cognistat [22], for which results are (AQT), or will be (Cognistat), reported separately [23].
Participants and procedure
A pseudo-random selection of Linköping County inhabitants (n = 987), acquired from the Swedish population registry and evenly distributed over gender and age-group (80–84 years, 85–89 years, and 90–94 years), were invited by mail to participate in the study. A total of 218 agreed and were contacted for an extensive semi-structured telephone interview conducted by experienced staff members at the Linköping university hospital memory clinic. Exclusion criteria were dementia, MCI, or other known cognitive deficit related to neurological or non-neurological disorder or treatment (e.g., chemotherapy); verified stroke or intracranial hemorrhage within the last 5 years; current substance abuse; ongoing moderate-to-severe psychiatric illness; or impaired perceptual or motor ability, or lack of knowledge in the Swedish language, to a degree interfering with test reliability. These criteria were checked during the interview in which information about living conditions, health status, cognitive functioning, sensory and motor functioning, and Swedish language proficiency (if other native tongue) was collected. Finally, consent for a supplementary medical records search was attained, and information about presence or absence of relevant diagnoses and suspected or confirmed cognitive impairment was collected from the records. A total of thirty-four individuals met exclusion criteria at this point.
Remaining eligible participants (n = 184) were invited to a 1.5-hour visit at the memory clinic during which staff members collected written informed consent and background information including educational attainment. This was followed by administration of the MMSE and the study tests (always beginning with AQT, followed by the MMSE, the MoCA, and Cognistat in counterbalanced order). The testing was done in a well-lit and quiet room, participants using hearing-aids or glasses had been instructed to bring them and they were helped with adjustment of settings if needed. After a coffee break, questionnaires concerning functional ability, quality of life, lifestyle factors, and mental health ended the session. Three participants chose to discontinue the test-session and were excluded.
To further ensure cognitive health, the 23 individuals who scored below 26 points on the MMSE [24] and/or above 9 points on the Patient Health Questionnaire-9 (PHQ-9) self-rating scale of depression, corresponding to more than mild depressive symptoms [25], were excluded from further analyses. They did not differ from the rest of the sample with respect to gender, age, or years of education but they had significantly lower MoCA scores (Md = 21 versus 25, U = 664.50, z = –4.92, p < 0.001).
The final sample thus comprised 158 individuals. Please see Classon et al. [23] for a fuller account of the procedure—including a flow-chart of recruitment, drop-out, and exclusion—and a detailed descriptive of the sample.
Measurements
MoCA
The MoCA is a 13-item cognitive screening instrument assessing function in seven cognitive subdomains: visuospatial/executive, naming, attention, language, abstraction, delayed recall, and orientation [1]. The test takes approximately 15 min to administer [17] and yields a summed total score of max 30 points, with higher scores denoting better cognitive function. The present study used the official Swedish version published at MoCA - Cognitive Assessment (mocatest.org), administered and scored according to the manual. A standard procedure correction entails adding one point to the total score if the test taker has ≤ 12 years of education [1]. Both raw scores and corrected scores were analyzed but unless otherwise specifically stated, MoCA scores refer to raw scores.
Demographic factors
Relevant diagnoses collected from medical records were coded as present or absent and number of diagnoses per participant was computed. Educational level was measured by total number of years of formal education as stated by the participant. The Swedish version of the MMSE, MMSE-SR [26], was used in this study as a measure of global cognitive functioning to screen for cognitive impairment. It consists of 20 items assessing orientation to time and place, memory, attention, language, and visuospatial ability. Total score ranges from 0 to 30 with lower scores denoting more impaired cognition. Depressive symptoms were examined using the PHQ-9 self-rating scale of depression [25], a short version of the PHQ [27]. Frequency of nine depressive symptoms over the past two weeks were reported together with an assessment of how symptoms affect everyday life. The visual analog scale (EQ-VAS) of the EQ-5D [28] health questionnaire was used to assess self-rated health on a scale from 100 (“Best imaginable health state”) to 0 (“Worst imaginable health state”). The Functional Activities Questionnaire (FAQ) [29] was used to assess self-reported independence in 10 everyday activities. Summed total score, max 30 points with higher scores denoting less independence, was used for analyses. Vision and hearing were roughly coded into three categories based on self-reports of function with the correction (glasses, hearing aids) normally used: fair (generally experiencing that vision/hearing is not a problem in everyday life), intermediate (experiencing visual/hearing problems not adequately compensated for by glasses or hearing aids), and poor (experiencing vision/hearing as a problem in everyday life that glasses or hearing aids cannot compensate for).
Statistical analyses
All statistics were conducted using the IBM SPSS Statistics version 25.0 software. Parametric and non-parametric tests were used as applicable to analyze demographic variables and MoCA scores at the subdomain and item levels. Level of significance was set at two-tailed p = 0.05. Separate multiple linear regression analyses were conducted to obtain predicted scores corrected for demographic factors. MoCA score, with and without the +1-point correction for≤12 years of education, was regressed on candidate lower-order and higher-order predictors: age, years of education and gender; and all two-way interactions. Gender was coded as female = 1 and male = 0. To avoid multicollinearity, age and years of education were centered (i.e., individual age – mean age of entire sample rounded to integer) before computing the interaction terms [30, 31]. Potential non-linear effects of education (1/years of education) were explored in separate models and the model minimizing the Akaike Information Criterion (AIC) was selected [32]. All regressions were conducted using the backwards selection model with p-to-remove set at > 0.1. Regression assumptions were checked by inspection of the distributions and normal probability plots of the residuals, intercorrelations, and computation of tolerance. Homoscedasticity was assessed by visual inspection of plots of standardized predicted values and residuals and by dividing the residuals into predicted score tertiles and applying Levene’s test [31]. The unstandardized residual is the positive or negative deviation between an individual raw score and its corresponding predicted score based on the regression equation. The SD of the residuals is a measure of the sample’s variance around predicted scores (i.e., the positive and negative deviations between observed scores and the regression equation line) and hence used to compute individual standardized scores, using the formulae shown under Application of the normative model. If residual SD is not homogenous along the equation line, as for example if older age is associated with increasing individual variance and residual SDs are larger around higher than lower predicted values, then homoscedasticity is violated. This needs to be considered when computing normative values, in the present study by examining whether residual SD differ between predicted score tertiles. If they do not, homoscedasticity is not violated, and the same residual SD can be used for computation of normative values in all cases.
Application of the normative model to individual raw scores
Normative data for individual test takers are computed from the regression parameters by a two-step procedure [31]. The first step is to calculate the predicted score for the test taker (TT in the formulae below):
The constants and B-values to use are found in Table 2. The second step is to standardize the difference between the actual test result (raw MoCA score) and the predicted score of the test taker:
For a worked example, please see under Example computation of individual standard scores in the Results section.
Ethics
All participants gave their written informed consent. The study procedure was approved by the Research Ethics Committee of Linköping University, Sweden (D.nr 2016/394-31) and conducted in accordance with the ethical standards of the Helsinki Declaration of 1975.
RESULTS
Demographics and MoCA performance
The participants were evenly distributed by gender but not by age-range: 49% were 80- to 84-years old, 30% were 85- to 89-years old, and 21% were 90- to 94-years old (see also Table 1). Mean age was 85 (SD 4.0, range 80–94) and they had in average 11 years of education (SD 3.8, range 4–20). Three participants were not native Swedish speakers but spoke the language fluently after more than 50 years in Sweden and they were included in the analyses.
Table 1
MoCA raw scores, M (SD), and traditional norms, in total and as divided by age-group and educational attainment
| Years of education | ||||
| Age group | SD | ≤12 | > 12 | All |
| 80–84 | 25.02 (2.0) | 26.42 (2.3) | 25.58 (2.2) | |
| n = 47 | n = 31 | n = 78 | ||
| ≤1 | 23 | 24 | 23 | |
| ≤1.5 | 22 | 23 | 22 | |
| ≤2 | 21 | 22 | 21 | |
| 85–89 | 24.17 (2.6) | 26.64 (2.0) | 24.74 (2.6) | |
| n = 36 | n = 11 | n = 47 | ||
| ≤1 | 22 | 25 | 22 | |
| ≤1.5 | 20 | 24 | 21 | |
| ≤2 | 19 | 23 | 19 | |
| 90–94 | 23.8 (2.5) | 23.88 (1.9) | 23.82 (2.3) | |
| n = 25 | n = 8 | n = 33 | ||
| ≤1 | 21 | 22 | 22 | |
| ≤1.5 | 20 | 21 | 20 | |
| ≤2 | 19 | 20 | 19 | |
| All | 24.45 (2.3) | 26.06 (2.3) | 24.96 (2.4) | |
| n = 108 | n = 50 | n = 158 | ||
| ≤1 | 22 | 24 | 23 | |
| ≤1.5 | 21 | 23 | 21 | |
| ≤2 | 20 | 21 | 20 | |
Table 2
Final regression models for MoCA performance
| Measure | Variable | B | SE B | p | β | R2 |
| MoCA | Constant | 34.192 | 4.053 | |||
| Age | –0.133 | 0.045 | 0.004 | –0.220 | ||
| Years of education | 0.194 | 0.048 | 0.000 | 0.302 | 0.172 | |
| MoCA-C | Constant | 36.211 | 4.069 | |||
| Age | –0.135 | 0.046 | 0.004 | –0.233 | ||
| Years of education | 0.090 | 0.049 | 0.067 | 0.145 | 0.092 |
MoCA, raw scores without the +1-point correction for≤12 years of education; MoCA-C, scores with the +1-point correction applied. Regression coefficients are based on non-standardized age and years of education. Constant, the intercept; B, unstandardized beta values; β, standardized beta values.
The correlation between MMSE and MoCA (r = 0.36, p < 0.001) was in the intermediate range [33]. There were no gender differences in either total or subdomain MoCA scores and MoCA scores did not differ as a function of presence or absence of either of the examined diagnoses. Nor did number of received diagnoses per participant, self-rated depressive symptoms (PHQ9) or self-rated health (EQ5D) correlate with MoCA scores.
Sensory problems were common, with 73 (46%) individuals reporting at least some visual impairment and 102 (65%) at least some hearing impairment, despite correction. There were however no significant differences in MoCA scores due to degree of self-reported loss of either hearing or vision. Nor was there any effect of test leader and no systematic effect of test order. There was, however, a small [33] but significant correlation between MoCA scores and functional independence (FAQ: rs = –0.29, p < 0.001) such that higher functional independence was related to better MoCA performance.
In total, 46% (n = 73) scored below 26 points, corrected for education, and the proportion increased significantly (χ2 linear-by-linear association = 4.741, p = 0.03) with increasing age: 38% (n = 30) in the 80- to 84-year-olds, 49% (n = 23) in the 85- to 89-year-olds and 61% (n = 20) in the 90- to 94-year-olds. The total proportion with maximum scores in each subdomain was 39% for visuospatial/executive, 88% for naming, 73% for attention, 61% for language, 70% for abstraction, 3% for delayed recall, and 93% for orientation. The 80- to 84-year-olds performed significantly better than the 90- to 94-year-olds in the visuospatial/executive and language subdomains (U = 831.50, z = –3.098, p = 0.002; U = 872.00, z = –3.134, p = 0.002), in which a higher proportion of the oldest age-group, as compared to the youngest, failed in trail making (χ2 = 5.156, p = 0.028), cube copying (χ2 = 4.882, p = 0.032), and verbal fluency (χ2 = 7.804, p = 0.008). Indeed, 51.5% in the oldest age-group failed the cube copying task and the verbal fluency task, as compared to 29.5% and 24.4%, respectively, in the youngest group. The delayed memory task was equally difficult for all: median numbers of words recalled was two in the oldest age-group and three in the youngest (Median test = 1.160, p = 0.409).
Total MoCA scores were significantly higher in those with > 12 years of education (M > 12 = 26.1, M≤12 = 24.4; t(109) = –2.848, p = 0.005), but the difference did not reach significance when the 1 point correction for education was applied. Those with higher education performed significantly better in the visuospatial/executive and abstraction subdomains (U = 3682.00, z = 3.867, p < 0.001; U = 3239.50, z = 2.532, p = 0.011).
MoCA raw scores with and without stratification by age and education are presented in Table 1. Please see the Supplementary Material for item level performances and correlations between demographic variables and MoCA subdomains.
Regression-based normative data
Multicollinearity was within recommended levels, tolerance = 0.942, and no influential outliers were detected, maximum Di = 0.042. Based on Levene’s test the assumption of homogeneity of variance was not violated (p = 0.352). Allowing for a non-linear effect of education did not significantly improve model fit (non-linear model, AIC = 716.817; linear model, AIC = 714.581). The final regression models are presented in Table 2.
The MoCA raw score model thus predicts a 1.33-point decline per decade with increasing age and a 0.97-point increase with each additional 5 years of education. The corrected score model shows that applying the +1-point correction for individuals with≤12 years of education helped reduce, but not eliminate, the effect of education on MoCA performance: the total amount of variance explained by age and years of education decreased from 17.2% to 9.2%.
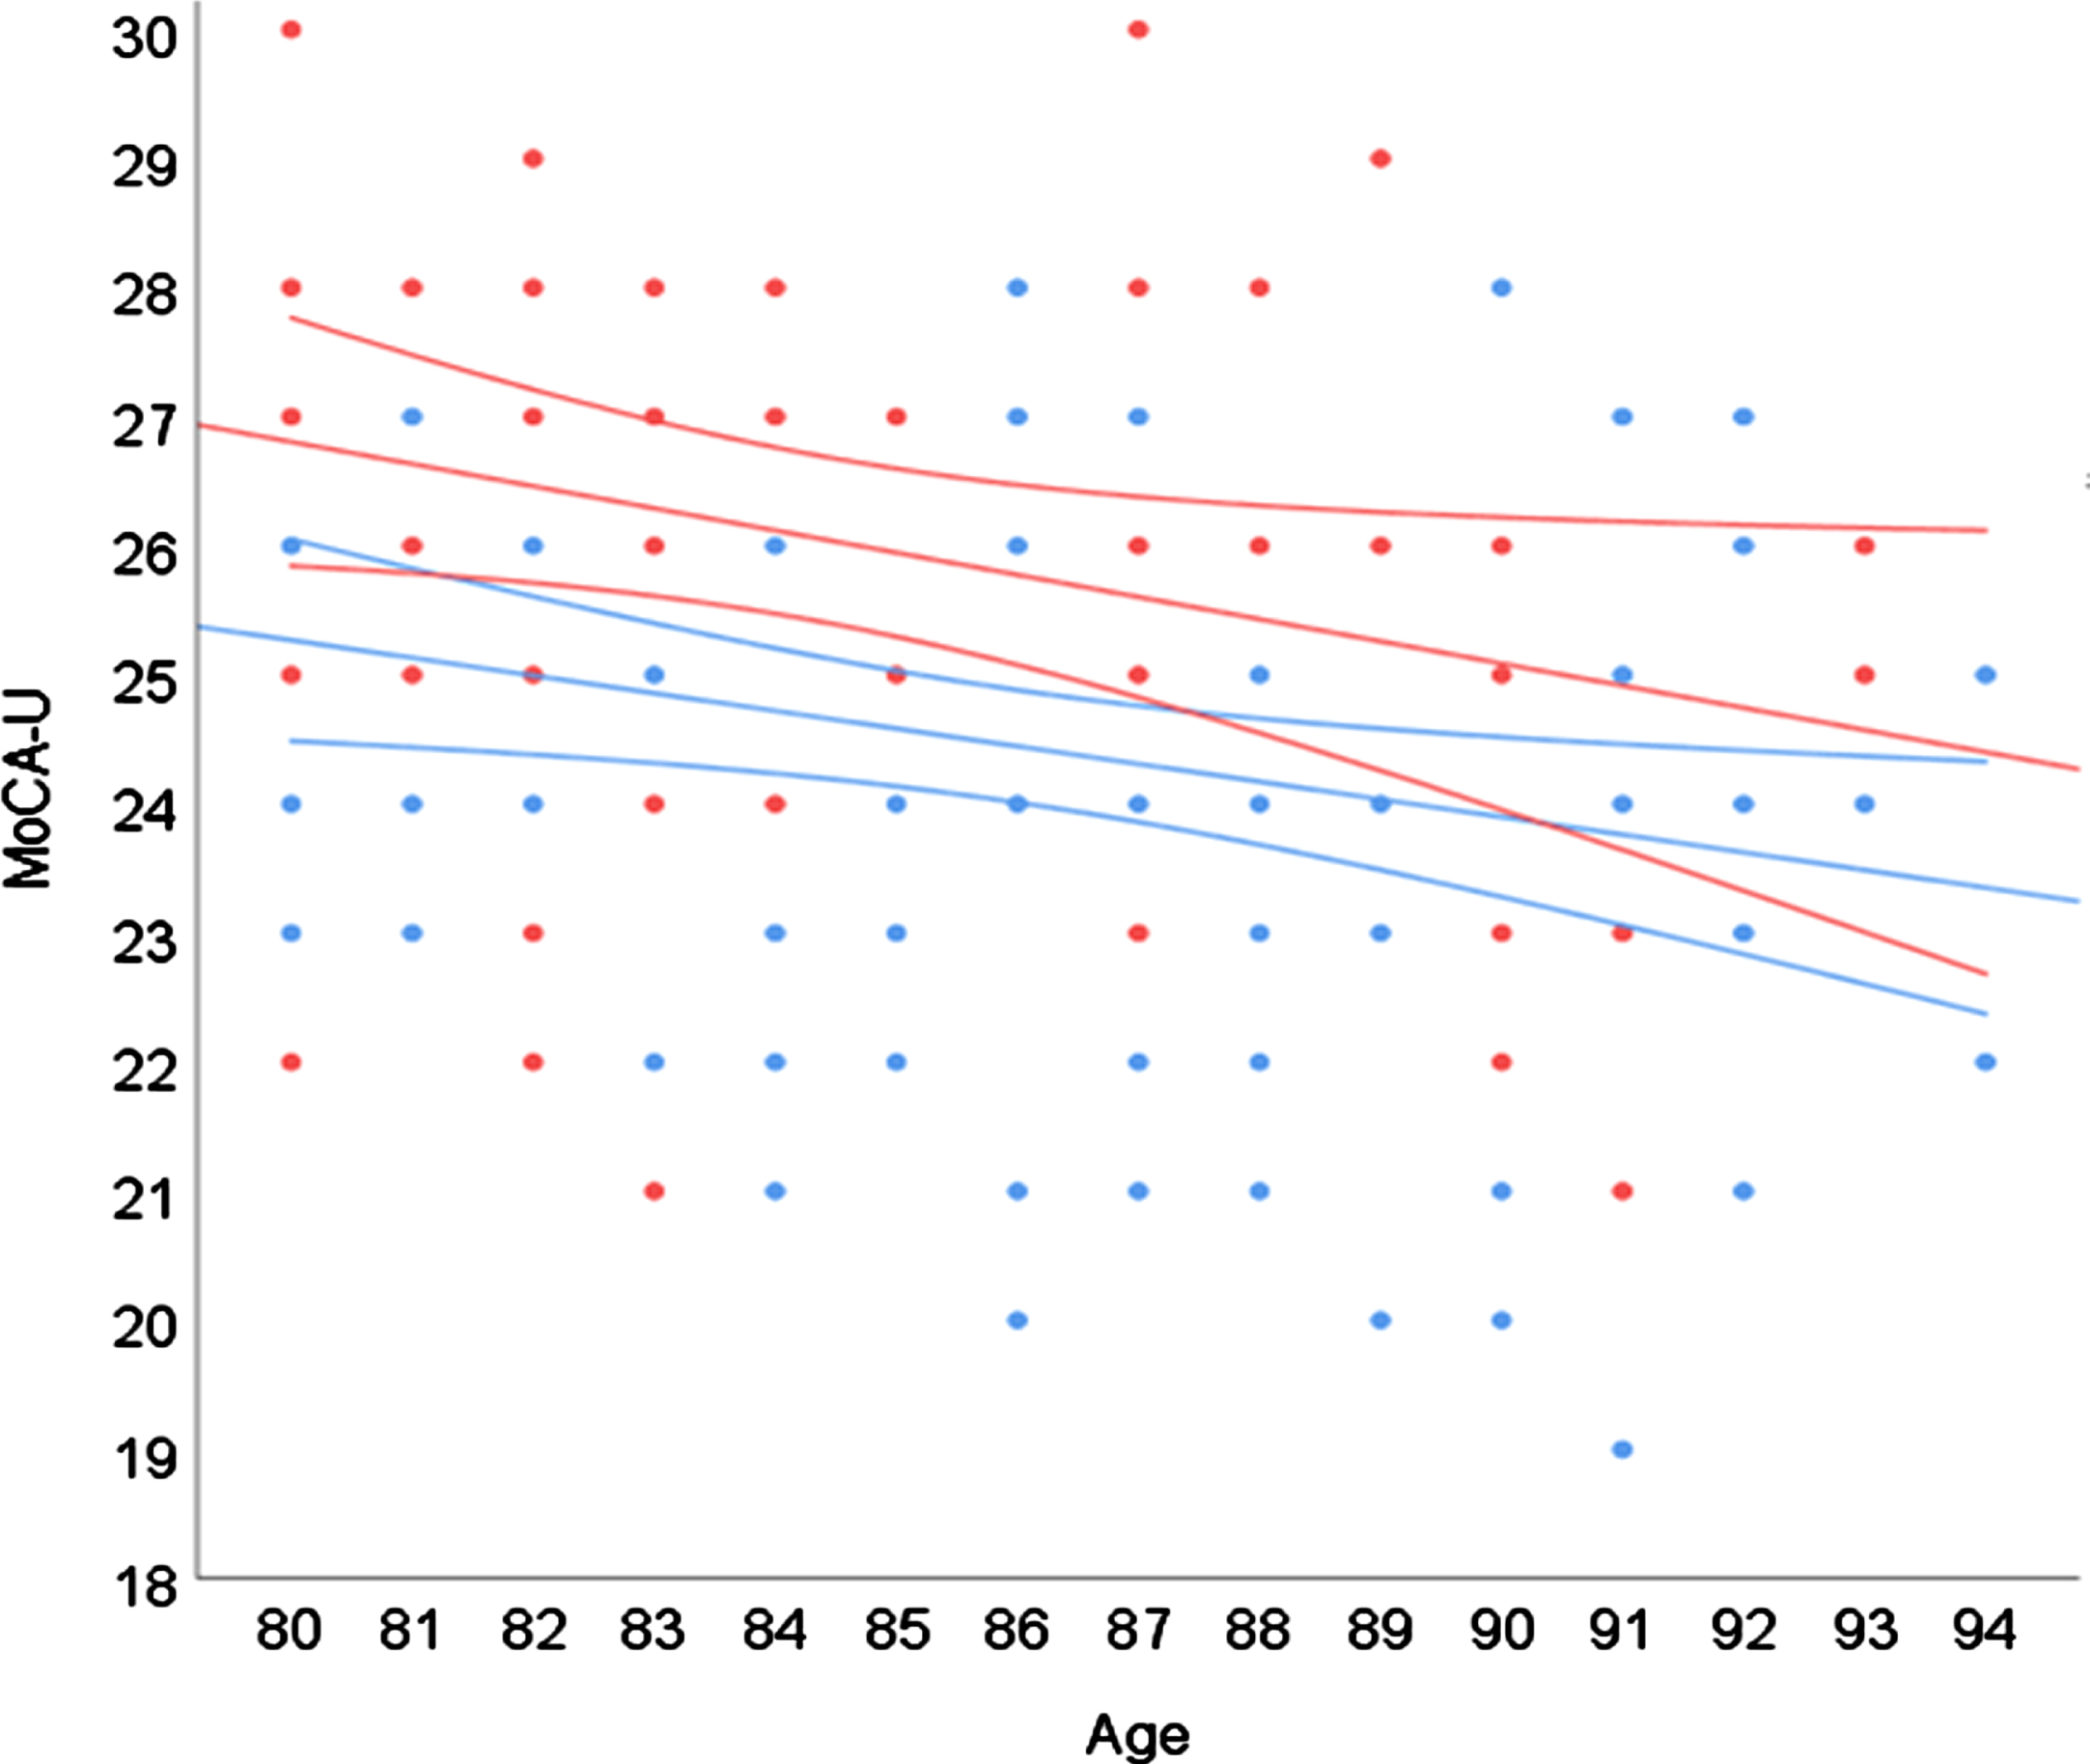
Effects of age and higher versus lower education are visualized in Fig. 1. As shown, those with > 12 years of education outperformed those with≤12 years of education by around 1.5 points. The gap seems to slowly narrow with increasing age due to a steeper slope in the more highly educated group (B = –0.17 versus –0.14) and at the age of 94 the difference was around 1 point.
Fig. 1
Regression model displaying effects of age and years of education. Color (black and white) indicates years of education: blue (light grey) =≤12 years; red (dark grey) = >#x200A;12 years. Surrounding lines#x200A;=#x200A;95% CI.
We also investigated whether co-morbidity (number of diagnoses per participant) and impaired hearing or vision were associated with performance on the MoCA, but neither of these variables were significant predictors in the model (all p > 0.05).
Example computation of individual standard scores
The SD of the residuals was 2.227, and because there were no significant differences between residual SDs divided by predicted score tertiles, this value can be used for all normative computations according to the demonstration below. For example, computation of normative MoCA data for a 91-year-old test taker with 6 years of education and a raw score of 23 points:
Performances ≥–1SD are typically interpreted as suspected MCI, and ≥–2SD as suspected dementia [7]. The z-score is equivalent to the SD and hence a score of –0.114 is in the average range. Had the same test taker had 18 years of education, the predicted score would have been 25.581 and the z-score –1.159, a below average result. To facilitate for clinicians, we provide a tool for computation of individual scores in the Supplementary Material. Enter MoCA raw score (uncorrected for education), age, and years of education to get individual predicted score and z-score.
DISCUSSION
The purpose of this study was to present normative MoCA data for cognitively healthy Swedish 80- to 94-year-olds. Results showed linear effects of age and education and are well in line with previous reports demonstrating the need to use demographically corrected MoCA norms for older adults at or above their eighties: performance drops with higher age and lower education [3, 4, 11, 15–18, 34–38].
There is by now ample empirical data showing that using the traditional cut-off at < 26/30 to indicate suspected cognitive impairment is associated with a clear risk of misclassification in older adults. In the present sample, a total of 46% performed below that cut-off (using the 1-point correction for≤12 years of education), a proportion that rose to 61% in the nonagenarians. High proportions have been reported previously and with a quite sizeable variation between studies, e.g., 31–75% [11, 15], or indeed within the same study if the sample is socio-demographically heterogeneous. As already mentioned, Sachs et al. [6] found that 53% to 100% of their older participants (≥75 years of age) performed < 26/30 depending on ethnicity and educational level, showing that methodological differences between studies are only part of the explanation.
Using the cut-off of < 23/30 suggested by Carson et al. [12] would have categorized 13% of the present sample as possibly cognitively impaired, which is close to the 16% when using the regression norms presented here. However, mean MoCA score (25.0) was high compared to some European samples, and relatively low compared to others. For example, Santangelo et al. [35] reported a mean score of 22.0 in an Italian sample aged 21–90 years old, while Thomann et al. [11] reported a mean score of 26.1 in a German sample aged 65–91 years old. Even larger differences can be found in comparison with non-European samples and hence, population-specific, demographically corrected norms remain preferable to universal cut-offs.
Age and education explained 17.2% of the variance in MoCA raw scores. Other studies have been able to explain more variance in MoCA performance, for example 24.4% in the study by Sachs et al. [6] that examined a larger and more divergent sample in terms not just of age, but also ethnicity and sociodemographic factors. By contrast, it is higher than the previous and more homogenous European studies, only two to our knowledge, that report R2 in samples restricted to 65 + individuals: Borland et al. [8] and Thomann et al. [11] found 11% and 12% explained variance, respectively. Their models included gender and sample age-ranges were wider (spanning 20 and 26 years) than in the present study (14 years) and they could thus have been expected to also explain a larger proportion of MoCA variance. Methodological differences complicate comparisons but Borland et al. [8] found lower standardized betas for both age and education (not reported by Thomann et al. [11]). Mean age was, however, just over 10 years higher in the present study and increasing effects of age in the oldest-old is in line with the findings by Malek-Ahmadi et al. [19] who reported modest but incrementally accelerating declines in MoCA scores from around the age of 80. They computed a predicted decline of 1.2 points per decade, close to the 1.3 points per decade found in the present study.
There was no significant interaction between the effects of age and education, which is also in accordance with previous reports [4, 8, 17]. Hence, higher age was associated with lower performance irrespective of education and higher education was associated with better performance irrespective of age. Grouping participants by education as in Fig. 1 showed that those with > 12 years of education outperformed those with≤12 years of education by around 1.5 points, a gap reduced to around 1 point in the 94-year-olds. The +1-point correction for individuals with≤12 years of education helped reduce, but not eliminate, the effect of education on MoCA performance and education was still included in the regression model, another indicator that demographically corrected norms are preferable to more generalized rules.
The more highly educated group was both smaller, younger, and with a higher proportion of males than the lower educated group. Lower MoCA scores in males than females have been reported in two out of the three normative studies including the oldest-oldest that have found gender effects [4, 11]. This is, however, not a typical finding, nor were there any general gender effects in the current study.
At the subdomain level, both higher age and lower education was associated with poorer visuospatial/executive performance while higher age had specific negative effect on language performance, and lower education had a specific negative effect on abstraction performance. The majority did not achieve full scores on the visuospatial/executive subdomain, and very few did in the delayed recall subdomain. That delayed recall is the most difficult item also for cognitively healthy older adults has been reported previously [11, 15] but that as few as 3% achieved a full score appears unique: Narazaki et al. [15] report 17% in individuals aged 65 to 96 years old and Thomann et al. [11] report 30% in individuals aged 65 to 91 years old. Younger mean age in these other two studies may help explain the difference but it may also be related to differences between languages, as well as quality of translation and validation.
The small but significant association between better MoCA performance and higher functional independence corroborates previous findings [39, 40] and adds to the clinical usefulness of the MoCA, as do the findings that test leader and order of presentation, presence of common diseases and level of self-reported sensory limitation did not significantly impact performance. Note that the participants health problems were typically under qualified medical supervision and treatment, and that other studies have indeed found that sensory limitations, when more stringently measured, do have negative effects on MoCA performance [41].
The primary strengths of the present study are the pseudo-random recruitment from the aging population, the careful screen of health status including a medical records search, the large sample size for the age-range, and the use of regression-based norms which avoids the problems with arbitrary age-bands and varying subsample sizes associated with traditional norms [42]. But there are also limitations. The challenge of recruiting participants at or above their eighties is reflected by the decreasing number of participants with increasing age. Sample selectivity differences and possible inclusion of participants with incipient cognitive decline cannot be entirely ruled out in cross-sectional design and it was beyond the scope of the present study to, for example, explore biomarkers that could have helped identify at risk individuals. Using MMSE scores < 26/30 as an exclusion criterion may on the other hand be considered too stringent, but also helps ensure the resulting norms are sufficiently sensitive to capture subtle cognitive impairment [3, 11]: the MoCA was indeed originally suggested to be administered only when MMSE scores were known, or expected, to be≥26/30 [1]. Participants scoring in the range of possible cognitive impairment (MMSE) or depression (PHQ-9) were, however, excluded after data collection and this is a limitation. So is the relatively modest sample size (particularly when it comes to nonagenarians) and the homogeneity of the sample, two factors that limits generalizability. A smaller, demographically matching sample might however be more representative for a particular individual than a larger, more heterogeneous sample, ideally the clinician has access to both [43]. It should also be mentioned that the increased specificity and reduced sensitivity associated with demographically adjusted norms is not always desirable: there are instances when non-stratified norms may be the better choice [44] and hence both are presented here. Further, no single cognitive test is a stand-alone diagnostic tool, but needs to be interpreted in the context of each individual’s history, symptoms, and specific circumstances [45].
Conclusion
The current study provides demographically corrected normative MoCA data for a relatively sizeable sample of cognitively healthy Swedish 80- to 94-year-olds. Results show that in normal aging, the negative impact of increasing age on MoCA performance continues linearly into the nineties and that higher education is associated with better performance. They also support the common finding that the cut-off score originally proposed is too stringent for the oldest-old. Demographic factors need to be taken into account when interpreting MoCA performance in older adults, perhaps particularly in dementia investigations where there is otherwise a risk of over-diagnosing. An easy-to-use tool for normative computation of individual scores is provided to aid clinical interpretation.
ACKNOWLEDGMENTS
We would like to thank our participants for their collaboration, sharing personal information and devoting time and interest to this project. We would also like to thank our colleagues at the Linköping university hospital Memory clinic, especially Ewa Wressle and Inger Rehn, for their enthusiastic help with the project, including recruitment and data collection. A special thanks also to Mats Fredriksson, consultant statistician, and Marie-Louise Söderlund for their most valuable input.
This work was supported by Alzheimerfonden under Grant number AF-648031; Region Östergötland (RÖ) under Grant numbers RÖ-430341, RÖ-751381, RÖ-829391, RÖ-631391, RÖ-825821, FORSS-482931, and ALF Grant numbers RÖ-790811, RÖ-696631, and RÖ-602761.
Authors’ disclosures available online (https://www.j-alz.com/manuscript-disclosures/21-5629r2).
SUPPLEMENTARY MATERIAL
[1] The supplementary material is available in the electronic version of this article: https://dx.doi.org/10.3233/JAD-215629.
REFERENCES
[1] | Nasreddine ZS , Phillips NA , Bedirian V , Charbonneau S , Whitehead V , Collin I , Cummings JL , Chertkow H ((2005) ) The Montreal Cognitive Assessment, MoCA: A brief screening tool for mild cognitive impairment. J Am Geriatr Soc 53: , 695–699. |
[2] | Folstein MF , Folstein SE , McHugh PR ((1975) ) “Mini-Mental State”: A practical method for grading the cognitive state of patients for the clinician. J Psychiatr Res 12: , 189–198. |
[3] | Malek-Ahmadi M , Powell JJ , Belden CM , O’Connor K , Evans L , Coon DW , Nieri W ((2015) ) Age- and education-adjusted normative data for the Montreal Cognitive Assessment (MoCA) in older adults age 70-99. Aging Neuropsychol Cogn 22: , 755–761. |
[4] | Larouche E , Tremblay M-P , Potvin O , Laforest S , Bergeron D , Laforce R , Monetta L , Boucher L , Tremblay P , Belleville S , Lorrain D , Gagnon J-F , Gosselin N , Castellano C-A , Cunnane SC , Macoir J , Hudon C ((2016) ) Normative data for the Montreal Cognitive Assessment in middle-aged and elderly Quebec-French people. Arch Clin Neuropsychol 31: , 819–826. |
[5] | Rossetti HC , Lacritz LH , Cullum CM , Weiner MF ((2011) ) Normative data for the Montreal Cognitive Assessment (MoCA) in a population-based sample. Neurology 77: , 1272–1275. |
[6] | Sachs BC , Chelune GJ , Rapp SR , Couto AM , Willard JJ , Williamson JD , Sink KM , Coker LH , Gaussoin SA , Gure TR , Lerner AJ , Nichols LO , Still CH , Wadley VG , Pajewski NM ((2021) ) Robust demographically-adjusted normative data for the Montreal Cognitive Assessment (MoCA): Results from the systolic blood pressure intervention trial. Clin Neuropsychol, doi: 10.1080/13854046.2021.1967450 |
[7] | Sachdev PS , Blacker D , Blazer DG , Ganguli M , Jeste DV , Paulsen JS , Petersen RC ((2014) ) Classifying neurocognitive disorders: The DSM-5 approach. Nat Rev Neurol 10: , 634–642. |
[8] | Borland E , Nagga K , Nilsson PM , Minthon L , Nilsson ED , Palmqvist S ((2017) ) The Montreal Cognitive Assessment: Normative data from a large Swedish population-based cohort. J Alzheimers Dis 59: , 893–901. |
[9] | Luis CA , Keegan AP , Mullan M ((2009) ) Cross validation of the Montreal Cognitive Assessment in community dwelling older adults residing in the Southeastern US. Int J Geriatr Psychiatry 24: , 197–201. |
[10] | Ahmed S , de Jager C , Wilcock G ((2012) ) A comparison of screening tools for the assessment of mild cognitive impairment: Preliminary findings. Neurocase 18: , 336–351. |
[11] | Thomann AE , Goettel N , Monsch RJ , Berres M , Jahn T , Steiner LA , Monsch AU ((2018) ) The Montreal Cognitive Assessment: Normative data from a German-speaking cohort and comparison with international normative samples. J Alzheimers Dis 64: , 643–655. |
[12] | Carson N , Leach L , Murphy KJ ((2018) ) A re-examination of Montreal Cognitive Assessment (MoCA) cutoff scores. Int J Geriatr Psychiatry 33: , 379–388. |
[13] | Ciesielska N , Sokolowski R , Mazur E , Podhorecka M , Polak-Szabela A , Kedziora-Kornatowska K ((2016) ) Is the Montreal Cognitive Assessment (MoCA) test better suited than the Mini-Mental State Examination (MMSE) in mild cognitive impairment (MCI) detection among people aged over 60? Meta-analysis. Psychiatr Pol 50: , 1039–1052. |
[14] | Pugh EA , Kemp EC , van Dyck CH , Mecca AP , Sharp ES , Alzheimer’s Disease Neuroimaging Initiative ((2018) ) Effects of normative adjustments to the Montreal Cognitive Assessment. Am J Geriatr Psychiatry 26: , 1258–1267. |
[15] | Narazaki K , Nofuji Y , Honda T , Matsuo E , Yonemoto K , Kumagai S ((2013) ) Normative data for the Montreal Cognitive Assessment in a Japanese community-dwelling older population. Neuroepidemiology 40: , 23–29. |
[16] | Cesar KG , Yassuda MS , Porto FHG , Brucki SMD , Nitrini R ((2019) ) MoCA Test: Normative and diagnostic accuracy data for seniors with heterogeneous educational levels in Brazil. Arq Neuropsiquiatr 77: , 775–781. |
[17] | Kopecek M , Stepankova H , Lukavsky J , Ripova D , Nikolai T , Bezdicek O ((2017) ) Montreal cognitive assessment (MoCA): Normative data for old and very old Czech adults. Appl Neuropsychol Adult 24: , 23–29. |
[18] | Lu J , Li D , Li F , Zhou A , Wang F , Zuo X , Jia X-F , Song H , Jia J ((2011) ) Montreal Cognitive Assessment in detecting cognitive impairment in Chinese elderly individuals: A population-based study. J Geriatr Psychiatry Neurol 24: , 184–190. |
[19] | Malek-Ahmadi M , O’Connor K , Schofield S , Coon DW , Zamrini E ((2018) ) Trajectory and variability characterization of the Montreal cognitive assessment in older adults. Aging Clin Exp Res 30: , 993–998. |
[20] | Davis DHJ , Creavin ST , Yip JLY , Noel-Storr AH , Brayne C , Cullum S ((2015) ) Montreal Cognitive Assessment for the diagnosis of Alzheimer’s disease and other dementias. Cochrane Database Syst Rev 2015: , CD010775. |
[21] | Wiig EH , Nielsen NP , Minthon L , Warkentin S ((2002) ) A Quick Test of Cognitive Speed (AQT).. Pearson/PsychCorp, San Antonio, TX. |
[22] | Kiernan RJ , Mueller J , Langston JW , Vandyke C ((1987) ) The Neurobehavioral Cognitive Status Examination: A brief but differentiated approach to cognitive assessment. Ann Intern Med 107: , 481–485. |
[23] | Classon E , van den Hurk W , Wressle E , Rehn I , Johansson MM ((2021) ) A quick test of cognitive speed (AQT): Regression-based norms for cognitively healthy 80 to 94-year olds. Neuropsychol Dev Cogn B Aging Neuropsychol Cogn, doi: 10.1080/13825585.2021.1922585. |
[24] | Kvitting AS , Fällman K , Wressle E , Marcusson J ((2019) ) Age-normative MMSE data for older persons aged 85 to 93 in a longitudinal Swedish cohort. J Am Geriatr Soc 67: , 534–538. |
[25] | Kroenke K , Spitzer RL , Williams JBW ((2001) ) The PHQ-9 - Validity of a brief depression severity measure. J Gen Intern Med 16: , 606–613. |
[26] | Palmqvist S , Terzis B , Strobel C , Wallini A ((2013) ) MMSE-SR: The standardized Swedish MMSE (2nd version). Svensk Förening för Kognitiva sjukdomar, Stockholm. |
[27] | Spitzer RL , Kroenke K , Williams JB ((1999) ) Validation and utility of a self-report version of PRIME-MD: The PHQ primary care study. Primary Care Evaluation of Mental Disorders. Patient Health Questionnaire. JAMA 282: , 1737–1744. |
[28] | EuroQol Group ((1990) ) EuroQol–a new facility for the measurement of health-related quality of life. Health Policy 16: , 199–208. |
[29] | Pfeffer RI , Kurosaki TT , Harrah CH Jr , Chance JM , Filos S ((1982) ) Measurement of functional activities in older adults in the community. J Gerontol 37: , 323–329. |
[30] | Marquardt DW ((1980) ) A critique of some ridge-regression methods - comment. J Am Stat Assoc 75: , 87–91. |
[31] | Van der Elst W , Van Boxtel MPJ , Van Breukelen GJP , Jolles J ((2006) ) The Stroop color-word test - Influence of age, sex, and education; and normative data for a large sample across the adult age range. Assessment 13: , 62–79. |
[32] | Chowdhury MZI , Turin TC ((2020) ) Variable selection strategies and its importance in clinical prediction modelling. Fam Med Community Health 8: , e000262. |
[33] | Cohen J ((1988) ), Statistical power analysis for the behavioral sciences, Academic Press, New York. |
[34] | Gluhm S , Goldstein J , Loc K , Colt A , Van Liew C , Corey-Bloom J ((2013) ) Cognitive performance on the Mini-Mental State Examination and the Montreal Cognitive Assessment across the healthy adult lifespan. Cogn Behav Neurol 26: , 1–5. |
[35] | Santangelo G , Siciliano M , Pedone R , Vitale C , Falco F , Bisogno R , Siano P , Barone P , Grossi D , Santangelo F , Trojano L ((2015) ) Normative data for the Montreal Cognitive Assessment in an Italian population sample. Neurol Sci 36: , 585–591. |
[36] | Abou-Mrad F , Chelune G , Zamrini E , Tarabey L , Hayek M , Fadel P ((2017) ) Screening for dementia in Arabic: Normative data from an elderly Lebanese sample. Clin Neuropsychol 31: , 1–19. |
[37] | Freitas S , Simoes MR , Alves L , Santana I ((2011) ) Montreal Cognitive Assessment (MoCA): Normative study for the Portuguese population. J Clin Exp Neuropsychol 33: , 989–996. |
[38] | Konstantopoulos K , Vogazianos P , Doskas T ((2016) ) Normative data of the Montreal Cognitive Assessment in the Greek population and parkinsonian dementia. Arch Clin Neuropsychol 31: , 246–253. |
[39] | Giebel CM , Challis D ((2017) ) Sensitivity of the Mini-Mental State Examination, Montreal Cognitive Assessment and the Addenbrooke’s Cognitive Examination III to everyday activity impairments in dementia: An exploratory study. Int J Geriatr Psychiatry 32: , 1085–1093. |
[40] | Durant J , Leger GC , Banks SJ , Miller JB ((2016) ) Relationship between the Activities of Daily Living Questionnaire and the Montreal Cognitive Assessment. Alzheimers Dement 4: , 43–46. |
[41] | Dupuis K , Pichora-Fuller MK , Chasteen AL , Marchuk V , Singh G , Smith SL ((2015) ) Effects of hearing and vision impairments on the Montreal Cognitive Assessment. Aging Neuropsychol Cogn 22: , 413–437. |
[42] | Knight RG , McMahon J , Green TJ , Skeaff CM ((2006) ) Regression equations for predicting scores of persons over 65 on the Rey Auditory Verbal Learning Test, the mini-mental state examination, the trail making test and semantic fluency measures. Br J Clin Psychol 45: , 393–402. |
[43] | Strauss E , Sherman EMS , Spreen O ((2006) ), A compendium of neuropsychological tests: Administration, norms, and commentary, Oxford University Press, New York. |
[44] | O’Connell ME , Tuokko H ((2010) ) Age corrections and dementia classification accuracy. Arch Clin Neuropsychol 25: , 126–138. |
[45] | Lezak MD , Howieson DB , Bigler ED , Tranel D ((2012) ) Neuropsychological assessment, Oxford University Press Inc., New York. |


