
Subcortical and Cerebellar Neural Correlates of Prodromal Alzheimer’s Disease with Prolonged Sleep Latency
Abstract
Background:
Despite the important associations among sleep, Alzheimer’s disease (AD), subcortical structures, and the cerebellum, structural and functional magnetic resonance imaging (MRI) with regard to these regions and sleep on patients in AD trajectory are scarce.
Objective:
This study aimed to evaluate the influence of prolonged sleep latency on the structural and functional alterations in the subcortical and cerebellar neural correlates in amyloid-β positive amnestic mild cognitive impairment patients (Aβ+aMCI).
Methods:
A total of 60 patients with aMCI who were identified as amyloid positive ([18F] flutemetamol+) were recruited in the study, 24 patients with normal sleep latency (aMCI-n) and 36 patients prolonged sleep latency (aMCI-p). Cortical thickness and volumes between the two groups were compared. Volumetric analyses were implemented on the brainstem, thalamus, and hippocampus. Subcortical and cerebellar resting state functional connectivity (FC) differences were measured between the both groups through seed-to-voxel analysis. Additionally, group x Aβ interactive effects on FC values were tested with a general linear model.
Result:
There was a significantly decreased brainstem volume in aMCI-p subjects. We observed a significant reduction of the locus coeruleus (LC) FC with frontal, temporal, insular cortices, hippocampus, and left thalamic FC with occipital cortex. Moreover, the LC FC with occipital cortex and left hippocampal FC with frontal cortex were increased in aMCI-p subjects. In addition, there was a statistically significant group by regional standardized uptake value ratio interactions discovered in cerebro-cerebellar networks.
Conclusion:
The aforementioned findings suggest that prolonged sleep latency may be a detrimental factor in compromising structural and functional correlates of subcortical structures and the cerebellum, which may accelerate AD pathophysiology.
INTRODUCTION
Sleep disturbance has been proposed as one of the most potential modifiable risk factors of Alzheimer’s disease (AD) [1]. With physiological aging, sleep latency is less affected than wakefulness after sleep onset [2], and therefore, special attention is needed in those elderly population with prolonged sleep latency. Indeed, healthy controls (HC) with long sleep latency were at increased risk of cognitive decline after 4-year follow up, and long sleep latency decreased the chance of reversion to normal cognition in mild cognitive impairment (MCI) when compared with HC [3]. Moreover, in the elderly HC, prolonged sleep latency was positively correlated with amyloid-β (Aβ) deposition in the prefrontal region covering anterior cingulate cortex [4].
Promotion of sleep and wake, as well as regulation and modulation of non-rapid eye movement sleep and rapid eye movement sleep, are intricately controlled by the brainstem, hypothalamus, thalamus, hippocampus, cerebellum, and cerebral cortex [5, 6]. Sleep latency is one of many measures that assess quality of sleep, and prolonged sleep latency is closely linked to reduced sleep efficiency and duration [7, 8]. Those with prolonged sleep latency are exposed to a less chance of entering into healthy, physiological non-rapid eye movement sleep and rapid eye movement sleep stages [9]. In addition, prolonged sleep latency is often correlated with hyperarousal, which is manifested by complex mechanisms involving hypothalamus-pituitary-adrenal axis, autonomic nervous system, and cortical arousal [10, 11]. Hyperarousal is closely related to the locus coeruleus norepinephrine (LC-NE) system, one of the many brainstem nuclei, with enhanced tonic firing of LC-NE observed in hyperaroused subjects [12]. Despite the critical role of the aforementioned subcortical structures and cerebellum associated with sleep latency, their structural and functional alterations with regard to AD pathology have not been explored.
Indeed, there is a growing attention to the involvement of the subcortical structures at early stage of AD trajectory. Reduced LC, midbrain, and the whole brainstem volume were identified in preclinical AD patients [13], and disrupted brainstem nuclei functional connectivity (FC) disruption was evident in amnestic mild cognitive impairment (aMCI) and AD patients [14]. The LC was identified as a region vulnerable to neurofibrillary tangle formation at incipient stage of AD [15]. In recent literatures, there was a linear increase of thalamic asymmetry as the AD pathology progressed [16], and hippocampal atrophy, hypoconnectivity were identified in MCI converters [17, 18]. Additionally, a close link between the cerebellum and AD should not be overlooked. The cerebellum, especially in MCI subjects, displayed specifically altered patterns in graph metrics in a recent study [19]. Moreover, concurrent involvement of anterior, posterior lobes of the cerebellum in MCI stage was proposed, with more localized involvement of posterior lobes in AD patients [20, 21]. Thus, when evaluating sleep of patients in AD trajectory, comprehensive evaluation of subcortical structures as well as the cerebellum is necessary.
To date, no studies attempted to demonstrate the relationship between sleep, AD, subcortical structures, and the cerebellum, with adoption of both resting state functional magnetic resonance imaging (rsfMRI) and structural MRI analysis methods. rsfMRI studies in AD are particularly important, since patients with amyloid deposition but with clinically apparent cognitive symptoms showed disruptions of brain FC [22]. Although sleep disturbance is repeatedly reported to be a risk factor of AD, whether it is a mediating factor or an interactive factor with Aβ deposition remains elusive [23]. Unraveling the structural and functional alterations of the key anatomical regions involved in regulation of sleep and wake status, especially in prodromal AD population, will be conducive to understanding the aforementioned query.
To the best of our knowledge, this is the first study to explain the critical link between the structural and functional correlates of subcortical structures, the cerebellum, and sleep in patients at prodromal AD. We aimed to investigate how amyloid deposition and prolonged sleep latency interact to generate structural and functional alterations of the subcortical structures and cerebellum in MCI patients. We hypothesized that amyloid positive amnestic mild cognitive impairment (Aβ+aMCI) patients with prolonged sleep latency will display distinct alterations in subcortical structures, especially the brainstem, thalamus, and hippocampus. Moreover, we postulated that the LC, hippocampal, thalamus, and cerebellar FC will be disrupted in Aβ+aMCI patients with prolonged sleep latency, which will be caused by an interaction between amyloid deposition and prolonged sleep latency.
METHODS
Subjects
Sixty aMCI patients (age range of 55–88) were recruited from the Brain Health Center, Yeoui-do St. Mary’s Hospital, College of Medicine, The Catholic University of Korea, Republic of Korea, from March 2017 to March 2020. Every participant underwent the Korean version of the Consortium to Establish a Registry for Alzheimer’s Disease (CERAD-K) [24], including cognitive function tests of verbal fluency (VF), 15-item Boston Naming Test (BNT), the Korean version of the Mini-Mental State Examination (MMSE-K) [25], word list memory (WLM), word list recall (WLR), word list recognition (WLRc), constructional praxis (CP), and constructional recall (CR). All aMCI patients met the Peterson’s criteria of MCI [26, 27] and displayed objective memory impairment scores of 1.5 SDs below the sex-, education-, and age-specific normative means in at least one cognitive domains testing for episodic memory: WLM, WLR, WLRc, or CR tests. Other cognitive domains other than the aforementioned four domains were all above 1.5 SDs above sex-, education-, and age-specific normative means. CDR of 0.5 was rated in all our subjects [28]. All the participants were identified as Aβ positive (Aβ+), according to the methods described below in positron emission tomography (PET) acquisition section. All sixty participants were devoid of any histories of cerebrovascular events or evidence of cerebrovascular lesions, substance abuse, head trauma, psychiatric disorders, prescription of psychotropic medication including antidepressants, acetylcholinesterase inhibitors, antipsychotics, or hypnotics. The study was conducted in accordance with the ethical and safety guidelines of the local Institutional Review Board of the Catholic University of Korea and written informed consent was obtained from all study subjects. The local Institutional Review Board of the Catholic University of Korea approved this study following the principles set forth by the Declaration of Helsinki.
Assessment of sleep latency
The validated Korean version of Pittsburgh sleep quality index (PSQI) [29] was conducted on every subject, and the 2nd item of PSQI was adopted, asking each patient, “How long (in minutes) has it taken you to fall asleep each night?”. Prolonged sleep latency was defined as those with sleep latency of 30 minutes or more [30].
APOE genotyping
The QIAmp Blood DNA Maxi Kit protocol (Qiagen, Valencia, CA) was used for DNA isolation. Genotypes for two APOE SNPs, rs429358 (E*4) and rs7412 (E*2), were identified by utilizing TaqMan SNP genotyping assays (Applied Biosystems, Foster City, California).
[18F] Flutemetamol (FMM) PET-CT image acquisition, assessments, and standardized uptake value ratio (SUVR) calculations
[18F] FMM was produced and FMM-PET data were collected and analyzed as previous described [31]. Each individual participant’s MRI was used for co-registration and definition of region of interest (ROI) for correcting partial volume effects elicited from cerebrospinal space expansion accompanied by cerebral atrophy. A 90-min post-injection point SUVR was utilized to analyze the FMM PET data, with pons ROI as a reference. Global Aβ was demonstrated as the average SUVR of the mean for the six cortical ROIs including frontal, superior parietal, lateral temporal, striatum, anterior, and posterior cingulate cortex/precuneus ROIs. A cut-off SUVR value of 0.62 was used to assess “high” or “low” neocortical SUVR, with amyloid positivity defined as presentation of at least one cortical ROI with SUVR value of 0.62 or more [31].
MRI acquisition
Imaging data were collected at the Department of Radiology, Yeouido St. Mary’s Hospital, The Catholic University of Korea, using a 3 T Siemens Skyra machine and 32 channel Siemens head coil (Siemens Medical Solutions, Erlangen, Germany). The parameters used for the T1-weighted volumetric magnetization-prepared rapid gradient echo scan sequences were TE = 2.6 ms, TR = 1,940 ms, inversion time = 979 ms, FOV = 230 mm, matrix = 256×256, and voxel size = 1.0×1.0×1.0 mm3. Resting state functional images were collected using a multiband gradient-echo EPI acquisition, with TE = 86.0 ms, TR = 3,100 ms, slice acceleration factor = 3, slice thickness = 2 mm, FOV = 224 mm, matrix = 128×128×29, and voxel size = 1×1×2 mm3. 150 volumes were acquired over 5 min with the instruction “keep your eyes closed and think of nothing in particular”.
Resting state functional connectivity analysis
Functional pre-processing
The CONN toolbox Version 20.b. was utilized to preprocess and analyze functional imaging data and calculate FC [32] The default CONN preprocessing pipeline was adopted in the process. Realignment, unwarping, slice-time correction, scrubbing with ART-based identification for outlier scans, segmentation into grey matter (GM), white matter (WM), and cerebrospinal fluid (CSF), normalization to the Montreal Neurological Institute (MNI) template, smoothing using an 8-mm Gaussian kernel were implemented. Due to the multiband gradio echo-planar imaging acquisition adopted in the current study, the slice timing of DICOM images of each subject was extracted for slice time correction. After preprocessing, the CONN denoising pipeline was implemented to regress confounding effects out of the BOLD signal. Denoising from residual movement and physiological noise was conducted. WM, CSF and outliers detected by ART were all entered into linear regression as confounders. Subject motion correction was done, and linear de-trending was implemented, and the default band-pass filter of [0.008 0.09] Hz was applied.
Seed selection
We used the default seeds of the CONN toolbox, with MNI coordinates of the anterior cerebellar network (x = 0, y = –63, z = –30), posterior cerebellar network (x = 0, y = –79, z = –32), left hippocampus (x = –45.22, y = –20.04, z = 17.31), right hippocampus (x = 46.04, y = –17.36, z = 16.89), left thalamus (x = –9.99, y = –19.16, z = 16.28), and right thalamus (x = 10.92, y = –18.50, z = 16.60). As for the seed region of the LC, we used 5-mm-radius spheres centered at the MNI coordinates of the LC, which corresponded to the location of the LC according to previous reports [33], masking with FSL MNI152 template brain. A previous report by Keren et al. demonstrated 12 different LC MNI coordinates according to right and left orientation [33]. We constructed 12 LC masks on the standard MNI152 in FSLeyes and ran one sample t-tests on each seed, in all the subjects to map regions of connectivity significantly different from 0, assessing for the best seed that would demonstrate FC to closest regions reported to be positively or negatively associated with the LC in a previous study on mapping of the human LC FC [34]. Ultimately, out of 12 MNI coordinates, MNI coordinate of the LC (x = 4.6, y = –36.6, z = –21) was selected to test for group level analysis. Detailed information on target region definition and results of one sample t-test on the seed of the LC (x = 4.6, y = –36.6, z = –21) are attached in the Supplementary Material.
Seed-to-voxel analysis
In first-level analyses, computation of seed-to-voxel connectivity maps were implemented in each subject, and these measures were adopted in group level-analysis. Between-subjects [aMCI-p(1) aMCI-n(-1)] contrasts were used to run for seed-to voxel analysis, controlling for APOE carrier status, to assess whether there are statistically significant differences between the hippocampal, thalamic, LC and cerebellar FC between the two groups. All comparisons throughout the whole brain adopted voxel-wise statistics, thresholded at p < 0.05, false discovery rate (FDR) corrected for cluster level and p < 0.001, uncorrected for voxel level.
Voxel-based morphometry
VBM across the entire brain were implemented using the Computational Anatomy Toolbox (CAT) 12, an extension to Statistical Parametric Mapping software (SPM12). 3-dimensional T1 images were segmented in native-space in to three tissue classes: GM, WM, and CSF [35]. Then, alignment with nonlinear modulation of GM and WM volumes were conducted using the default DARTEL (diffeomorphic anatomical registration using exponential Lie algebra) [36]. Subsequently, normalization into the Montreal Neurological Institute Space (ICBM) was implemented, followed by smoothing by an isotropic Gaussian kernel of 8 mm full-width at half-maximum (FWHM).
Surface-based analysis of cortical thickness
Surface-based analysis of cortical thickness was implemented through the automated surface-preprocessing algorithms in CAT12 toolbox. Surface-based cortical thickness data of both hemispheres of each participant were merged and smoothed with a 15 mm FMHM Gaussian kernel. We followed the common second-level models and algorithms in the CAT12 toolbox and conducted a two-sample t-test between the two groups. The cortical thickness of each hemisphere was compared between aMCI-p and aMCI-n groups.
Brainstem, thalamus, hippocampal volume analysis
The FIRST tool, part of FSL (FMRIB’s Software Library, http://www.fmrib.ox.ac.uk/fsl/), was used to automatically segment the hippocampus within the Bayesian Appearance Model framework as described in a previous study [37]. During registration, the three-dimensional magnetization-prepared rapid gradient echo images were transformed to the MNI 152 standard space by affine transformations on the basis of d.f. = 12. After registration, a subcortical mask was applied to locate the different subcortical structures, followed by segmentation on the basis of shape models and voxel intensities. Absolute volumes of subcortical structures were calculated, taking into account the transformations performed in the first stage. Finally, a boundary correction was used to determine which boundary voxels belonged to the structure or not. Fslstats were used to calculated volumes of each structure. Volumes of brainstem, thalamus, and hippocampus were normalized with total intracranial volume (TICV), CAT12. The normalized volumes were defined as NV (normalized volume) = mean TICV×volume/TICV. Normalized volumes of brainstem, thalamus, and hippocampus were compared between Aβ+aMCI with prolonged sleep latency (aMCI-p) and aMCI with normal sleep latency (aMCI-n), with analysis of covariance approach, controlling for apolipoprotein ɛ4 (APOE4) carrier status. Left and right were analyzed separately. All statistical analyses used a two-tailed α significance level of 0.01 after Bonferroni correction for multiple comparisons.
Statistical analyses
All demographic data were analyzed with R software (version 4.1.0) [38]. Age, education, sleep latency, and CERAD-K parameters were compared between aMCI-n and aMCI-p with independent two sample t-test. Categorical variables including gender and APOE4 carrier status were compared with chi square test. In addition, the general linear model with FC as the outcome variable, with sleep latency group, global and regional SUVR as independent variables, were performed as well as their interactions All statistical analyses used a two-tailed α level of 0.05 for the definition of statistical significance.
RESULTS
Demographic and clinical data
Demographic and clinical characteristics of study participants are summarized in Table 1. The participants were dichotomized into two groups, aMCI-n and aMCI-p, according to their sleep latency status. There was no statistical difference between age, education, gender, APOE4 carrier status, and subscores of CERAD-K (Table 1) Both groups were amyloid positive, with Global SUVRPONS of 0.7±0.1 for aMCI-n and 0.7±0.1 for aMCI-p. There was no significant difference of Global SUVRPONS (SUVR of [18F] FMM, with pons as a reference region) or regional SUVRPONS between the two groups.
Table 1
Demographic and clinical characteristics of the study participants (N = 60)
| aMCI-n | aMCI-p | p | |
| (N = 36) | (N = 24) | ||
| Age (y±SD) | 74.1±7.1 | 75.8±6.8 | 0.386 |
| Education (y±SD) | 10.6±5.5 | 10.1±4.9 | 0.728 |
| Gender (M:F) | 20: 16 | 16: 8 | 1.728 |
| APOE4 carrier (Yes, %) | 44.4 | 41.7 | 1.000 |
| Sleep latency (min±SD) | 7.4±6.9 | 47.9±24.7 | < 0.001* |
| CERAD-K Battery (SD) | |||
| VF | 11.6±4.8 | 12.0±3.7 | 0.748 |
| BNT | 9.6±3.6 | 9.5±3.0 | 0.901 |
| MMSE | 24.2±4.1 | 24.5±2.9 | 0.731 |
| WLM | 13.9±4.9 | 13.8±4.0 | 0.927 |
| CP | 10.4±1.2 | 9.8±1.7 | 0.145 |
| WLR | 2.6±1.7 | 2.9±1.7 | 0.473 |
| WLRc | 6.4±2.5 | 7.1±2.2 | 0.282 |
| CR | 3.8±3.2 | 2.5±1.9 | 0.056 |
| Global SUVRPONS | 0.7±0.1 | 0.7±0.1 | 0.772 |
| Regional SUVRPONS | |||
| ACC | 0.7±0.1 | 0.7±0.1 | 0.463 |
| FL | 0.6±0.1 | 0.6±0.2 | 0.973 |
| PL | 0.5±0.1 | 0.5±0.2 | 0.800 |
| PCC/Precuneus | 0.8±0.2 | 0.8±0.2 | 0.506 |
| TL | 0.6±0.1 | 0.6±0.1 | 0.810 |
*p < 0.05. aMCI-n, amnestic mild cognitive impairment with normal sleep latency; aMCI-p, amnestic mild cognitive impairment with prolonged sleep latency; SD, standard deviation; MCI, mild cognitive impairment; APOE, Apolipoprotein E; CERAD-K, the Korean version of Consortium to Establish a Registry for Alzheimer’s Disease; VF, verbal fluency; BNT, 15-item Boston Naming Test; MMSE, Mini-Mental Status Examination; WLM, word list memory; CP, constructional praxis; WLR, word list recall; WLRc, word list recognition; CR, constructional recall; SUVRPONS, standardized uptake value ratios of [18F] flutemetamol, with pons as a reference region; ACC, anterior cingulate cortex; FL, frontal lobes; PL, parietal lobes; PCC, posterior cingulate cortex; TL, lateral temporal lobes.
Results from the VBM and surface-based analysis of cortical thickness
There were no regions with statistically significant differences in volumes or cortical thickness between aMCI-n and aMCI-p groups.
Results from the volumetric analysis of brainstem, hippocampus, and thalamus
Results from the volume analysis is summarized in Table 3. There was a significant reduction of normalized brain stem volume in aMCI-p group (p = 0.004). There was no significant difference in bilateral hippocampal volumes between aMCI-p and aMCI-n groups. As for the thalamus, there was a trend for reduction of left thalamic volume (p = 0.036) in aMCI-p group when compared with aMCI-n group, but it did not survive after correction for multiple comparisons.
Results from seed-to-voxel analysis: Difference of the LC FC between aMCI-p and aMCI-n
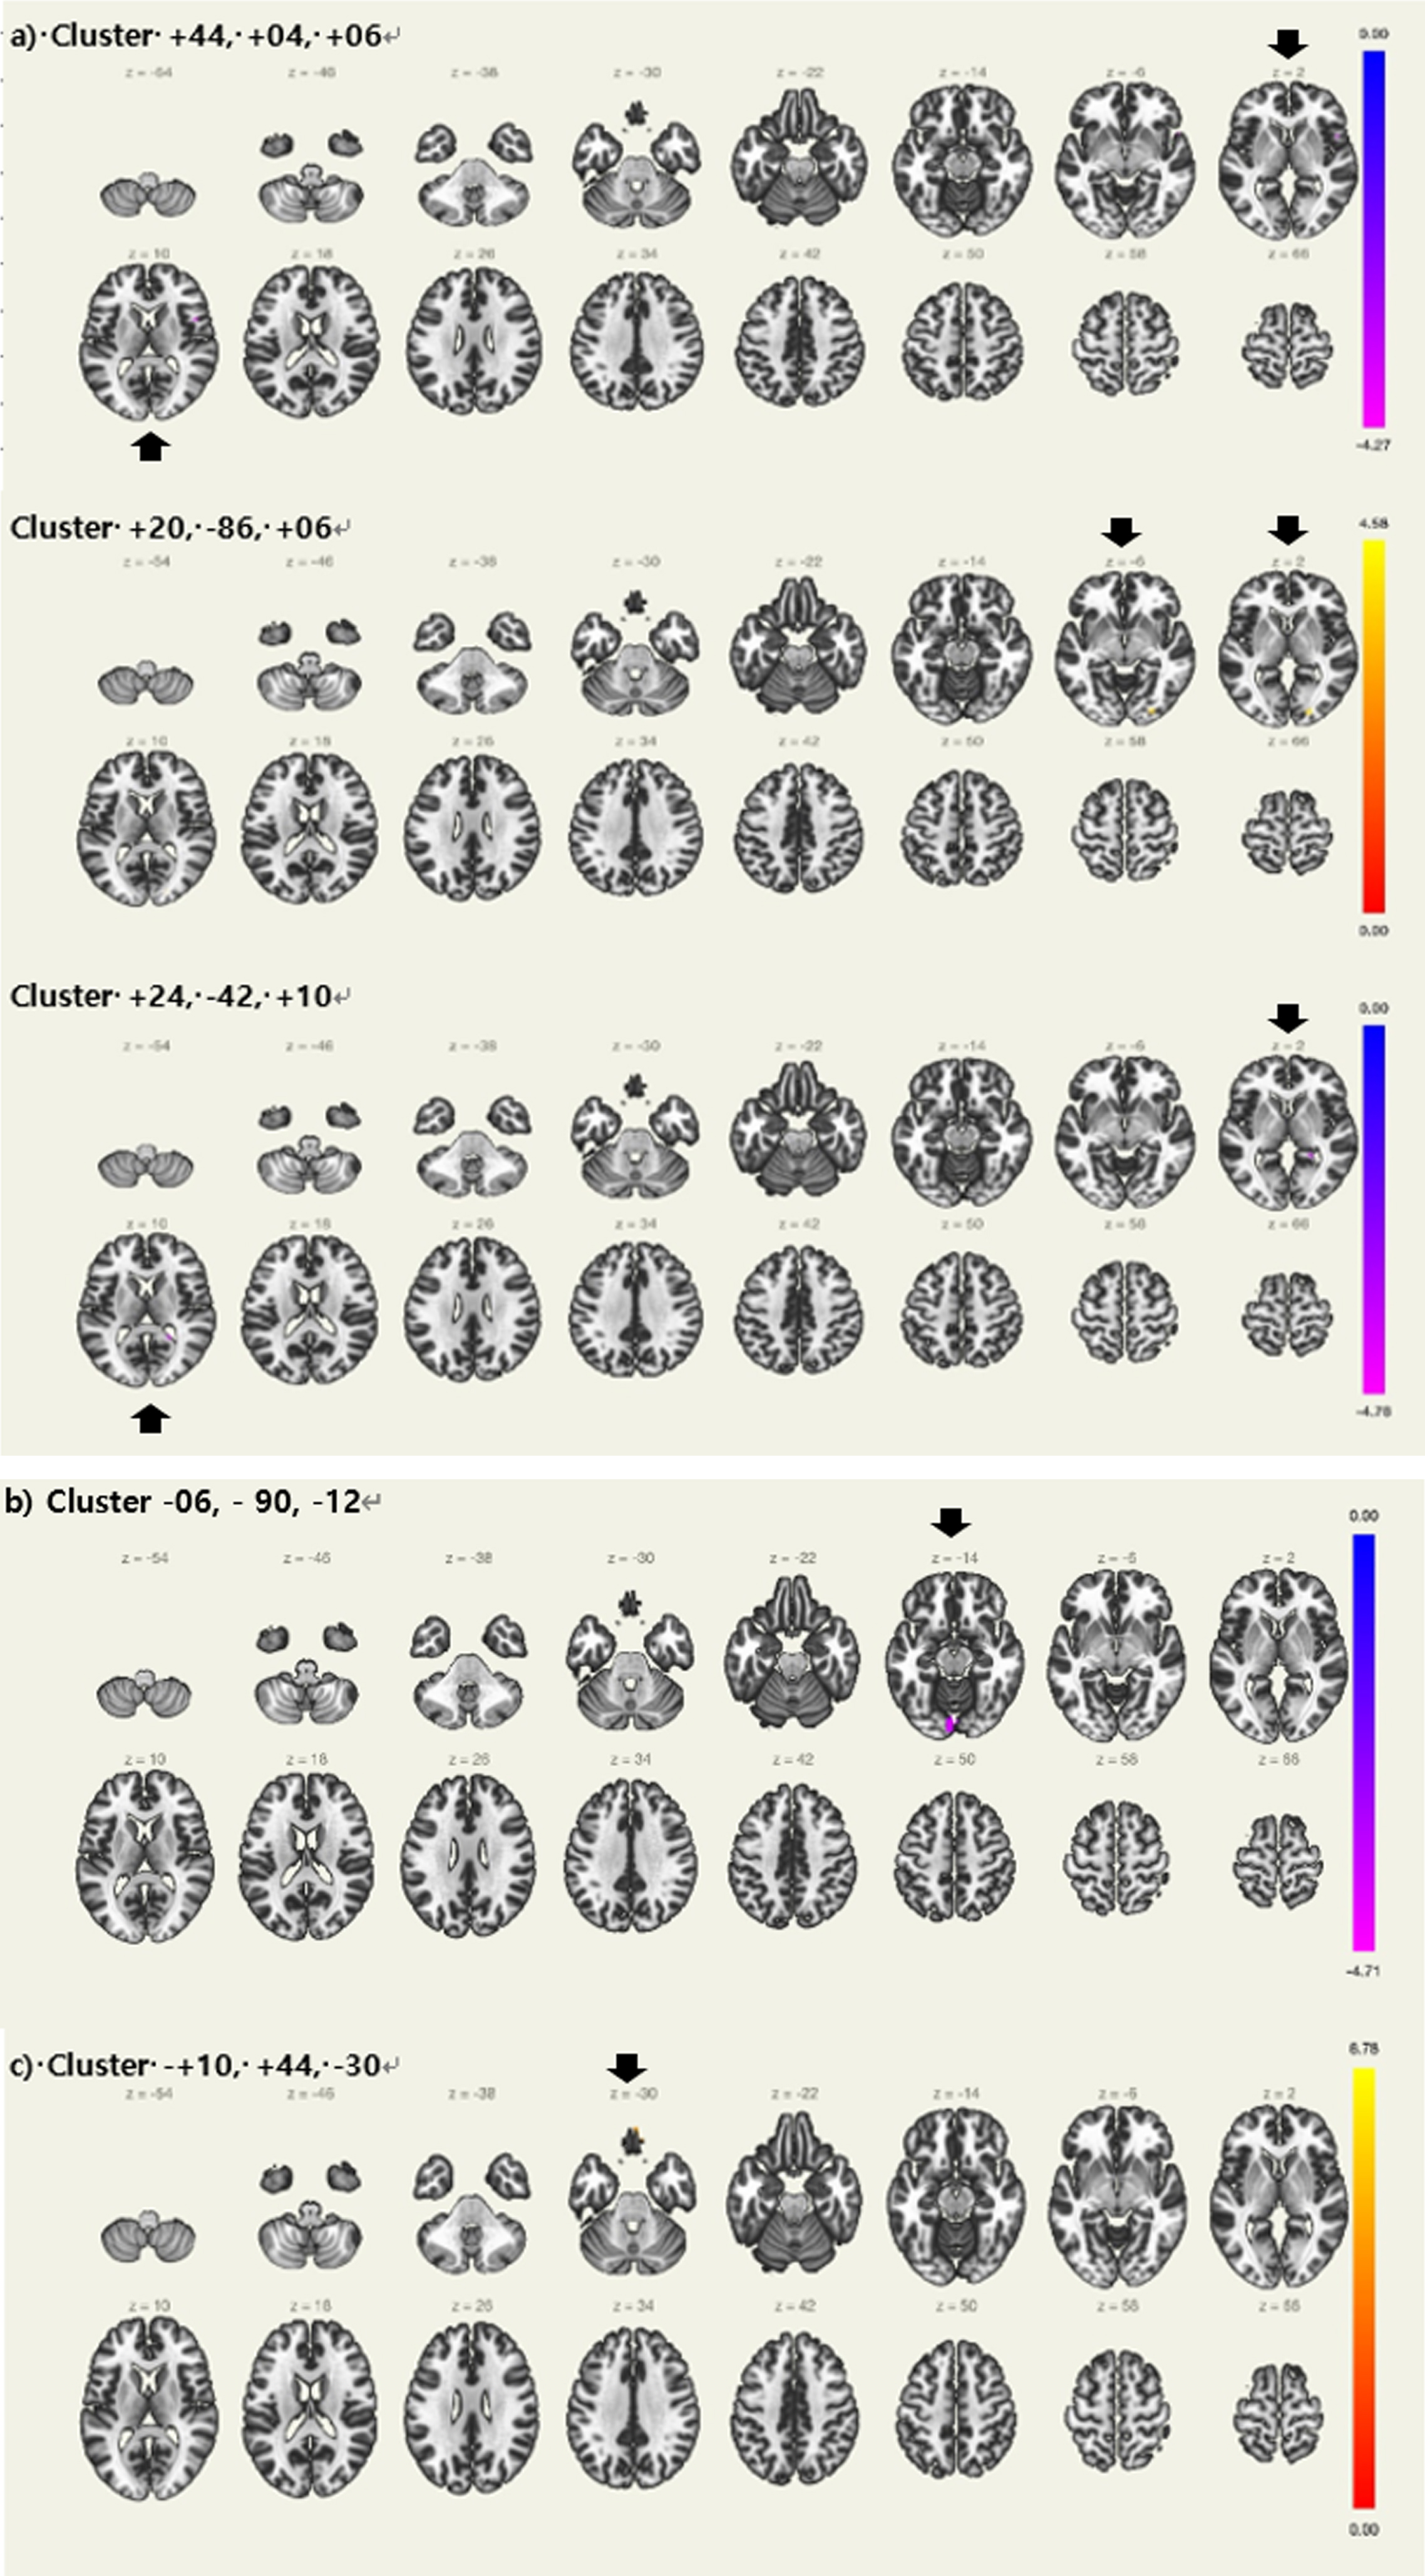
Seed regions of interest for the LC and their MNI coordinates are summarized in Table 2. Table 4 and Fig. 1a shows the detailed results of the seed-to-voxel analysis of the LC FC. The seed-to-voxel analysis revealed that aMCI-p showed a significantly decreased LC FC with right central opercular cortex, right inferior frontal gyrus, pars opercularis, right frontal operculum cortex, right temporal pole, right insular cortex, and right precentral gyrus. (+44, +04, +06). Moreover, there was a significantly decreased LC FC with right hippocampus. (+24, –42, +10), In contrast, aMCI-p showed a significantly increased LC FC with right lateral occipital cortex, inferior division, right occipital fusiform gyrus, and right occipital pole. (+20, –86, +06)
Table 2
Seed regions used for the resting state connectivity analyses
| Seed region &network | Coordinates (MNI) | ||
| x | y | Z | |
| Anterior cerebellar network | 0 | –63 | –30 |
| Posterior cerebellar network | 0 | –79 | –32 |
| Locus coeruleus | 4.6 | –36.6 | –21 |
| Left hippocampus | –45.22 | –20.04 | 17.31 |
| Right hippocampus | 46.04 | –17.36 | 16.89 |
| Left thalamus | –9.99 | –19.16 | 16.28 |
| Right thalamus | 10.92 | –18.50 | 16.60 |
MNI, Montreal Neurological Institute.
Table 3
Results from volumetric analysis of brainstem, hippocampus, and thalamus
| Normalized volume ([mean±SD(mm3)] | aMCI-n | aMCI-p | p |
| (N = 36) | (N = 24) | ||
| Brain stem volume | 21293.9±1937.2 | 19918.2±1320.3 | 0.004* |
| Left hippocampal volume | 3109.6±403.6 | 2890.3±519.3 | 0.075 |
| Right hippocampal volume | 3253.0±490.3 | 3012.3±515.6 | 0.078 |
| Left thalamic volume | 6948.7±514.6 | 6607.3±668.5 | 0.036 |
| Right thalamic volume | 6691.4±526.7 | 6481.9±582.2 | 0.1594 |
*p value < 0.01, after Bonferroni correction. All analyses were controlled for apolipoprotein ɛ4 carrier status.
Table 4
Results from seed-to-voxel analysis (Voxel threshold: p < 0.001, uncorrected, Cluster threshold: p < 0.05, cluster-size p-FDR corrected)
| Seed region &network | Clusters (x,y,z) | Regions covered by the cluster | Cluster | Size | Peak |
| Size | p-FDR | p-uncorrected | |||
| Group differences (aMCI-p < aMCI-n) | |||||
| Locus coeruleus | +44, +04, +06 | 1) Right central opercular cortex | 112 | 0.018590 | 0.000074 |
| 2) Right inferior frontal gyrus, pars opercularis | |||||
| 3) Right frontal operculum cortex | |||||
| 4) Right temporal pole | |||||
| 5) Right insular cortex | |||||
| 6) Right precentral gyrus | |||||
| +24, –42, +10 | 1) Right hippocampus | 84 | 0.024587 | 0.000013 | |
| Left thalamus | –06, –90, –12 | 1) Left lingual gyrus | 174 | 0.003211 | 0.000016 |
| 2) Left occipital pole | |||||
| 3) Right lingual gyrus | |||||
| Group differences (aMCI-p > aMCI-n) | |||||
| Locus coeruleus | +20, –86, +06 | 1) Right lateral occipital cortex, inferior division | 86 | 0.024587 | 0.000025 |
| 2) Right occipital fusiform gyrus | |||||
| 3) Right occipital pole | |||||
| Left hippocampus | +10, +44, –30 | 1) Right frontal pole | 112 | 0.014684 | < 0.000001 |
| 2) Frontal medial cortex | |||||
| 3) Left frontal pole | |||||
| Sleep latency group by posterior cingulate cortex SUVR interaction | |||||
| Anterior cerebellar network | +12, +40, +44 | 1) Right frontal pole | 321 | 0.000062 | 0.000006 |
| 2) Right superior frontal gyrus | |||||
| 3) Left superior frontal gyrus | |||||
| Sleep latency group by parietal SUVR interaction | |||||
| Posterior cerebellar network | +26, +08, –48 | 1) Right temporal pole | 131 | 0.019646 | 0.000021 |
| 2) Right temporal fusiform cortex, anterior division | |||||
| 3) Right parahippocampal gyrus, anterior division | |||||
aMCI-n, amnestic mild cognitive impairment with normal sleep latency; aMCI-p, amnestic mild cognitive impairment with prolonged sleep latency; SUVR, standardized uptake value ratio; FDR, false-discovery rate.
Fig. 1
Regions with differences in resting state functional connectivity between Aβ+aMCI with prolonged sleep latency and normal sleep latency controlling for apolipoprotein ɛ4 carrier status a) Locus coeruleus. b) Left thalamus, c) Left hippocampus, Aβ+ aMCI = Amyloid positive amnestic mild cognitive impairment (Black arrows showing regions with significance).
Results from seed-to-voxel analysis: Difference of the thalamus and hippocampal FC between aMCI-p and aMCI-n
Seed regions of interest for the bilateral thalamus, hippocampi, and their MNI coordinates are summarized in Table 2. Table 4 and Fig. 1b and c shows the detailed results of the seed-to-voxel analysis of the thalamic and hippocampal FC. The seed-to-voxel analysis revealed that aMCI-p showed a significantly decreased left thalamic FC with bilateral lingual gyrus and left occipital pole. (–06, –90, –12) In contrast, aMCI-p showed a significantly decreased left hippocampal FC with right frontal pole, frontal medial cortex and left frontal pole (+10, +44, –30).
Results from seed-to-voxel analysis: Regions showing significant sleep latency group by regional SUVR interactions
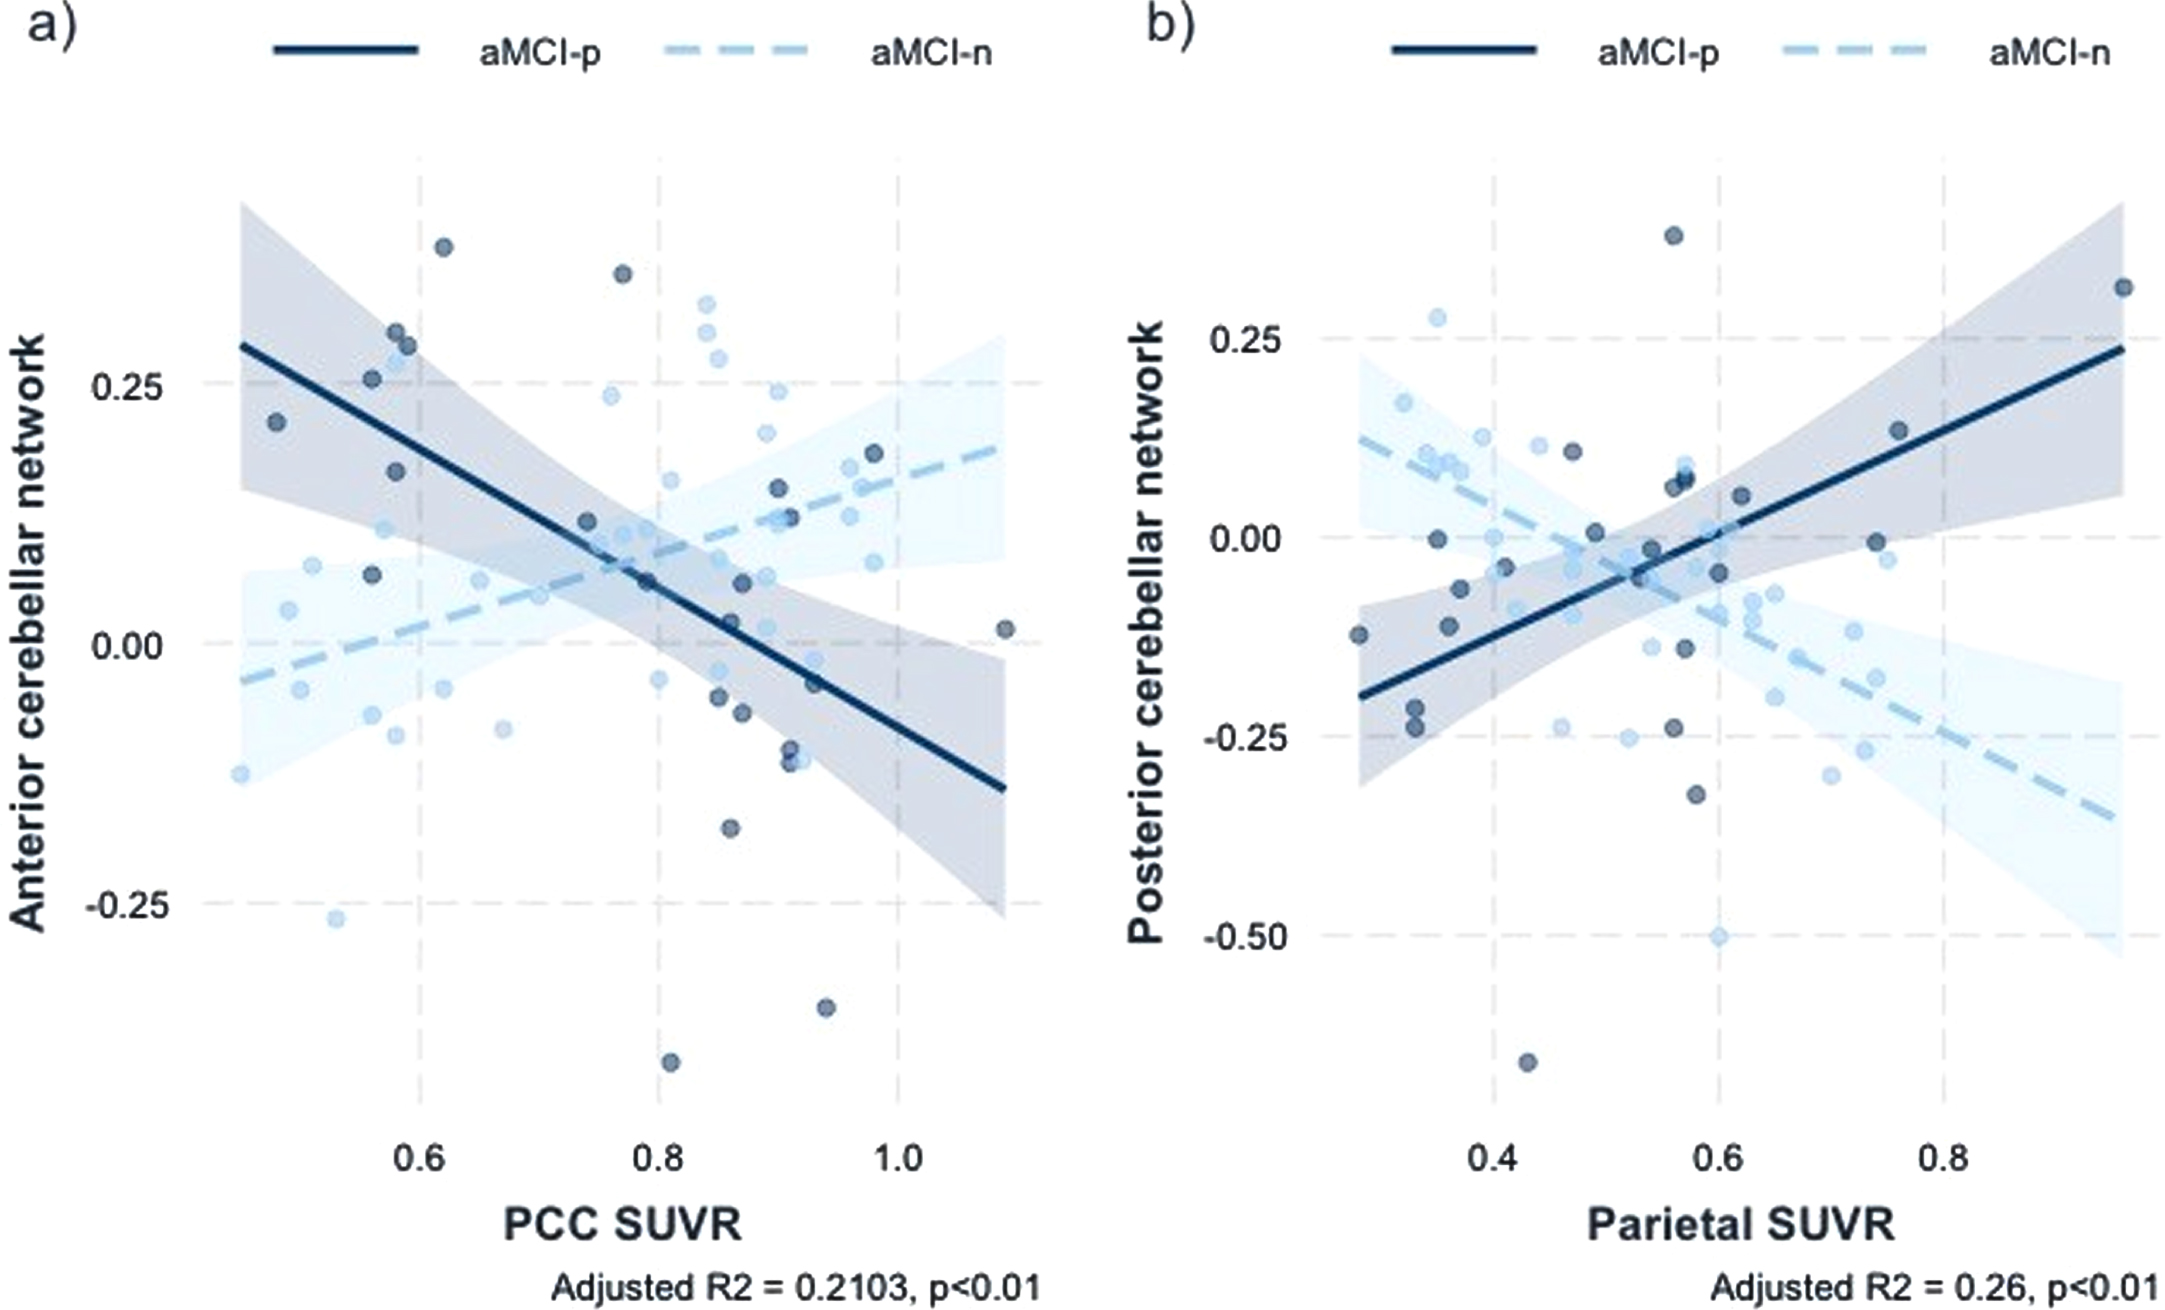
There were no significant regions with significant group by global SVUR interactions. Regions showing a significant sleep latency group×regional SUVR interactions are summarized in Table 4 and Fig. 2. There was a significant sleep latency group x posterior cingulate cortex (PCC) SUVR interaction in the anterior cerebellar network FC with right frontal pole and both superior frontal gyrus (+12, +40, +44) (Standardized β coefficient = –1.0232, F = 6.24, Adjusted R2 = 0.21, p < 0.01). Moreover, there was a significant sleep latency group x parietal SUVR interaction in the posterior cerebellar network FC with right temporal pole, right temporal fusiform cortex, anterior division, right parahippocampal gyrus, anterior division (+26, +08, –48) (Standardized β coefficient = 1.3566, F = 7.85, Adjusted R2 = 0.26, p < 0.01).
Fig. 2
a) Association anterior cerebellar network rsFC with the interaction of sleep latency and PCC SUVR b) Association of posterior cerebellar network rsFC with the interaction of sleep latency and parietal SUVR. SUVR, standardized uptake value ratio; rsFC, resting-state functional connectivity; aMCI-p, amnestic mild cognitive impairment patients with prolonged sleep latency; aMCI-n, amnestic mild cognitive impairment patients with normal sleep latency.
DISCUSSION
To the best of our knowledge, this is the first study to demonstrate structural and functional alterations of the subcortical structures of Aβ+aMCI patients, with stringent stratification based on neuropsychological MRI, APOE genotyping, and amyloid PET. According to our results, there was a significant reduction of the brainstem and left thalamic volume in aMCI-p subjects. Moreover, aMCI-p group showed a significantly decreased LC FC with frontal, temporal, insular cortices, and hippocampus. In addition, left thalamic FC with to occipital cortex was reduced in aMCI-p group. In contrast, the LC FC with occipital cortex and fronto-hippocampal FC were decreased in aMCI-p subjects. There was a significant group by regional SUVR interaction in posterior cerebellar-temporal FC and anterior cerebellar-frontal FC. These findings convey several important clinical implications.
Reduction of the brainstem and thalamic volume in aMCI-p group
While there were no differences in cortical thickness or volume between the two groups, there was a significant reduction of the brainstem and left thalamic volume in aMCI-p group. This is concordant with a previous study result where MCI subjects exhibited reduced whole brainstem volume, and \nobreak substructures such as the LC, pons, and midbrain when compared with controls [13]. Structural alterations of the brainstem and associated substructures which are closely related to the neurotransmitter system that intricately control sleep and arousal at earliest stage of AD has been replicated in previous studies [39, 40]. In addition, the mammalian brainstem is a critical region for promoting slow wave sleep [41], which plays an indispensable role in reactivating and consolidating episodic memory [42]. The fact that aMCI-p group showed smaller brainstem volume in our result conveys a message that sleep disturbance manifested by prolonged sleep latency may indeed be a neurotoxic factor that instigated structural alterations in aMCI patients. As for the thalamic volume, a recent study on cognitively normal subjects revealed that those with insomnia displayed a reduced thalamic volume and there was a significant interactive effect of APOE4 genotype and insomnia [43]. In our subjects, even when controlled for the effect of APOE4 carrier status, the left thalamic volume showed a trend for reduction in aMCI-p subjects. The thalamus is a key region in ascending reticular activating system, and with its intricate crosstalk with hippocampus and cerebral cortex, it plays a critical role in sleep-dependent memory. The neurotoxic effect of sleep deprivation on thalamic volume was reported in a recent animal study on rats, showing a trend of decreased thalamic volume even after one day of sleep deprivation [44]. Prolonged sleep latency, one of many phenotypes of insomnia, may have caused this thalamic structural alteration in our aMCI-p subjects. Reciprocally, an underlying AD neurodegenerative process in the brainstem and thalamus may have become apparent with the clinical phenotype of prolonged sleep latency.
LC FC disparities between aMCI-p and aMCI-n group
There was a significant difference of the LC FC with frontal, insular cortex, hippocampus, and occipital cortex in aMCI-p subjects. The LC FC with insular cortex was reduced in aMCI-p group. Insular cortex is a major node of the salience network (SN) [45], which is purported to play a critical role in switching between the default mode network (DMN) and the central executive network [46]. Compared to AD and HC, aMCI exhibited major internetwork FC of the SN [47], and the SN of SCD and aMCI were disrupted when compared with HC [48]. A recent study reported that the LC-NE system and SN were closely connected, with a reduced FC between the LC and SN resulting in impaired attentional and executive function in older adults [49]. Prolonged sleep latency may have exerted a detrimental effect on the LC FC with the SN, which was demonstrated by the decreased LC FC with insular cortex in aMCI-p group.
Meanwhile, reduction of the LC FC with frontal and temporal cortices was observed in our results. The LC has efferent projections to the prefrontal cortex (PFC), and the interaction between the LC and frontal cortex was suggested to play an integral role in synaptic plasticity [50]. Axons from orbitofrontal cortex (OFC), important for appraisal of cost and reward, were found to synapse on the LC [51]. Control of attention and response inhibition was mediated by the LC projections to the dorso-medial PFC and the ventro-lateral OFC [52]. In a previous study, the left LC connectivity to the left parahippocampal gyrus was reduced in aMCI patients [53]. Moreover, the LC displayed functional hypoconnectivity to the medial temporal lobe during novelty processing, and this predicted Aβ-related cognitive deterioration [54]. The fact that aMCI-p presented with decreased LC FC with insular cortex and frontal and temporal cortices when compared with aMCI-n might indicate the detrimental effect of prolonged sleep latency on brain networks and cognitive function of subjects within AD trajectory.
In addition, the LC FC with right hippocampus was reduced in aMCI-p subjects. Hippocampal release of norepinephrine controls for novel contextual and recognition memory [55, 56]. The LC innervates hippocampal cornu ammonis (CA1), and a recent study reported that norepinephrine antagonism prevented dopamine-mediated long-term potentiation in CA1 [57]. In this regard, increased noradrenergic input is expected to enhance hippocampal response, but aMCI-p subjects, who are presumed to be hyperaroused, with upregulated LC-NE system, displayed reduced LC FC to hippocampus. A possible explanation for this would be selective adrenergic receptor involvement in regulating hippocampal theta rhythm reported in an animal study [58], and indeed, a recent study identified β-adrenoceptors specially recruited in excitation-spike coupling in CA1 neurons [59]. The LC-NE system, its connection to hippocampus, and noadrenergic signaling may be disrupted in aMCI-p subjects, resulting in reduced LC FC with hippocampus. A recent review indicated that the LC neurons were particularly vulnerable to neurofibrillary tangle formation, and this process was mediated by binding of Aβ oligomers to an allosteric site on α2A-adrenoreceptor [15]. According to a previous study by Holth et al., interstitial fluid and CSF tau levels were increased during wake, and this phenomenon was amplified by sleep deprivation, augmenting tau burden [60]. Moreover, this burden extended tau pathology from hippocampus to the LC [61]. Sleep disturbance manifested by prolonged sleep latency could have mediated the aforementioned pathological process.
As for the increased LC FC with occipital cortex observed in aMCI-p group, several interesting interpretations can be inferred. In a previous study on patients with chronic insomnia disorder, insomnia duration was closely associated with the LC-occipital cortex FC, and this was supported to be a representation of hyperaroused state of the visual cortex [62]. In a FC study adopting a machine learning algorithm in classification of subjects at early stages of AD, occipital cortex was identified as a rsfMRI hub node in MCI converters [63]. Another study comparing MCI non-converters and MCI converters, significantly reduced FC was observed between occipital cortex and angular gyrus [64]. Despite previous literatures demonstrating a close association between AD patients, optic nerve, and retinal neural structures [65, 66], the role of occipital cortex and associated visual function at early stages of AD trajectory has been underestimated. A previous tau PET study indicated that occipital cortex was one of the regions discriminating preclinical AD patients from cognitively normal participants [67]. In the presence of Aβ deposition, neurofibrillary pathology was evident in the Brodmann area 19 of visual cortex in preclinical AD [68]. According to our results, we hypothesize that disruption of visual processing and occipital FC may start from an early stage of AD, and the brain may attempt to compensate for the failing function by increasing the LC FC to the occipital cortex. Hyperarousal and resultant prolonged sleep latency may be a phenotype of this underlying compensatory process, manifested by increased LC-FC to the occipital cortex in aMCI-p subjects.
Thalamic and hippocampal FC disparities between aMCI-n and aMCI-p group
Left thalamic FC with both occipital cortices were decreased in aMCI-p group when compared with aMCI-n group. Resting-state electroencephalogram studies reported alterations of the alpha rhythm, originating from the thalamo-cortio-occipital circuit, in the early stage of AD [69, 70]. With regard to sleep, a crosstalk between thalamus and cerebral cortex is integral to the generation of slow wave activity during NREM sleep [71]. Moreover, in the visual system, sleep was a critical factor contributing to synaptic plasticity [72]. Disrupted sleep in aMCI-p subjects may have disrupted thalamo-occipital circuit, and whether this was a synergistic effect with AD pathology or independent effect remains to be elucidated.
Left hippocampal FC with both frontal cortices were increased in aMCI-p subjects, but there were no volumetric differences of hippocampal volume between aMCI-n and aMCI-p patients. Thalamocortical sleep spindles and hippocampal sharp wave ripples intricately modulate non-rapid eye movement (NREM) sleep. Hippocampal sharp wave-was also suggested as a biomarker of episodic memory [73]. A recent study on insomnia patients is in line with our results, where there was no hippocampal volume disparity between insomnia patients and controls [74]. Also, hippocampal-frontal FC was increased with insomnia severity [74], while a recent study on AD animal model reported a hippocampal-cortical EEG desynchrony during normal NREM sleep [75]. Whether the increased fronto-hippocampal FC in our aMCI-p subjects is a representation of compensatory process or a pathologic process remains unexplained. Considering the importance of fronto-hippocampal circuit in the memory performance of AD patients [76], the association of fronto-hippocampal circuit and sleep in AD trajectory should be explored further in future studies.
Group by regional SUVR interactions in cerebro-cerebellar networks
There was a sleep latency group by PCC SUVR interaction in the anterior cerebellar network, showing decreased anterior cerebellar FC with frontal cortex as PCC SUVR increased in aMCI-p group. Moreover, there was a sleep latency group by parietal SUVR interaction in the posterior cerebellar network, showing increased posterior cerebellar FC with temporal cortex as parietal SUVR increased in aMCI-p group. A study on ADNI data demonstrated the important relationship between cognitive decline and cerebellar volume in MCI subjects, suggesting a possible involvement of the cerebellar network in the incipient stage of AD trajectory [77]. FC studies on linking the relationship between the cerebellum and AD trajectory are scarce. A recent FC study on AD and MCI subjects elucidated a possible interaction of ventral attention network and cerebro-cerebellar limbic network as functional compensation in MCI [78]. Moreover, changes of cerebro-cerebellar FC were closely correlated with cognitive subdomains in AD and aMCI [79], and aMCI subjects demonstrated lower anti-correlation between cerebro-cerebellar and DMN FC [80]. Further, when compared with HC and MCI patients, AD patients exhibited significantly decreased dynamic amplitude of low-frequency fluctuation variability in the cerebellum and temporal lobes [81]. With regard to sleep and the cerebellum, a meta-analysis on resting-state fMRI studies in patients with persistent insomnia disorder found diminished activation of cerebellum and superior frontal gyrus [82]. Indeed, decreased anterior cerebellar-frontal FC in aMCI-p subjects may be a representation of failing anterior cerebellar network. As for the results on the posterior cerebellar network, considering the critical role of posterior cerebellum in cognition, the decreased posterior cerebellar FC to temporal cortex may be a compensatory process to make up for the failing network.
With regard to sleep and AD, the role of the cerebellum has gained relatively less spotlight. However, a recent study reported an important role of the cerebellum in the generation of necortical sleep spindles [83]. In addition, subjects with sleep disorders displayed decreased cerebellar volume [84]. Moreover, increased water diffusivity during sleep was noted predominantly in the cerebellum in humans, suggesting the indispensable role of the cerebellum in the glymphatic system during sleep [85], which is widely cited as a possible apparatus of Aβ clearance [86]. Disruption of cerebro-cerebellar networks observed in aMCI-p subjects might be a representation of disruptions in cerebro-cerebellar networks that are essential in maintaining sleep integrity and sleep-dependent memory consolidation. Moreover, prolonged sleep latency could have manifested as a clinical phenotype of disruption cerebro-cerebellar networks of Aβ+aMCI.
Limitations
There are several limitations of the present study that must be taken into consideration. First, the sample size was relatively small, thus making it difficult to generalize the results. Further replication studies that could unravel the cross talk between subcortical structures, the cerebellum, sleep, and AD should be conducted. Second, the study was cross sectional, which cannot represent causal relationship between AD and sleep disturbance. Third, assessment of sleep latency was self-reported, which was subject to recall bias. Adopting more objective measures including actigraphy and polysomnography could have increased the robustness of our study. Moreover, sleep latency is just one of many sleep parameters that can assess individual sleep pattern. Fourth, comparisons between aMCI subjects and HC were not made. Fifth, since the research on the LC and cerebellar FC in aging population is still in infancy, consideration for physiological aging effects on the LC and cerebellar FC was absent. Sixth, the thalamus is composed of multiple nuclei that have disparate connections to different cortical regions and exert different functions. The current study did not subdivide the thalamus nuclei in the analyses, and this may have influenced our results. Lastly, the inherent limitations of FC studies, failing to fully represent anatomical connectivity and being easily influenced by individual mental state, cannot be overlooked.
Conclusion
This study is the first study to delineate the relationship between the structural and functional correlates of subcortical structures, the cerebellum, sleep, and AD, with adoption of strict inclusion criteria for recruitment of participant. Further replication studies will help unravel this interesting association. A previous systematic review on rsfMRI studies on the DMN connectivity of MCI subjects pointed out the inconsistencies in the results among various studies, suggesting more stringent classification of MCI diagnosis and inclusion of other biological markers when conducting rsfMRI analyses [87]. We believe that cerebellar networks and subcortical FC should be included in the studies involving subjects in AD trajectory. Moreover, widespread FC connectivity disruptions and structural alterations noted in aMCI-p subjects suggest that sleep disturbance, manifested by prolonged sleep latency, may be an aggravating factor of AD in those in the disease trajectory.
ACKNOWLEDGMENTS
This research was supported by a grant of the Korea Health Technology R&D Project through the Korea Health Industry Development institute (KHIDI), funded by the Ministry of Health & Welfare, Republic of Korea (grant number: HU20C0315).
Authors’ disclosures available online (https://www.j-alz.com/manuscript-disclosures/21-5460r1).
SUPPLEMENTARY MATERIAL
[1] The supplementary material is available in the electronic version of this article: https://dx.doi.org/10.3233/JAD-215460.
REFERENCES
[1] | Wang C , Holtzman DM ((2020) ) Bidirectional relationship between sleep and Alzheimer’s disease: Role of amyloid, tau, and other factors. Neuropsychopharmacology 45: , 104–120. |
[2] | Ohayon MM , Carskadon MA , Guilleminault C , Vitiello MV ((2004) ) Meta-analysis of quantitative sleep parameters from childhood to old age in healthy individuals: Developing normative sleep values across the human lifespan. Sleep 27: , 1255–1273. |
[3] | Suh SW , Han JW , Lee JR , Byun S , Kwon SJ , Oh SH , Lee KH , Han G , Hong JW , Kwak KP , Kim BJ , Kim SG , Kim JL , Kim TH , Ryu SH , Moon SW , Park JH , Seo J , Youn JC , Lee DY , Lee DW , Lee SB , Lee JJ , Jhoo JH , Kim KW ((2018) ) Sleep and cognitive decline: A prospective nondemented elderly cohort study. Ann Neurol 83: , 472–482. |
[4] | Branger P , Arenaza-Urquijo EM , Tomadesso C , Mézenge F , André C , de Flores R , Mutlu J , de La Sayette V , Eustache F , Chételat G , Rauchs G ((2016) ) Relationships between sleep quality and brain volume, metabolism, and amyloid deposition in late adulthood. Neurobiol Aging 41: , 107–114. |
[5] | de Andrés I , Garzón M , Reinoso-Suárez F ((2011) ) Functional anatomy of non-REM sleep. Front Neurol 2: , 70. |
[6] | Scammell TE , Arrigoni E , Lipton JO ((2017) ) Neural circuitry of wakefulness and sleep. Neuron 93: , 747–765. |
[7] | Reed DL , Sacco WP ((2016) ) Measuring sleep efficiency: What should the denominator be? J Clin Sleep Med 12: , 263–266. |
[8] | Nixon GM , Thompson JM , Han DY , Becroft DM , Clark PM , Robinson E , Waldie KE , Wild CJ , Black PN , Mitchell EA ((2009) ) Falling asleep: The determinants of sleep latency. Arch Dis Child 94: , 686–689. |
[9] | Shrivastava D , Jung S , Saadat M , Sirohi R , Crewson K ((2014) ) How to interpret the results of a sleep study. J Community Hosp Intern Med Perspect 4: , 24983. |
[10] | Kalmbach DA , Cuamatzi-Castelan AS , Tonnu CV , Tran KM , Anderson JR , Roth T , Drake CL ((2018) ) Hyperarousal and sleep reactivity in insomnia: Current insights. Nat Sci Sleep 10: , 193–201. |
[11] | Riemann D , Spiegelhalder K , Feige B , Voderholzer U , Berger M , Perlis M , Nissen C ((2010) ) The hyperarousal model of insomnia: A review of the concept and its evidence. Sleep Med Rev 14: , 19–31. |
[12] | Howells FM , Stein DJ , Russell VA ((2012) ) Synergistic tonic and phasic activity of the locus coeruleus norepinephrine (LC-NE) arousal system is required for optimal attentional performance. Metab Brain Dis 27: , 267–274. |
[13] | Dutt S , Li Y , Mather M , Nation DA ; Alzheimer’s Disease Neuroimaging Initiative ((2020) ) Brainstem volumetric integrity in preclinical and prodromal Alzheimer’s disease. J Alzheimers Dis 77: , 1579–1594. |
[14] | Serra L , D’Amelio M , Di Domenico C , Dipasquale O , Marra C , Mercuri NB , Caltagirone C , Cercignani M , Bozzali M ((2018) ) In vivo mapping of brainstem nuclei functional connectivity disruption in Alzheimer’s disease. Neurobiol Aging 72: , 72–82. |
[15] | Matchett BJ , Grinberg LT , Theofilas P , Murray ME ((2021) ) The mechanistic link between selective vulnerability of the locus coeruleus and neurodegeneration in Alzheimer’s disease. Acta Neuropathol 141: , 631–650. |
[16] | Fu Z , Zhao M , Wang X , He Y , Tian Y , Yang Y , Han Y , Li S ((2021) ) Altered neuroanatomical asymmetries of subcortical structures in subjective cognitive decline, amnestic mild cognitive impairment, and Alzheimer’s disease. J Alzheimers Dis 79: , 1121–1132. |
[17] | Kälin AM , Park MT , Chakravarty MM , Lerch JP , Michels L , Schroeder C , Broicher SD , Kollias S , Nitsch RM , Gietl AF , Unschuld PG , Hock C , Leh SE ((2017) ) Subcortical shape changes, hippocampal atrophy and cortical thinning in future Alzheimer’s disease patients. Front Aging Neurosci 9: , 38. |
[18] | Delli Pizzi S , Punzi M , Sensi SL ; Alzheimer’s Disease Neuroimaging Initiative ((2019) ) Functional signature of conversion of patients with mild cognitive impairment. Neurobiol Aging 74: , 21–37. |
[19] | Luo Y , Sun T , Ma C , Zhang X , Ji Y , Fu X , Ni H ((2021) ) Alterations of brain networks in Alzheimer’s disease and mild cognitive impairment: A resting state fMRI study based on a population-specific brain template. Neuroscience 452: , 192–207. |
[20] | Bruchhage MMK , Correia S , Malloy P , Salloway S , Deoni S ((2020) ) Machine learning classification identifies cerebellar contributions to early and moderate cognitive decline in Alzheimer’s disease. Front Aging Neurosci 12: , 524024. |
[21] | Jacobs HIL , Hopkins DA , Mayrhofer HC , Bruner E , van Leeuwen FW , Raaijmakers W , Schmahmann JD ((2018) ) The cerebellum in Alzheimer’s disease: Evaluating its role in cognitive decline. Brain 141: , 37–47. |
[22] | Vemuri P , Jones DT , Jack CR Jr ((2012) ) Resting state functional MRI in Alzheimer’s disease. Alzheimers Res Ther 4: , 2. |
[23] | Lucey BP , Holtzman DM ((2015) ) How amyloid, sleep and memory connect. Nat Neurosci 18: , 933–934. |
[24] | Lee JH , Lee KU , Lee DY , Kim KW , Jhoo JH , Kim JH , Lee KH , Kim SY , Han SH , Woo JI ((2002) ) Development of the Korean version of the Consortium to Establish a Registry for Alzheimer’s Disease Assessment Packet (CERAD-K): Clinical and neuropsychological assessment batteries. J Gerontol B Psychol Sci Soc Sci 57: , P47–P53. |
[25] | Park JH ((1989) ) Standardization of Korean version of the Mini-Mental State Examination (MMSE-K) for use in the elderly. Part II. Diagnostic validity. J Korean Neuropsychiatr Assoc 28: , 508–513. |
[26] | Petersen RC ((2004) ) Mild cognitive impairment as a diagnostic entity. J Intern Med 256: , 183–194. |
[27] | Petersen RC , Caracciolo B , Brayne C , Gauthier S , Jelic V , Fratiglioni L ((2014) ) Mild cognitive impairment: A concept in evolution. J Intern Med 275: , 214–228. |
[28] | Morris JC ((1997) ) Clinical dementia rating: A reliable and valid diagnostic and staging measure for dementia of the Alzheimer type. Int Psychogeriatr 9: (Suppl 1), 173-176; discussion 177–178. |
[29] | Sohn SI , Kim DH , Lee MY , Cho YW ((2012) ) The reliability and validity of the Korean version of the Pittsburgh sleep quality index. Sleep Breath 16: , 803–812. |
[30] | Chung S , Youn S , Kim C ((2018) ) Are you asking what time did your patients go to bed?: Getting the short sleep onset latency. Sleep Med Res 9: , 58–62. |
[31] | Thurfjell L , Lilja J , Lundqvist R , Buckley C , Smith A , Vandenberghe R , Sherwin P ((2014) ) Automated quantification of 18F-flutemetamol PET activity for categorizing scans as negative or positive for brain amyloid: Concordance with visual image reads. J Nucl Med 55: , 1623–1628. |
[32] | Whitfield-Gabrieli S , Nieto-Castanon A ((2012) ) Conn: A functional connectivity toolbox for correlated and anticorrelated brain networks. Brain Connect 2: , 125–141. |
[33] | Keren NI , Lozar CT , Harris KC , Morgan PS , Eckert MA ((2009) ) In vivo mapping of the human locus coeruleus. Neuroimage 47: , 1261–1267. |
[34] | Samuels ER , Szabadi E ((2008) ) Functional neuroanatomy of the noradrenergic locus coeruleus: Its roles in the regulation of arousal and autonomic function part I: Principles of functional organisation. Curr Neuropharmacol 6: , 235–253. |
[35] | Ashburner J , Friston KJ ((2000) ) Voxel-based morphometry–the methods. Neuroimage 11: , 805–821. |
[36] | Ashburner J ((2007) ) A fast diffeomorphic image registration algorithm. Neuroimage 38: , 95–113. |
[37] | Patenaude B , Smith SM , Kennedy DN , Jenkinson M ((2011) ) A Bayesian model of shape and appearance for subcortical brain segmentation. Neuroimage 56: , 907–922. |
[38] | Team RC ((2013) ) R: A language and environment for statistical computing. |
[39] | Babić Leko M , Hof PR , Šimić G ((2021) ) Alterations and interactions of subcortical modulatory systems in Alzheimer’s disease. Prog Brain Res 261: , 379–421. |
[40] | Attems J , Thal DR , Jellinger KA ((2012) ) The relationship between subcortical tau pathology and Alzheimer’s disease. Biochem Soc Trans 40: , 711–715. |
[41] | Anaclet C , Fuller PM ((2017) ) Brainstem regulation of slow-wave-sleep. Curr Opin Neurobiol 44: , 139–143. |
[42] | Muehlroth BE , Rasch B , Werkle-Bergner M ((2020) ) Episodic memory consolidation during sleep in healthy aging. Sleep Med Rev 52: , 101304. |
[43] | Grau-Rivera O , Operto G , Falcón C , Sánchez-Benavides G , Cacciaglia R , Brugulat-Serrat A , Gramunt N , Salvadó G , Suárez-Calvet M , Minguillon C , Iranzo Á , Gispert JD , Molinuevo JL ; ALFA Study ((2020) ) Association between insomnia and cognitive performance, gray matter volume, and white matter microstructure in cognitively unimpaired adults. Alzheimers Res Ther 12: , 4. |
[44] | Somanath S , Sumiyoshi A , Kumaran SS , Sharma B , Mallick HN ((2021) ) Thalamic grey matter volume changes after sleep deprivation in rats. Sleep Vigil 5: , 227–234. |
[45] | Seeley WW ((2019) ) The salience network: A neural system for perceiving and responding to homeostatic demands. J Neurosci 39: , 9878–9882. |
[46] | Goulden N , Khusnulina A , Davis NJ , Bracewell RM , Bokde AL , McNulty JP , Mullins PG ((2014) ) The salience network is responsible for switching between the default mode network and the central executive network: Replication from DCM. Neuroimage 99: , 180–190. |
[47] | He X , Qin W , Liu Y , Zhang X , Duan Y , Song J , Li K , Jiang T , Yu C ((2014) ) Abnormal salience network in normal aging and in amnestic mild cognitive impairment and Alzheimer’s disease. Hum Brain Mapp 35: , 3446–3464. |
[48] | Xue C , Sun H , Yue Y , Wang S , Qi W , Hu G , Ge H , Yuan Q , Rao J , Tian L , Xiao C , Chen J ((2021) ) Structural and functional disruption of salience network in distinguishing subjective cognitive decline and amnestic mild cognitive impairment. ACS Chem Neurosci 12: , 1384–1394. |
[49] | Lee TH , Kim SH , Katz B , Mather M ((2020) ) The decline in intrinsic connectivity between the salience network and locus coeruleus in older adults: Implications for distractibility. Front Aging Neurosci 12: , 2. |
[50] | Durán E , Yang M , Neves R , Logothetis NK , Eschenko O ((2021) ) Modulation of prefrontal cortex slow oscillations by phasic activation of the locus coeruleus. Neuroscience 453: , 268–279. |
[51] | Kuo CC , Hsieh JC , Tsai HC , Kuo YS , Yau HJ , Chen CC , Chen RF , Yang HW , Min MY ((2020) ) Inhibitory interneurons regulate phasic activity of noradrenergic neurons in the mouse locus coeruleus and functional implications. J Physiol 598: , 4003–4029. |
[52] | Bari A , Xu S , Pignatelli M , Takeuchi D , Feng J , Li Y , Tonegawa S ((2020) ) Differential attentional control mechanisms by two distinct noradrenergic coeruleo-frontal cortical pathways. Proc Natl Acad Sci U S A 117: , 29080–29089. |
[53] | Jacobs HI , Wiese S , van de Ven V , Gronenschild EH , Verhey FRJ , Matthews PM ((2015) ) Relevance of parahippocampal-locus coeruleus connectivity to memory in early dementia. Neurobiol Aging 36: , 618–626. |
[54] | Engels N , Prokopiou PC , Uquillas FdO , Scott MR , Schultz AP , Papp KV , Farrell ME , Rentz DM , Sperling RA , Johnson KA , Jacobs HIL ((2020) ) Hypoconnectivity between locus coeruleus and medial temporal lobe during novelty predicts accelerated Aβ-related cognitive decline. Alzheimers Dement 16: , e041323. |
[55] | Moreno-Castilla P , Pérez-Ortega R , Violante-Soria V , Balderas I , Bermúdez-Rattoni F ((2017) ) Hippocampal release of dopamine and norepinephrine encodes novel contextual information. Hippocampus 27: , 547–557. |
[56] | Titulaer J , Björkholm C , Feltmann K , Malmlöf T , Mishra D , Bengtsson Gonzales C , Schilström B , Konradsson-Geuken Å ((2021) ) The importance of ventral hippocampal dopamine and norepinephrine in recognition memory. Front Behav Neurosci 15: , 667244. |
[57] | Sonneborn A , Greene RW ((2021) ) Norepinephrine transporter antagonism prevents dopamine-dependent synaptic plasticity in the mouse dorsal hippocampus. Neurosci Lett 740: , 135450. |
[58] | Broncel A , Bocian R , Kłos-Wojtczak P , Konopacki J ((2021) ) Noradrenergic profile of hippocampal formation theta rhythm in anaesthetized rats. Neuroscience 473: , 13–28. |
[59] | Bacon TJ , Pickering AE , Mellor JR ((2020) ) Noradrenaline release from locus coeruleus terminals in the hippocampus enhances excitation-spike coupling in CA1 pyramidal neurons Via β-Adrenoceptors. Cereb Cortex 30: , 6135–6151. |
[60] | Holth JK , Fritschi SK , Wang C , Pedersen NP , Cirrito JR , Mahan TE , Finn MB , Manis M , Geerling JC , Fuller PM , Lucey BP , Holtzman DM ((2019) ) The sleep-wake cycle regulates brain interstitial fluid tau in mice and CSF tau in humans. Science 363: , 880–884. |
[61] | Holth JK , Mahan TE , Robinson GO , Rocha A , Holtzman DM ((2017) ) Altered sleep and EEG power in the P301S Tau transgenic mouse model. Ann Clin Transl Neurol 4: , 180–190. |
[62] | Gong L , Shi M , Wang J , Xu R , Yu S , Liu D , Ding X , Zhang B , Zhang X , Xi C ((2021) ) The abnormal functional connectivity in the locus coeruleus-norepinephrine system associated with anxiety symptom in chronic insomnia disorder. Front Neurosci 15: , 678465. |
[63] | Hojjati SH , Ebrahimzadeh A , Babajani-Feremi A ((2019) ) Identification of the early stage of Alzheimer’s disease using structural MRI and resting-state fMRI. Front Neurol 10: , 904. |
[64] | Li Y , Wang X , Li Y , Sun Y , Sheng C , Li H , Li X , Yu Y , Chen G , Hu X , Jing B , Wang D , Li K , Jessen F , Xia M , Han Y ((2016) ) Abnormal resting-state functional connectivity strength in mild cognitive impairment and its conversion to Alzheimer’s disease. Neural Plast 2016: , 4680972. |
[65] | Danesh-Meyer HV , Birch H , Ku JY , Carroll S , Gamble G ((2006) ) Reduction of optic nerve fibers in patients with Alzheimer disease identified by laser imaging. Neurology 67: , 1852–1854. |
[66] | Zhang Y , Wang Y , Shi C , Shen M , Lu F ((2021) ) Advances in retina imaging as potential biomarkers for early diagnosis of Alzheimer’s disease. Transl Neurodegener 10: , 6. |
[67] | Mishra S , Gordon BA , Su Y , Christensen J , Friedrichsen K , Jackson K , Hornbeck R , Balota DA , Cairns NJ , Morris JC , Ances BM , Benzinger TLS ((2017) ) AV-1451 PET imaging of tau pathology in preclinical Alzheimer disease: Defining a summary measure. Neuroimage 161: , 171–178. |
[68] | McKee AC , Au R , Cabral HJ , Kowall NW , Seshadri S , Kubilus CA , Drake J , Wolf PA ((2006) ) Visual association pathology in preclinical Alzheimer disease. J Neuropathol Exp Neurol 65: , 621–630. |
[69] | Brueggen K , Fiala C , Berger C , Ochmann S , Babiloni C , Teipel SJ ((2017) ) Early changes in alpha band power and DMN BOLD activity in Alzheimer’s disease: A simultaneous resting state EEG-fMRI study. Front Aging Neurosci 9: , 319. |
[70] | Bhattacharya BS , Coyle D , Maguire LP ((2011) ) A thalamo–cortico–thalamic neural mass model to study alpha rhythms in Alzheimer’s disease. Neural Netw 24: , 631–645. |
[71] | Puentes-Mestril C , Roach J , Niethard N , Zochowski M , Aton SJ ((2019) ) How rhythms of the sleeping brain tune memory and synaptic plasticity. Sleep 42: , zsz095. |
[72] | Frank MG ((2017) ) Sleep and plasticity in the visual cortex: More than meets the eye. Curr Opin Neurobiol 44: , 8–12. |
[73] | Buzsáki G ((2015) ) Hippocampal sharp wave-ripple: A cognitive biomarker for episodic memory and planning. Hippocampus 25: , 1073–1188. |
[74] | Leerssen J , Wassing R , Ramautar JR , Stoffers D , Lakbila-Kamal O , Perrier J , Bruijel J , Foster-Dingley JC , Aghajani M , van Someren EJW ((2019) ) Increased hippocampal-prefrontal functional connectivity in insomnia. Neurobiol Learn Mem 160: , 144–150. |
[75] | Zhurakovskaya E , Ishchenko I , Gureviciene I , Aliev R , Gröhn O , Tanila H ((2019) ) Impaired hippocampal-cortical coupling but preserved local synchrony during sleep in APP/PS1 mice modeling Alzheimer’s disease. Sci Rep 9: , 5380. |
[76] | Yan S , Zheng C , Cui B , Qi Z , Zhao Z , An Y , Qiao L , Han Y , Zhou Y , Lu J ((2020) ) Multiparametric imaging hippocampal neurodegeneration and functional connectivity with simultaneous PET/MRI in Alzheimer’s disease. Eur J Nucl Med Mol Imaging 47: , 2440–2452. |
[77] | Lin CY , Chen CH , Tom SE , Kuo SH ; Alzheimer’s Disease Neuroimaging Initiative ((2020) ) Cerebellar volume is associated with cognitive decline in mild cognitive impairment: Results from ADNI. Cerebellum 19: , 217–225. |
[78] | Qi Z , An Y , Zhang M , Li HJ , Lu J ((2019) ) Altered cerebro-cerebellar limbic network in AD spectrum: A resting-state fMRI study. Front Neural Circuits 13: , 72. |
[79] | Zhou Z , Zhu R , Shao W , Zhang SJ , Wang L , Ding XJ , Peng DT ((2021) ) Changes in resting-state functional connectivity of cerebellum in amnestic mild cognitive impairment and Alzheimer’s disease: A case-control study. Front Syst Neurosci 15: , 596221. |
[80] | Pagen LHG , van de Ven VG , Gronenschild E , Priovoulos N , Verhey FRJ , Jacobs HIL ((2020) ) Contributions of cerebro-cerebellar default mode connectivity patterns to memory performance in mild cognitive impairment. J Alzheimers Dis 75: , 633–647. |
[81] | Li T , Liao Z , Mao Y , Hu J , Le D , Pei Y , Sun W , Lin J , Qiu Y , Zhu J , Chen Y , Qi C , Ye X , Su H , Yu E ((2021) ) Temporal dynamic changes of intrinsic brain activity in Alzheimer’s disease and mild cognitive impairment patients: A resting-state functional magnetic resonance imaging study. Ann Transl Med 9: , 63. |
[82] | Jiang B , He D , Guo Z , Gao Z ((2020) ) Effect-size seed-based d mapping of resting-state fMRI for persistent insomnia disorder. Sleep Breath 24: , 653–659. |
[83] | Xu W , De Carvalho F , Clarke AK , Jackson A ((2021) ) Communication from the cerebellum to the neocortex during sleep spindles. Prog Neurobiol 199: , 101940. |
[84] | Canto CB , Onuki Y , Bruinsma B , van der Werf YD , De Zeeuw CI ((2017) ) The sleeping cerebellum. Trends Neurosci 40: , 309–323. |
[85] | Demiral ŞB , Tomasi D , Sarlls J , Lee H , Wiers CE , Zehra A , Srivastava T , Ke K , Shokri-Kojori E , Freeman CR , Lindgren E , Ramirez V , Miller G , Bandettini P , Horovitz S , Wang GJ , Benveniste H , Volkow ND ((2019) ) Apparent diffusion coefficient changes in human brain during sleep – does it inform on the existence of a glymphatic system? Neuroimage 185: , 263–273. |
[86] | Xie L , Kang H , Xu Q , Chen MJ , Liao Y , Thiyagarajan M , O’Donnell J , Christensen DJ , Nicholson C , Iliff JJ , Takano T , Deane R , Nedergaard M ((2013) ) Sleep drives metabolite clearance from the adult brain. Science 342: , 373–377. |
[87] | Eyler LT , Elman JA , Hatton SN , Gough S , Mischel AK , Hagler DJ , Franz CE , Docherty A , Fennema-Notestine C , Gillespie N , Gustavson D , Lyons MJ , Neale MC , Panizzon MS , Dale AM , Kremen WS ((2019) ) Resting state abnormalities of the default mode network in mild cognitive impairment: A systematic review and meta-analysis. J Alzheimers Dis 70: , 107–120. |


