
Population Attributable Fractions for Modifiable Risk Factors of Incident Dementia in Cognitively Normal and Mild Cognitively Impaired Older Adults: Data from Two Cohort Studies
Abstract
Background:
Recent global meta-analyses show that 40% of dementia cases can be attributed to twelve modifiable risk factors.
Objective:
To investigate how health promotion strategies may differ in specific populations, this study estimated population attributable fractions (PAFs) of these risk factors for dementia in cognitively normal (CN) individuals and individuals with mild cognitive impairment (MCI) in United States and Greek cohorts.
Methods:
We re-analyzed data from the National Alzheimer’s Coordinating Centre (NACC, n = 16,147, mean age 75.2±6.9 years, 59.0% female) and the Hellenic Longitudinal Investigation of Aging and Diet (HELIAD, n = 1,141, mean age 72.9±5.0 years, 58.0% female). PAFs for the total samples and CN and MCI subgroups were calculated based on hazard ratios for the risk of dementia and risk factor prevalence in NACC (9 risk factors) and HELIAD (10 risk factors).
Results:
In NACC, 2,630 participants developed MCI (25.1%) and 3,333 developed dementia (20.7%) during a mean follow-up of 4.9±3.5 years. Weighted overall PAFs were 19.4% in the total sample, 15.9% in the CN subgroup, and 3.3% in the MCI subgroup. In HELIAD, 131 participants developed MCI (11.2%) and 68 developed dementia (5.9%) during an average follow-up of 3.1±0.86 years. Weighted overall PAFs were 65.5% in the total sample, 65.8% in the CN subgroup and 64.6% in the MCI subgroup.
Conclusion:
Translation of global meta-analysis data on modifiable risk factors should be carefully carried out per population. The PAFs of risk factors differ substantially across populations, directing health policy making to tailored risk factor modification plans.
INTRODUCTION
Besides the burden of dementia on the individual and their relatives, dementia has an enormous impact on our healthcare system and health expenses [1]. Hence, given the increasing incidence of dementia, there is growing awareness for the need for effective preventive interventions [1]. To develop such interventions, an increasing number of studies have assessed which risk factors should be targeted [2, 3].
Several risk factors have been identified that individually contribute to a higher dementia risk, including lifestyle and cardiovascular diseases. Many of these factors are likely to have cumulative effects on dementia risk, yet few studies have examined the overall effect of multiple modifiable risk factors combined [4].
Livingston et al. show that around 40% of dementia incidence is attributable to twelve modifiable risk factors, suggesting that eliminating these risk factors could potentially prevent 40% of dementia cases [5]. These data are primarily based on a global literature review to identify the key factors and meta-analytic calculations of Population Attributable Fraction (PAF). The twelve risk factors are: low levels of education, hearing loss, physical inactivity, obesity, hypertension, diabetes, depression, social isolation, smoking, air pollution, excessive alcohol use, and traumatic brain injury (TBI) [5]. Furthermore, Mukadam et al. show that in low- and middle-income countries the proportion of potentially preventable dementia cases by nine of these twelve risk factors is even higher; namely 40–60% [6]. However, it is unclear whether such high percentages are generalizable to other countries.
Livingston et al. and Mukadam et al. [5, 6] combined data from multiple countries and examined the risk of dementia for the general community dwelling population. This general population included individuals with normal cognition as well as individuals with mild cognitive impairment (MCI). However, nearly half of people with MCI develop dementia within three years, compared to 3.3% of the age-matched population without cognitive impairment [7], suggesting that these two populations are substantially different. It is yet unclear if and how much these two subgroups differ in terms of their modifiable factors’ attributable risk.
To optimize (cost-) effectiveness, should preventive strategies target the general population, or be tailored to level of risk or cognitive status? On the one hand, considering that around 19% of people above 65 years are estimated to have MCI [8] and therefore are at much greater risk for developing dementia [7–9], it may be more cost-effective to focus preventive strategies on this high-risk subgroup. On the other hand, as this MCI subgroup is already on a decline trajectory, it may be too late for lifestyle-focused strategies that require prolonged exposure to have a measurable effect on brain health.
In this study, we assessed the PAFs between risk factors and incident dementia in two independent cohorts. In particular, we examined most of the twelve modifiable risk factors identified by Livingston et al. [5] in two distinct populations. The PAFs were calculated for the total samples as well as for cognitively normal (CN) and MCI subgroups. We hypothesize that the percentage of potentially preventable dementia cases in the population of both cohorts lies between 30% and 40% [5, 6, 10].
METHOD
Study participants
This study uses data from two cohort studies included in the Global Alzheimer’s Association Interactive Network (GAAIN) database [5, 6, 11]. The GAAIN collects data of patients with dementia and healthy adults via data partners. Three of the 46 GAAIN datasets fulfilled the following criteria: 1) longitudinal information available on cognitive function, diagnosis of dementia and at least six out of twelve risk factors; and 2) include more than 100 adults above 65 years with normal cognition at baseline. Data from two of the three suitable datasets could be obtained, namely form the National Alzheimer’s Coordinating Centre (NACC) and Hellenic Longitudinal Investigation of Aging and Diet (HELIAD).
In 2005, the NACC commenced a cohort study with continuing recruitment of now 42,980 participants with normal cognition, MCI, or dementia in the United States of America [12]. All participants are annually followed, with a maximum of fifteen visits to date. Data were collected by 39 Alzheimer’s disease Centers form September 2005 to May 2020, each enrolled participants according to their own protocols. Participants were enrolled via clinician referral, self-referral, active recruitment by community organizations or on a voluntary basis [12]. Data were collected by study clinicians and health professionals linked to the participants or their co-participants, usually a close friend or family member of the participant. All participants of the NACC were expected to have a co-participant and only in very exceptional cases a participant did not have a co-participant [12]. Information was collected via home visits, office visits or via telephone calls. Milestone Forms were used to document the death or drop-out of a participant [12].
As determined by the University of Washington Human Subjects Division, the NACC database is exempt from Institutional Review Board (IRB) review and approval because it does not involve human subjects, as defined by federal and state regulations. However, all Alzheimer’s disease Centers have obtained informed consent from the participants and maintain their own separate IRB review and approval from their institution before submitting data to NACC [12].
Eligible for the current study were 16,147 participants of 65 years and older, who were free from dementia at the baseline and who had at least one follow up visit (Fig. 1).
Fig. 1
Flow diagrams of participants in the NACC and HELIAD study.
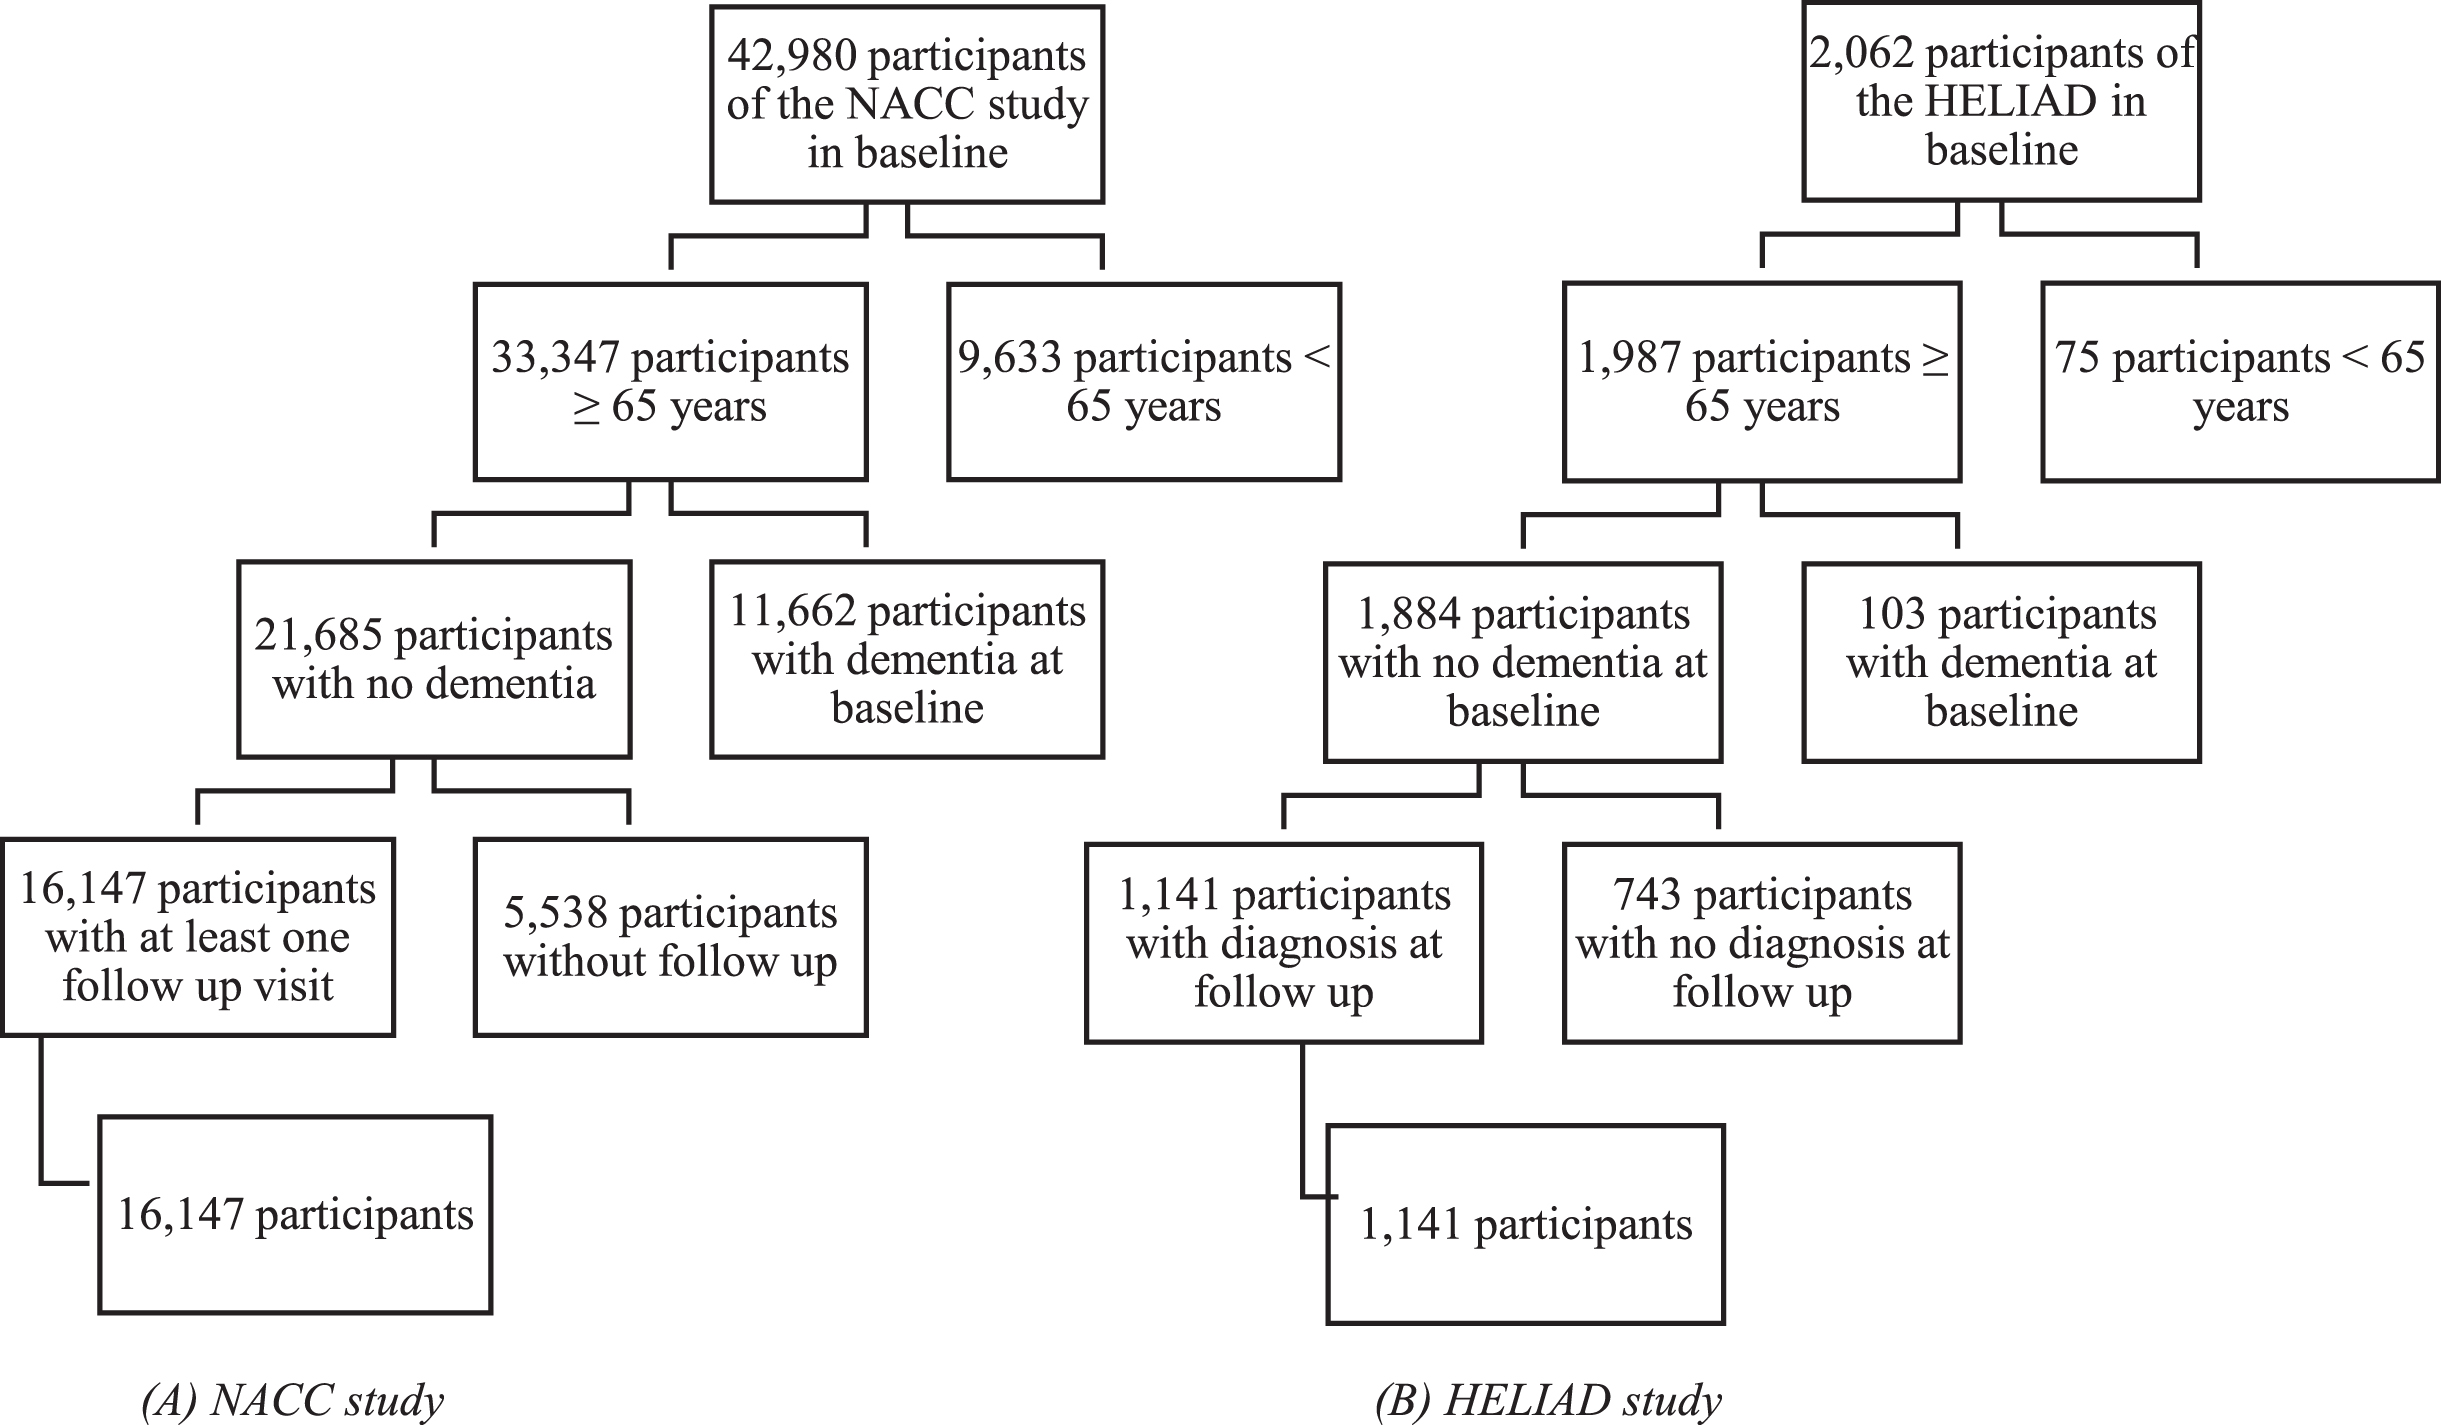
The HELIAD is a population-based study set up to investigate the prevalence and incidence of MCI and dementias in the Greek community dwelling population above 65 years, and to examine the associations between lifestyle risk factors and age-related neuropsychiatric diseases [13]. The HELIAD was conducted in the cities of Larissa and Marousi, Greece, with respective populations of 145,000 and 72,000 inhabitants. Data from 2,062 participants have been collected to date [13]. Of the 2,062 participants who completed the initial evaluation of the HELIAD, 1,141 participants of 65 years and older, who were free from dementia at baseline and who had at least one follow up visit were included for analysis after exclusions (Fig. 1). Information on clinical, lifestyle, and demographic variables was collected [14]. Participants were asked to bring a caregiver of informant, but were not always accompanied by an informant or caregiver [14]. Participants were followed up after approximately three years to observe the incidence of MCI or dementia. The assessments were conducted at day care centers for older adults, the participants’ homes, the University of Thessaly Medical Centre, or municipal public health clinics. The HELIAD study was approved by the local IRB.
Cognitive status
The subject’s cognitive status was determined in both studies at every visit. The evaluations at follow up were performed by neurologists and neuropsychologists who administered questionnaires, conducted neuropsychological assessments and reviewed all the information that was collected at expert meetings [13]. Subjects who were determined by the clinician(s) to have normal cognition and behavior were given the status cognitively normal. If the clinician(s) determined that the participant had a clinically significant impairment in cognition or behavior, the participant was either diagnosed with MCI or dementia. In both studies the dementia diagnoses were made by a multidisciplinary consensus team based on application of the widely accepted DSM-IV criteria [12, 13, 15]. The diagnosis of MCI was made based on the presence of subjective memory complaints and objective cognitive impairment in at least one cognitive domain, without significant interference in daily functioning [12, 16]. At baseline, participants were classified as either cognitively normal (no presence of MCI or dementia) or cognitively impaired (presence of MCI) or dementia. Participants with dementia were excluded from the analyses. Participants with dementia at follow-up were classified as incident dementia.
Risk factors
Data were available for nine of the twelve risk factors in NACC and for ten risk factors in HELIAD. Supplementary Table 1 provides an overview of the operational definitions of the risk factors. The data on the risk factors were collected with questionnaires. Participants were asked if a physician had given them the diagnosis hypertension, diabetes, hearing loss, TBI or depression. The participants were also screened for neuropsychiatric conditions including depression [14]. Depression was operationalized in HELIAD as diagnosis at baseline and in NACC as diagnosis at baseline or self-reported history of depression. The diagnosis was made according to DSM-IV criteria following a structured Geriatric Mental State interview. Low education was defined as having had less than twelve years of education or less than four years of high school. Excessive alcohol use was defined as alcoholism in the NACC dataset. All variables were dichotomized. The cut-off points were chosen based on risk-factor definitions used in Livingston et al., Mukadam et al. [5, 6, 10] and the available data.
Analysis
Competing risk analyses were conducted to examine the associations between each of the risk factors and time to incident dementia. These models were based on a sub-distribution hazard risk function with incident dementia as the outcome of interest and death as the competing risk. Time was measured as the time in years from baseline to date of dementia diagnosis, death or drop-out, whichever occurred first. Analyses were conducted separately for three subgroups: participants with normal cognition at baseline, participants diagnosed with MCI at baseline and all participants combined. Our intention was to include the same risk factors in the calculation of the PAFs as previously reported in the literature [5, 6, 10], and to adjust for confounders and other (modifiable) risk factors for dementia. We adjusted for several additional lifestyle factors, reasoning that in a population without dementia these factors are more likely confounders (common causes) than colliders (common effects). However, as some of these variables were not available in either of the cohorts, the analytical models differed across the cohorts. In NACC, PAFs were calculated for low education, hearing loss, obesity, hypertension, diabetes, depression, smoking, excessive alcohol use, and TBI with adjustment for the confounders age, sex, race, and APOE ɛ4. In HELIAD, PAFs were calculated for low education, hearing loss, physical inactivity, obesity, hypertension, diabetes, depression, social isolation, smoking, and TBI with adjustment for the confounders age, sex, sleep disorder, alcohol use, cognitive activity and adherence to a Mediterranean diet pattern [17, 18]. Confounding variables were measured as described in Supplementary Table 2.
The hazard ratios (HRs) for each risk factor for dementia from the competing risk analyses were used to calculate PAFs using formula P(HR - 1) / (1 + P(HR - 1)) [19]. P is the prevalence of the risk factor in the datasets of this study. Negative PAFs were omitted in the calculation of the overall PAF such that this value represents the potential effect of risk factors with positive PAFs. See the Supplementary Material for more information.
While the results based on competing risk analysis are presented as our main analyses (to account for study discontinuation), we also computed odds ratios based on logistic regression to facilitate direct comparison of our results to Livingston et al. [5]. To account for potential selection bias in the NACC cohort (which is not population-based), sensitivity analyses were done in which odds ratios were derived from logistic regression models weighted for sex and education using the U.S. Census data of 2006 as reference [20].
Overall, 3.2% (NACC) and 1.3% (HELIAD) of the data were missing and 24.8% (NACC) and 9.7% (HELIAD) of the participants had missing data on at least one variable. Comparison of participants with missing data with participants with complete data showed no substantial differences in characteristics, risk factors and dementia risk between the subgroups (Supplementary Tables 3and 4). Missing data were thus imputed using multiple imputation by chained equations (MICE) [21], which, in order to account for the uncertainty in the imputed values, created fifteen imputed data sets. The pooled results of these data sets are presented. To examine the influence of imputation, sensitivity analyses were done using participants with complete data only. The analyses were performed in IBM SPSS Statistics 26 and Stata 16.
RESULTS
NACC
The participants of the NACC had a mean (SD) age of 75.2 (6.9) years old and 59.0% were female (Table 1). Most participants (94.7%) were highly educated with an average of 15.8 (5.7) years of education. Of the 16,147 participants, 2,630 developed MCI (25.1%) and 3,333 developed dementia (20.7%) during a median follow-up of 4.9 (3.5) years. The characteristics of participants, for both the CN and MCI subgroups, are presented in Table 2.
Table 1
Characteristics of participants enrolled by the HELIAD or NACC study
| Characteristic | HELIAD | Missing | NACC | Missing |
| N | 1,141 | 16,147 | ||
| Age, mean±SD y | 72.9±5.01 | 0 | 75.2±6.88 | 0 |
| Sex, N (%) woman | 662 (58.0) | 0 | 9527 (59.0) | 0 |
| Education, mean±SD y | 8.20±4.98 | 39 | 15.8±5.72 | 0 |
| Low education, N (%) | 739 (67.1) | 39 | 859 (5.3) | 0 |
| Race, N (%) Caucasian | 1,141 (100) | 12,952 (80.2) | 159 | |
| N (%) African | 2,152 (13.3) | |||
| N (%) Asian | 394 (2.4) | |||
| N (%) multiracial | 422 (2.6) | |||
| N (%) unknown or ambiguous | 227 (1.5) | |||
| Number of APOE ɛ4 alleles, | ||||
| N (%) 0 | 626 (84.1) | 397 | 9,234 (66.3) | 2,229 |
| N (%) 1 | 112 (15.1) | 4,155 (29.9) | ||
| Drinking alcohol, N (%) | 502 (44.8) | 20 | 2,134 (70.1) | 13,092 |
| Sleep disorder, N (%) | 391 (34.6) | 11 | 1,247 (37.9) | 12,854 |
| Cognitive activity, N (%) | 840 (73.9) | 5 | NA | |
| Mediterranean diet, mean±SD score | 33.55±4.55 | 31 | NA | |
| Follow-up time, mean±SD y | 3.10±0.860 | 4.89±3.48 | ||
| Cognitive status at baseline, | ||||
| N (%) MCI | 127 (11.2) | 3 | 5,304 (32.8) | 3 |
| N (%) Normal cognition | 1,011 (88.8) | 9,836 (60.9) | ||
| N (%) Impaired not MCI | NA | 1,007 (6.2) | ||
| Incidence dementia, N (%) | 63 (5.9) | 68 | 3,333 (20.7) | 0 |
| Incidence MCI, N (%) | 206 (20.4) | 131 | 2,630 (25.1) | |
| Hypertension, N (%) | 729 (65) | 19 | 9,212 (57.7) | 174 |
| Diabetes, N (%) | 190 (17.0) | 21 | 2,138 (13.5) | 354 |
| Obesity, N (%) | 406 (36.1) | 16 | 3,542 (24.0) | 1,370 |
| Hearing loss, N (%) | 108 (9.5) | 10 | 3,908 (25.1) | 562 |
| TBI, N (%) | 128 (11.4) | 20 | 1,724 (11.0) | 522 |
| Excessive alcohol use, N (%) | 9 (0.8) | 6 | 633 (4.0) | 383 |
| Depression, N (%) | 140 (12.3) | 4 | 4,506 (28.7) | 552 |
| Smoking, N (%) | 443 (39.5) | 20 | 7,402 (47.2) | 393 |
| Social isolation, N (%) | 445 (39.2) | 5 | NA | |
| Physical inactivity, N (%) | 963 (84.4) | 0 | NA |
SD, standard deviation; NA, not applicable; MCI, mild cognitive impairment; TBI, traumatic brain injury.
Table 2
Prevalence of risk factors in the CN and MCI subgroups enrolled in HELIAD and NACC
| HELIAD | NACC | |||
| CN (%) | MCI (%) | CN (%) | MCI (%) | |
| Low education | 66.2 | 75.0 | 4.2 | 6.7 |
| Hypertension | 65.1 | 64.8 | 56.1 | 59.6 |
| Diabetes | 16.8 | 18.4 | 12.3 | 15.6 |
| Obesity | 35.8 | 38.6 | 25.2 | 21.7 |
| Hearing loss | 8.3 | 19.8 | 23.2 | 28.2 |
| TBI | 10.9 | 16.0 | 10.3 | 11.8 |
| Excessive alcohol use | NA | NA | 3.1 | 5.2 |
| Depression | 10.8 | 24.4 | 23.6 | 36.3 |
| Smoking | 39.4 | 40.0 | 46.9 | 47.1 |
| Social isolation | 38.6 | 44.4 | NA | NA |
| Physical inactivity | 84.4 | 85.8 | NA | NA |
CN, cognitively normal; MCI, mild cognitive impairment; TBI, traumatic brain injury; NA, not applicable.
In the total sample, low education, diabetes, excessive alcohol use and depression were significantly associated with a higher risk of dementia (Table 3). In contrast, obesity and smoking were significantly associated with a lower risk of dementia.
Table 3
Competing risk analyses of dementia of the total sample, CN subgroup, and MCI subgroup of the NACC
| NACC | HR total sample | HR CN | HR MCI |
| (95% CI) | (95% CI) | (95% CI) | |
| Low education | 1.32 (1.12–1.55)** | 1.62 (1.17–2.24)** | 0.94 (0.77–1.15) |
| Hypertension | 1.05 (0.97–1.13) | 1.08 (0.93–1.26) | 0.94 (0.85–1.02) |
| Diabetes | 1.19 (1.06–1.32)** | 1.12 (0.88–1.41) | 1.02 (0.90–1.16) |
| Obesity | 0.81 (0.73–0.90)*** | 0.90 (0.73–1.09) | 0.77 (0.68–0.87)*** |
| Hearing loss | 0.99 (0.91–1.08) | 0.95 (0.80–1.13) | 0.93 (0.84–1.03) |
| TBI | 1.01 (0.89–1.14) | 1.04 (0.80–1.34) | 0.94 (0.82–1.09) |
| Excessive alcohol use | 1.20 (1.00–1.43)* | 1.01 (0.66–1.57) | 1.03 (0.84–1.26) |
| Depression | 1.57 (1.45–1.70)*** | 1.42 (1.20–1.68)*** | 1.08 (0.98–1.19) |
| Smoking | 0.91 (0.85–0.98)* | 0.93 (0.80–1.08) | 0.93 (0.85–1.02) |
HR, hazard ratio; CI, confidence interval; CN, cognitively normal; MCI, mild cognitive impairment; TBI, traumatic brain injury. Multivariable models adjusted for age, sex, race, and APOE ɛ4. *p≤0.05, **p≤0.01, ***p≤0.001.
In the CN subgroup, low education and depression were significantly associated with a higher risk of dementia (Table 3).
In the MCI subgroup, obesity was significantly associated with a lower risk of dementia (Table 3). In the analysis of the NACC datasets before imputation, the HRs were in the same range as the analyses in the imputed dataset (Supplementary Table 5).
PAFs in the total sample added up to an overall weighted PAF of 19.4% (12.6–28.2) for the nine risk factors (Table 4; Supplementary Figure 1). In the CN subgroup, the PAFs added up to 15.9% (5.1–34.5). In the MCI subgroup, the PAFs added up to 3.3% (0–13.7). The PAFs of the NACC dataset before imputation are presented in Supplementary Table 6.
Table 4
PAFs for dementia risk for the total sample, CN and MCI subgroup of the NACC
| NACC | PAF total group | PAF CN | PAF MCI |
| (95% CI) | (95% CI) | (95% CI) | |
| Low education | 1.68 (0.66–2.86) | 2.54 (0.72–4.94) | –0.40 (–1.56–0.98) |
| Hypertension | 2.70 (–1.64–6.99) | 4.52 (–3.87–12.71) | –3.98 (–9.46–1.42) |
| Diabetes | 2.44 (0.82–4.19) | 1.40 (–1.46–4.79) | 0.34 (–1.63–2.49) |
| Obesity | –4.79 (–6.91–-2.54) | –2.69 (–7.19–2.31) | –5.31 (–7.56–-2.88) |
| Hearing loss | –0.16 (–2.24–2.02) | –1.10 (–4.79–2.97) | –2.07 (–4.81–0.80) |
| TBI | 0.08 (–1.20–1.48) | 0.36 (–2.11–3.39) | –0.70 (–2.22–1.01) |
| Excessive alcohol use | 0.78 (0.01–1.69) | 0.04 (–1.08–1.73) | 0.14 (–0.84–1.31) |
| Depression | 14.09 (11.47–16.76) | 8.97 (4.46–13.79) | 2.84 (–0.60–6.36) |
| Smoking | –4.34 (–7.80–-0.86) | –3.48 (–10.29–3.43) | –3.23 (–7.37–0.95) |
| Overall* | 20.51 (12.78–31.62) | 16.82 (5.15–40.82) | 3.30 (0–14.44) |
| Overall weighted* | 19.39 (12.61–28.22) | 15.91 (5.12–34.54) | 3.29 (0–13.66) |
PAF, population attributable fraction; CI, confidence interval; CN, cognitively normal; MCI, mild cognitive impairment; TBI, traumatic brain injury. *Negative PAFs were omitted in the calculation of the overall PAF.
HELIAD
The participants enrolled in the HELIAD were on average (SD) 72.9 (5.0) years old and had 8.2 (5.0) years of education (Table 1). Of the 1,141 participants, 58.0% were female, 131 developed MCI (11.2%), and 68 participants developed dementia (5.9%) during follow-up of on average 3.10 (0.86) years.
In the total sample, physical inactivity was significantly associated with a higher risk of dementia (Table 5).
Table 5
Competing risk analyses of dementia in the total sample, CN and MCI subgroup of the HELIAD
| HELIAD | HR total sample | HR CN | HR MCI |
| (95% CI) | (95% CI) | (95% CI) | |
| Low education | 1.58 (0.82–3.06) | 2.13 (0.93–4.88) | 1.03 (0.40–2.62) |
| Hypertension | 0.91 (0.53–1.57) | 0.71 (0.34–1.44) | 1.55 (0.70–3.43) |
| Diabetes | 1.09 (0.58–2.05) | 0.74 (0.32–1.71) | 2.38 (0.98–5.78) |
| Obesity | 1.17 (0.68–2.01) | 1.88 (0.93–3.81) | 0.74 (0.31–1.74) |
| Hearing loss | 1.09 (0.51–2.33) | 0.32 (0.13–1.46) | 2.19 (0.83–5.71) |
| TBI | 1.64 (0.71–3.76) | 1.61 (0.54–4.81) | 1.33 (0.38–4.62) |
| Depression | 1.49 (0.77–2.88) | 1.84 (0.76–4.46) | 0.70 (0.26–1.93) |
| Smoking | 0.94 (0.50–1.76) | 1.30 (0.60–2.82) | 0.38 (0.14–1.04) |
| Social isolation | 1.01 (0.60–1.70) | 1.63 (0.78–3.43) | 0.40 (0.17–0.95)* |
| Physical inactivity | 4.17 (0.98–17.84)* | 4.68 (0.59–37.42) | 3.94 (0.59–26.39) |
HR, hazard ratio, CI, confidence interval; CN, cognitively normal; MCI, mild cognitive impairment; TBI, traumatic brain injury. Multivariable models adjusted for age, sex, sleep disorder, alcohol use, cog activity, and diet. *p≤0.05, **p≤0.01, ***p≤0.001.
In the MCI subgroup, social isolation was significantly associated with a lower risk of dementia (Table 5). In the analysis of the HELIAD datasets before imputation, the HRs were in the same range as the analyses in the imputed dataset (Supplementary Table 7).
PAFs in the total sample added up to an overall weighted PAF of 65.5% (0–65.4) for the ten risk factors (Table 6; Supplementary Figure 2). In the CN subgroup, the PAFs added up to 65.8% (0–66.1). In the MCI subgroup, the PAFs added up to 63.4% (0–66.2). The PAFs of the HELIAD dataset before imputation are presented in Supplementary Table 8.
Table 6
PAFs for dementia risk for the total sample, CN, and MCI subgroup of the HELIAD
| HELIAD | PAF total sample | PAF CN | PAF MCI |
| (95% CI) | (95% CI) | (95% CI) | |
| Low education | 28.15 (–13.74–58.01) | 42.74 (–5.08–71.99) | 2.19 (–80.67–14.21) |
| Hypertension | –5.85 (–43.54–27.02) | –23.74 (–74.35–22.34) | 26.22 (–24.22–15.84) |
| Diabetes | 1.57 (–7.60–15.10) | –4.65 (–12.99–10.69) | 20.27 (–0.34–12.12) |
| Obesity | 5.79 (–13.00–26.72) | 24.06 (–2.47–50.14) | –11.21 (–36.07–5.77) |
| Hearing loss | 0.83 (–4.91–11.24) | –6.00 (–7.82–3.72) | 19.03 (–3.33–12.50) |
| TBI | 6.76 (–3.39–23.92) | 6.19 (–5.33–29.35) | 4.97 (–10.99–9.49) |
| Depression | 5.67 (–2.91–18.77) | 8.31 (–2.68–27.19) | –7.79 (–22.16–4.80) |
| Smoking | –2.50 (–24.54–23.01) | 10.55 (–18.76–41.74) | –32.67 (–52.27–0.43) |
| Social isolation | 0.31 (–18.66–21.45) | 19.64 (–9.44–48.45) | –36.07 (–58.18–-2.43) |
| Physical inactivity | 72.80 (–2.11–75.20) | 75.67 (–53.61–96.85) | 71.60 (–54.74–24.76) |
| Overall* | 84.24 (0–98.43) | 93.46 (0–99.95) | 87.43 (0–99.92) |
| Overall weighted* | 65.47 (0–65.44) | 65.83 (0–66.10) | 64.64 (0–66.23) |
PAF, population attributable fraction; CI, confidence interval; CN, cognitively normal; MCI, mild cognitive impairment; TBI, traumatic brain injury. *Negative PAFs were omitted in the calculation of the overall PAF.
DISCUSSION
This study estimated PAFs for nine (NACC) and ten (HELIAD) modifiable risk factors with dementia in cognitively normal and declining adults aged ≥65 years for two cohort studies, one from the US (NACC) and one from Greece (HELIAD). We hypothesized that the percentage of potentially preventable dementia cases in the US and Greek cohorts lies between 30% and 40%. Surprisingly, we found a higher overall PAF in the HELIAD compared to previously reported PAFs for other countries [5, 6]. However, the overall PAF in the NACC study is lower than expected, which may be due to several risk factors being associated with a lower risk of dementia (e.g., obesity and smoking), resulting in negative PAFs for 2/10 (HELIAD) and 3/9 (NACC) risk factors. For some of these risk factors, negative associations have been described previously, such as reverse causality in obesity [22] and blood pressure [23]. For others, these negative associations may be explained by biases, such as healthy survivor bias. For instance, smoking participants often pass away earlier than non-smoking participants, resulting in a lower chance to develop dementia [24]. Indeed, in the NACC data, a slightly higher percentage of smokers died during follow-up than non-smokers. To mitigate the impact of these negative associations to the overall PAF, risk factors with negative PAFs were omitted in our calculations. These negative PAFs partly explain the low overall PAFs in NACC as they were calculated over six risk factors or even only three in the MCI subgroup. In addition, although the depression PAF was higher than expected in NACC (4.1%), the other PAFs, such as traumatic brain injury (0.08%), were relatively low. Conversely, the relatively high overall PAF in HELIAD, can be largely explained by the PAFs of physical inactivity (72.8%) and low education (28.2%), which were substantially higher than in other samples [5] and low education in NACC (1.7%). The disparate results of the NACC and HELIAD data demonstrate the large influence of the sample characteristics in estimating PAFs, which supports the notion that they cannot be easily generalized across countries [6, 25] and replicated in other data sets. Based on our results, we explicitly emphasize that generalization of results from meta-analyses on modifiable risk factors should be approached with caution.
Within the two cohorts, the CN and MCI subgroups differ substantially. Firstly, in both studies some of the PAFs change sign between the subgroups. For example, low education, hypertension and TBI have a negative PAF in the MCI subgroup of the NACC but a positive PAF in the CN subgroup. Remarkably, in the HELIAD, hypertension has a positive PAF in the MCI subgroup, while the CN subgroup has a negative PAF. Furthermore, the PAF for low education in the MCI subgroup of the HELIAD is low (2.2%), while the CN subgroup has a large positive PAF (42.7%). High education is thought to increase cognitive reserve allowing cognitive function to be maintained in late life and delay the onset of dementia [7]. A possible explanation for the relatively lower PAF in the MCI subgroup could be survivor bias, leaving fewer people with lower education, who mostly also have higher risk for cardiovascular disease and mortality. Furthermore, according to the cognitive reserve theory, higher educated participants may also decline faster after a belated onset of cognitive impairment [26]. In the NACC and the HELIAD, the MCI subgroup had more negative PAFs than the CN subgroup. This change of sign may be explained by reverse causality starting at incident cognitive decline and the reduced discriminative value of individual risk factors due to the high overall level of risk of conversion to dementia. Accordingly, the overall PAF of the NACC was smaller in the MCI subgroup (3.3%) than in the CN subgroup (15.9%). Overall this is in line with MCI often being a prodromal phase of dementia [8, 27], leaving a lower potential to increase (or decrease) the risk of dementia [7, 8].
The CN and MCI subgroups also differ in magnitude of PAFs. Remarkably, the PAFs for diabetes and hearing loss are close to zero for the CN subgroup but relatively large for the MCI subgroup in the HELIAD. These findings point toward an interaction effect. Diabetes or hearing loss in the general population may only yield a small increase in dementia risk, but if people with these risk factors develop MCI, then there is a high likelihood that they will go on to develop dementia. The higher PAF for hearing loss in the MCI subgroup may also be explained by greater difficultly with compensating for a loss of hearing, by a decreased reserve capacity or decreased mental stimulation [28]. The two subgroups may also differ in the degree to which hearing loss is diagnosed and treated. This is suggested by the relative difference in hearing loss incidence, which, in the CN subgroup of the HELIAD, is about half (8.3%) of that in the MCI subgroup (19.8%). Likewise, for diabetes, the difference in PAFs is also partly explained by the relative difference in incidence. In HELIAD, the incidence of diabetes is greater in the MCI subgroup (18.4%) than in the CN subgroup (16.8%). However, differences in incidence do not fully explain the differences between the MCI and CN subgroups as there is a significantly greater HR for both hearing loss and diabetes in the MCI subgroup of HELIAD (respectively 2.19, 2.38) compared to the CN subgroup (0.32, 0.74), without relevant differences in prevalence of these risk factors (Table 2).
In summary, this study shows differences in risk factor PAFs between two cohorts and MCI and CN subgroups. The higher overall PAFs in the CN subgroup of the NACC study suggest that targeting the modifiable risk factors of CN older adults may be most effective. However, in HELIAD the overall PAFs were in the same range for the CN and MCI subgroup. This suggests that, although less time is left for dementia prevention in persons with MCI, elimination of risk factors may still be important. Given the contrasting findings in the NACC and HELIAD studies, further research is needed to determine whether the potential to prevent dementia by controlling risk factors differs between the MCI and CN subgroups.
Strengths and limitations
A strength of this study is the use of two different cohorts, which provides insight into the robustness of the findings across study populations. Another strength is the use of competing risk analyses, which correct for time until dementia diagnosis, discontinuation, death, or most recent visit, and thereby minimize potential bias (e.g., attrition bias). To compare our results to previous research [5, 6, 10], we also ran logistic regression models but did not observe substantially different results (Supplementary Table 9). Livingston et al. [5, 10] calculated PAFs based on pooled data from systematic reviews. Hence, the PAFs were calculated separately for each risk factor and communality across risk factors had to be accounted for using an extra step that required additional data. In this study all risk factors and confounders were included in the same model so communality was accounted for implicitly. Moreover, we adjusted our models for several potentially confounding lifestyle factors, such as sleep, cognitive activity, alcohol use and dietary habits, as well as age, sex, APOE ɛ4, and race. Nevertheless, it remains possible that other factors confound the identified associations, which limits the interpretation of the corresponding PAFs. Sleep disorder and cognitive activity may be signs or symptoms of MCI or dementia so sensitivity analyses in which sleep and cognitive activity were not included as confounders were performed. The analyses showed minimal differences in results (Supplementary Table 10). A fourth strength is the large sample of participants in NACC, which was maximized by multiple imputation of missing values. Unfortunately, the sample size of HELIAD was smaller than the NACC database, but this dataset was very interesting because of the large differences in socio-economic and lifestyle environment. Another strength of HELIAD is that it is population-based, resulting in a representative study population with a relatively high external validity in the Greek population. However, there were insufficient data available on APOE ɛ4 in the HELIAD dataset to adjust for it in the analyses. A final strength of our study is that we included nine (NACC) and ten (HELIAD) of the twelve modifiable risk factors identified in the landmark study by Livingston et al. [5]. Unfortunately, insufficient information was available about physical or social activity (NACC) and air pollution (both studies). Hence, we were unable to include all relevant risk factors, which may have contributed to underestimation of the overall PAFs.
Limitations of our study include possible selection bias (NACC) and healthy survivor bias (NACC and HELIAD) and reporting bias (NACC and HELIAD). The NACC study population was recruited via clinician referral, self-referral, and by community organizations [12]. Therefore, selection bias may be present, and results may not generalize to the overall US population. For example, the enrolled volunteers with normal cognition, appeared to have an above average level of education [12], which may lead to false-negative diagnoses [29]. The sensitivity analyses in which models were weighted by sex and education, showed similar results to the unweighted models (Supplementary Table 9), which makes it less likely that deviations in the distribution of sex and education from the general population explained some of the unexpected findings. However, selection bias may still be present based on other factors that we were unable to weigh for, e.g., age and higher prevalence of risk factors. Selection bias may also have been introduced by excluding participants without follow-up data on dementia. However, comparison of the prevalence of risk factors in the analysis sample with the total sample at baseline showed no marked differences. As described earlier in the discussion, healthy survivor bias likely explains the negative associations for, for example, smoking and obesity in survival analysis. Nevertheless, the used method in this study, competing risk analysis, aims to correctly estimate marginal probability of an event in the presence of competing events, such as death from cardiovascular disease, which reduces the chance of healthy survivor bias [30]. As most risk factors were measured using self-report, the negative associations may also be explained by reporting bias. However, the negative associations were also found for obesity, which was based on objective measurement of height and weight, which makes reporting bias less likely. As the risk factors with negative associations were excluded from calculating the PAFs, the PAFs likely underestimate the true risk associated with the modifiable factors. Reporting bias may have been an issue particularly in the MCI group, as their declined cognitive functions may have hindered reliable self-report of risk factors. However, the influence of reporting bias was minimized by having each participant be accompanied by an informant or caregiver who could confirm or complement the participant during their assessments [12, 14]. Another potential limitation is reverse causation. However, sensitivity analyses excluding participants who developed dementia in the first two years of follow-up showed minimal differences in the findings (Supplementary Table 11). Furthermore, because this study uses observational data, caution has to be taken when causally interpreting our results. Finally, the relatively small sample size and short follow-up in HELIAD may have resulted in underestimation of some risks and subsequently PAFs, due to a relatively low number of dementia cases at follow-up. A limitation in calculating PAFs based on individual studies is that these studies often have insufficient power which increases the risk of spurious associations [31]. The limited statistical power, particularly in the subgroups by cognitive status, may also affect the current findings. However, a limitation of PAFs calculated from data pooled in meta-analyses is that the specific characteristics of the individual studies are lost, and the results may not accurately reflect the situation in the region where the individual studies were conducted. Regional PAFs are important to inform local policy. When interpreting the PAFs, policy makers should consider the limitations of these metrics. The accuracy of the PAFs highly depends on the representativeness of the population-based sample. For conditions with long lead times, better metrics are needed that are capable of maintaining their relevance for both risk and protective factors.
Future work
Due to the contrasting findings between HELIAD and NACC, further research is needed to examine whether elimination of risk factors may have the same potential to prevent dementia in MCI as in CN subgroups. Given our results it is likely that similar prevention programs would result in, highly different prevention effects on dementia incidence in ethnically, genetically, socially, or culturally different populations. Additionally, future research should differentiate between different subtypes of dementia, such as Alzheimer’s disease and vascular dementia. In this study, any cause dementia was taken as outcome, but risk factors and their associated PAFs likely differ per dementia subtype. Furthermore, the PAFs of other risk factors, such as air pollution to dementia, should be included in follow-up studies in different cohorts. Future studies could also investigate interactions between risk factors. Such studies require ‘big data’, both rich in terms of participants as well as in measured variables. Hence, we encourage to widely utilize available dementia data sets that can be accessed using platforms like GAAIN [11].
Conclusion
In conclusion, the overall PAF in HELIAD of the known risk factors for dementia was higher than expected, while the overall PAF in the NACC was lower than expected based on previously reported PAFs in other studies. This was explained by differences between cohorts in risk factor prevalence and the strength of their relation to dementia. These differences suggest that translation of the valuable global meta-analysis data on modifiable risk factors should be carefully carried out per country to tailor preventive public health strategies and optimize their effectiveness [6]. Finally, the high overall PAF in the MCI subgroup of the HELIAD data suggests that preventive interventions continue to be relevant in people with MCI.
ACKNOWLEDGMENTS
The NACC database is funded by NIA/NIH Grant U24 AG072122. NACC data are contributed by the NIA-funded ADRCs: P30 AG019610 (PI Eric Reiman, MD), P30 AG013846 (PI Neil Kowall, MD), P50 AG008702 (PI Scott Small, MD), P50 AG025688 (PI Allan Levey, MD, PhD), P50 AG047266 (PI Todd Golde, MD, PhD), P30 AG010133 (PI Andrew Saykin, PsyD), P50 AG005146 (PI Marilyn Albert, PhD), P50 AG005134 (PI Bradley Hyman, MD, PhD), P50 AG016574 (PI Ronald Petersen, MD, PhD), P50 AG005138 (PI Mary Sano, PhD), P30 AG008051 (PI Thomas Wisniewski, MD), P30 AG013854 (PI Robert Vassar, PhD), P30 AG008017 (PI Jeffrey Kaye, MD), P30 AG010161 (PI David Bennett, MD), P50 AG047366 (PI Victor Henderson, MD, MS), P30 AG010129 (PI Charles DeCarli, MD), P50 AG016573 (PI Frank LaFerla, PhD), P50 AG005131 (PI James Brewer, MD, PhD), P50 AG023501 (PI Bruce Miller, MD), P30 AG035982 (PI Russell Swerdlow, MD), P30 AG028383 (PI Linda Van Eldik, PhD), P30 AG053760 (PI Henry Paulson, MD, PhD), P30 AG010124 (PI John Trojanowski, MD, PhD), P50 AG005133 (PI Oscar Lopez, MD), P50 AG005142 (PI Helena Chui, MD), P30 AG012300 (PI Roger Rosenberg, MD), P30 AG049638 (PI Suzanne Craft, PhD), P50 AG005136 (PI Thomas Grabowski, MD), P50 AG033514 (PI Sanjay Asthana, MD, FRCP), P50 AG005681 (PI John Morris, MD), P50 AG047270 (PI Stephen Strittmatter, MD, PhD).
The HELIAD is funded by the Alzheimer’s Association: IIRG-09133014 and 189 10276/8/9/2011 from the ESPA-EU program Excellence Grant (ARISTEIA), which is co-funded by the European Social Fund and Greek National resources, and ΔY2β/oικ.51657/14.4.2009 from the Ministry for Health and Social Solidarity (Greece).
This project was partly granted as GEENA-Q-19-595225 by the American Alzheimer’s Association to M. Olde Rikkert and an unrestricted grant of the research funds from Clinical Pharmacologist Prof. Dr. JM v Rossum, Nijmegen, The Netherlands.
Authors’ disclosures available online (https://www.j-alz.com/manuscript-disclosures/21-5386r2).
SUPPLEMENTARY MATERIAL
[1] The supplementary material is available in the electronic version of this article: https://dx.doi.org/10.3233/JAD-215386.
REFERENCES
[1] | Patterson C (2018) World Alzheimer Report 2018.The state of the art of dementia research: New frontiers. Alzheimer’s Disease International, London. |
[2] | Uleman JF , Melis RJF , Quax R , van der Zee EA , Thijssen D , Dresler M , van de Rest O , van der Velpen IF , Adams HHH , Schmand B , de Kok IMCM , de Bresser J , Richard E , Verbeek M , Hoekstra AG , Rouwette EAJA , Olde Rikkert MGM ((2020) ) Mapping the multicausality of Alzheimer’s disease through group model building. GeroScience 43: , 829–843. |
[3] | Pomorska G , Ockene JK ((2017) ) A general neurologist’s perspective on the urgent need to apply resilience thinking to the prevention and treatment of Alzheimer’s disease. Alzheimers Dement (N Y) 3: , 498–506. |
[4] | Dhana K , Evans DA , Rajan KB , Bennett DA , Morris MC ((2020) ) Healthy lifestyle and the risk of Alzheimer dementia: Findings from 2 longitudinal studies. Neurology 95: , e374–e383. |
[5] | Livingston G , Huntley J , Sommerlad A , Ames D , Ballard C , Banerjee S , Brayne C , Burns A , Cohen-Mansfield J , Cooper C , Costafreda SG , Dias A , Fox N , Gitlin LN , Howard R , Kales HC , Kivimäki M , Larson EB , Ogunniyi A , Orgeta V , Ritchie K , Rockwood K , Sampson EL , Samus Q , Schneider LS , Selbæk G , Teri L , Mukadam N ((2020) ) Dementia prevention, intervention, and care: 2020 report of the Lancet Commission. Lancet 396: , 413–446. |
[6] | Mukadam N , Sommerlad A , Huntley J , Livingston G ((2019) ) Population attributable fractions for risk factors for dementia in low-income and middle-income countries: An analysis using cross-sectional survey data. Lancet Glob Health 7: , e596–e603. |
[7] | Tschanz JT , Welsh-Bohmer KA , Lyketsos CG , Corcoran C , Green RC , Hayden K , Norton MC , Zandi PP , Toone L , West NA , Breitner JCS ((2006) ) Conversion to dementia from mild cognitive disorder. Neurology 67: , 229 LP–234. |
[8] | Lopez OL , Kuller LH , Becker JT , Dulberg C , Sweet RA , Gach HM , Dekosky ST ((2007) ) Incidence of dementia in mild cognitive impairment in the cardiovascular health study cognition study. Arch Neurol 64: , 416–420. |
[9] | Cooper C , Sommerlad A , Lyketsos CG , Livingston G ((2015) ) Modifiable predictors of dementia in mild cognitive impairment: A systematic review and meta-analysis. Am J Psychiatry 172: , 323–334. |
[10] | Livingston G , Sommerlad A , Orgeta V , Costafreda SG , Huntley J , Ames D , Ballard C , Banerjee S , Burns A , Cohen-Mansfield J , Cooper C , Fox N , Gitlin LN , Howard R , Kales HC , Larson EB , Ritchie K , Rockwood K , Sampson EL , Samus Q , Schneider LS , Selbæk G , Teri L , Mukadam N ((2017) ) Dementia prevention, intervention, and care. Lancet 390: , 2673–2734. |
[11] | The Global Alzheimer’s Association Interactive Network (GAAIN) (2020) http://www.gaain.org/, Last updated 2020, Accessed on July 3, 2020. |
[12] | National Alzheimer’s Coordinating Centre (2020) The NIA Alzheimer’s disease research centers program. https://www.alz.washington.edu/WEB/researcher_home.html, Last updated 2020, Accessed on July 2 2020. |
[13] | Dardiotis E , Kosmidis MH , Yannakoulia M , Hadjigeorgiou GM , Scarmeas N ((2014) ) The hellenic longitudinal investigation of aging and diet (HELIAD): Rationale, study design, and cohort description. Neuroepidemiology 43: , 9–14. |
[14] | Kosmidis MH , Vlachos GS , Anastasiou CA , Yannakoulia M , Dardiotis E , Hadjigeorgiou G , Sakka P , Ntanasi E , Scarmeas N ((2018) ) Dementia prevalence in Greece: The Hellenic Longitudinal Investigation of Aging and Diet (HELIAD). Alzheimer Dis Assoc Disord 32: , 232–239. |
[15] | American Psychiatric Association ((2000) ) Diagnostic and Statistical Manual of Mental Disorders, ed 4th ed. American Psychiatric Press Inc.; Washington, DC. |
[16] | Petersen RC , Doody R , Kurz A , Mohs RC , Morris JC , Rabins P V , Ritchie K , Rossor M , Thal L , Winblad B ((2001) ) Current concepts in mild cognitive impairment. Arch Neurol 58: , 1985–1992. |
[17] | Anstey KJ , Cherbuin N , Herath PM , Qiu C , Kuller LH , Lopez OL , Wilson RS , Fratiglioni L ((2014) ) A self-report risk index to predict occurrence of dementia in three independent cohorts of older adults: The ANU-ADRI. PLoS One 9: , e86141. |
[18] | Song Y-N , Wang P , Xu W , Li J-Q , Cao X-P , Yu J-T , Tan L ((2018) ) Risk factors of rapid cognitive decline in Alzheimer’s disease and mild cognitive impairment: A systematic review and meta-analysis. J Alzheimers Dis 66: , 497–515. |
[19] | Gassama M , Bénichou J , Dartois L , Thiébaut ACM ((2017) ) Comparison of methods for estimating the attributable risk in the context of survival analysis. BMC Med Res Methodol 17: , 10. |
[20] | U.S. Census Bureau. Annual Social and Economic Supplement to the Current Population Survey 2006 U.S. Department of Commerce Washington, DC. |
[21] | White IR , Royston P , Wood AM ((2011) ) Multiple imputation using chained equations: Issues and guidance for practice. Stat Med 30: , 377–399. |
[22] | Qizilbash N , Gregson J , Johnson ME , Pearce N , Douglas I , Wing K , Evans SJW , Pocock SJ ((2015) ) BMI and risk of dementia in two million people over two decades: A retrospective cohort study. Lancet Diabetes Endocrinol 3: , 431–436. |
[23] | Kennelly SP , Lawlor BA , Kenny RA ((2009) ) Blood pressure and the risk for dementia-A double edged sword. Ageing Res Rev 8: , 61–70. |
[24] | Sabbagh MN , Tyas SL , Emery SC , Hansen LA , Alford MF , Reid RT , Tiraboschi P , Thal LJ ((2005) ) Smoking affects the phenotype of Alzheimer disease. Neurology 64: , 1301–1303. |
[25] | Stephan BCM , Brayne C ((2014) ) Risk factors and screening methods for detecting dementia: A narrative review. J Alzheimers Dis 42: , S329–S338. |
[26] | Scarmeas N , Albert SM , Manly JJ , Stern Y ((2006) ) Education and rates of cognitive decline in incident Alzheimer’s disease. J Neurol Neurosurg Psychiatry 77: , 308–316. |
[27] | Morris JC , Storandt M , Miller JP , McKeel DW , Price JL , Rubin EH , Berg L ((2001) ) Mild cognitive impairment represents early-stage Alzheimer disease. Arch Neurol 58: , 397–405. |
[28] | Griffiths TD , Lad M , Kumar S , Holmes E , McMurray B , Maguire EA , Billig AJ , Sedley W ((2020) ) How can hearing loss cause dementia? Neuron 108: , 401–412. |
[29] | Palsetia D , Rao GP , Tiwari SC , Lodha P , De Sousa A ((2018) ) The Clock Drawing Test versus Mini-mental Status Examination as a screening tool for dementia: A clinical comparison. Indian J Psychol Med 40: , 1–10. |
[30] | Columbia Public Health. https://www.publichealth.columbia.edu/research/population-health-methods/competing-risk-analysis, Last updated January 24, 2022, Accessed on January 30, 2022. |
[31] | Greenland S ((2008) ) Multiple comparisons and association selection in general epidemiology. Int J Epidemiol 37: , 430–434. |
[32] | ICD-11 2021 WHO 2019. https://icd.who.int/browse11/l-m/en#/http%3A%2F%2Fid.who.int%2Ficd%2Fentity%2F277610609, Last updated September 15, 2021, Accessed on September 15, 2021. |
[33] | WHO (2009) Global Health Risks: Mortality and burden of disease attributable to selected major risks, Geneva. |


