
Sociodemographic, Lifestyle, Physical, and Psychosocial Determinants of Cognitive Reserve
Abstract
Background:
Cognitive reserve aims to explain individual differences in the susceptibility to the functional impact of dementia in the presence of equal amount of neuropathological damage. It is thought to be shaped by a combination of innate individual differences and lifetime exposures. Which determinants are associated with cognitive reserve remains unknown.
Objective:
The objective of this study was to investigate the associations of sociodemographic, lifestyle, physical, and psychosocial determinants with cognitive reserve, and potential sex differences.
Methods:
This cross-sectional study included 4,309 participants from the Rotterdam Study (mean age 63.9±10.7) between 2006–2016. Participants completed five cognitive tests and a brain MRI-scan. Cognitive reserve was defined as a latent variable that captures variance common across five cognitive tests, while adjusting for demographic and MRI-inferred neuropathological factors. The associations of potential determinants and cognitive reserve, adjusted for relevant confounders, were assessed with structural equation models.
Results:
Current smoking (adjusted mean difference: –0.31, 95%confidence interval –0.42; –0.19), diabetes mellitus (–0.25, –0.40; –0.10) and depressive symptoms (–0.07/SD, –0.12; –0.03) were associated with a lower cognitive reserve whereas alcohol use (0.07/SD, 0.03; 0.12) was associated with higher cognitive reserve. Only smoking was associated with cognitive reserve in both men and women. Employment, alcohol use, diabetes, history of cancer, COPD, and depressive symptoms were only associated with cognitive reserve in women.
Conclusion:
Our study found that current smoking, diabetes mellitus, and depressive symptoms were associated with a lower cognitive reserve, whereas more alcohol use was associated with a higher cognitive reserve, but with clear differences between men and women.
INTRODUCTION
Epidemiological studies show that 11%of the world’s population is over 60 years of age, with a projected increase to 22%of the population by 2050 [1]. Advancing adult age is a major risk factor for chronic neurodegenerative diseases such as dementia [2]. It is estimated that by 2030, there will be 75 million people with dementia worldwide [3].
However, individual differences in the susceptibility to the functional impact of dementia-related neuropathological damage (e.g., different cognitive impairments in patients with similar neuropathology) have been described [4, 5]. The term cognitive reserve has been coined to capture the scientific paradigm that refers to the adaptability that helps to explain differential susceptibility of cognitive abilities or day-to-day function to brain aging, pathology, or insult, and has been described in terms of both resilience and resistance [6]. Indeed, a high cognitive reserve was found to be related to a 47%reduced relative risk of mild cognitive impairment or dementia [7].
The latent concept of cognitive reserve was first described as a scientific paradigm in 1988 and has since been operationalized in many different ways [8]. Most previous studies have operationalized cognitive reserve through proxies such as educational or occupational attainment [9]. Educational attainment as a proxy for cognitive reserve has however several limitations as it might be particularly influenced by sociodemographic and cultural factors [10, 11]. Also, the static concept of highest attained educational level may not capture the dynamic process of cognitive reserve well. To circumvent these problems, recent studies have used the residual method to estimate cognitive reserve [12, 13]. The residual method quantifies cognitive reserve by calculating the difference between actual and predicted cognitive performance on neuropsychological tests, where predicted performance is estimated relative to underlying neuropathology [7]. This method of estimating cognitive reserve has been validated in the context of Alzheimer’s disease in several cohorts [12–15], including our cohort in which we conceptualize cognitive reserve in terms of resilience [16]. Although the model has been applied with alterations, for example by a difference in cognitive tests used, the associations were consistent across cohorts.
By improving the indicators of cognitive reserve, we might also be able to increase our understanding of determinants related to cognitive reserve. To date it remains unknown which determinants affect or contribute to cognitive reserve, although some hypotheses have been formed [4]. Previous literature has, however, only identified these determinants to be associated with cognitive impairment and dementia, constructs related to cognitive reserve. These studies show that a low lifetime occupational attainment is associated with a greater risk of developing dementia [17]. Additionally, cohabiting with a partner has been suggested to have a beneficial effect on cognition in old ages [18]. Social determinants, such as network size for example, have also been suggested to modify the association between brain pathology and cognitive function [19]. Regular leisure-time physical activity has also been suggested to be associated with a reduced risk as well as slower progression of Alzheimer’s disease [20, 21].
Since the operationalization of cognitive impairment and dementia is closely related to cognitive reserve, similar determinants may play a role. Yet, there might also be specific determinants as cognitive reserve allows you to keep level of functioning despite having pathology. If the determinants of cognitive reserve were understood, we would be able to determine intervention targets, in order to impact cognitive reserve, slow age-related cognitive decline and prolong healthy aging [4]. However, additional causal research beyond this study is needed to exactly determine which determinants impact cognitive reserve.
The objective of this study was to identify potential determinants for cognitive reserve in community dwelling adults of the Rotterdam Study [22]. We operationalized cognitive reserve using structural equation models, for which we focus on resilience, that is a better-than-expected cognitive performance, relative to the degree of Alzheimer’s disease pathology. We hypothesized that several sociodemographic, lifestyle, physical, and psychosocial determinants were associated with cognitive reserve and specifically included determinants in our study that have potential to be intervened upon. Based on prior research and the cognitive reserve hypothesis, our hypothesis is stronger for determinants of cognitive stimulation (occupational attainment), social stimulation (marital status) and physical activity [4]. Other hypotheses were less strong and based on narrative reviews which suggested other lifestyle determinants (alcohol consumption, substance abuse, dietary habits) [9, 23] and medical conditions (depression, hypertension, diabetes, and pulmonary disease) [9]. As there are several biological and lifestyle differences between men and women which contribute differently to the vulnerability to neuropathology, we also examined differences between men and women [24].
METHODS
Study population
The present cross-sectional study was embedded within the Rotterdam Study, a prospective population-based cohort [22]. The study started in 1990 and has included approximately 14,926 residents of 45 years and older of the Ommoord district in Rotterdam, the Netherlands. Every 3–6 years, at-home interviews and examinations at a specially built research facility were conducted. Brain magnetic resonance imaging (MRI) was included in the protocol from 2005 onwards [25].
A total of 6,557 participants were eligible for cognitive testing between 2006 and 2016. Participants were excluded when there was no complete data on cognition (n = 876), educational attainment (n = 55), no MRI-scan visit (n = 556), or an MRI scan of insufficient quality (n = 500). Those with prevalent dementia or stroke were also excluded (n = 261). In total, 4,309 participants were included (Supplementary Figure 1).
The Rotterdam Study has been approved by the Medical Ethics Committee of the Erasmus MC (registration number MEC 02.1015) and by the Dutch Ministry of Health, Welfare and Sport (Population Screening Act WBO, license number 1071272-159521-PG). The Rotterdam Study has been entered into the Netherlands National Trial Register (NTR; www.trialregister.nl) and into the WHO International Clinical Trials Registry Platform (ICTRP; www.who.int/ictrp/network/primary/en/) under shared catalogue number NTR6831. All participants provided written informed consent to participate in the study and to have their information obtained from treating physicians.
Data can be obtained upon request. Requests should be directed towards the management team of the Rotterdam Study ([email protected]), which has a protocol for approving data requests. Because of restrictions based on privacy regulations and informed consent of the participants, data cannot be made freely available in a public repository.
Measurement of determinants
Sociodemographic variables
Data on sociodemographic variables were collected during an interview at home. Marital status was categorized in three groups: married or living together (including divorced or widow/widower and remarried), divorced or widow/widower, and never married. Living alone was defined as living without any other people in the household. Employment status was defined as paid employment, retirement (including early retirement and rentier), and no paid employment.
Lifestyle variables
Body mass index (BMI) was calculated using height (cm) and weight (kg) obtained on calibrated scales at the research center. All other lifestyle variables were self-reported during the home interview. Smoking was categorized as never, former, and current. Alcohol use was measured by assessing the consumption of beer, wine, liquor, and other alcohol types, and converting this to grams per day [26]. As a measure of overall diet quality, a score based on degree of adherence to the Dutch Dietary Guidelines was developed [27]. Total adherence to the guidelines was calculated as the sum of the number of items adhered to, with a higher score indicating a better adherence. Daily energy intake (kcal/day) was measured with a food frequency questionnaire [28]. Physical activity was assessed using the LASA Physical Activity Questionnaire (LAPAQ) [29], and expressed in the Metabolic Equivalent of Task per week (MET hours/week). The LAPAQ contains questions regarding the frequency and duration of walking, cycling, sports, gardening, and housework.
Physical disease
Blood pressure was measured twice with a sphygmomanometer, and the mean was taken as the participant’s reading. Hypertension was defined as the use of antihypertensive medication, or a systolic blood pressure of > 140 mmHg or a diastolic blood pressure of > 90 mmHg. Diabetes was defined as use of antidiabetic medication, a fasting serum glucose level ≥7.1 mmol/L, or a non-fasting serum glucose level ≥11.1 mmol/L[30]. History of cardiovascular disease was defined as a history of coronary heart diseases (i.e., myocardial infarction, revascularization, coronary artery bypass graft surgery or percutaneous coronary intervention) and collected from medical records of the general practitioner [31]. Cancer diagnoses during participation in the Rotterdam Study were based on medical records of the general practitioner and through linkage with the national hospital discharge registry. All types of cancer were included except for non-melanoma skin cancer. Chronic obstructive pulmonary disease (COPD) was diagnosed according to the Global Initiative for Chronic Obstructive Lung Disease (GOLD) guidelines by spirometry performed at the research center [32] or via medical records if there was no interpretable study-acquired spirometry.
Psychosocial variables
In all participants we assessed depressive symptoms with the Center for Epidemiological Studies-Depression (CES-D) scale which ranges from 0 to 60 [33, 34]. CES-D sum scores were weighted for missing items; scores with more than 25%missing items were considered missing. A higher CES-D sum score indicates more depressive symptoms. Sleep quality was measured with the Pittsburgh Sleep Quality Index (PSQI) which measures seven sleep quality components [35]. PSQI sum scores were weighted for missing items; scores with more than one component missing were considered missing. A higher PSQI score indicates a worse sleep quality. Quality of life was measured with EuroQol-5D-3L questionnaire containing five questions [36]. Participants with one or more missing question were considered as missing. The scores of each question were weighted for Dutch preferences and converted into an overall index score ranging from 0 to 1, with a higher score indicating a better quality of life [37].
Measurement of cognitive reserve
Cognitive testing
All participants completed a neurocognitive test battery at the research center. Cognitive tests included the 15-word verbal learning test (WLT) [38], measuring verbal learning and memory, the Stroop task (Stroop) [39], measuring processing and attention, the word fluency test (WFT) [40], measuring efficiency of searching long term memory, the letter-digit substitution task (LDST) [41], measuring processing speed and executive function, and the Purdue pegboard test (PPB) [42], measuring dexterity and fine motor speed [43].
Educational attainment
Educational attainment was classified in four categories according to the UNESCO classification: primary education (primary), lower/intermediate general education or lower vocational education (low), intermediate vocational education or higher education (intermediate), and higher vocational education or university (high).
Image acquisition and processing
Neuroimaging was performed using a 1.5 Tesla MRI scanner with an eight-channel head coil (GE Signa Excite, General Electric Healthcare, Milwaukee, USA). The scan and image processing protocol have been described extensively elsewhere [25]. Brain tissue segmentation was conducted through a k nearest neighbor classifier, extended with an in-house developed white matter lesion segmentation algorithm [44]. The brain measures used in this study include total brain volume, total white matter hyper intensities volume and intracranial volume. Total brain volume was calculated by summing total grey plus white matter.
Statistical analyses
Estimation of cognitive reserve
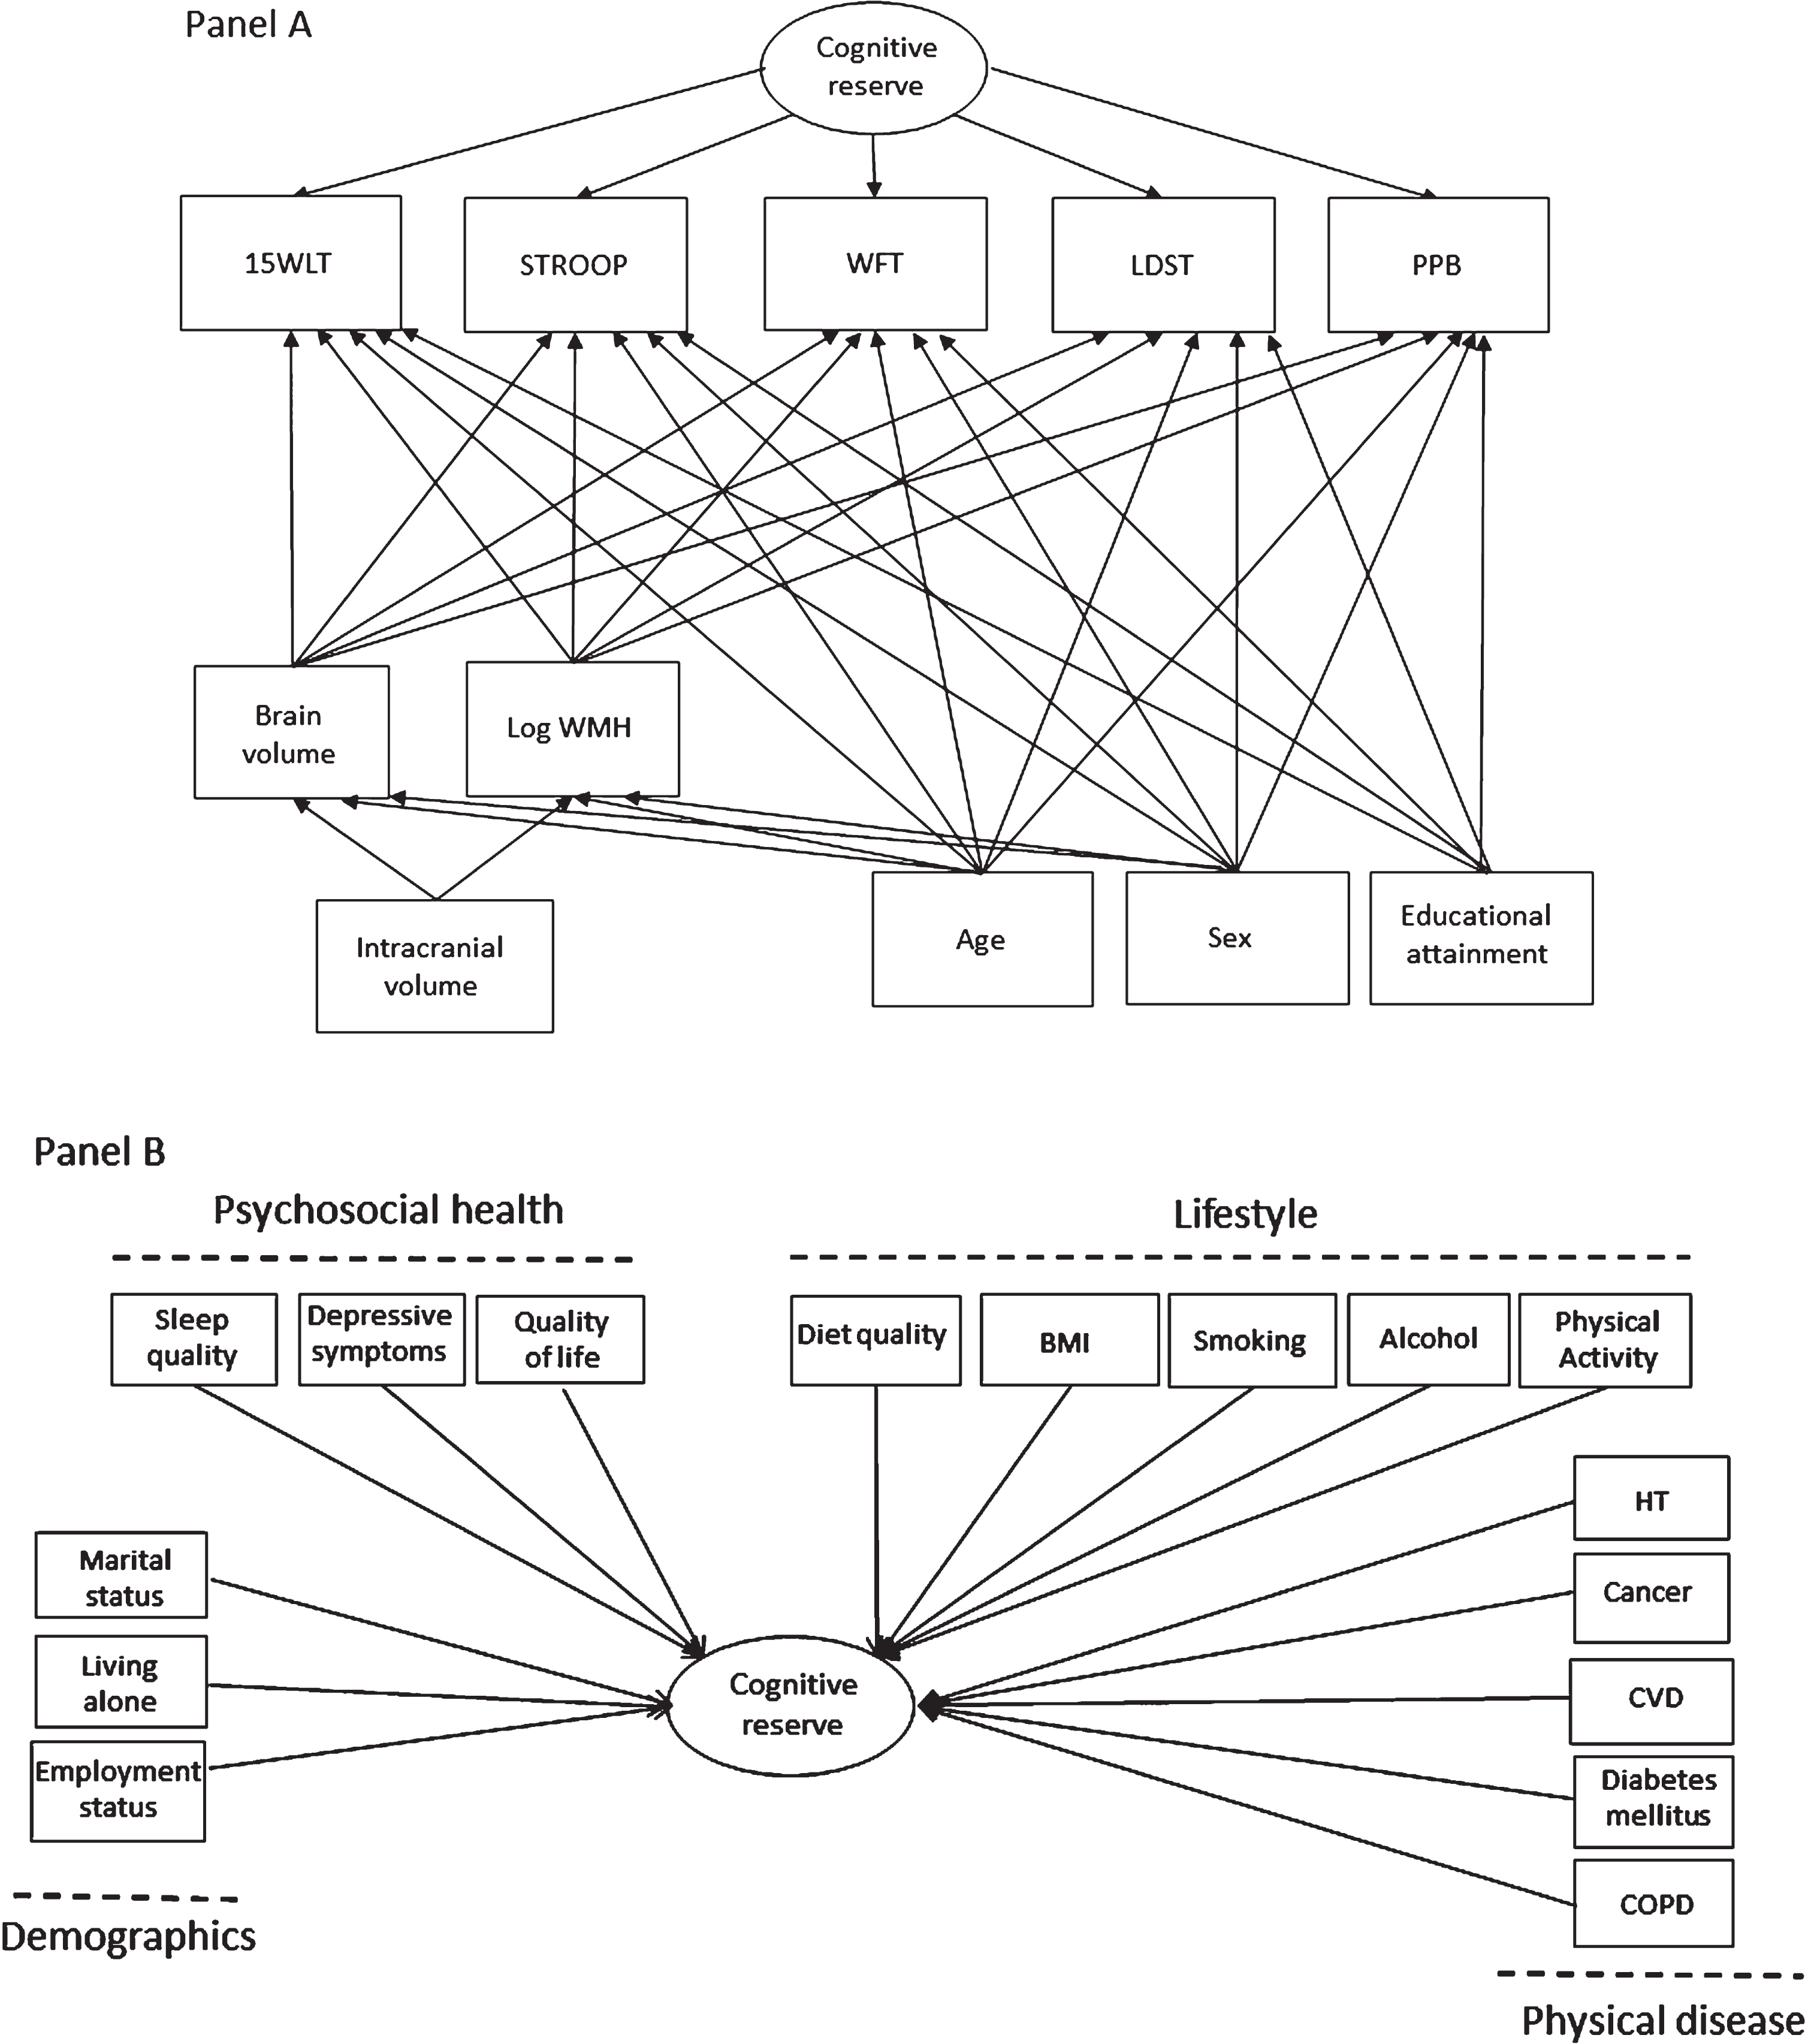
Cognitive reserve was estimated using a structural equation model (SEM), which is displayed in Fig. 1A. We used the model of Petkus et al. [13] for estimating general cognitive reserve as a guideline for our analyses. The SEM to estimate cognitive reserve we use in this study has been previously validated in our cohort with regard to the incidence Alzheimer’s disease [16]. All variables included in the SEM were checked for normality and Z-score standardized. We log-transformed the Stroop task and the white matter hyperintensity volume due to a skewed distribution. The score from each cognitive test (WLT, Stroop, WFT, LDST, PPB) was adjusted for sex, age, educational status, total brain volume, and log-transformed white matter hyperintensity volume to account for variance explained by these factors. The structural brain MRI measures were additionally adjusted for intracranial volume, sex, and age. Cognitive reserve was estimated as a quantitative continuous latent variable that captures the variance among the five cognitive tests, for which higher scores indicated better performance. A higher cognitive reserve score can therefore be interpreted as a better cognitive reserve than would have been expected based on the cognitive testing, age, sex, educational attainment, and structural brain factors. This cognitive reserve variable was standardized, extracted from the SEM, and used in the second stage as dependent variable in the regression models. Multiple indices were used to evaluate model fit: the comparative fit index (CFI), the Tucker Lewis Index (TLI), the root-mean-squared error of approximation (RMSEA) with 90%confidence interval (CI), and the chi square statistics by degrees of freedom. Standard criteria of CFI > 0.95, TLI > 0.95, and RMSEA < 0.06 were used to assess the model fit [45].
Fig. 1
The multivariate structural equations model used to quantify cognitive reserve and assessed associations of determinants with cognitive reserve. Rectangles are observed variables and ovals are latent variables. Panel A depicts the definition of cognitive reserve as the residual variance of the regressions of five cognitive tests on MRI-scan inferred brain pathology and demographics. For simplicity, the model does not show the correlations among the observed variables. Panel B depicts the variables investigated in relation to cognitive reserve. Note that all cognitive, MRI and demographic variables listed in Panel A are included in the model, but not depicted in Panel B. 15WLT, the 15-word verbal learning test; STROOP, Stroop task; WFT, word fluency test; LDST, letter-digit substitution task; PPB, Purdue pegboard test; WMH, white matter hyperintensities; HT, hypertension; CVD, cardiovascular disease; COPD, chronic obstructive pulmonary disease.
Regression analyses
We analyzed associations of sociodemographic, psychosocial, lifestyle, and physical health determinants with cognitive reserve, as summarized in Fig. 1B. All continuous variables in the SEM model were standardized. Due to non-normality in the data, we used the robust maximum likelihood estimator. In all analyses, the diet quality score was adjusted for daily energy intake (kcal/day) to reduce measurement error. The associations were assessed in three models. In Model 1, univariate associations between all determinants and cognitive reserve were tested. In Model 2, we adjusted each variable within a domain for the variables of the other domains (e.g., depressive symptoms adjusted for all sociodemographic, lifestyle, and physical health determinants). In Model 3, all variables were combined in one mutually adjusted multivariate model.
In order to investigate possible differences between men and women, we stratified the analyses of Model 3 based on sex. To test for significant differences, we included the sex*variable product term and the sex variable in the analyses of the full sample. To investigate whether different determinants were associated with cognitive reserve for participants with different genetic risk profiles, we stratified Model 3 for APOE ɛ4 status (presence or absence) in all participants with available APOE ɛ4 status (n = 4011). To test for significant differences, we included the APOE ɛ4 status*variable product term and the APOE ɛ4 status variable in the analyses of the full sample.
Missing variables were imputed using full information maximum likelihood (FIML). The structural equations model was fitted using the ‘lavaan’ package in R 4.0.4. All standardized path coefficients are described as the mean difference (mean dif.) or adjusted mean difference (adj. mean dif.). A correction for multiple testing was performed per model (assuming 19 independent hypotheses) using the false discovery rate with α=0.05 [46].
RESULTS
Main results
Table 1 shows the characteristics of the study population and differences between men and women. The mean age of the study population was 63.9 (SD: 10.7) years and 56.0%were women. All models in our study had good model fit indices (CFI > 0.95, TLI > 0.95, and RMSEA < 0.06) [45]. The cognitive reserve variable had a mean of 0 (SD: 1) because it was standardized. Age and body mass index were similar between men and women, for all other variables there were significant differences (Table 1).
Table 1
Characteristics of the study population
| Characteristic | Total | Women | Men | p* |
| n = 4,309 | n = 2,411 | n = 1,898 | ||
| Demographics | ||||
| Sex, female, n (%) | 2,411 (56.0) | |||
| Age, mean (SD) | 63.88 (10.7) | 63.96 (10.7) | 63.79 (10.7) | 0.601 |
| Educational attainment, n (%) | < 0.001 | |||
| –Primary | 337 (7.8) | 205 (8.5) | 132 (7.0) | |
| –Low | 1,623 (37.7) | 1,159 (48.1) | 464 (24.4) | |
| –Intermediate | 1,302 (30.2) | 603 (25.0) | 699 (36.8) | |
| –High | 1,047 (24.3) | 444 (18.4) | 603 (31.8) | |
| Marital status, n, (%) | < 0.001 | |||
| –(re)Married or living together | 3,209 (74.5) | 1,573 (65.2) | 1,636 (86.3) | |
| –Widowed or divorced | 908 (21.1) | 709 (29.4) | 199 (10.5) | |
| –Never married | 190 (4.4) | 129 (5.4) | 61 (3.2) | |
| Living alone, n (%) | 973 (22.6) | 744 (30.9) | 229 (12.1) | < 0.001 |
| Paid employment status, n (%) | < 0.001 | |||
| –Employed | 1,755 (41.5) | 845 (35.0) | 910 (48.6) | |
| –Retired | 1,719 (40.6) | 850 (35.3) | 869 (46.5) | |
| –No paid employment | 759 (17.9) | 668 (27.7) | 91 (4.9) | |
| Lifestyle | ||||
| Body mass index, mean (SD) | 27.39 (4.20) | 27.34 (4.63) | 27.44 (3.49) | 0.453 |
| Smoking, n (%) | < 0.001 | |||
| –Never | 1,370 (31.8) | 969 (40.2) | 401 (21.2) | |
| –Former | 2,087 (48.5) | 1,048 (43.5) | 1,039 (54.8) | |
| –Current | 848 (19.7) | 393 (16.3) | 455 (24.0) | |
| Alcohol, gr/day, mean (SD) | 8.04 (8.75) | 5.97 (6.65) | 10.65 (10.25) | < 0.001 |
| Diet quality score, mean (SD) | 6.95 (1.85) | 7.22 (1.82) | 6.59 (1.83) | < 0.001 |
| Physical activity, MET/h/week, mean (SD) | 55.42 (47.57) | 59.90 (49.61) | 49.52 (44.08) | < 0.001 |
| Physical health | ||||
| Hypertension, n (%) | 2,665 (62.2) | 1,431 (59.6) | 1234 (65.5) | < 0.001 |
| Diabetes mellitus, (%) | 344 (8.8) | 156 (7.2) | 188 (10.9) | < 0.001 |
| Cardiovascular disease, n (%) | 219 (5.1) | 76 (3.2) | 143 (7.6) | < 0.001 |
| Cancer, n (%) | 164 (3.9) | 69 (2.9) | 95 (5.0) | < 0.001 |
| Chronic obstructive pulmonary disease, n (%) | 424 (9.8) | 198 (8.2) | 226 (11.9) | < 0.001 |
| Psychosocial health | ||||
| Depressive symptoms, CES-D, mean SD | 5.31 (7.02) | 6.46 (7.77) | 3.85 (5.61) | < 0.001 |
| Sleep quality, PSQI, mean (SD) | 3.96 (3.37) | 4.71 (3.64) | 3.02 (2.72) | < 0.001 |
| Quality of life, EQ-5d index, mean (SD) | 0.89 (0.16) | 0.86 (0.17) | 0.92 (0.13) | < 0.001 |
| Cognitive reserve | ||||
| Cognitive reserve, mean (SD) | 0 (1) | 0 (1.03) | 0 (0.96) | 1.00 |
*Differences between men and women were calculated using a Pearsons Chi-square test for discrete data and a Welch two sample t-test for continuous data. Percentages and means are calculated in participants with available data. SD, standard deviation; MET, metabolic equivalent of task; CES-D, Center for Epidemiological Studies-Depression; PSQI, the Pittsburgh Sleep Quality Index; EQ-5d, EuroQol questionnaire. Missing: Marital status n = 2, living situation n = 2, employment status n = 76, body mass index n = 65, smoking n = 4, alcohol n = 72, diet quality score n = 815, MET n = 854, hypertension n = 22, diabetes mellitus n = 404, cardiovascular disease n = 53, cancer n = 62, CES-D n = 12, PSQI n = 154, QOL n = 4.
Sociodemographic determinants
Being widowed or divorced (mean dif. –0.15, 95%CI –0.25; –0.05) or never married (mean dif. –0.27, 95%CI –0.47; –0.08) was associated with a lower cognitive reserve when compared to being (re)married or living together (Table 2, Model 1). Additionally, living alone (mean dif. –0.16, 95%CI –0.27; –0.06) compared to living with at least one other person in the household, and no paid employment (mean dif. –0.19, 95%CI –0.31; –0.07) compared to having paid employment were associated with a lower cognitive reserve (Table 2, Model 1). However, when adjusting for variables from other domains, i.e., lifestyle, physical and psychosocial health, (Table 2, Model 2) and mutually adjusting for the sociodemographic variables (Table 2, Model 3), no sociodemographic variables remained associated with cognitive reserve.
Table 2
Associations of demographic, lifestyle, physical health, and psychosocial determinants with cognitive reserve in the total population
| Domain and characteristic | Model 1: Univariate Mean dif. (95%CI) | Model 2: Multivariate* Mean dif. (95%CI) | Model 3: Multivariate† Mean dif. (95%CI) |
| Demographics | |||
| Marital status | |||
| –(re)Married/living together | Ref | Ref | Ref |
| –Widowed or divorced | –0.15 (–0.25; –0.05) | –0.08 (–0.18; 0.02) | –0.07 (–0.26; 0.11) |
| –Never married | –0.27 (–0.47; –0.08) | –0.22 (–0.42; –0.02) | –0.23 (–0.48; 0.02) |
| Living alone | –0.16 (–0.27; –0.06) | –0.10 (–0.21; 0.00) | –0.01 (–0.21; 0.19) |
| Paid employment status | |||
| –Employed | Ref | Ref | Ref |
| –Retired | 0.07 (–0.06; 0.20) | 0.08 (–0.05; 0.21) | 0.08 (–0.06; 0.21) |
| –No paid employment | –0.19 (–0.31; –0.07) | –0.13 (–0.26; –0.01) | –0.15 (–0.27; –0.02) |
| Lifestyle | |||
| Body mass index, per SD | –0.03 (–0.07; 0.00) | –0.02 (–0.06; 0.02) | –0.03 (–0.07; 0.01) |
| Smoking | |||
| –Never | Ref | Ref | Ref |
| –Former | 0.08 (–0.00; 0.17) | 0.08 (–0.01;0.17) | 0.06 (–0.03; 0.15) |
| –Current | –0.30 (–0.41; –0.19) | –0.27 (–0.38; –0.15) | –0.31 (–0.42; –0.19) |
| Alcohol, per SD | 0.06 (0.02; 0.10) | 0.06 (0.02; 0.10) | 0.07 (0.03; 0.12) |
| Diet Quality Score, per SD‡ | 0.01 (–0.03; 0.06) | 0.01 (–0.03; 0.05) | 0.01 (–0.04; 0.05) |
| Physical activity, per SD | 0.01 (–0.04; 0.05) | –0.01 (–0.06; 0.03) | –0.02 (–0.06; 0.03) |
| Physical health | |||
| Hypertension | –0.02 (–0.10; 0.07) | –0.02 (–0.11; 0.07) | –0.00 (–0.09; 0.09) |
| Diabetes mellitus | –0.31 (–0.45; –0.17) | –0.25 (–0.40; –0.10) | –0.25 (–0.40; –0.10) |
| Cardiovascular disease | –0.06 (–0.22; 0.11) | –0.04 (–0.21; 0.13) | 0.01 (–0.18; 0.17) |
| Cancer | –0.17 (–0.38; 0.03) | –0.16 (–0.36; 0.05) | –0.17 (–0.38; 0.03) |
| COPD | –0.22 (–0.35; –0.09) | –0.16 (–0.29; –0.03) | –0.15 (–0.28; –0.02) |
| Psychosocial health | |||
| Depressive symptoms, per SD | –0.11 (–0.15; –0.07) | –0.09 (–0.13; –0.05) | –0.07 (–0.12; –0.03) |
| Sleep quality, per SD | –0.06 (–0.10; –0.02) | –0.05 (–0.09; –0.01) | –0.02 (–0.06; 0.02) |
| Quality of life, per SD | 0.08 (0.04; 0.12) | 0.05 (0.01; 0.09) | 0.01 (–0.03; 0.06) |
*Adjusted for all variables within other domains (e.g., depressive symptoms adjusted for all sociodemographic, lifestyle and physical health determinants); †Adjusted for all variables across domains, ‡adjusted for daily energy intake (kcal/day) in all models Estimates in bold = significant after adjusting for the false discovery rate.
Lifestyle determinants
Current smoking compared with never smoking (adj. mean dif. –0.31, 95%CI –0.42; –0.19) and more alcohol use (adj. mean dif. 0.07/SD, 95%CI 0.03;0.12) were both significantly but inversely associated with cognitive reserve, also after adjusting for covariates (Table 2, Model 3).
Physical disease
Having diabetes mellitus (mean dif. –0.31, 95%CI –0.45; –0.17) and chronic obstructive pulmonary disease (mean dif. –0.22, 95%CI –0.35; –0.09) were associated with a lower cognitive reserve (Table 2, Model 1). However, when adjusting for all other variables (Table 2, Model 3), only having diabetes mellitus (adj. mean dif. –0.25, 95%CI –0.40; –0.10) remained associated with a lower cognitive reserve.
Psychosocial health determinants
More depressive symptoms (mean dif. –0.11/SD, 95%CI –0.15; –0.07) and a worse sleep quality (mean dif. –0.06/SD, 95%CI –0.10; –0.02) were associated with a lower cognitive reserve (Table 2, Model 1). A higher quality of life (mean dif. 0.08/SD, 95%CI 0.04; 0.12) was associated with a higher cognitive reserve (Table 2, Model 1). These variables remained associated with cognitive reserve after adjusting for variables from other domains (Table 2, Model 2). However, after mutually adjusting for the other psychosocial determinants, only more depressive symptoms (adj. mean dif. –0.07/SD, 95%CI –0.12; –0.03) remained associated with a lower cognitive reserve (Table 2, Model 3).
Sex stratified analyses
Several determinants were related to cognitive reserve in women only (Table 3). Only current smoking was associated with a lower cognitive reserve in both women and men (adj. mean dif. –0.30, 95%CI –0.46; –0.14 and –0.34, 95%CI –0.52; –0.16, respectively) when compared to never smoking. Determinants associated with a lower cognitive reserve in women included no paid employment (adj. mean dif. –0.22, 95%CI –0.36; –0.08, sex*no paid employment p = 0.06), diabetes mellitus (adj. mean dif. –0.39, 95%CI –0.62; –0.15, sex*diabetes mellitus p = 0.02), history of cancer (adj. mean dif. –0.43, 95%CI –0.73; –0.12, sex*history of cancer p = 0.02), COPD (adj. mean dif. –0.26, 95%CI –0.45; –0.07, sex*COPD p = 0.08) and more depressive symptoms (adj. mean dif. –0.07/SD, 95%CI –0.12; –0.02, sex*depressive symptoms p = 0.70). More alcohol use was associated with a higher cognitive reserve only in women (adj. mean dif. 0.18/SD, 95%CI 0.11; 0.25, sex*alcohol use p < 0.001).
Table 3
Associations of demographic, lifestyle, physical health, and psychosocial determinants with cognitive reserve in men and women
| Domain and characteristic | Model: Men Mean dif. (95%CI) | Model: Women Mean dif. (95%CI) | p-product term |
| Demographics | |||
| Marital status | |||
| –(re)Married/living together | Ref | Ref | |
| –Widowed or divorced | 0.02 (–0.40; 0.37) | –0.07 (–0.28; 0.13) | |
| –Never married | –0.27 (–0.75; 0.20) | –0.15 (–0.44; 0.14) | |
| Living alone | –0.16 (–0.56; 0.25) | 0.04 (–0.18; 0.26) | |
| Paid employment status | |||
| –Employed | Ref | Ref | |
| –Retired | –0.16 (–0.05; 0.37) | –0.01 (–0.18; 0.17) | |
| –No paid employment | 0.12 (–0.22; 0.45) | –0.22 (–0.36; –0.08) | 0.064 |
| Lifestyle | |||
| Body mass index, per SD | –0.05 (–0.13; 0.02) | 0.01 (–0.04; 0.06) | |
| Smoking | |||
| –Never | Ref | Ref | |
| –Former | 0.05 (–0.01; 0.21) | 0.04 (–0.07; 0.15) | |
| –Current | –0.34 (–0.52; –0.16) | –0.30 (–0.46; –0.14) | |
| Alcohol, per SD | 0.02 (–0.04; 0.07) | 0.18 (0.11; 0.25) | < 0.001* |
| Diet Quality Score, per SD | –0.02 (–0.09; 0.05) | 0.03 (–0.03; 0.09) | |
| Physical activity, per SD | –0.07 (–0.15; 0.00) | 0.02 (–0.03; 0.08) | |
| Physical health | |||
| Hypertension | 0.05 (–0.09; 0.19) | –0.03 (–0.15; 0.09) | |
| Diabetes mellitus | –0.12 (–0.31; 0.07) | –0.39 (–0.62; –0.15) | 0.019* |
| Cardiovascular disease | 0.02 (–0.18; 0.22) | –0.08 (–0.42; 0.25) | |
| Cancer | 0.05 (–0.23; 0.33) | –0.43 (–0.73; –0.12) | 0.022* |
| COPD | –0.04 (–0.23; 0.15) | –0.26 (–0.45; –0.07) | 0.079 |
| Psychosocial health | |||
| Depressive symptoms, per SD | –0.08 (–0.16; 0.00) | –0.07 (–0.12; –0.02) | 0.705 |
| Sleep quality, per SD | –0.01 (–0.09; 0.07) | –0.02 (–0.07; 0.03) | |
| Quality of life, per SD | 0.01 (–0.07; 0.09) | 0.01 (–0.04; 0.07) |
All variables are combined in one mutually adjusted multivariate model. Estimates in bold = significant after false discovery rate adjustment. p-product term, p-value for the product term tested in the not-stratified model, *p < 0.05.
APOE ɛ4 carriership stratified analyses
We found no significant differences between APOE ɛ4 carriers and non-carriers for any of the variables associated with cognitive reserve (n = 4,011; Supplementary Table 1).
DISCUSSION
In this cohort of community dwelling adults, we found that current smoking, diabetes mellitus, and depressive symptoms were associated with a lower cognitive reserve, whereas more alcohol use was associated with a higher cognitive reserve, but with clear differences between men and women. Only smoking was associated with cognitive reserve in both men and women; no paid employment, alcohol use, diabetes mellitus, history of cancer, COPD, and depressive symptoms were only associated with cognitive reserve in women. This suggests that there could be biological or lifestyle differences between men and women that contribute to which determinants are associated with cognitive reserve.
Domains of determinants
Sociodemographic determinants
Previous literature identified occupational attainment as one of the main determinants suggested to contribute to cognitive reserve [4]. This was partly based on a relatively small study (n = 593), which found an association between low occupational attainment and an increased risk of dementia in women [17]. This study excluded housewives from their analysis and defined low and high occupation based on the nature of the job. The association we found between no paid employment and lower cognitive reserve in women might be explained by different underlying reasons for not having paid employment in men and women. Most men were having no paid employment or receiving state pension, whereas most women were housewives. Possibly, the men without paid employment in our study were able to increase their cognitive reserve during previous employment. Mechanisms underlying employment status and cognitive reserve remain unknown. However, it has been suggested that an acquired set of skills or repertoires could allow an individual to better cope with brain pathology, or possibly that increased synaptic density in neocortical association cortex acquired on the basis of stimulation contributes to cognitive reserve [17].
Lifestyle determinants
Previous studies found negative effects of smoking on cognition and Alzheimer’s disease [47, 48], we now additionally show that this is also the case for cognitive reserve. Smoking could possibly influence cognitive reserve via vascular pathways. Underlying mechanisms remain unclear, but previous studies suggested that the progression of periventricular and subcortical white matter lesions is associated with cognitive decline independent of other cardiovascular risk factors [49]. We also found a positive association between alcohol use and cognitive reserve in women. A recent review suggested that moderate alcohol consumption may slow the rate of cognitive decline and reduce the risk of Alzheimer’s disease [50]. Possible underlying mechanisms include a reduction of white matter lesions and brain infarcts, the release of acetylcholine, a reduced risk of microvascular complications, increased levels of HDL cholesterol and antioxidants [51]. Yet, it might also indicate unresolved confounding and health selection, for instance, alcohol consumption might reflect a better health as when becoming ill the use of alcohol is often advised against [52]. Factors such as patterns of consumption, differences in body composition, and rates of alcohol metabolism are may contribute to the found sex difference [51]. Lastly, our study did not suggest that physical activity is related to cognitive reserve, in contrast to previous research that found that physical activity reduced the risk of dementia [20, 21].
Physical health determinants
Previous studies have suggested that mid-life hypertension is an important risk factor for on Alzheimer’s disease and dementia [48]. Possibly, our study did not find an association of cognitive reserve with hypertension because we measured hypertension in a slightly older population. Diabetes mellitus was associated with a lower cognitive reserve, but only in women. Previous studies have also identified diabetes mellitus to be associated with an increased risk dementia and cognitive decline [48, 53]. Factors which might play a role include higher A1C levels, hypoglycemic episodes, vascular disease and risk factors, insulin resistance, inflammation, and depression [54]. It was also suggested that adverse consequences of diabetes on vascular dementia risk are stronger in women than in men [55], potentially this is also the case for cognitive reserve. Exposure to endogenous estradiol in women may contribute to this difference [55]. History of cancer was also associated with cognitive reserve in women. Chemotherapy is suggested to be the cause of cognitive problems in cancer patients, but more recent studies have suggested that cancer patients may already have altered brain structures before chemotherapy [56]. The sex difference we found may be explained by the nature and different treatment strategies (e.g., breast cancer versus prostate cancer).
Psychosocial health determinants
Although not previously linked to cognitive reserve, depression is previously identified as a preventable risk factor for dementia and associated with cognitive impairment [48]. Our findings suggest that depressive symptoms are also associated with cognitive reserve in women, although causality remains to be determined. Explanatory biological factors could be differences in the endocrine and neurotransmitter systems, reactivity of the hypothalamic pituitary adrenal axis and structural brain changes [57]. We found no association between sleep quality and cognitive reserve in our study. Previous literature mainly found a positive association between sleep and incident dementia, but no associations are also reported [58].
Limitations and strengths
Our study has several limitations. First, our conceptualization of cognitive reserve comes with several limitations: there are only a few studies available who have used this conceptualization of cognitive reserve in longitudinal studies, the concept originated in highly educated people, and the model might lack as of yet unknown brain variables or unknown nonlinear associations and interactions [13]. Additionally, we used different cognitive tests than the Petkus et al. [13] to estimate cognitive reserve. Therefore, comparisons with other studies using SEM to estimate cognitive reserve may be challenging in part because different studies use different methods or variables within their SEM (e.g., different neurocognitive tests). However, these different SEMs to estimate cognitive reserve have been consistently related to the incidence of dementia [7], suggesting a robustness of the model and that this method may not be dependent on type of cognitive test. Nevertheless, replication of our results is needed, also because this study was cross-sectional and was a rather highly educated sample. Moreover, the residual method of neuropsychological tests is a psychological construct and might not be easy to apply in clinical practice. We aimed to contribute to the understanding and clinical use of this measurement of cognitive reserve by studying its determinants. Second, we were unable to investigate and adjust for other socially and cognitively stimulating factors, such as leisure activities and engagement in social activities. And lastly, as this is a cross-sectional study, causal relationships cannot be determined. Strengths of our study include the prospective data collection, making it less prone to selection and information bias, and the larger sample size which allowed us to include a wide range of possible determinants and confounders. Also, our study is based on the general population whereas most previous studies included participants with mild cognitive impairment or dementia.
CONCLUSION
Our study extends previous research on cognitive reserve by investigating how several determinants and sex differences play a role in this construct. In our study, depressive symptoms, current smoking, alcohol use and diabetes mellitus were associated with cognitive reserve. We found that for women, significantly more than for men, other sociodemographic, lifestyle, and physical determinants were associated with cognitive reserve. These determinants should be investigated causally, to determine whether they could be of use in developing future interventions.
ACKNOWLEDGMENTS
The Rotterdam Study is funded by Erasmus Medical Center and Erasmus University, Rotterdam, Netherlands Organization for the Health Research and Development (ZonMw), the Research Institute for Diseases in the Elderly (RIDE), the Ministry of Education, Culture and Science, the Ministry for Health, Welfare and Sports, the European Commission (DG XII), and the Municipality of Rotterdam. This study was partly performed as part of the Netherlands Consortium of Dementia Cohorts (NCDC), which receives funding in the context of Deltaplan Dementie from ZonMW Memorabel (projectnr 73305095005) and Alzheimer Nederland. The study received further funding by the EU Joint Programme - Neurodegenerative Diseases (JPND) in the HeSoCare-call for the project Social Health and Reserve in the Dementia patient journey (SHARED) (HESOCARE-329-109) funded through the Deltaplan Dementia by ZonMW (number 733051082) and Alzheimer Nederland. MAI received funding from the European Union’s Horizon 2020 research and innovation program (678543, ORACLE). The authors are grateful to the study participants, the staff from the Rotterdam Study and the participating general practitioners and pharmacists. The funding sources had no role in the design, analyses, interpretation of the data, or decision to submit results of this study.
Authors’ disclosures available online (https://www.j-alz.com/manuscript-disclosures/21-5122r1).
SUPPLEMENTARY MATERIAL
[1] The supplementary material is available in the electronic version of this article: https://dx.doi.org/10.3233/JAD-215122.
REFERENCES
[1] | Kanasi E , Ayilavarapu S , Jones J ((2016) ) The aging population: Demographics and the biology of aging. Periodontol 2000 72: , 13–18. |
[2] | Niccoli T , Partridge L ((2012) ) Ageing as a risk factor for disease. Curr Biol 22: , R741–752. |
[3] | Prince MJ , Wimo A , Guerchet MM , Ali GC , Wu Y-T , Prina M ((2015) ) World Alzheimer Report 2015. The Global Impact of Dementia: An analysis of prevalence, incidence, cost and trends. Alzheimer’s Disease International, London. |
[4] | Stern Y ((2012) ) Cognitive reserve in ageing and Alzheimer’s disease. Lancet Neurol 11: , 1006–1012. |
[5] | Stern Y , Arenaza-Urquijo EM , Bartrés-Faz D , Belleville S , Cantilon M , Chetelat G , Ewers M , Franzmeier N , Kempermann G , Kremen WS , Okonkwo O , Scarmeas N , Soldan A , Udeh-Momoh C , Valenzuela M , Vemuri P , Vuoksimaa E , the Reserve, Resilience and Protective Factors PIA Empirical Definitions and Conceptual Frameworks Workgroup ((2020) ) Whitepaper: Defining and investigating cognitivereserve, brain reserve, and brain maintenance. AlzheimersDement 16: , 1305–1311. |
[6] | Arenaza-Urquijo EM , Vemuri P ((2020) ) Improving the resistance and resilience framework for aging and dementia studies. Alzheimers Res Ther 12: , 41. |
[7] | Nelson ME , Jester DJ , Petkus AJ , Andel R ((2021) ) Cognitive reserve, Alzheimer’s neuropathology, and risk of dementia: A systematic review and meta-analysis. Neuropsychol Rev 31: , 233–250. |
[8] | Katzman R , Terry R , DeTeresa R , Brown T , Davies P , Fuld P , Renbing X , Peck A ((1988) ) Clinical, pathological, and neurochemical changes in dementia: A subgroup with preserved mental status and numerous neocortical plaques. Ann Neurol 23: , 138–144. |
[9] | Harrison SL , Sajjad A , Bramer WM , Ikram MA , Tiemeier H , Stephan BC ((2015) ) Exploring strategies to operationalize cognitive reserve: A systematic review of reviews. J Clin Exp Neuropsychol 37: , 253–264. |
[10] | Jokinen H , Melkas S , Madureira S , Verdelho A , Ferro JM , Fazekas F , Schmidt R , Scheltens P , Barkhof F , Wardlaw JM , Inzitari D , Pantoni L , Erkinjuntti T ((2016) ) Cognitive reserve moderates long-term cognitive and functional outcome in cerebral small vessel disease. J Neurol Neurosurg Psychiatry 87: , 1296–1302. |
[11] | van Hek M , Kraaykamp G , Wolbers MHJ ((2016) ) Comparing the gender gap in educational attainment: The impact of emancipatory contexts in 33 cohorts across 33 countries. Educ Res Eval 22: , 260–282. |
[12] | Reed BR , Mungas D , Farias ST , Harvey D , Beckett L , Widaman K , Hinton L , DeCarli C ((2010) ) Measuring cognitive reserve based on the decomposition of episodic memory variance. Brain 133: , 2196–2209. |
[13] | Petkus AJ , Resnick SM , Rapp SR , Espeland MA , Gatz M , Widaman KF , Wang X , Younan D , Casanova R , Chui H , Barnard RT , Gaussoin S , Goveas JS , Hayden KM , Henderson VW , Sachs BC , Saldana S , Shadyab AH , Shumaker SA , Chen JC ((2019) ) General and domain-specific cognitive reserve, mild cognitive impairment, and dementia risk in older women. Alzheimers Dement (N Y) 5: , 118–128. |
[14] | Reed BR , Dowling M , Tomaszewski Farias S , Sonnen J , Strauss M , Schneider JA , Bennett DA , Mungas D ((2011) ) Cognitive activities during adulthood are more important than education in building reserve. J Int Neuropsychol Soc 17: , 615–624. |
[15] | Zahodne LB , Manly JJ , Brickman AM , Siedlecki KL , Decarli C , Stern Y ((2013) ) Quantifying cognitive reserve in older adults by decomposing episodic memory variance: Replication and extension. J Int Neuropsychol Soc 19: , 854–862. |
[16] | Lamballais S , Zijlmans JL , Vernooij MW , Ikram MK , Luik AI , Ikram MA ((2020) ) The risk of dementia in relation to cognitive and brain reserve. J Alzheimers Dis 77: , 607–618. |
[17] | Stern Y , Gurland B , Tatemichi TK , Tang MX , Wilder D , Mayeux R ((1994) ) Influence of education and occupation on the incidence of Alzheimer’s disease. JAMA 271: , 1004–1010. |
[18] | Hakansson K , Rovio S , Helkala EL , Vilska AR , Winblad B , Soininen H , Nissinen A , Mohammed AH , Kivipelto M ((2009) ) Association between mid-life marital status and cognitive function in later life: Population based cohort study. BMJ 339: , b2462. |
[19] | Bennett DA , Schneider JA , Tang Y , Arnold SE , Wilson RS ((2006) ) The effect of social networks on the relation between Alzheimer’s disease pathology and level of cognitive function in old people: A longitudinal cohort study. Lancet Neurol 5: , 406–412. |
[20] | Bowen ME ((2012) ) A prospective examination of the relationship between physical activity and dementia risk in later life. Am J Health Promot 26: , 333–340. |
[21] | Hamer M , Chida Y ((2009) ) Physical activity and risk of neurodegenerative disease: A systematic review of prospective evidence. Psychol Med 39: , 3–11. |
[22] | Ikram MA , Brusselle G , Ghanbari M , Goedegebure A , Ikram MK , Kavousi M , Kieboom BCT , Klaver CCW , de Knegt RJ , Luik AI , Nijsten TEC , Peeters RP , van Rooij FJA , Stricker BH , Uitterlinden AG , Vernooij MW , Voortman T ((2020) ) Objectives, design and main findings until 2020 from the Rotterdam Study. Eur J Epidemiol 35: , 483–517. |
[23] | Esiri MM , Chance SA ((2012) ) Cognitive reserve, cortical plasticity and resistance to Alzheimer’s disease. Alzheimers Res Ther 4: , 7. |
[24] | Snyder HM , Asthana S , Bain L , Brinton R , Craft S , Dubal DB , Espeland MA , Gatz M , Mielke MM , Raber J , Rapp PR , Yaffe K , Carrillo MC ((2016) ) Sex biology contributions to vulnerability to Alzheimer’s disease: A think tank convened by the Women’s Alzheimer’s Research Initiative. Alzheimers Dement 12: , 1186–1196. |
[25] | Ikram MA , van der Lugt A , Niessen WJ , Koudstaal PJ , Krestin GP , Hofman A , Bos D , Vernooij MW ((2015) ) The Rotterdam Scan Study: Design update 2016 and main findings. Eur J Epidemiol 30: , 1299–1315. |
[26] | Vliegenthart R , Geleijnse JM , Hofman A , Meijer WT , van Rooijs FJ , Grobbee DE , Witteman JC ((2002) ) Alcohol consumption and risk of peripheral arterial disease: The Rotterdam study. Am J Epidemiol 155: , 332–338. |
[27] | Voortman T , Kiefte-de Jong JC , Ikram MA , Stricker BH , van Rooij FJA , Lahousse L , Tiemeier H , Brusselle GG , Franco OH , Schoufour JD ((2017) ) Adherence to the 2015 Dutch dietary guidelines and risk of non-communicable diseases and mortality in the Rotterdam Study. Eur J Epidemiol 32: , 993–1005. |
[28] | Freedman LS , Schatzkin A , Midthune D , Kipnis V ((2011) ) Dealing with dietary measurement error in nutritional cohort studies. J Natl Cancer Inst 103: , 1086–1092. |
[29] | Stel VS , Smit JH , Pluijm SM , Visser M , Deeg DJ , Lips P ((2004) ) Comparison of the LASA Physical Activity Questionnaire with a 7-day diary and pedometer. J Clin Epidemiol 57: , 252–258. |
[30] | WHO Study Group on Diabetes Mellitus & World Health Organization. (1985). Diabetes mellitus : report of a WHO study group [meeting held in Geneva from 11 to 16 February 1985]. World Health Organization. https://apps.who.int/iris/handle/10665/39592 |
[31] | Leening MJ , Kavousi M , Heeringa J , van Rooij FJ , Verkroost-van Heemst J , Deckers JW , Mattace-Raso FU , Ziere G , Hofman A , Stricker BH , Witteman JC ((2012) ) Methods of data collection and definitions of cardiac outcomes in the Rotterdam Study. Eur J Epidemiol 27: , 173–185. |
[32] | Lahousse L , van den Bouwhuijsen QJ , Loth DW , Joos GF , Hofman A , Witteman JC , van der Lugt A , Brusselle GG , Stricker BH ((2013) ) Chronic obstructive pulmonary disease and lipid core carotid artery plaques in the elderly: The Rotterdam Study. Am J Respir Crit Care Med 187: , 58–64. |
[33] | Radloff L ((1977) ) The CES-D Scale: A self-report depression scale for research in general population. Appl Psychol Measurement 1: , 385. |
[34] | Beekman AT , Deeg DJ , Van Limbeek J , Braam AW , De Vries MZ , Van Tilburg W ((1997) ) Criterion validity of the Center for Epidemiologic Studies Depression scale (CES-D): Results from a community-based sample of older subjects in The Netherlands. Psychol Med 27: , 231–235. |
[35] | Buysse DJ , Reynolds CF , 3rd, Monk TH , Berman SR , Kupfer DJ ((1989) ) The Pittsburgh Sleep Quality Index: A new instrument for psychiatric practice and research. Psychiatry Res 28: , 193–213. |
[36] | EuroQol G ((1990) ) EuroQol–a new facility for the measurement of health-related quality of life. Health Policy 16: , 199–208. |
[37] | Lamers LM , McDonnell J , Stalmeier PF , Krabbe PF , Busschbach JJ ((2006) ) The Dutch tariff: Results and arguments for an effective design for national EQ-5D valuation studies. Health Econ 15: , 1121–1132. |
[38] | Bleecker ML , Bolla-Wilson K , Agnew J , Meyers DA ((1988) ) Age-related sex differences in verbal memory. J Clin Psychol 44: , 403–411. |
[39] | Houx PJ , Jolles J , Vreeling FW ((1993) ) Stroop interference: Aging effects assessed with the Stroop Color-Word Test. Exp Aging Res 19: , 209–224. |
[40] | Welsh KA , Butters N , Mohs RC , Beekly D , Edland S , Fillenbaum G , Heyman A ((1994) ) The Consortium to Establish a Registry for Alzheimer’s Disease (CERAD). Part V. A normative study of the neuropsychological battery. Neurology 44: , 609–614. |
[41] | van der Elst W , van Boxtel MP , van Breukelen GJ , Jolles J ((2006) ) The Letter Digit Substitution Test: Normative data for 1,858 healthy participants aged 24-81 from the Maastricht Aging Study (MAAS): Influence of age, education, and sex. J Clin Exp Neuropsychol 28: , 998–1009. |
[42] | Tiffin J , Asher EJ ((1948) ) The Purdue pegboard; norms and studies of reliability and validity. J Appl Psychol 32: , 234–247. |
[43] | Hoogendam YY , Hofman A , van der Geest JN , van der Lugt A , Ikram MA ((2014) ) Patterns of cognitive function in aging: The Rotterdam Study. Eur J Epidemiol 29: , 133–140. |
[44] | Vrooman HA , Cocosco CA , van der Lijn F , Stokking R , Ikram MA , Vernooij MW , Breteler MM , Niessen WJ ((2007) ) Multi-spectral brain tissue segmentation using automatically trained k-Nearest-Neighbor classification. Neuroimage 37: , 71–81. |
[45] | Hu Lt , Bentler PM ((1999) ) Cutoff criteria for fit indexes in covariance structure analysis: Conventional criteria versus new alternatives. Struct Equ Modeling 6: , 1–55. |
[46] | Benjamini Y , Hochberg Y ((1995) ) Controlling the false discovery rate: A practical and powerful approach to multiple testing. J R Stat Soc B Methodol 57: , 289–300. |
[47] | Campos MW , Serebrisky D , Castaldelli-Maia JM ((2016) ) Smoking and cognition. Curr Drug Abuse Rev 9: , 76–79. |
[48] | Barnes DE , Yaffe K ((2011) ) The projected effect of risk factor reduction on Alzheimer’s disease prevalence. Lancet Neurol 10: , 819–828. |
[49] | Sabia S , Elbaz A , Dugravot A , Head J , Shipley M , Hagger-Johnson G , Kivimaki M , Singh-Manoux A ((2012) ) Impact of smoking on cognitive decline in early old age: The Whitehall II cohort study. Arch Gen Psychiatry 69: , 627–635. |
[50] | Jenni I , Natali J , Edwin CKT , Eija L ((2015) ) Alcohol consumption, dementia and cognitive decline: An overview of systematic reviews. Curr Clin Pharmacol 10: , 204–212. |
[51] | Wardzala C , Murchison C , Loftis JM , Schenning KJ , Mattek N , Woltjer R , Kaye J , Quinn JF , Wilhelm CJ ((2018) ) Sex differences in the association of alcohol with cognitive decline and brain pathology in a cohort of octogenarians. Psychopharmacology (Berl) 235: , 761–770. |
[52] | Lea W ((2016) ) Alcohol guidelines review-report from the guidelines development group to the UK Chief Medical Officers. Department of Health, London. |
[53] | Hassing LB , Grant MD , Hofer SM , Pedersen NL , Nilsson SE , Berg S , McClearn G , Johansson B ((2004) ) Type 2 diabetes mellitus contributes to cognitive decline in old age: A longitudinal population-based study. J Int Neuropsychol Soc 10: , 599–607. |
[54] | Biessels GJ , Despa F ((2018) ) Cognitive decline and dementia in diabetes mellitus: Mechanisms and clinical implications. Nat Rev Endocrinol 14: , 591–604. |
[55] | Chatterjee S , Peters SA , Woodward M , Mejia Arango S , Batty GD , Beckett N , Beiser A , Borenstein AR , Crane PK , Haan M , Hassing LB , Hayden KM , Kiyohara Y , Larson EB , Li CY , Ninomiya T , Ohara T , Peters R , Russ TC , Seshadri S , Strand BH , Walker R , Xu W , Huxley RR ((2016) ) Type 2 diabetes as a risk factor for dementia in women compared with men: A pooled analysis of 2.3 million people comprising more than 100,000 cases of dementia. Diabetes Care 39: , 300–307. |
[56] | van der Willik KD , Schagen SB , Ikram MA ((2018) ) Cancer and dementia: Two sides of the same coin? Eur J Clin Invest 48: , e13019. |
[57] | Sundermann EE , Katz MJ , Lipton RB ((2017) ) Sex differences in the relationship between depressive symptoms and risk of amnestic mild cognitive impairment. Am J Geriatr Psychiatry 25: , 13–22. |
[58] | Lysen TS , Wolters FJ , Luik AI , Ikram MK , Tiemeier H , Ikram MA ((2018) ) Subjective sleep quality is not associated with incident dementia: The Rotterdam Study. J Alzheimers Dis 64: , 239–247. |


