
A Bioinformatics Approach Toward Unravelling the Synaptic Molecular Crosstalk Between Alzheimer’s Disease and Diabetes
Abstract
Background:
Increasing evidence links impaired brain insulin signaling and insulin resistance to the development of Alzheimer’s disease (AD).
Objective:
This evidence prompted a search for molecular players common to AD and diabetes mellitus (DM).
Methods:
The work incorporated studies based on a primary care-based cohort (pcb-Cohort) and a bioinformatics analysis to identify central nodes, that are key players in AD and insulin signaling (IS) pathways. The interactome for each of these key proteins was retrieved and network maps were developed for AD and IS. Synaptic enrichment was performed to reveal synaptic common hubs.
Results:
Cohort analysis showed that individuals with DM exhibited a correlation with poor performance in the Mini-Mental State Examination (MMSE) cognitive test. Additionally, APOE ɛ2 allele carriers appear to potentially be relatively more protected against both DM and cognitive deficits. Ten clusters were identified in this network and 32 key synaptic proteins were common to AD and IS. Given the relevance of signaling pathways, another network was constructed focusing on protein kinases and protein phosphatases, and the top 6 kinase nodes (LRRK2, GSK3B, AKT1, EGFR, MAPK1, and FYN) were further analyzed.
Conclusion:
This allowed the elaboration of signaling cascades directly impacting AβPP and tau, whereby distinct signaling pathway play a major role and strengthen an AD-IS link at a molecular level.
INTRODUCTION
Reduced glucose levels and lower cerebral meta-bolic rates in the brains of demented individuals were reported several years ago [1, 2]. Presently it is clear that many pathologies exhibit diminished brain glucose metabolism, among them Alzheimer’s disease (AD), Parkinson’s disease, multiple sclerosis, Huntington’s disease, Duchenne muscular dystrophy, some forms of autism, Down’s syndrome and type I and type II diabetes mellitus (T2DM). In turn, it has been reported that the risk of developing AD is 50–60% greater in individuals with T2DM [3]. Consistently, rats intracerebroventricularly injected with streptozotocin (which has preferred toxicity towards pancreatic β cells) exhibit decreased glucose/energy brain metabolism and learning and memory deficits [4].
AD, accounting for 60–80% of dementia cases, is also increasingly viewed as a metabolic disorder, exhibiting impaired brain responses to glucose and insulin, increased insulin and insulin-like growth factor (IGF) resistance, and even exhibiting insulin depletion. Downstream AD hallmarks include neuronal loss, decreased synaptic plasticity, dystrophic neuritis, anomalous protein phosphorylation, ubiquitination and accumulation of the toxic Aβ peptide as senile plaques and aggregation of hyperphosphorylated tau as neurofibrillary tangles (NFTs) [5].
The AD-T2DM link is strengthen given that chronic deficits in insulin signaling/resistance appear to mediate AD related pathogenesis [6]. Hypogly-cemia reduces glucose metabolism rate in the brain, a defining AD feature. Alternatively, glucose brain concentration may be adequate, but not that of insulin [7]. Of note, acute insulin administration improves memory and cognition.
Amyloid-β protein precursor (AβPP) is processed via distinct cellular pathways; cleavage by alpha and gamma secretases produces non-toxic peptides, or by BACE1 and gamma secretases to produce the toxic and longer Aβ species (the longer species more readily aggregate into senile plaques). Work from our group has shown that AβPP phosphorylation targets AβPP to distinct processing pathways, affecting protein trafficking and the levels of Aβ produced [8–11]. Noticeably, insulin can promote AβPP trafficking from the trans-Golgi network to the plasma membrane [12], and insulin action on AβPP is mediated via a receptor signal-related tyrosine kinase/mitogen-activated protein kinase (MAPK/ERK) pathway [13]. Thus, impaired insulin signaling will disrupt AβPP processing, Aβ production, and its clearance in the brain [14]. Studies using N2a neuroblastoma cells transfected with human APP695 (the brain specific 695 isoform), showed that insulin increases extracellular Aβ levels by promoting its secretion and inhibiting its degradation via the insulin-degrading enzyme (IDE) [15].
IDE has a very high insulin affinity and in conditions of high insulin, Aβ degradation is inhibited [16]. With aging, IDE production declines as the levels of substrates increase. Furthermore, Aβ accumulation reduces insulin binding affinity to its receptor, compromising insulin signaling and augmenting the effects of insulin resistance [17, 18]. In essence, Aβ desensitizes and reduces the surface expression of insulin receptors.
In terms of insulin signaling, many proteins are phosphorylated and de-phosphorylated in the cascade of events when insulin binds to its receptor. Insulin and insulin receptor (IR) binding result in a conformational change that induces the autophosphorylation of tyrosine residues in the receptor [19]. The insulin receptor substrate family (IRS) recognizes these residues, which are, in turn, recognized by the phosphoinositide 3-kinase (PI3K). PI3K can phosphorylate phosphatidylinositol 4,5-bis-phosphate (PIP2) into phosphatidylinositol (3,4,5)-trisphosphate (PIP3) and in the presence of phosphoinositide-dependent kinase-1 leads to the phosphorylation and activation of protein kinase B (PKB, also known as AKT). The activation of AKT is necessary for the regulation of many processes, among them glucose uptake, inhibition of glycogen synthase kinase 3-α and β (GSK3α and GSK3β), resulting in glycogen synthesis and activation of the mammalian target of rapamycin, which promotes protein synthesis [20]. Moreover, the binding of insulin to the IR triggers another pathway, activating the growth factor receptor-bound protein 2. The latter is an AβPP binding protein but also associates with the guanine nucleotide exchange factor son-of sevenless leading to the activation of the mitogen-activated protein kinases (MAPK) pathway [21]. The activation of the MAPK pathway promotes cell division and differentiation.
Only in the last two decades has the brain started to be considered as an insulin-sensitive organ. This was achieved given the detection of insulin and IR in the brain. Its origin has been explained as deriving from peripheral or central sources, or even both. However, the discovery of insulin mRNA in the brain proved that this hormone could be produced in the brain [22, 23], although insulin can cross the blood-brain barrier using a receptor mediated transport system [22–24]. Independent of the source of brain insulin, recent studies demonstrated that insulin regulates brain glucose and lipid metabolism, but it also regulates neuronal activities and development, playing an important role in learning and memory [23].
Given the above-mentioned evidence, it is not surprising that individuals with T2DM have a higher risk of developing AD, but the cellular mechanisms and bridging points remain unknown. Thus, it is fundamental to unravel the underlying cellular signaling molecules and cascades that can contribute to scientific advances from a molecular level but ultimately, to patient management and well-being. These are aspects addressed in this manuscript, and as a first step it was important to demonstrate a link at the clinical level between AD and T2DM, to subsequently identify potential molecular markers for future diagnostic and therapeutic strategies.
MATERIALS AND METHODS
Given the significant links between AD and T2DM documented in the literature, it became imperative to determine if this link was evident in a regional cohort studied by our group, whereby individuals were recruited from primary health care centers, resulting in a primary health care-based cohort (pcb-Cohort).
Cohort analysis
The pcb-Cohort is a cross-sectional population-based survey in the Aveiro district in Portugal. Volunteers were admitted, independent of complai-nts or deficits in any cognitive domain, but a mandatory inclusion criterion to be 50 years or older was implemented. Individuals undergoing oncological treatment, diagnosed with psychiatric disorders (excluding depression), aphasia, or unable to answer the questions in the structured interview were excluded, although exclusion criteria were kept to an absolute minimum. Participants underwent a semi-structured questionnaire addressing soc-iodemographic characteristics, personal and family history. Subsequently, questionnaires typically associated with diagnosing dementia were implemented and information regarding clinical history and medication usage taken was collected from clinical records and registered.
Several cognitive evaluations and dementia screening tests were applied [25, 26], among them the Clinical Dementia Rating (CDR), Mini-Mental State Examination (MMSE), Geriatric Depression Scale (GDS), Katz of Activities of Daily Living (ADL), and Instrumental Activities of Daily Living (IADL). Participants were also scored for comorbidities, including diabetes.
The CDR applied a 0 to 3 score, where scores below 0.5 were considered healthy, while over 0.5 were considered mild, moderate, or severe dementia cases. The MMSE test was scored from 0 to 30 using a cut-off of 27. All below or equal to 27 were considered to have cognitive deficits. The GDS test consists of 15 questions used to assess the depression state of patients and categorize as depressed or not depressed. Both ADL and IADL were used to determine the independence of a patient with respect to several basic tasks, categorizing them as dependent or independent.
Statistical analysis
The database was organized and analyzed using IBM SPSS Statistics version 26 (IBM Corporation, Armonk, NY, USA). A two-sided statistical test was carried out, and differences were significant if p < 0.05. Categorical variables were assessed through examination of frequencies, while continuous variables were assessed through generation of descriptive (means, standard deviations) methods to investigate the differences in the group (Diabetic or not Diabetic groups). Bivariate analysis was performed: Group comparisons for demographic, clinical, and global cognitive variables were performed with independent samples t tests or Chi square (χ2) tests, as appropriate.
Network construction for Alzheimer’s disease and insulin signaling pathways
To test molecular overlaps, networks were built based on protein-protein interactions reported in the available literature and from data platforms, relevant to AD and insulin signaling (IS) pathways. The first step was to determine the key proteins for both AD and IS (Table 1). For this purpose, KEGG pathways for AD and IS were used to extract all proteins involved in each of these pathways. All key proteins were analyzed using the respective human gene Uniprot code and submitted to IntAct on 9 July 2020 and the interactome identified in each case. Although protein:protein interactions are obviously at the protein level, the IntAct output refers to the gene, hence in the tables and figures below the term for the gene is used. The interactome for each of the genes for both pathways were downloaded and stored for subsequent analyses. The IntAct database was used, given that these interactions have been curated.
Table 1
Bivariate analysis as a function of Diabetes in the pcb-Cohort. Statistically significant values appear in bold; Values close to significance appear in underline; percentages appear as a fraction for each of the groups under study within each column
| Characteristics | N (%) | Diabetes Mellitus | Statistical test | p | |
| NO = 453 | YES = 115 | ||||
| Demographic characteristics | |||||
| Age | – | 67.6±9.5 | 67.9±8.13 | t = –0.356 | 0.722 |
| Gender | |||||
| Female | 405 (71.3%) | 326 (72%) | 79 (68.7%) | χ2 = 0.479 | 0.489 |
| Male | 163 (28.7%) | 127 (28%) | 36 (31.3%) | ||
| Years of literacy | – | 5.3±3.8 | 4.5±3.1 | t = 2.463 | 0.015 |
| Clinical characteristics | |||||
| Number of diseases | – | 2.6±1.5 | 4.5±1.5 | t = –12.305 | < 0.001 |
| Hypertension | 351 (61.8%) | 254 (56.1%) | 97 (84.3%) | χ2 = 31.063 | < 0.001 |
| Dyslipidemia | 333 (58.6%) | 250 (55.2%) | 83 (72.2%) | χ2 = 10.910 | 0.001 |
| Osteoarticular disease | 305 (53.7%) | 238 (52.5%) | 67 (58.3%) | χ2 = 1.210 | 0.272 |
| Cardiovascular disease | 302 (53.2%) | 221 (48.8%) | 81 (70.4%) | χ2 = 17.263 | < 0.001 |
| Gastrointestinal disease | 151 (26.6%) | 112 (24.7%) | 39 (33.9%) | χ2 = 3.968 | 0.046 |
| Genitourinary disease | 122 (21.5%) | 94 (20.8%) | 28 (24.3%) | χ2 = 0.704 | 0.402 |
| Respiratory disease | 93 (16.4%) | 67 (14.8%) | 26 (22.6%) | χ2 = 4.095 | 0.043 |
| Neurodegenerative disease | 22 (3.9%) | 19 (4.2%) | 3 (2.6%) | χ2 = 0.619 | 0.431 |
| Cognitive evaluation | |||||
| CDR≥0.5 | 267 (47%) | 218 (48.1%) | 49 (42.6%) | χ2 = 1.120 | 0.29 |
| MMSE | 132 (23.2%) | 98 (21.6%) | 34 (29.6%) | χ2 = 3.325 | 0.072 |
| GDS | 174 (30.6%) | 137 (30.2%) | 37 (32.2%) | χ2 = 0.161 | 0.688 |
| KATZ | 31 (5.5%) | 25 (5.5%) | 6 (5.2%) | χ2 = 0.02 | 0.899 |
| IADL | 176 (31%) | 137 (30.2%) | 39 (33.9%) | χ2 = 0.578 | 0.477 |
| NO = 408 | YES = 100 | ||||
| APOE genotyping | |||||
| APOE ɛ2 | 38 (7.5%) | 35 (8.6%) | 3 (3%) | χ2 = 3.611 | 0.057 |
| APOE ɛ3 | 494 (97.2%) | 396 (97.1%) | 98 (98.0%) | χ2 = 0.265 | 0.606 |
| APOE ɛ4 | 96 (18.9%) | 79 (19.4%) | 17 (17.0%) | χ2 = 0.293 | 0.589 |
A network map for each protein interactome (although the data extracted refers the gene name) was then constructed using Cytoscape 3.7.2 [27]. Filters were applied to ensure all proteins used were human, followed by a merge to create the AD and IS interactome networks. Furthermore, the intersection between these two networks was performed to identify the coincident protein in both pathways, thus representing common hubs.
Synapse enriched network construction and analysis
It has been well established that AD is a neuronal disorder and that prior to senile plaques and NFTs formation, synaptic signaling anomalies occur. Thus, the synaptic interactome was constructed by searching with the GeneOntology term for “synapse” (GO:0045202) on the IntAct database. The synaptic proteome was thus constructed.
The coincident proteins/genes list from the intersection of AD and IS networks was subsequently analyzed against the synaptic interactome to build the AD/IS coincident proteins interactome at the synapse. Furthermore, community cluster (gLay) from clusterMaker2 [28] was used to identify different communities within our data set followed by a betweenness centrality analysis. Genetic risk factors for AD were also analyzed in this network. A list of genetic risk factors for AD was crossed with our network and genes identified were marked in the resulting figure, as shown in the results.
The gene list was categorized according to the Gene Ontology (GO) annotation, obtained from the UniProt-SwissProt database. The GO terms were filtered according to the Generic GO Slim and categorization was carried out separately for “Cellular Component”, “Molecular Function”, and “Biological Process”. This analysis was performed through the use of a dedicated software framework (SysBioTK, available at: https://sysbiotk.sourceforge.io/ and code available at: https://sourceforge.net/p/sysbiotk/code/ci/Dev/tree/Examples/Synapse/) and approaches already described were employed [29]. To determine p-values, the background list was download from http://pantherdb.org.
Kinase and phosphatase enriched network construction and analysis
Following the construction of the synaptic AD/IS coincident proteins/genes, all known human kinases and phosphatases were extracted to build a kinase and phosphatase enriched network. For this purpose, a list of human kinases (KinHub, available at http://www.kinhub.org/) [31] and human phosphatases and their regulatory subunits (HuPho, available at http://hupho.uniroma2.it/) [32] were crossed with our gene list and extracted to build a new network (designated the AD/IS synaptic kinome and phosphatome; ADISsynKP network). Afterwards, a new betweenness centrality analysis was performed on the ADISsynKP network to identify the most important kinases and phosphatases. Furthermore, the tool kinector (available at http://www.kinector.ca/) was used to construct signaling pathways between the top 6 candidates with higher betweenness centrality values from the ADISsynKP network and two key AD proteins (AβPP and tau). Each signaling pathway was constructed with three levels of connectivity and displayed in Figs. 5 and 6.
Fig. 5
Signaling pathways towards AβPP phosphorylation. Graphical view of signaling pathways of the top 6 proteins with higher betweenness centrality values from Fig. 4 towards AβPP using the kinector tool. 1) LRRK2 signaling pathway towards AβPP. 2) GSK3B signaling pathway towards AβPP. 3) AKT1 signaling pathway towards AβPP. 4) EGFR signaling pathway towards AβPP. 5) ERK2 signaling pathway towards APP. 6) FYN signaling pathway towards AβPP.
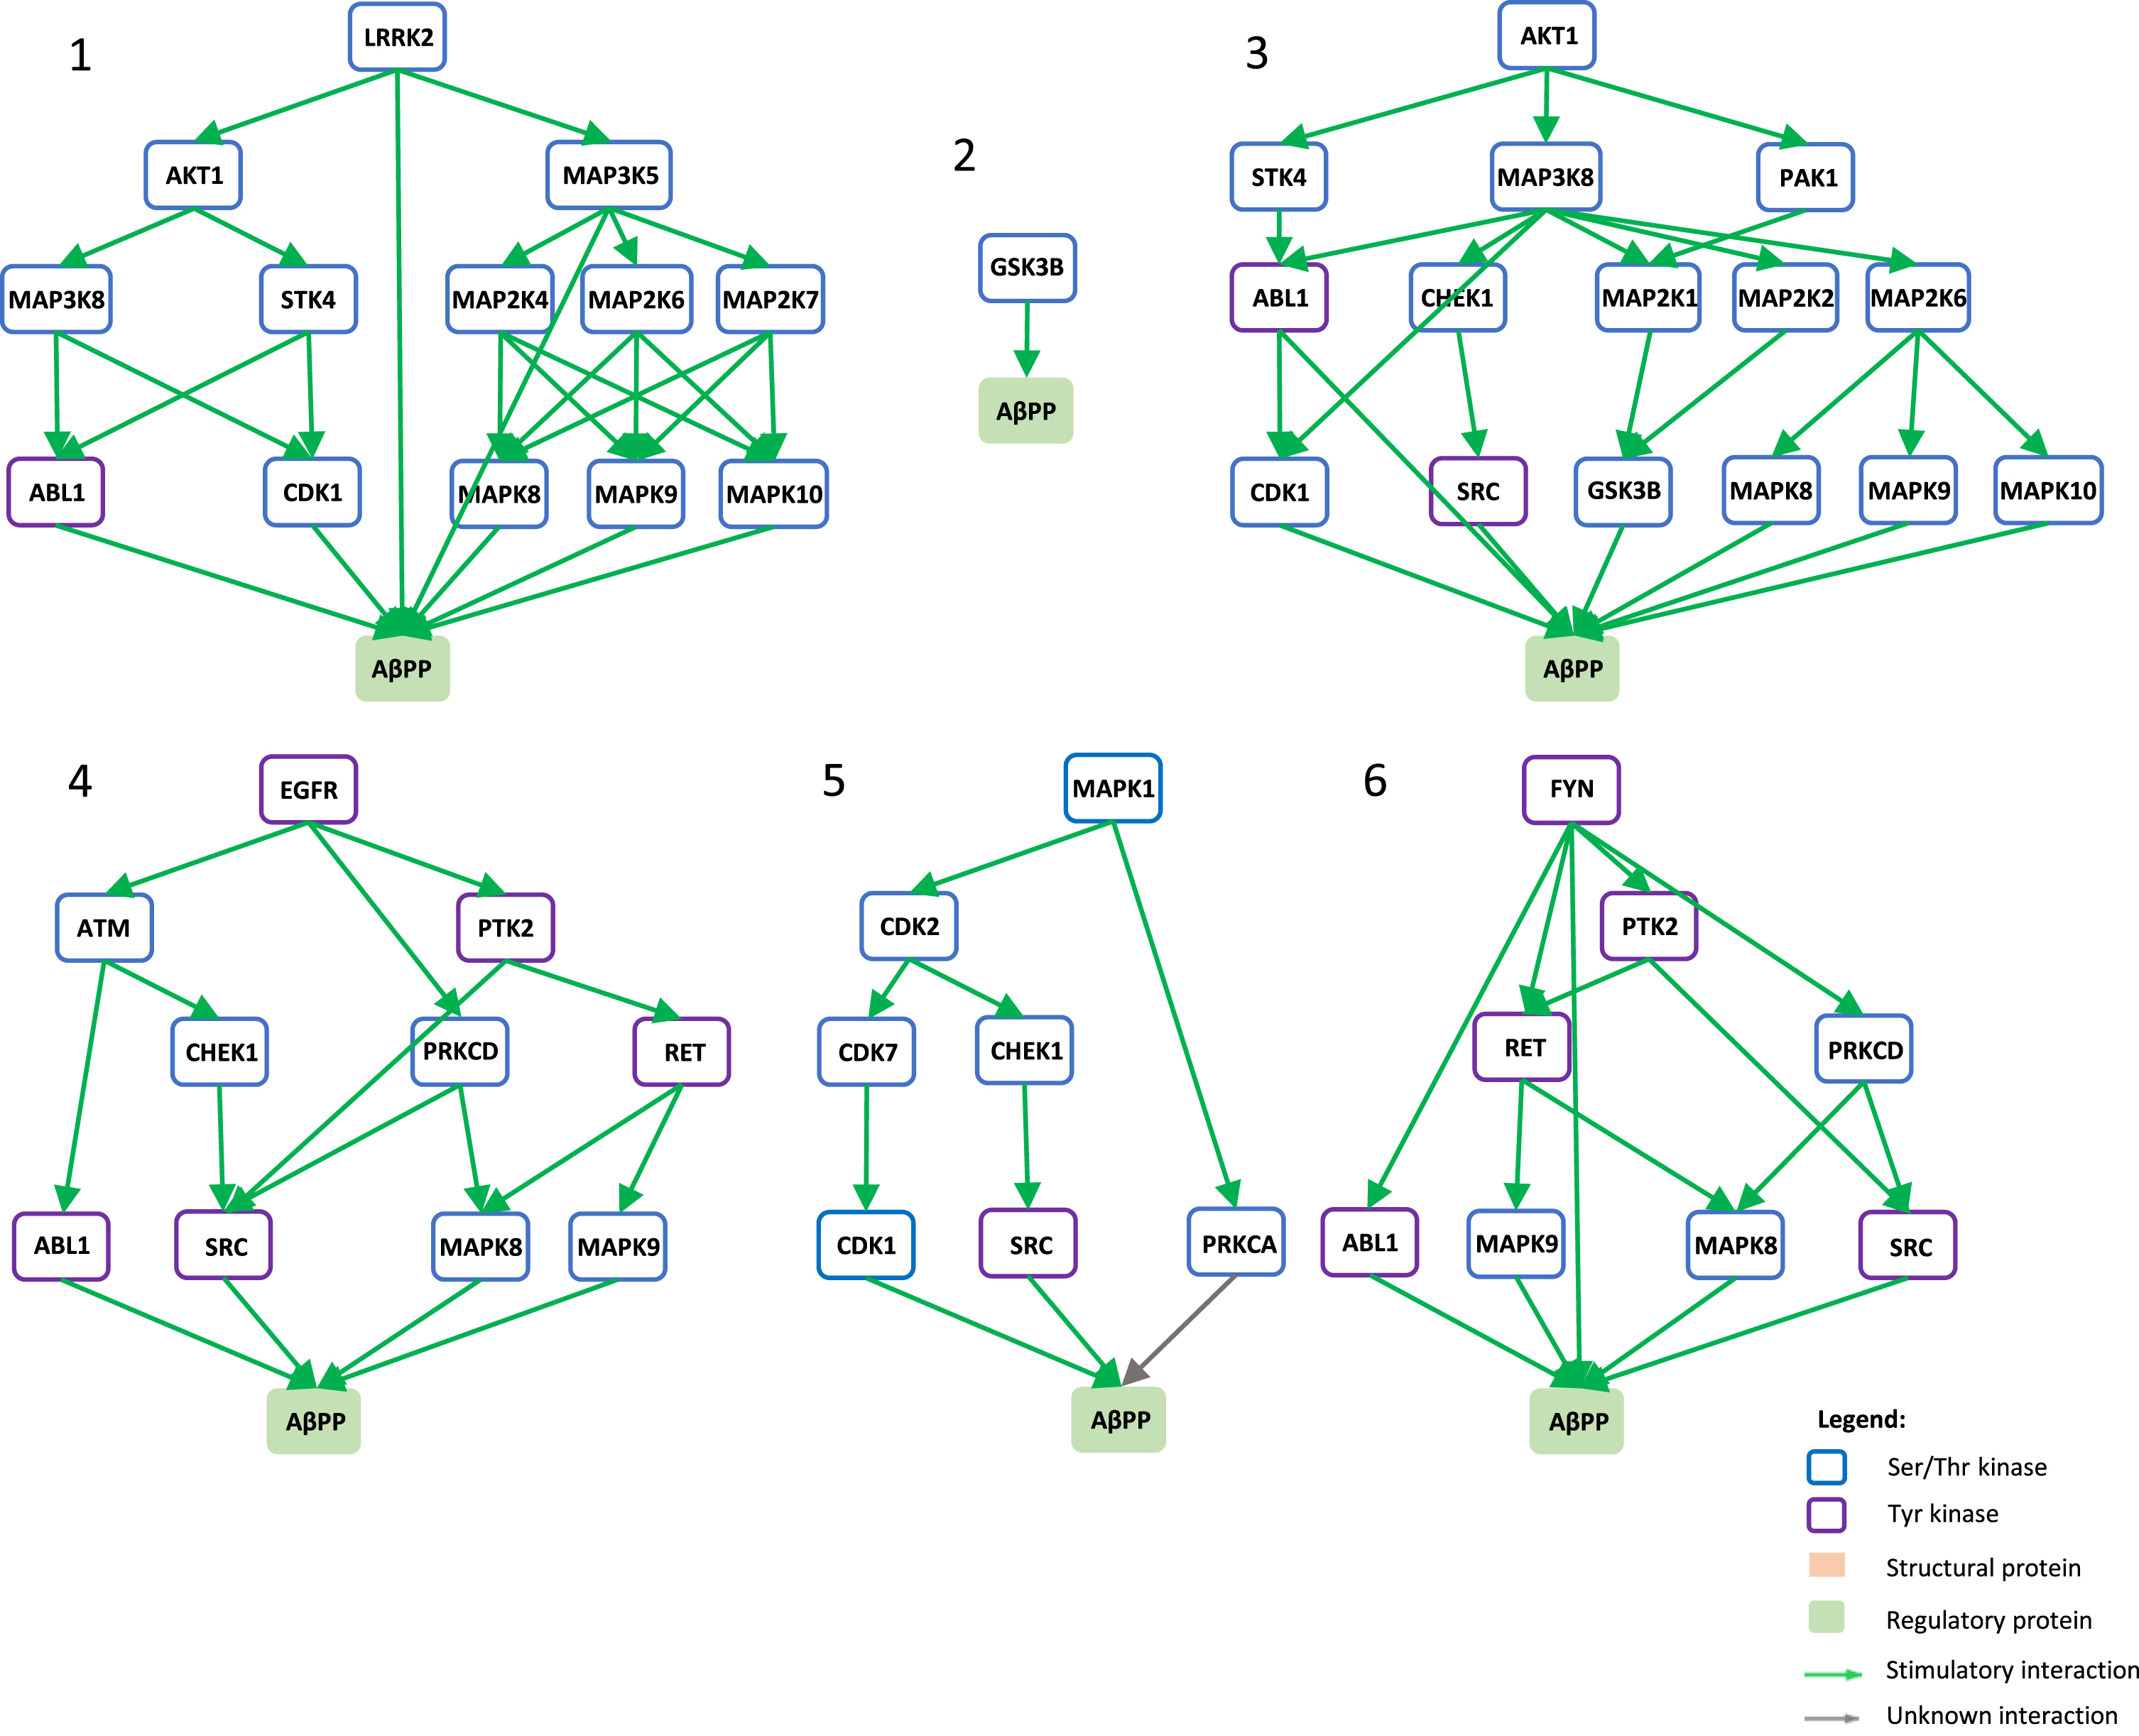
Fig. 6
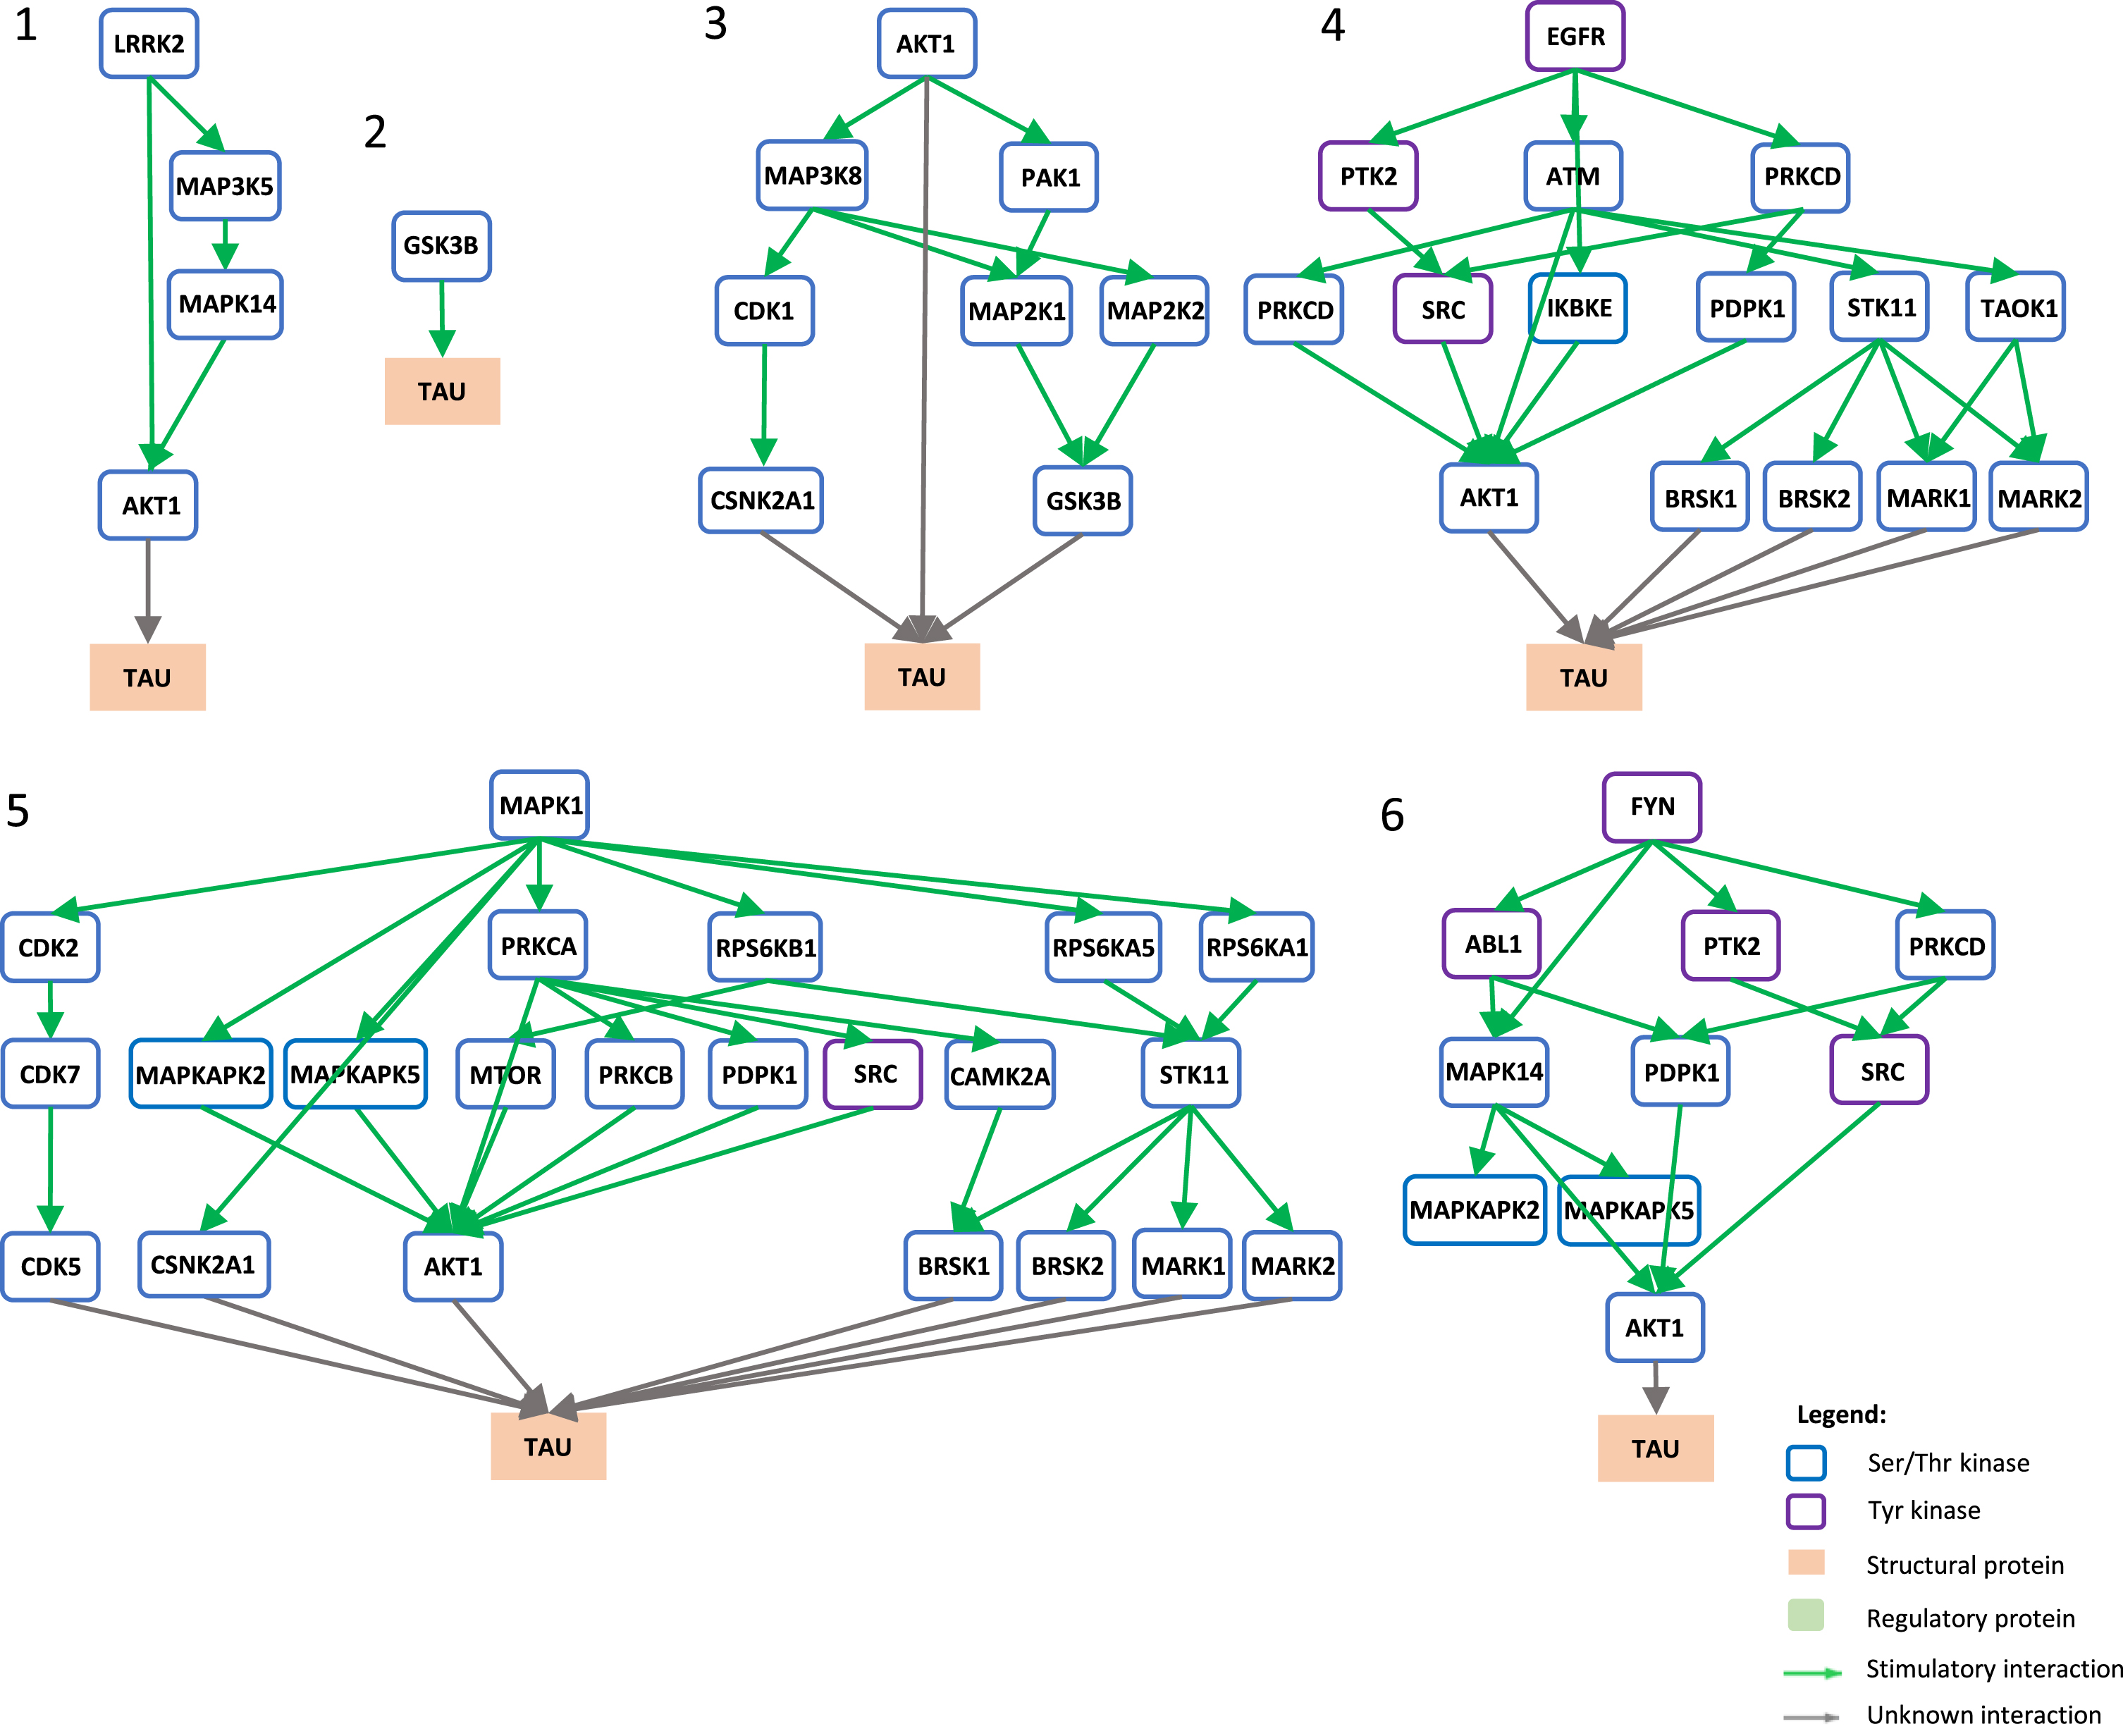
Signaling pathways towards tau phosphorylation. Graphical view of signaling pathways of the top 6 proteins with higher betweenness centrality values from Fig. 4 towards tau using the kinector tool. 1) LRRK2 signaling pathway towards tau. 2) GSK3B signaling pathway towards tau. 3) AKT1 signaling pathway towards tau. 4) EGFR signaling pathway towards tau. 5) ERK2 signaling pathway towards tau. 6) FYN signaling pathway towards tau.
RESULTS
Diabetes correlates with poor cognitive scores
The pcb-Cohort was evaluated, as explained in the Materials and Methods section with respect to sociodemographic characteristics, cognitive evaluations, and clinical data including the presence of comorbidities (Table 1 and Supplementary Table 1). Results are presented as a bivariate analysis as a function of diabetes mellitus (DM), which had been diagnosed for 115 participants in the pcb-Cohort (Table 1).
DM showed an association with years of literacy, whereby increased literacy appears to associate with a lower risk of developing this condition, as is the case for other pathologies. Also, characteristic of other pathologies, individuals with DM exhibit an increased number of comorbidities when compared to non-DM cases; 4.5 versus 2.6 other diseases (Table 1). In the cohort studied here, the greatest associations with DM and other comorbidities were evident for hypertension, dyslipidemia, cardiovascular disease, gastrointestinal disease, and respiratory disease. Of note in the pcb-Cohort, individuals with poor CDR scores also exhibited a high correlation with gastrointestinal disease and respiratory disease, as previously reported [25]. No correlation between DM and neuropathologies was evident, but this is perhaps due to the fact that neuropathologies were not subdivided and this is a very diverse group.
Several cognitive tests were applied to the pcb-Cohort, among them the MMSE which was scored from 0–30, using a cut-off at 27 [33]. Those equal to or below the cut-off were scored as having cognitive deficit, those above the cut-off as normal. An association tendency was obtained for DM and MMSE, although with no statistical significance (p = 0.072, Table 1), but no further associations were obtained with other cognitive tests. Additionally, APOE ɛ2 genotype (p = 0.057), in this cohort, is protective for DM.
Taken together, the data derived from the pcb-Cohort provides preliminary evidence linking poor cognitive scores to DM, validating the need to carry out further studies, as described below.
Synaptic AD and IS coincident network organized into clusters
To identify the potential molecular candidates and pathways linking cognitive deficits and in particular AD and DM, target study proteins were identified for each of the two pathologies. The KEGG pathway was used as a tool to identify the key proteins for AD and IS, resulting in 361 key proteins for AD and 136 key proteins for IS. The Homo sapiens Uniprot code for each of the studied proteins was retrieved (Supplementary Tables 1 and 2). Different databases (IntAct, String, and BioGRID) were tested but IntAct demonstrated to provide the most comprehensive and reliable/curated data, as it represent a merge of 11 different databases (such as IntAct, MINT, Uniprot, among others) and is a part of the International Molecular Exchange Consortium (IMEx) [34]. Thus, this database was used to recover the interactome for all key proteins.
The interactome for each protein was submitted to the Cytoscape platform 3.8.2, and the networks for both AD and IS constructed (Supplementary Figure 1A, B). The interactome network for the synapse was also determined (Supplementary Figure 1C). In all cases, high density networks representing direct protein-protein interactions were obtained. To summarize, the number of interacting proteins/genes identified in each case was: 6,782 associated with AD, 4,484 associated with the IS pathway, and 12,397 associated with the synapse.
Subsequently, the list of proteins coincident between AD and IS was extracted, resulting in a total of 3,176 proteins/genes. This list was crossed with the synaptic interactome (Supplementary Figure 1C), leading to the identification of 2,982 proteins/genes (Supplementary Table 3) that were extracted to build a synaptic network of AD/IS coincident proteins using Cytoscape (Fig. 1A, B). After the synaptic enrichment, 158 key AD proteins remain in the network and 94 for IS. These nodes are represented in Fig. 1A with a black and grey circumference respectively, and those common to both situations have been denoted with a red circumference.
Fig. 1
Synaptic AD/IS coincident network. Representation of all proteins retrieved from the interception between Alzheimer’s disease (AD), insulin signaling (IS), and the synapse. Community cluster (GLay) from ClusterMaker 2.0 was used to create the communities. Node size increases with higher values of betweenness centrality. A) Each community/cluster is highlighted in a different color. Key AD proteins are marked with a black circumference, key IS proteins with a dark grey circumference, and nodes common to both with a red circumference. B) Network with kinases filled in red, catalytic subunits of protein phosphatases filled in green and genetic risk factors for AD marked with a black circumference. Clusters are numbered left to right, top panel (clusters 1 to 4) and bottom panel (clusters 5 to 10), several proteins (102) are not integrated into clusters.
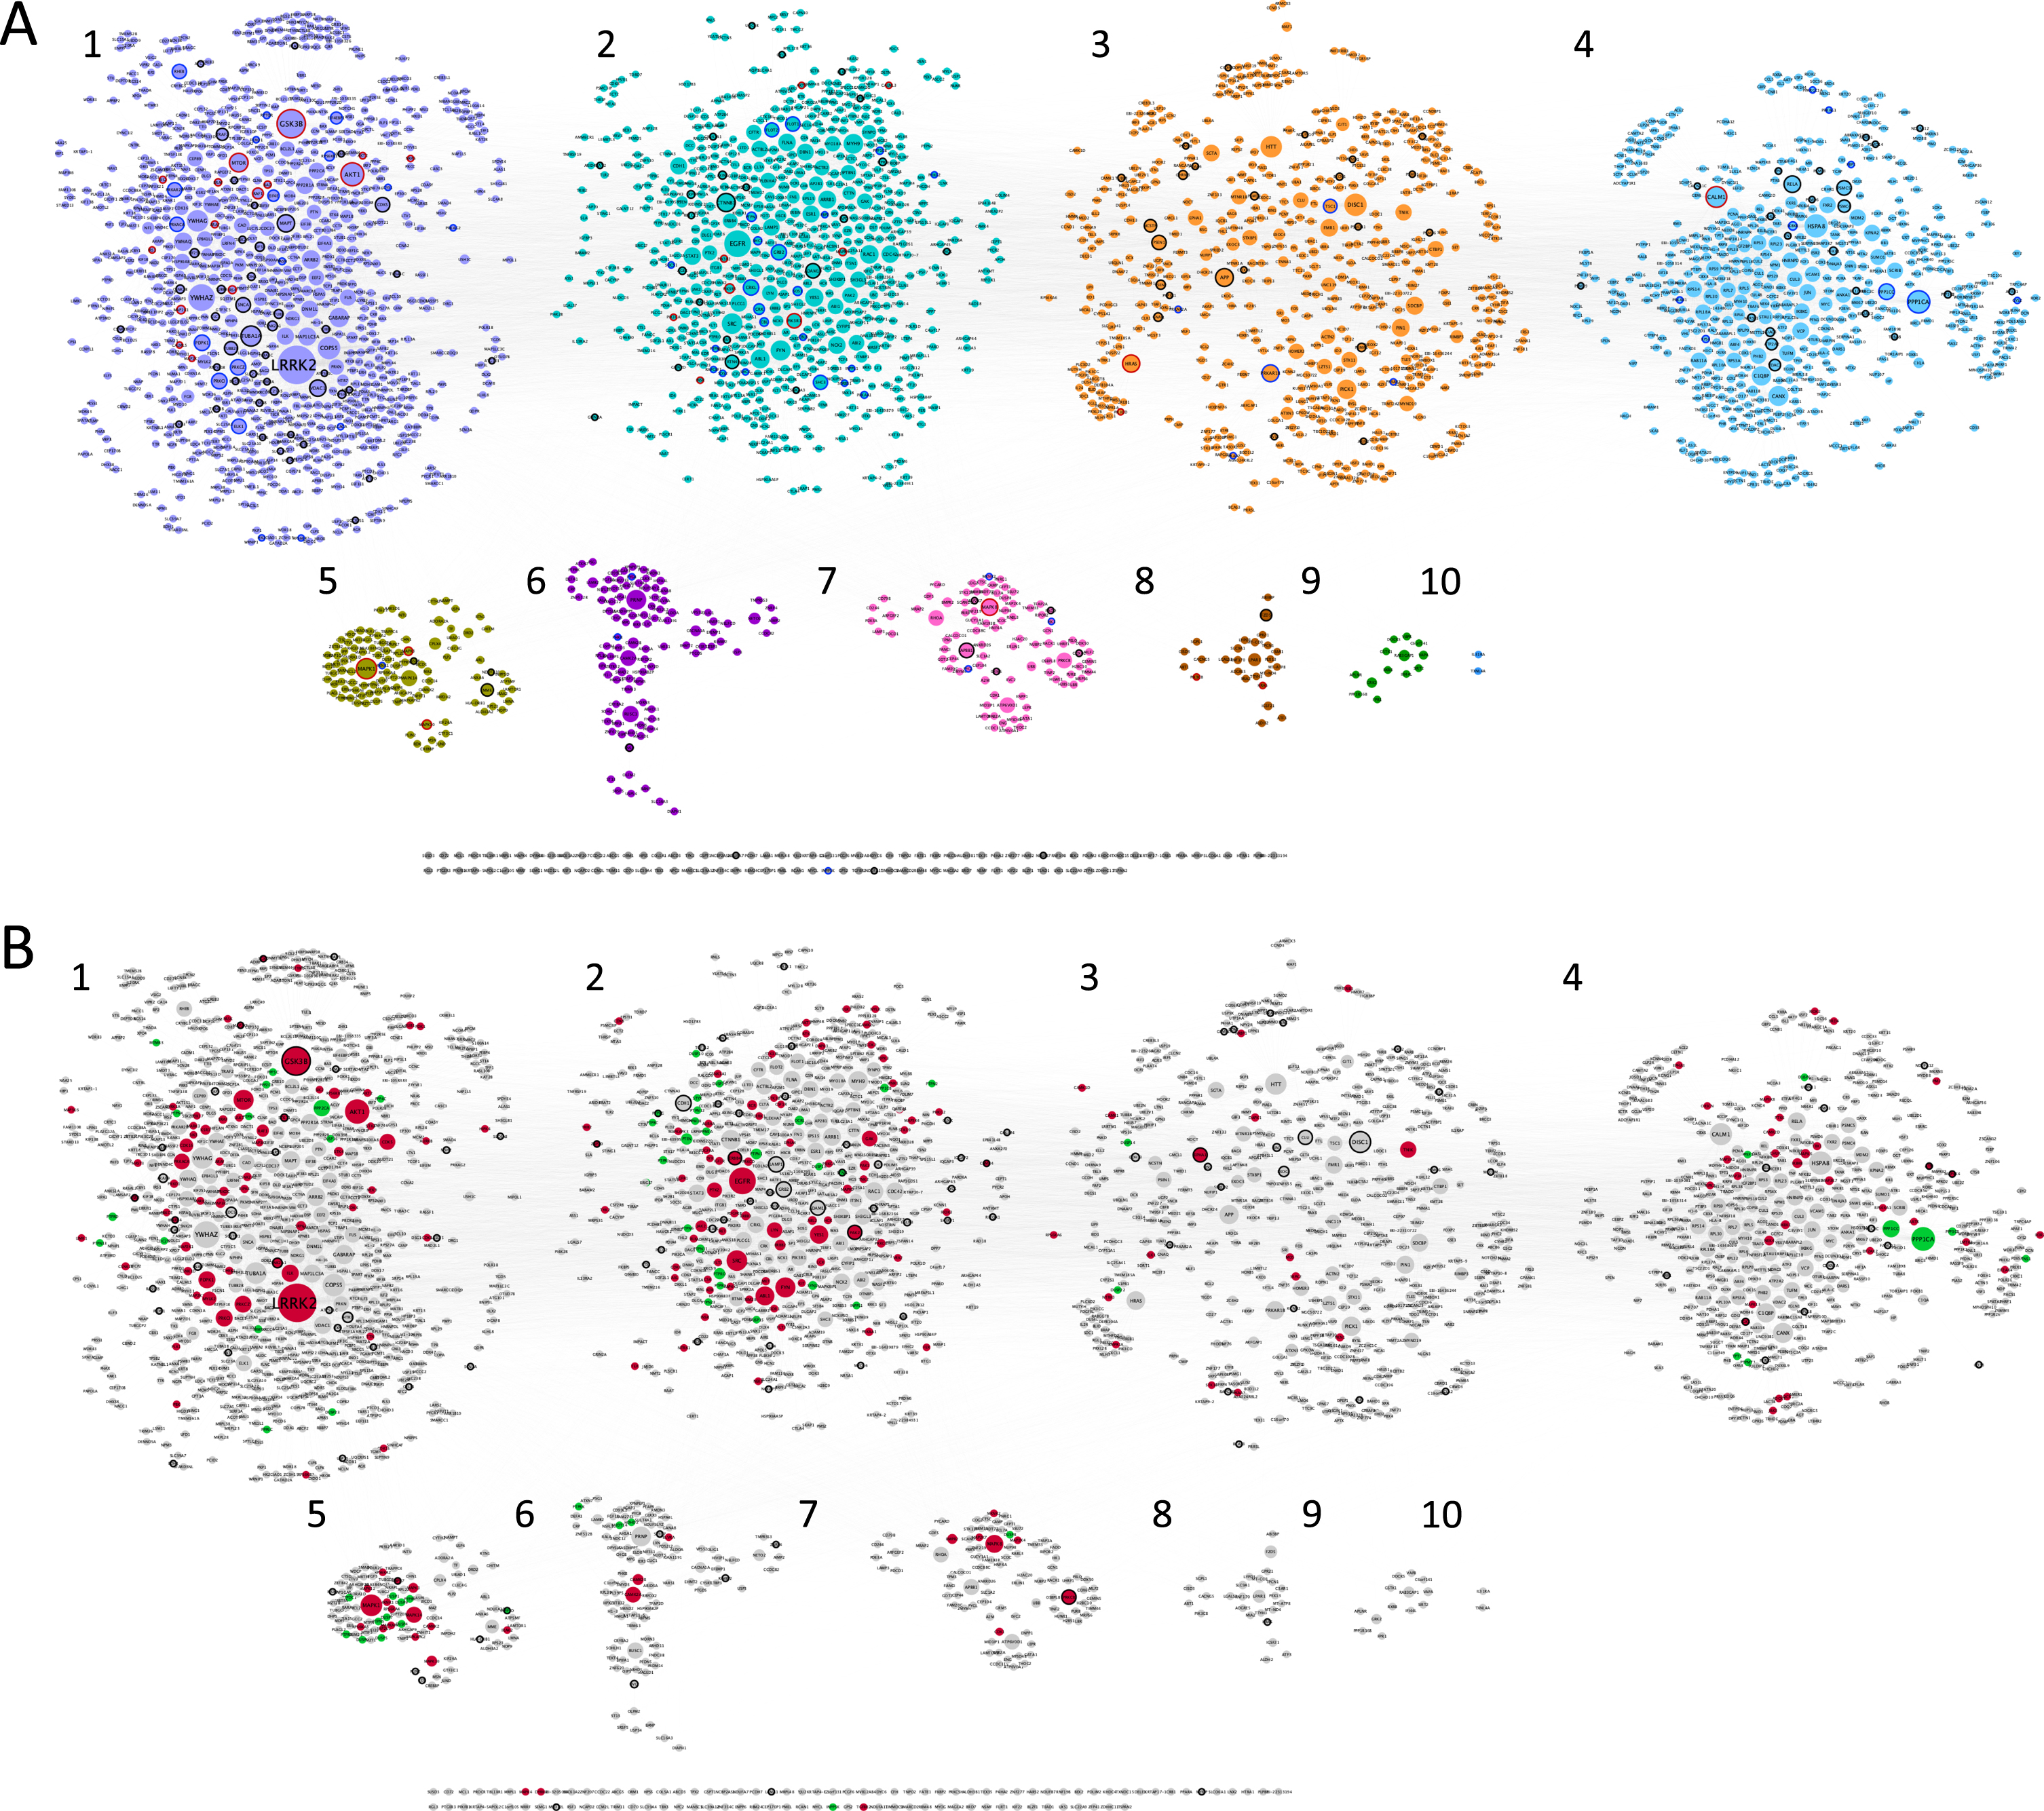
Betweenness centrality analysis was performed on the network, whereby larger nodes represent a higher value (Fig. 1). This parameter is measured by the number of shortest paths that pass through a given node, highlighting the nodes that have the highest influence in the network [35]. Using community cluster (GLay) from clusterMaker2 [28], it was possible to identify 10 different communities (Fig. 1A) within our data set, with increased importance for the first four communities (Fig. 2), with bigger hubs and genes/proteins with higher values of betweenness centrality. This community cluster uses the Girvan-Newman fast greedy algorithm to create the communities. This algorithm uses edge betweenness to group several nodes. The edge betweenness is defined by the number of shortest paths between pairs of nodes. The algorithm calculates the edge betweenness of the entire network and then removes the highest value, successively repeating these steps until the communities are formed [36].
Fig. 2
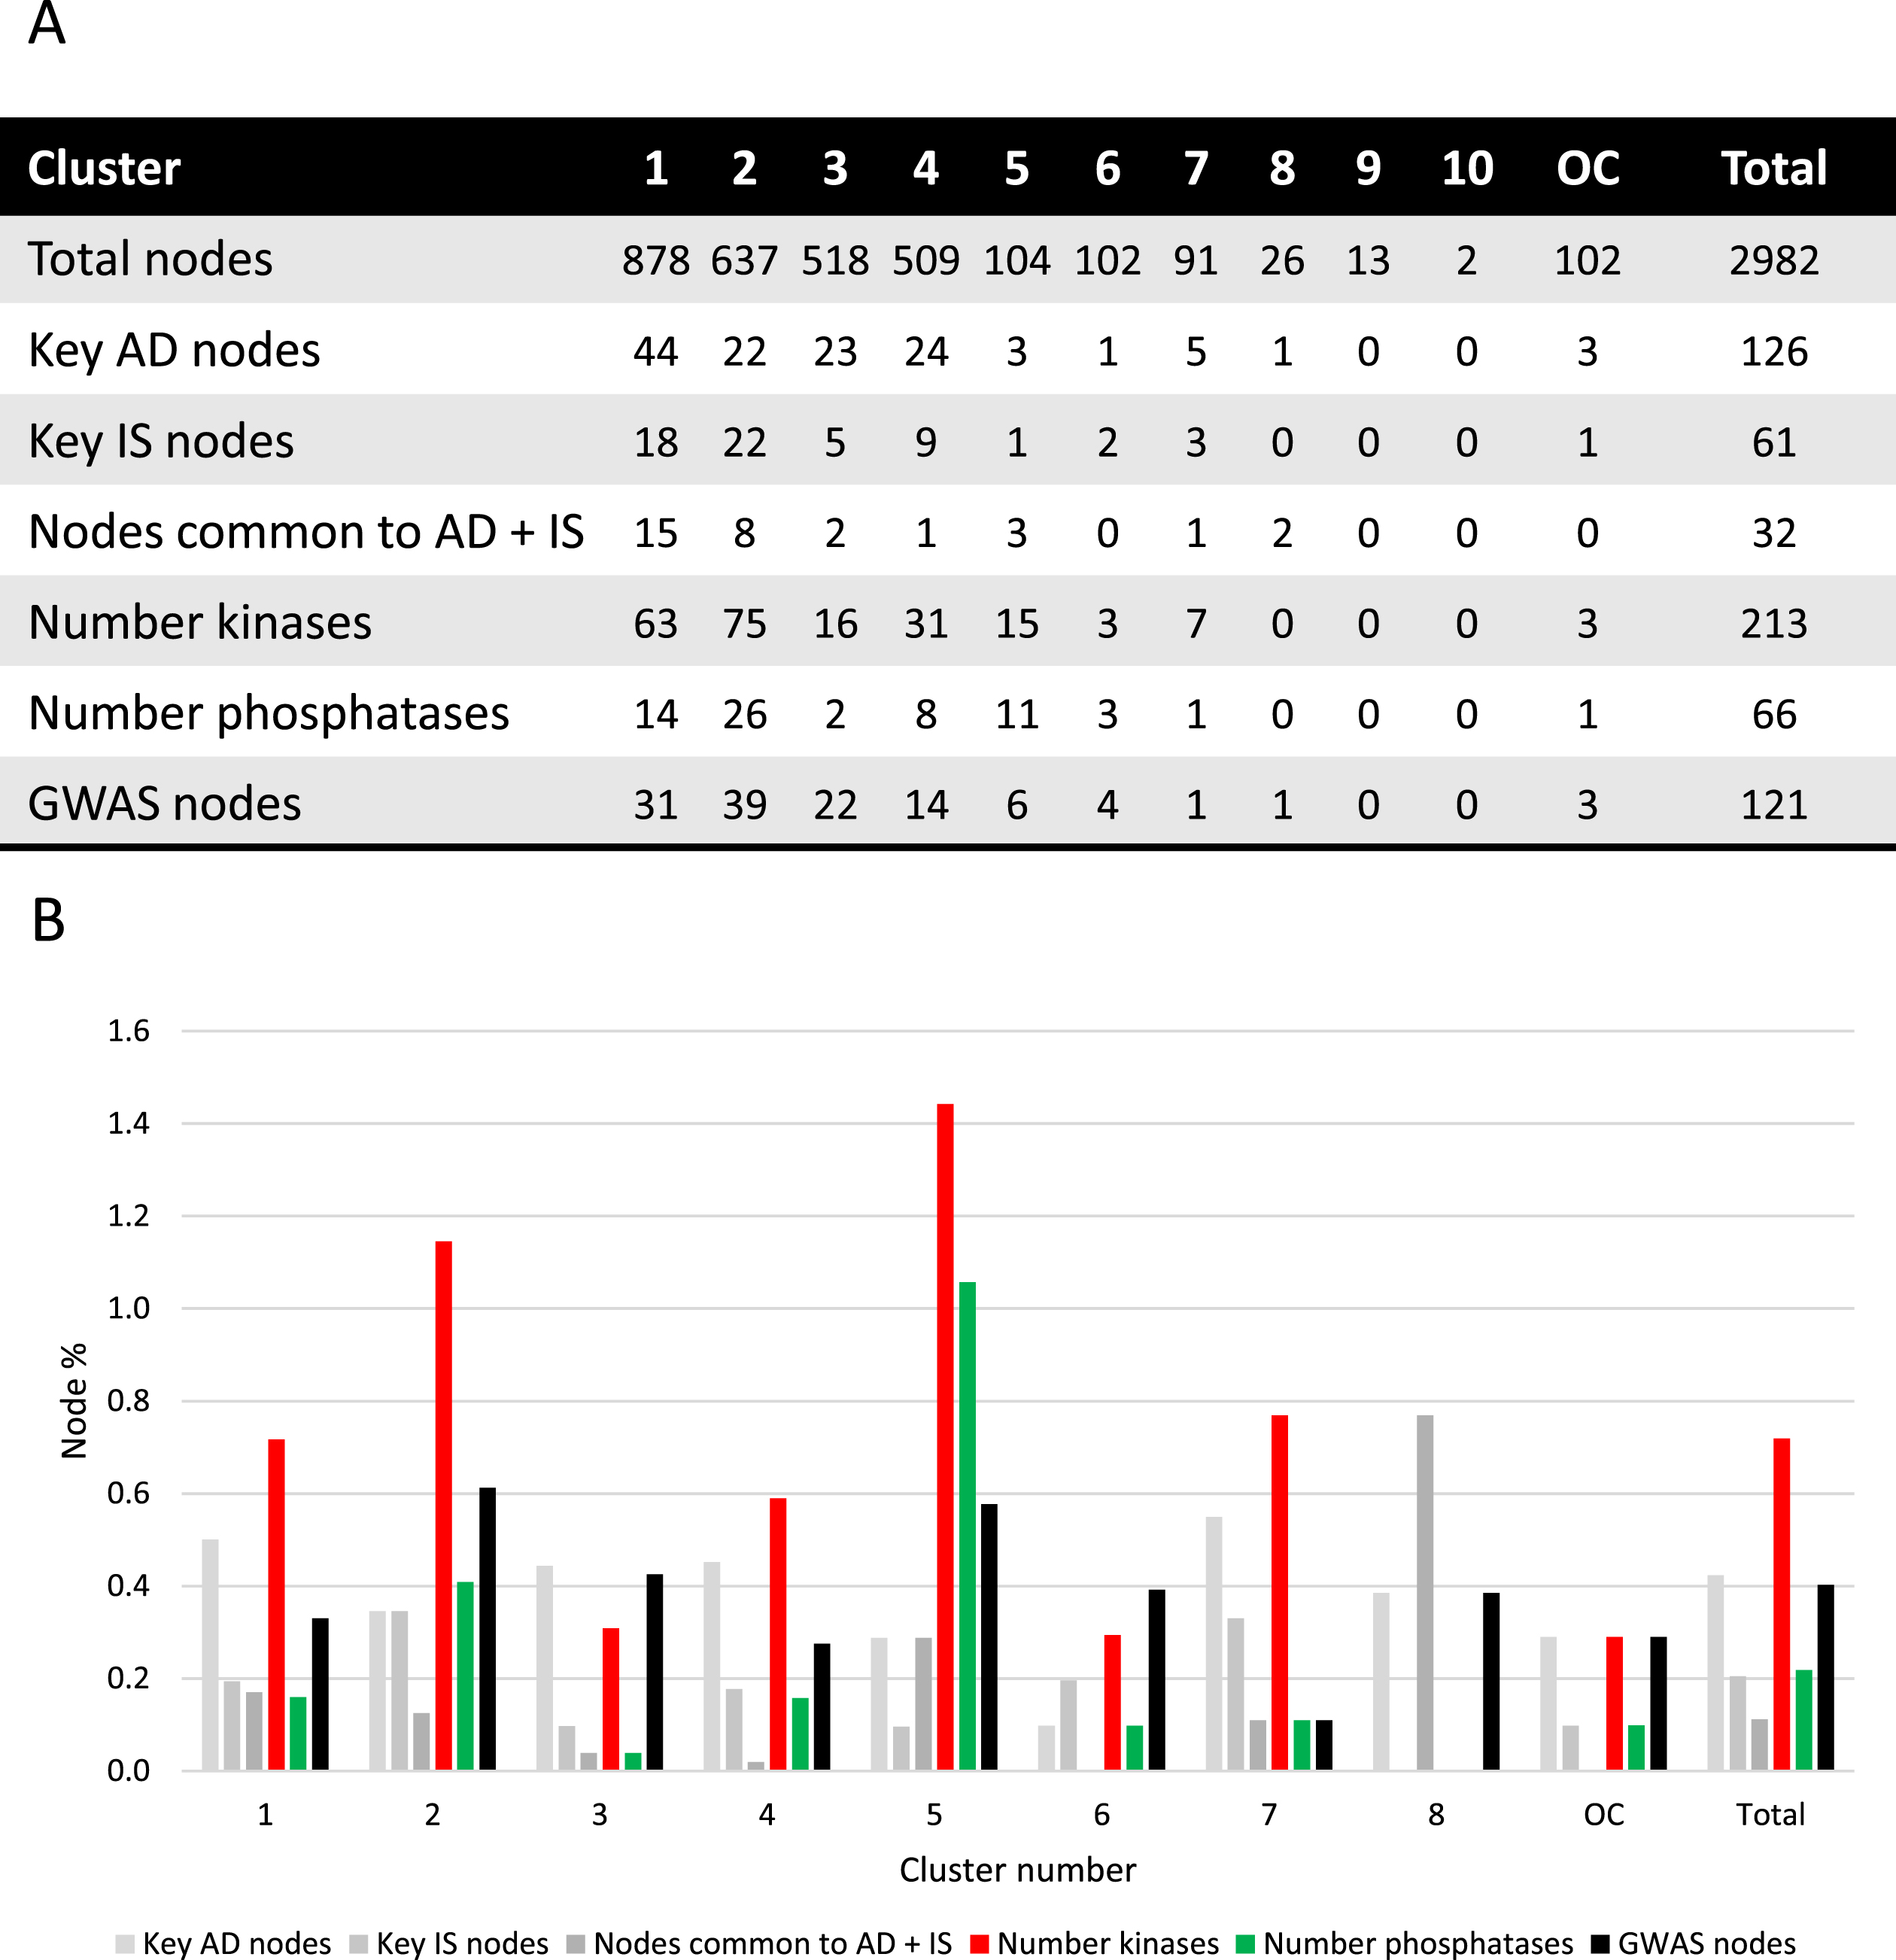
Cluster analysis. A) Absolute number of nodes with characteristics as indicated for each cluster. B) Different node characteristics represented as a percentage of nodes within each cluster and as a total of the synaptic AD and IS coincident network. Cluster 9 and 10 were excluded since no relevant nodes were present. OC, outside of the clusters.
Moreover, using a list of genetic risk factors for AD identified by genome-wide association studies, 121 genetic risk genes for AD were detected within the network here discussed (Fig. 1B). Kinases and phosphatases are indicated as red and green nodes respectively (Fig. 1B). The characteristics of the clusters are summarized in Fig. 2.
Key AD genes/proteins distributed throughout clusters 1 to 8, represented 3% to 8% of the nodes, except for cluster 6, accounting for only 1% of the nodes (Fig. 2). However, most of the AD key nodes, 44, mapped to cluster 1. Key IS genes/proteins showed a percentual distribution throughout clusters 1 to 7, ranging from 1% to 4% of the total number of nodes in each cluster, but with the greatest representation of 22 nodes in cluster 2. Shared key AD and IS nodes can be found in most clusters (ranging from 1% to 8% of the total nodes), but in absolute terms are mainly found in cluster 1 (15 nodes, representing 1.7% of the cluster) and cluster 2 (8 nodes, representing 1.3% of the cluster). A total of 32 key synaptic proteins were common to AD and IS, and these may represent important hubs of crosstalk between AD and IS at the synapse. These key proteins include members of the AKT family (AKT1, AKT2, AKT3), the CALM family (CALM1, CALML3, CALML5), the IRS family (INSR, IRS1, IRS2, IRS4), the MAPK family (MAP2K1, MAP2K2, MAPK1, MAPK10, MAPK3, MAPK8, MAPK9), the PIK3 family (PIK3CA, PIK3CB, PIK3CD, PIK3R1, PIK3R2, PIK3R3), GSK3β, MTOR, BAD and the RAS/RAF signaling pathway (ARAF, BRAF, RAF1, HRAS, KRAS, NRAS). These nodes are identified with a red circumference in Fig. 1A and indicated in Fig. 2A.
Given the characteristics of the 32 key proteins already mentioned, it is evident that protein phosphorylation is a central event crosslinking AD and IS. As such, not only was the ‘synaptic AD/IS coincident network’ annotated (Fig. 1B) for protein kinases and protein phosphatases but each community/cluster was also analyzed for these proteins (Fig. 2). In each of the clusters (from 1 to 7) kinases are represented from 3% to 14% of the total nodes and phosphatases from 1% to 10%. Evidently both kinases and phosphatases are extremely well represented in this network, and thus highly relevant to AD and IS signaling at the synapse.
The first cluster/community is mainly dominated by LRRK2, the biggest and most important node from our analysis, followed by GSK3β and AKT1. Also, YWHAZ, the gene for the 14-3-3 protein zeta/delta appears with a high value of betweenness and centrality (Supplementary Figure 2). The second cluster/community exhibits as a major node the EGFR protein and EGFR signaling with special highlight on SRC and FYN, two tyrosine kinases that are known to be recruited upon EGFR activation and play a role in the signaling pathway. The third cluster/community has as central nodes proteins well identified and associated with several neuropathologies. Among them, DISC1 involved in schizophrenia (which is also a genetic risk factor for AD), AβPP a key protein in AD and HTT likewise relevant in Huntington’s disease. The fourth cluster/community also has a high representation of serine/threonine protein phosphatases’ catalytic subunits, and significantly includes PPP1CA and PPP1CC. Both are important for AD associated processing pathways. The fifth cluster/community is associated with MAPK signaling, with high representation of MAP kinases but also dual-specificity phosphatases, known to regulate this signaling pathway. The major gene/protein in the sixth cluster/community is PRNP, a major prion protein, followed by two subunits of the calcium/calmodulin-dependent protein kinases type 2 (CAMK2A and CAMK2B). Moreover, and although MAP kinases are central in the fifth cluster/community, MAPK8 appears as the central node of the seventh cluster/community, followed by APBB1, an AβPP binding protein that encodes the Fe65 protein. The remaining clusters (8 to 10) include few or no proteins of interest to the study here presented.
Gene ontology analysis of the synaptic AD/IS network
The proteins/genes represented in Fig. 1 were subsequently submitted to SysBioTK for GO analysis [29]. The analysis was performed with respect to Cellular Component, Biological Process and Molecular Function and the top GO hits are displayed in Fig. 3. The principal Cellular Components identified are intracellular, organelle, cytoplasm, and nucleus. Also, proteins present in plasma membrane have a high incidence, corroborating a synaptic enrichment.
Fig. 3
Gene ontology analyses. Graphical representation of the distribution of the genes in the ‘Synaptic AD/IS coincident network’ with respect to cellular component, biological process, and molecular function. Top 12 hits are indicated.
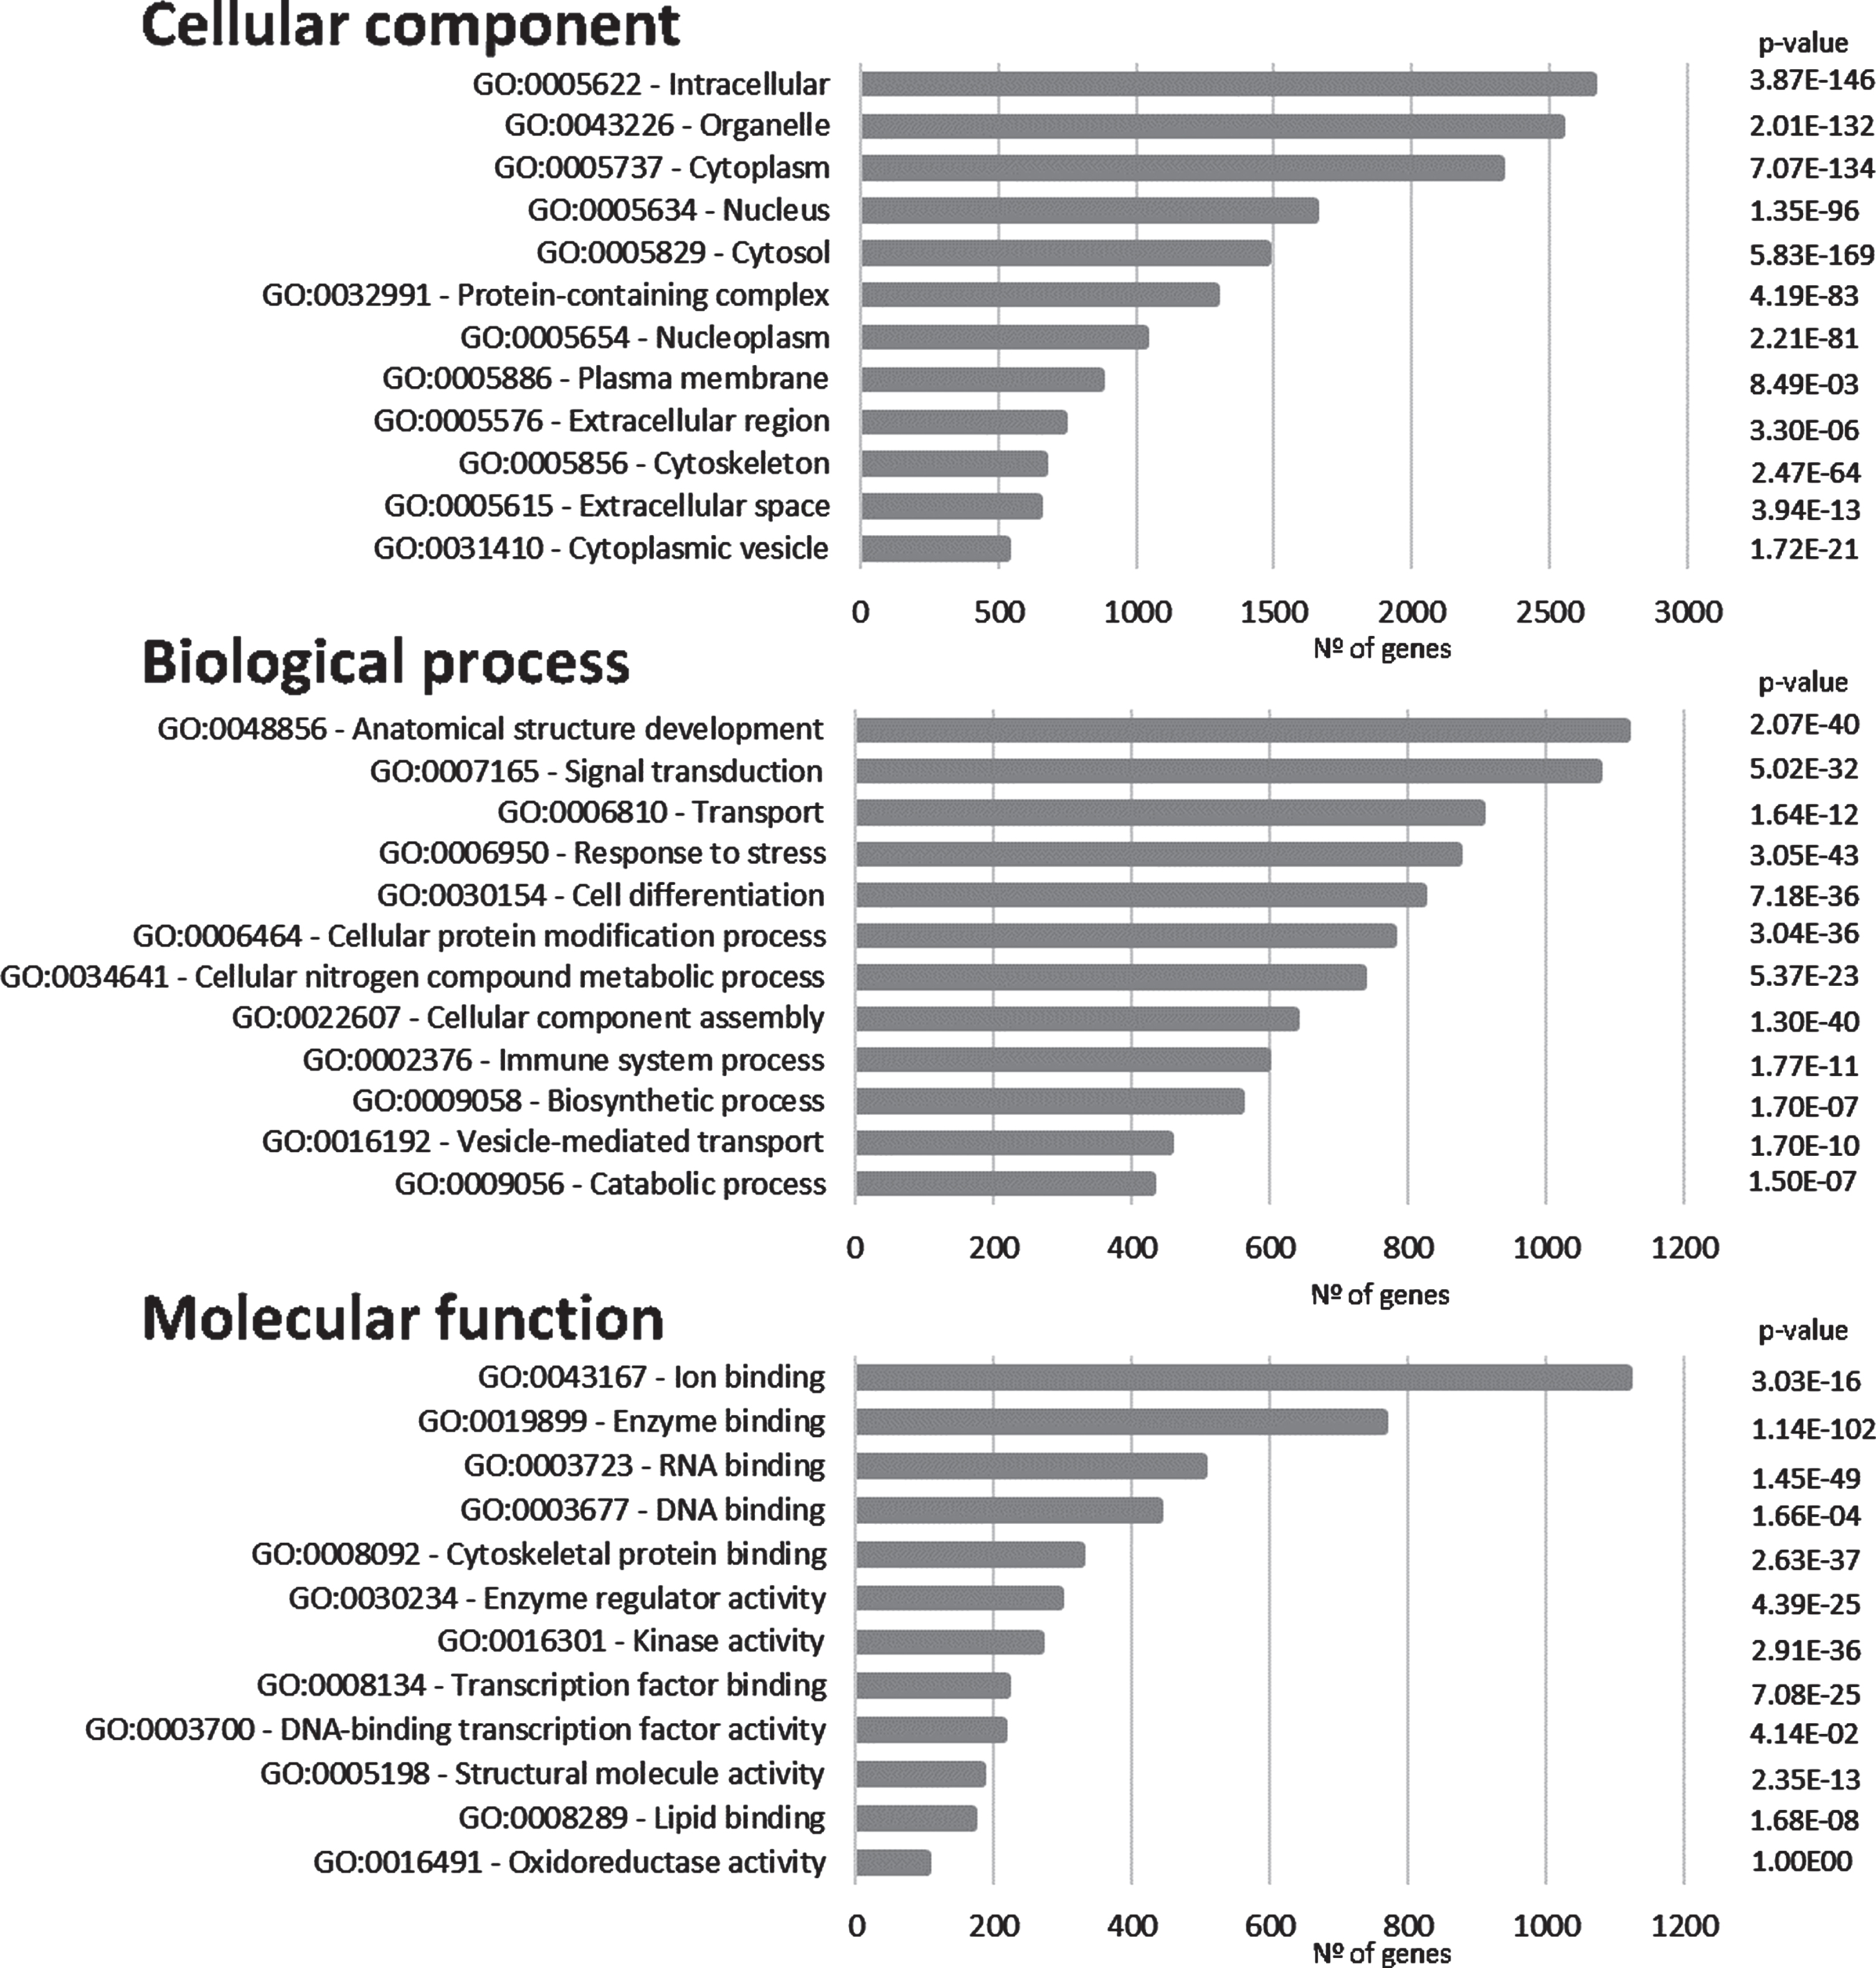
Anatomical structure development appears as the first Biological Process in the GO analyses and signal transduction as the second. These first two processes are followed by transport (Fig. 3). These top Biological Processes are consistent with a dynamic activity at the synapse where signal transduction plays a central role. Furthermore, cellular protein modification appears as the sixth top Biological Process (this includes post-translational modifications), this is an important feature in signal transduction, as signaling cascades are mainly regulated by phosphorylation and dephosphorylation events.
Regarding Molecular Function, ion binding, enzyme binding, and both RNA and DNA binding appear highly represented. Furthermore, a high incidence of kinase activity can be observed, listed as the top seventh Molecular Function.
The synaptic AD/IS kinase and phosphatase network
For proper neuronal and synaptic function, signaling pathways use phosphorylation and cascade activation of kinases in response to a stimulus, and phosphatases restore the phosphorylation levels to basal states. Not surprisingly, in the data thus far presented signal transduction, kinases, and protein phosphorylation related events are extremely well represented in the ‘synaptic AD/IS coincident network’. Thus, to address this issue more specifically, a network with specific focus on kinases and phosphatases was developed.
Using Fig. 1 as a model, all human kinases and phosphatases (catalytic and regulatory subunits) were extracted to build a phosphorylation network (Fig. 4). Since several protein phosphatases require regulatory subunits for proper dephosphorylation and substrate docking, these were included to produce the AD/IS synaptic kinase and phosphatase network ‘ADISsynKP network’.
Fig. 4
AD/IS synaptic kinase and phosphatase network. Color code obeys the communities presented in Fig. 1A. Node size increases with higher values of betweenness centrality. Kinases are highlighted with a dark red border and catalytic subunits of protein phosphatases are highlighted with a green border.
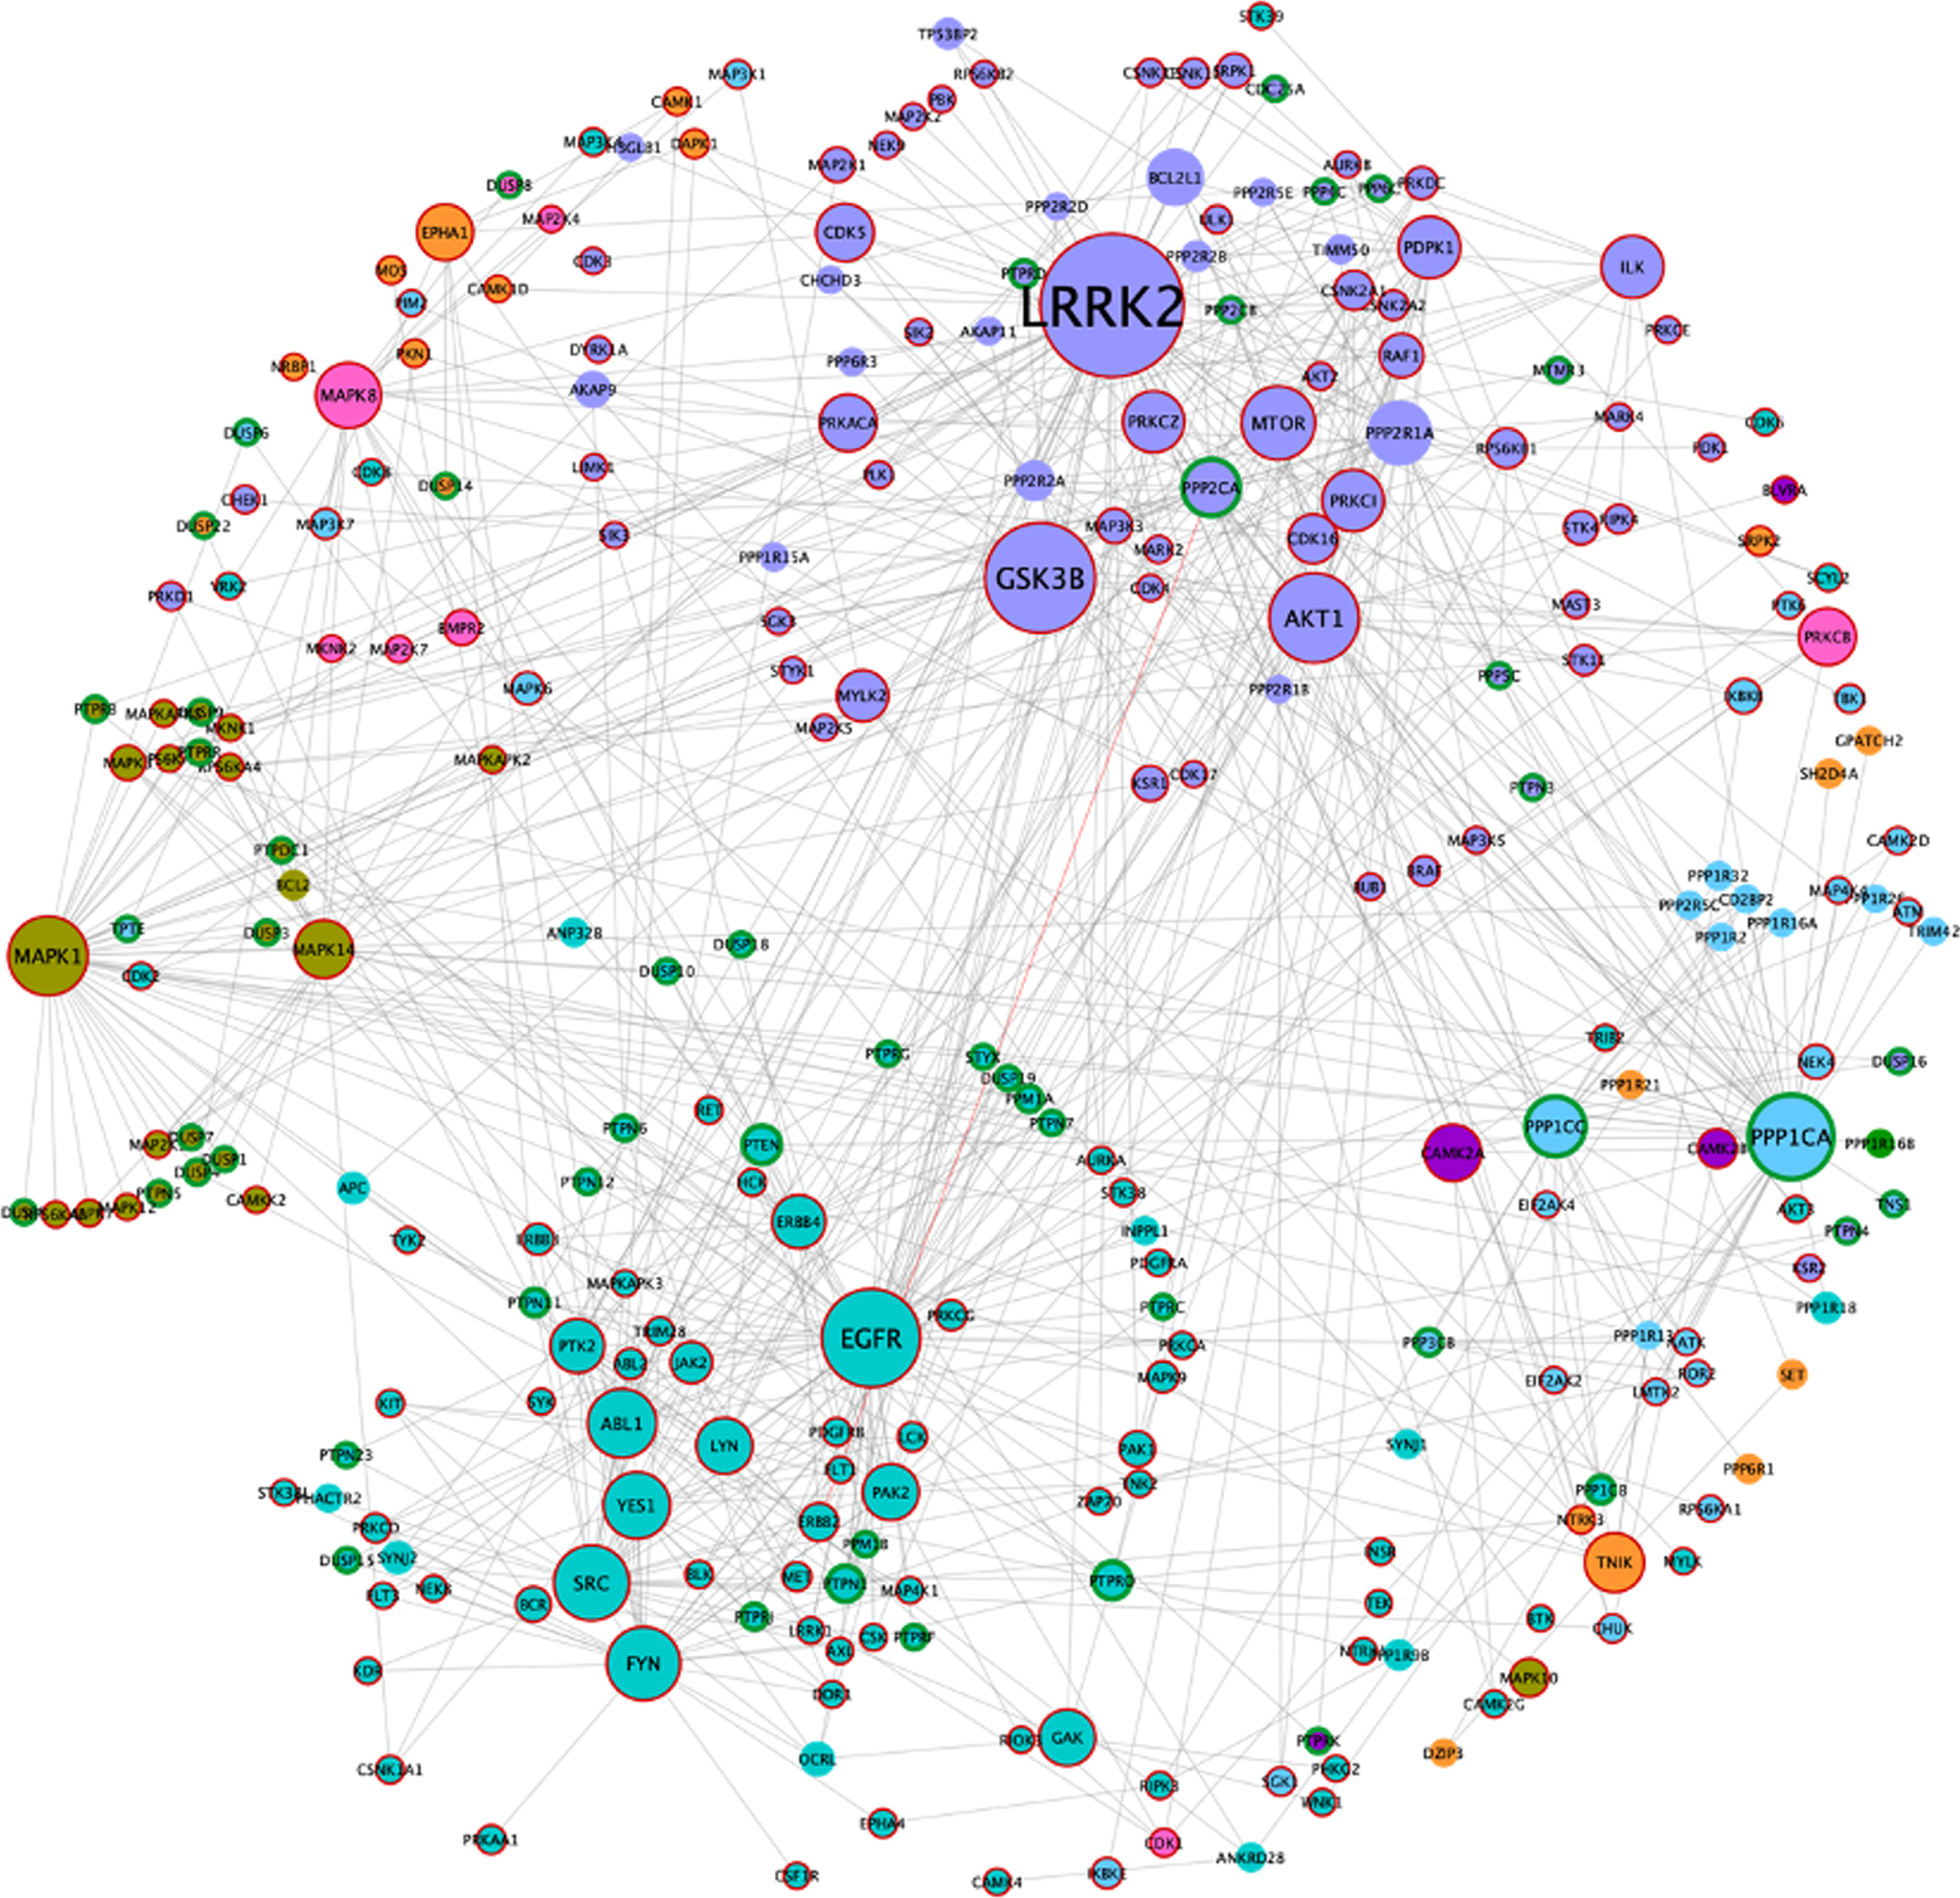
The resulting network includes 271 nodes, of which 179 correspond to kinases, 56 to catalytic subunits of phosphatases, and 38 to regulatory phosphatase subunits (two of these regulatory subunits are also kinases). Since the ADISsynKP network includes only kinases and phosphatases, it highlights the impact of several signaling pathways with pivotal importance for a synaptic IS related AD phenotype. For this purpose, a new betweenness centrality analysis was performed for this network, to identify protein kinases that may play an important role in IS-mediated AD development but could be masked in the previous network. From this analysis, LRRK2 remained as the largest hub. However, EGFR, PPP1CA, and MAPK1 appear to be even more important from this signaling pathway point of view. Moreover, two additional nodes, MAPK1 (also known as ERK2) and MAPK8 (also known as JNK1), emerge with high betweenness centrality values in the ADISsynKP network (Fig. 4).
Signaling pathways towards pivotal proteins involved in AD
To understand the potential influence of the most impactful kinases identified in Fig. 4, the kinector tool was used to explore the impact of these kinases on two key AD proteins, AβPP and tau. For this, the top six kinases with higher betweenness centrality values from Fig. 4 were used (LRRK2, GSK3B, EGFR, AKT1, MAPK1, and FYN). Using three levels of connectivity, a signaling pathway was constructed for each of the six proteins towards AβPP (Fig. 5) and tau (Fig. 6), to unravel the potential undirect links between them.
LRRK2 can stimulate both activation of AKT1 and the MAPK cascade, leading to phosphorylation of AβPP by ABL1, CDK1, and JNK proteins (MAPK8 and MAPK9) and LRRK2 itself (Fig. 5.1), while towards tau, activation of AKT1 is the main link between them (Fig. 6.1). GSK3B has a direct link towards both AβPP (Fig. 5.2) and tau (Fig. 6.2), and it is likely the most important kinase towards tau hyperphosphorylation. AKT1 emerged as a central protein as it can be activated by LRRK2, EGFR, MAPK1 (ERK2), and FYN towards tau and can activate MAPK signaling culminating in activation of GSK3β and casein kinase 2 alpha (CSNK2A1) (Fig. 6.3), while it can indirectly phosphorylate AβPP by activating CDK1, SRC, GSK3β, and JNK proteins (MAPK8 and MAPK9) (Fig. 5.3). Furthermore, EGFR and FYN act in a similar way, very likely due to FYN acting as an effector of EGFR signaling, resulting as an activation of the MAPK signaling towards both AβPP (Fig. 5.4 and 5.6) and tau (Fig. 6.4 and 6.6). Both EGFR and FYN also activate AKT1 toward tau, reinforcing the key role of AKT1. Lastly, MAPK1 (ERK2), as a part of the MAPK signaling cascade, plays an important role towards both AβPP and tau phosphorylation (Fig. 5.5 and 6.5). Emphasizing the latter, MAPK1 (ERK2) leads to the activation of several kinases that are known to be involved in the hyperphosphorylation of tau, such as AKT1, CDK5, CSNK2A1, BRSK1 and 2, and MARK1 and 2 (Fig. 6.5).
DISCUSSION
Cognitive based studies on the pcb-Cohort reveal that there is some degree of association between DM and memory deficits. Additionally, individuals with DM and memory deficits share comorbidities with gastrointestinal and respiratory diseases. Gastrointestinal disease, in particular, is relevant to the gut-brain axis presently intensely studied, and first reported by us for this cohort in 2017 [25]. Clearly there are mechanisms in the gut-DM-cognition axis which need to be further investigated. As presented in the introduction, growing evidence links impaired brain insulin signaling and insulin resistance to AD development. An association between diabetes and poor cognitive scores in MMSE test was observed in the data here presented, linking diabetes to a deterioration in cognition. Additionally, and of particular relevance, carriers of the allele APOE ɛ2 appeared to be protected against DM, an allele also protective for AD [37].
DM is intimately associated with insulin, whereby the latter and the IGF signaling pathways regulate a wide range of neuronal processes [38]. Brain insulin/IGF resistance leads to impaired cellular responses. Consistently, depletion or suppression of brain insulin receptor expression or function, using animal models, leads to cognitive impairment and AD-type neurodegeneration [39, 40]. The insulin and IGF-1 receptors control tau and ChAT (choline acetyl transferase) gene expression levels [41]. Both are essential for cellular brain activity, and this explains how insulin resistance or deficiency contributes to brain plasticity, synaptic dysfunction, and cognitive decline [6].
At a cellular level, insulin binds to the alpha-subunit of the insulin receptor, activating tyrosine kinase phosphorylation of its beta-subunit. This leads to the activation of second messengers and transduction pathways, involving the binding of insulin receptor substrates 1 and 2 (IRS1 and IRS2) to phosphatidylinositol 3-kinase (PI3K). Insulin and IGF resistance reduce signaling via PI3K/AKT [42], and Wnt/β-catenin [43], which in turn increases GSK3β activation. Consistently the latter was identified as a central node in the ‘synaptic AD/IS coincident network’ here presented and is pivotal to tau hyperphosphorylation and NFT formation.
Leucine-rich repeat serine/threonine-protein kin-ase 2 (LRRK2) appears as the central node and thus, the most important protein in the synapse that contributes to AD through insulin signaling, or more likely, insulin resistance. LRRK2 mutations are common in familial Parkinson’s disease and always accompanied with tau pathology in these patients, even in some cases, with absence of α-synuclein pathology [44]. Furthermore, a recent study showed that LRRK2 deficiency in rodents impairs insulin-mediated translocation of GLUT4 [45]. Although GLUT4 is not the principal regulator of glucose uptake in neurons, it plays an important role in memory processing in hippocampal neurons [46]. LRRK2 was also described as an activator of AKT1 and LRRK2 mutations in Parkinson’s disease, showing decreased association of this two proteins, potentiating neurodegeneration [47]. In the different networks developed LRRK2 remained as the most central hub in our data set, increasing its overall potential to be a therapeutic target or biomarker for AD development.
GSK3β is a known key protein in AD pathogenesis, mainly due to its direct role in AβPP and tau phosphorylation. GSK3β can phosphorylate AβPP at threonine 668, potentially increasing Aβ peptide formation [48] and can also phosphorylate more than 40 known residues in tau, most of them important for the formation of NFTs [49]. AKT can phosphorylate GSK3β at serine 9 and inactivate it, in response to active IS. However, insulin resistance reduces AKT activation and consequently leads to increased catalytic activity of GSK3β [50]. Both GSK3β and AKT appear highlighted as important nodes from our analysis, as was expected given their direct involvement in IS. The influence of IS on AβPP processing and AD has already been well documented by several groups. Besides the influence of GSK3β in AβPP already discussed, IR knockout mice show a significant decrease in the Aβ peptide burden [51]. Moreover, insulin resistant cells showed an increase in Aβ peptide levels, through an increase in autophagosomes [52]. In our study several proteins already associated with neurodegenerative diseases emerged as central hubs, besides AβPP, disrupted in schizophrenia 1 protein (DISC1), and HTT were also identified, implicating their involvement in an IS associated regulatory mechanism. DISC1 polymorphisms have been reported to be a genetic risk factor for late AD onset [53]. Interestingly, mice with mutations in this gene exhibit neuronal alterations on IGF signaling, impacting directly on AKT-GSK3β and ERK1/2 signaling pathways, leading to increase activity of GSK3β and ERK1/2 [54]. Huntingtin (HTT) is the major protein involved in Huntington disease, and a key protein in our findings. Postmortem analysis of hippocampal samples from AD brains showed an increase of HTT co-localizing with NFT [55]. Additionally, a recent study showed a correlation between mutations in HTT gene and both AD and diabetes critical biological processes [56]. Taken together the data here presented reinforces the link between GSK3β, AKT, ERK1/2, AβPP, DISC1, HTT, IGF, AD, and DM.
The epidermal growth factor receptor (EGFR) and the respective signaling pathway emerged also emerged as key players from the analysis here reported. EGFR can be activated by Aβ oligomeric peptides and induce Aβ associated toxicity mainly by activation of MAPK signaling [57]. EGFR signaling can also recruit and activate SRC and FYN tyrosine kinases, which were identified as key proteins in this study. Both SRC and FYN play an important role in synaptic signal transduction and have already implicated in AD pathogenesis, mainly due their role in the regulation of N-Methyl-D-Aspartate receptors [58]. Moreover, FYN has become one of the principal proteins in the link between Aβ peptide toxicity and downstream tau hyperphosphorylation. FYN tyrosine kinase can be activated in neurons by oligomeric forms of Aβ peptides and consequently cause tau hyperphosphorylation and aggregation [59]. Significantly, transgenic tau mice with knockout of FYN exhibited reduced phosphorylation at tau tyrosine 18 and almost complete ablation of NFTs [60].
Interestingly, EGFR and MAPK1 (also known as ERK2) appear to play an even more significant role from a signaling pathway point-of-view. This again highlights the importance of IS and EGFR signaling in the activation of MAPK signaling associated with AD development. Moreover, MAPK8 (also known as JNK1) activation is known to promote the expression of pro-apoptotic genes, leading to apoptosis, re-enforcing a different perspective whereby MAPK signaling pathway may play a role in AD pathogenesis [61].
Furthermore, a signaling pathway between the six main kinases from our analysis were crossed with AβPP and tau to unravel undirect roles towards their phosphorylation. This analysis again highlighted the role of AKT1 as well as reinforced the role of the MAPK signaling pathway already discussed.
For each phosphorylation event there is a fundamental counterbalance role in signaling cascades played by protein phosphatases. It is therefore perhaps not surprising that serine/threonine-protein phosphatase 1 catalytic subunit alpha (PPP1CA) and serine/threonine protein phosphatase 1 catalytic subunit gamma (PPP1CC) also emerge as important central hubs, in the work here presented. These are the major protein phosphatases controlling the dephosphorylation of IS pathway and dephosphorylate both AβPP, preventing Aβ peptide production [62, 63], and tau, although protein phosphatase 2 alpha has a more significant role in the latter [64]. Nonetheless, PPP1CA appears to have a high impact in the networks here presented, which was expected since its known to be involved in the regulation of numerous neuronal signaling pathways [65].
It is highly probable that other proteins associated with AD and T2D were not identified with this analysis. We are clearly limited by present knowledge of already described protein interactors, proteins with a higher number of known interactors have increased presence in our analysis and may be overrepresented. Although this is a limitation of this study, it was nonetheless possible to identify novel proteins that may be deregulated in AD and may play an important role in the development of AD in T2D patients.
Besides the molecular overlap between AD and DM, this work also revealed important overlaps at a cellular level. In fact, the GO analysis of the proteins/genes extracted from the ‘synaptic AD/IS coincident network’ reveal a high incidence of proteins involved in anatomical structure development and signal transduction, corroborating the impact that IS can have in both synaptic differentiation and signaling. Protein phosphorylation and dephosphorylation play an unquestionable role in synaptic signaling and are in fact well represented in the GO analysis through several functions, such as the Biological Process “cellular protein modification process” or the Molecular Process “kinase activity”. An unbalance between the phosphorylation/dephosphorylation of several key AD proteins plays a central role in the disease pathogenesis and neuronal insulin resistance may potentially contribute to this end. Synaptic dysfunction is one of the first known events in AD pathogenesis and insulin resistance is ideally positioned to be an early determinant factor in this event [66, 67].
In summary, neuronal insulin resistance is an important molecular factor in AD pathogenesis and can trigger or at least accelerate the pathogenic process. DM patients are more susceptible to develop cognitive impairments with age. However, APOE ɛ2 appears to exert a protective role against the development of DM, as it does for the development of AD. From the bioinformatic analysis, LRRK2 emerged as the central protein in an IS-related AD from a synaptic point-of-view. Further work is necessary to understand the influence of insulin in this protein, as it may be a good therapeutic or biomarker target. Other proteins arose from our analysis, such as GSK3β, AKT1, EGFR, SRC, FYN, DISC1, HTT, MAPK associated proteins, and the family of serine/threonine protein phosphatases. Notably, the impact of neuronal insulin signaling and neuronal insulin resistance in many of these proteins remains unknown. This work also reinforces the pivotal role of the MAPK signaling pathways in AD and synaptic dysfunction, and their potential dysregulation in insulin resistance conditions.
Insulin signaling plays an unquestionable role in memory and cognition, and consequently in AD, further work is now necessary to understand all the mechanisms behind these cascades of events.
ACKNOWLEDGMENTS
This research was funded by a grant from the Alzheimer’s Association (2019-AARG-644347) and supported by iBiMED UIDB/04501/2020, FCT, COMPETE program, QREN, European Un-ion; MEDISIS –CENTRO-01-0246-FEDER-000018, Centro 2020 program, Portugal 2020, European Union. SRA is supported by the FCT through the individual PhD grant (SFRH/BD/141820/2018). We also acknowledge the volunteers and their families as well as all the health professionals in the Aveiro district that made this study possible.
Authors’ disclosures available online (https://www.j-alz.com/manuscript-disclosures/21-5059r2).
SUPPLEMENTARY MATERIAL
[1] The supplementary material is available in the electronic version of this article: https://dx.doi.org/10.3233/JAD-215059.
REFERENCES
[1] | Hoyer S ((1970) ) Der Aminosäuren-Stoffwechsel des normalen menschlichen Gehirns. Klin Wochenschr 48: , 1239–1243. |
[2] | Hoyer S ((1991) ) Abnormalities of glucose metabolism in Alzheimer’s disease. Ann N Y Acad Sci 640: , 53–58. |
[3] | Talbot K , Wang H-Y , Kazi H , Han L-Y , Bakshi KP , Stucky A , Fuino RL , Kawaguchi KR , Samoyedny AJ , Wilson RS , Arvanitakis Z , Schneider JA , Wolf BA , Bennett DA , Trojanowski JQ , Arnold SE ((2012) ) Demonstrated brain insulin resistance in Alzheimer’s disease patients is associated with IGF-1 resistance, IRS-1 dysregulation, and cognitive decline. J Clin Invest 122: , 1316–38. |
[4] | Duelli R , Schröck H , Kuschinsky W , Hoyer S ((1994) ) Intracerebroventricular injection of streptozotocin induces discrete local changes in cerebral glucose utilization in rats. Int J Dev Neurosci 12: , 737–743. |
[5] | Guo T , Zhang D , Zeng Y , Huang TY , Xu H , Zhao Y ((2020) ) Molecular and cellular mechanisms underlying the pathogenesis of Alzheimer’s disease. Mol Neurodegener 15: , 40. |
[6] | Steen E , Terry BM , Rivera EJ , Cannon JL , Neely TR , Tavares R , Xu XJ , Wands JR , De La Monte SM ((2005) ) Impaired insulin and insulin-like growth factor expression and signaling mechanisms in Alzheimer’s disease - Is this type 3 diabetes? J Alzheimers Dis 7: , 63–80. |
[7] | Mittal K , Mani RJ , Katare DP ((2016) ) Type 3 Diabetes: Cross talk between differentially regulated proteins of Type 2 Diabetes Mellitus and Alzheimer’s disease. Sci Rep 6: , 25589. |
[8] | Rebelo S , Vieira SI , Esselmann H , Wiltfang J , Da Cruz E Silva EF , Da Cruz E Silva OAB ((2007) ) Tyrosine 687 phosphorylated Alzheimer’s amyloid precursor protein is retained intracellularly and exhibits a decreased turnover rate. Neurodegener Dis 4: , 78–87. |
[9] | Rebelo S , Vieira SI , Esselmann H , Wiltfang J , Da Cruz E Silva EF , Da Cruz E Silva OAB ((2007) ) Tyr687 dependent APP endocytosis and Abeta production. J Mol Neurosci 32: , 1–8. |
[10] | Vieira SI , Rebelo S , Esselmann H , Wiltfang J , Lah J , Lane R , Small SA , Gandy S , Da Cruz E Silva EF , Da Cruz E Silva OAB ((2010) ) Retrieval of the Alzheimer’s amyloid precursor protein from the endosome to the TGN is S655 phosphorylation state-dependent and retromer-mediated. Mol Neurodegener 5: , 40. |
[11] | Gandy SE , Caporaso GL , Buxbaum JD , de Cruz Silva O , Iverfeldt K , Nordostedt C , Suzuki T , Czernik AJ , Nairn AC , Greengard P ((1993) ) Protein phosphorylation regulates relative utilization of processing pathways for Alzheimer β/A4 amyloid precursor protein. Ann N Y Acad Sci 695: , 117–121. |
[12] | Watson GS , Peskind ER , Asthana S , Purganan K , Wait C , Chapman D , Schwartz MW , Plymate S , Craft S ((2003) ) Insulin increases CSF Aβ42 levels in normal older adults. Neurology 60: , 1899–1903. |
[13] | Gasparini L , Netzer WJ , Greengard P , Xu H ((2002) ) Does insulin dysfunction play a role in Alzheimer’s disease? Trends Pharmacol Sci 23: , 288–293. |
[14] | Messier C , Teutenberg K ((2005) ) The role of insulin, insulin growth factor, and insulin-degrading enzyme in brain aging and Alzheimer’s disease. Neural Plast 12: , 311–328. |
[15] | Gasparini L , Gouras GK , Wang R , Gross RS , Beal MF , Greengard P , Xu H ((2001) ) Stimulation of β-amyloid precursor protein trafficking by insulin reduces intraneuronal β-amyloid and requires mitogen-activated protein kinase signaling. J Neurosci 21: , 2561–2570. |
[16] | Craft S , Watson GS ((2004) ) Insulin and neurodegenerative disease: Shared and specific mechanisms. Lancet Neurol 3: , 169–178. |
[17] | Ling X , Martins RN , Racchi M , Craft S , Helmerhorst E ((2002) ) Amyloid beta antagonizes insulin promoted secretion of the amyloid beta protein precursor. J Alzheimers Dis 4: , 369–374. |
[18] | Xie L , Helmerhorst E , Taddei K , Plewright B , Van Bronswijk W , Martins R ((2002) ) Alzheimer’s beta-amyloid peptides compete for insulin binding to the insulin receptor. J Neurosci 22: , RC221. |
[19] | Van Obberghen E , Baron V , Delahaye L , Emanuelli B , Filippa N , Giorgetti-Peraldi S , Lebrun P , Mothe-Satney I , Peraldi P , Rocchi S , Sawka-Verhelle D , Tartare-Deckert S , Giudicelli J ((2001) ) Surfing the insulin signaling web. Eur J Clin Invest 31: , 966–977. |
[20] | Lizcano JM , Alessi DR ((2002) ) The insulin signalling pathway. Curr Biol 12: , R236–R238. |
[21] | Chen D , Waters SB , Holt KH , Pessin JE ((1996) ) SOS phosphorylation and disassociation of the Grb2-SOS complex by the ERK and JNK signaling pathways. J Biol Chem 271: , 6328–6332. |
[22] | Gray SM , Meijer RI , Barrett EJ ((2014) ) Insulin regulates brain function, but how does it get there? Diabetes 63: , 3992–3997. |
[23] | Blázquez E , Velázquez E , Hurtado-Carneiro V , Ruiz-Albusac JM ((2014) ) Insulin in the brain: Its pathophysiological implications for States related with central insulin resistance, type 2 diabetes and Alzheimer’s disease. Front Endocrinol (Lausanne) 5: , 161. |
[24] | Plum L , Schubert M , Brüning JC ((2005) ) The role of insulin receptor signaling in the brain. Trends Endocrinol Metab 16: , 59–65. |
[25] | Rosa IM , Henriques AG , Carvalho L , Oliveira J , da Cruz e Silva OAB ((2017) ) Screening younger individuals in a primary care setting flags putative dementia cases and correlates gastrointestinal diseases with poor cognitive performance. Dement Geriatr Cogn Disord 43: , 15–28. |
[26] | Rosa IM , Henriques AG , Wiltfang J , Da Cruz E Silva OAB ((2018) ) Putative dementia cases fluctuate as a function of Mini-Mental State Examination cut-off points. J Alzheimers Dis 61: , 157–167. |
[27] | Shannon P , Markiel A , Ozier O , Baliga NS , Wang JT , Ramage D , Amin N , Schwikowski B , Ideker T ((2003) ) Cytoscape: A software environment for integrated models of biomolecular interaction networks. Genome Res 13: , 2498–2504. |
[28] | Morris JH , Apeltsin L , Newman AM , Baumbach J , Wittkop T , Su G , Bader GD , Ferrin TE ((2011) ) ClusterMaker: A multi-algorithm clustering plugin for Cytoscape. BMC Bioinformatics 12: , 436. |
[29] | Henriques AG , Müller T , Oliveira JMH , Cova M , Da Cruz E Silva CB , Da Cruz E Silva OAB ((2016) ) Altered protein phosphorylation as a resource for potential AD biomarkers. Sci Rep 6: , 30319. |
[30] | Mi H , Ebert D , Muruganujan A , Mills C , Albou L-P , Mushayamaha T , Thomas PD ((2021) ) PANTHER version 16: A revised family classification, tree-based classification tool, enhancer regions and extensive API. Nucleic Acids Res 49: , D394–D403. |
[31] | Eid S , Turk S , Volkamer A , Rippmann F , Fulle S ((2017) ) Kinmap: A web-based tool for interactive navigation through human kinome data. BMC Bioinformatics 18: , 16. |
[32] | Liberti S , Sacco F , Calderone A , Perfetto L , Iannuccelli M , Panni S , Santonico E , Palma A , Nardozza AP , Castagnoli L , Cesareni G ((2013) ) HuPho: The human phosphatase portal. FEBS J 280: , 379–387. |
[33] | Morgado J , Rocha CS , Maruta C , Guerreiro M , Martins IP ((2010) ) Cut-off scores in MMSE: A moving target? Eur J Neurol 17: , 692–695. |
[34] | Orchard S , Ammari M , Aranda B , Breuza L , Briganti L , Broackes-Carter F , Campbell NH , Chavali G , Chen C , Del-Toro N , Duesbury M , Dumousseau M , Galeota E , Hinz U , Iannuccelli M , Jagannathan S , Jimenez R , Khadake J , Lagreid A , Licata L , Lovering RC , Meldal B , Melidoni AN , Milagros M , Peluso D , Perfetto L , Porras P , Raghunath A , Ricard-Blum S , Roechert B , Stutz A , Tognolli M , Roey van K , Cesareni G , Hermjakob H ((2014) ) The MIntAct project—IntAct as a common curation platform for 11 molecular interaction databases. Nucleic Acids Res 42: , D358. |
[35] | Perez C , Germon R ((2016) ) Graph creation and analysis for linking actors: Application to social data. In Automating Open Source Intelligence: Algorithms for OSINT Elsevier Inc., pp. 103–129. |
[36] | Girvan M , Newman MEJ ((2002) ) Community structure in social and biological networks. Proc Natl Acad Sci U S A 99: , 7821–7826. |
[37] | Li Z , Shue F , Zhao N , Shinohara M , Bu G ((2020) ) APOE2: Protective mechanism and therapeutic implications for Alzheimer’s disease. Mol Neurodegener 15: , 63. |
[38] | De La Monte SM , Wands JR ((2005) ) Review of insulin and insulin-like growth factor expression, signaling, and malfunction in the central nervous system: Relevance to Alzheimer’s disease. J Alzheimers Dis 7: , 45–61. |
[39] | Hoyer S , Lee SK , Löffler T , Schliebs R ((2006) ) Inhibition of the neuronal insulin receptor an in vivo model for sporadic Alzheimer disease? Ann N Y Acad Sci 920: , 256–258. |
[40] | Labak M , Foniok T , Kirk D , Rushforth D , Tomanek B , Jasiński A , Grieb P ((2009) ) Metabolic changes in rat brain following intracerebroventricular injections of streptozotocin: A model of sporadic Alzheimer’s disease. Acta Neurochir Suppl 106: , 177. |
[41] | Lester-Coll N , Rivera EJ , Soscia SJ , Doiron K , Wands JR , De La Monte SM ((2006) ) Intracerebral streptozotocin model of type 3 diabetes: Relevance to sporadic Alzheimer’s disease J Alzheimers Dis 9: , 13–33. |
[42] | Schubert M , Gautam D , Surjo D , Ueki K , Baudler S , Schubert D , Kondo T , Alber J , Galldiks N , Küstermann E , Arndt S , Jacobs AH , Krone W , Ronald Kahn C , Brüning JC ((2004) ) Role for neuronal insulin resistance in neurodegenerative diseases. Proc Natl Acad Sci U S A 101: , 3100–3105. |
[43] | Doble BW , Woodgett JR ((2003) ) GSK-3: Tricks of the trade for a multi-tasking kinase. J Cell Sci 116: , 1175–1186. |
[44] | Henderson MX , Sengupta M , Trojanowski JQ , Lee VMY ((2019) ) Alzheimer’s disease tau is a prominent pathology in LRRK2 Parkinson’s disease. Acta Neuropathol Commun 7: , 183. |
[45] | Funk N , Munz M , Ott T , Brockmann K , Wenninger-Weinzierl A , Kühn R , Vogt-Weisenhorn D , Giesert F , Wurst W , Gasser T , Biskup S ((2019) ) The Parkinson’s disease-linked Leucine-rich repeat kinase 2 (LRRK2) is required for insulin-stimulated translocation of GLUT4. Sci Rep 9: , 4515. |
[46] | Pearson-Leary J , McNay EC ((2016) ) Novel roles for the insulin-regulated glucose transporter-4 in hippocampally dependent memory. J Neurosci 36: , 11851–11864. |
[47] | Ohta E , Kawakami F , Kubo M , Obata F ((2011) ) LRRK2 directly phosphorylates Akt1 as a possible physiological substrate: Impairment of the kinase activity by Parkinson’s disease-associated mutations. FEBS Lett 585: , 2165–2170. |
[48] | Oliveira JM , Henriques AG , Martins F , Rebelo S , Da Cruz E Silva OAB ((2015) ) Amyloid-β modulates both AβPP and tau phosphorylation. J Alzheimers Dis 45: , 495–507. |
[49] | Oliveira J , Costa M , De Almeida MSC , Da Cruz E Silva OAB , Henriques AG ((2017) ) Protein phosphorylation is a key mechanism in Alzheimer’s disease. J Alzheimers Dis 58: , 953–978. |
[50] | Jolivalt CG , Lee CA , Beiswenger KK , Smith JL , Orlov M , Torrance MA , Masliah E ((2008) ) Defective insulin signaling pathway and increased glycogen synthase kinase-3 activity in the brain of diabetic mice: Parallels with Alzheimer’s disease and correction by insulin. J Neurosci Res 86: , 3265–3274. |
[51] | Stöhr O , Schilbach K , Moll L , Hettich MM , Freude S , Wunderlich FT , Ernst M , Zemva J , Brüning JC , Krone W , Udelhoven M , Schubert M ((2013) ) Insulin receptor signaling mediates APP processing and β-amyloid accumulation without altering survival in a transgenic mouse model of Alzheimer’s disease. Age (Dordr) 35: , 83–101. |
[52] | Son SM , Song H , Byun J , Park KS , Jang HC , Park YJ , Mook-Jung I ((2012) ) Altered APP processing in insulin-resistant conditions is mediated by autophagosome accumulation via the inhibition of mammalian target of rapamycin pathway. Diabetes 61: , 3126–3138. |
[53] | Beecham GW , Martin ER , Li YJ , Slifer MA , Gilbert JR , Haines JL , Pericak-Vance MA ((2009) ) Genome-wide association study implicates a chromosome 12 risk locus for late-onset Alzheimer disease. Am J Hum Genet 84: , 35–43. |
[54] | Sultana R , Shrestha A , Lee CC , Ogundele OM ((2020) ) Disc1 carrier mice exhibit alterations in neural pIGF-1Rβ and related kinase expression. Front Cell Neurosci 14: . |
[55] | Axenhus M , Winblad B , Tjernberg LO , Schedin-Weiss S ((2020) ) Huntingtin levels are elevated in hippocampal post-mortem samples of Alzheimer’s disease brain. Curr Alzheimer Res 17: , 858–867. |
[56] | Chaves G , Stanley J , Pourmand N ((2019) ) Mutant Huntingtin affects Diabetes and Alzheimer’s markers in human and cell models of Huntington’s disease. Cells 8: , 962. |
[57] | Kheiri G , Dolatshahi M , Rahmani F , Rezaei N ((2019) ) Role of p38/MAPKs in Alzheimer’s disease: Implications for amyloid beta toxicity targeted therapy. Rev Neurosci 30: , 9–30. |
[58] | Parsons SJ , Parsons JT ((2004) ) Src family kinases, key regulators of signal transduction. Oncogene 23: , 7906–7909. |
[59] | Larson M , Sherman MA , Amar F , Nuvolone M , Schneider JA , Bennett DA , Aguzzi A , Lesné SE ((2012) ) The complex PrP(c)-Fyn couples human oligomeric Aβ with pathological tau changes in Alzheimer’s disease. J Neurosci 32: , 16857–16871a. |
[60] | Briner A , Götz J , Polanco JC ((2020) ) Fyn kinase controls tau aggregation in vivo. Cell Rep 32: , 108045. |
[61] | Yarza R , Vela S , Solas M , Ramirez MJ ((2016) ) c-Jun N-terminal kinase (JNK) signaling as a therapeutic target for Alzheimer’s disease. Front Pharmacol 6: , 321. |
[62] | Rebelo S , Domingues SC , Santos M , Fardilha M , Esteves SLC , Vieira SI , Vintém APB , Wu W , Da Cruz E Silva EF , Da Cruz E Silva OAB ((2013) ) Identification of a novel complex AβPP:Fe65:PP1 that regulates AβPP Thr668 phosphorylation levels. J Alzheimers Dis 35: , 761–775. |
[63] | Da Cruz E Silva OAB , Fardilha M , Henriques AG , Rebelo S , Vieira S , Da Cruz E Silva EF ((2004) ) Signal transduction therapeutics: Relevance for Alzheimer’s disease. J Mol Neurosci 23: , 123–142. |
[64] | Liu F , Grundke-Iqbal I , Iqbal K , Gong CX ((2005) ) Contributions of protein phosphatases PP1, PP2A, PP2B and PP5 to the regulation of tau phosphorylation. Eur J Neurosci 22: , 1942–1950. |
[65] | Braithwaite SP , Stock JB , Lombroso PJ , Nairn AC ((2012) ) Protein phosphatases and Alzheimer’s disease. Prog Mol Biol Transl Sci 106: , 343–379. |
[66] | Shonesy BC , Thiruchelvam K , Parameshwaran K , Rahman EA , Karuppagounder SS , Huggins KW , Pinkert CA , Amin R , Dhanasekaran M , Suppiramaniam V ((2012) ) Central insulin resistance and synaptic dysfunction in intracerebroventricular-streptozotocin injected rodents. Neurobiol Aging 33: , 430.e5–430.e18. |
[67] | Spinelli M , Fusco S , Grassi C ((2019) ) Brain insulin resistance and hippocampal plasticity: Mechanisms and biomarkers of cognitive decline. Front Neurosci 10: , 788. |


