
Is Amyloid Burden Measured by 18F-Flutemetamol PET Associated with Progression in Clinical Alzheimer’s Disease?
Abstract
Background:
Patients with Alzheimer’s disease (AD) show heterogeneity in clinical progression rate, and we have limited tools to predict prognosis. Amyloid burden from 18F-Flutemetamol positron emission tomography (PET), as measured by standardized uptake value ratios (SUVR), might provide prognostic information.
Objective:
We investigate whether 18F-Flutemetamol PET composite or regional SUVRs are associated with trajectories of clinical progression.
Methods:
This observational longitudinal study included 94 patients with clinical AD. PET images were semi-quantified with normalization to pons. Group-based trajectory modeling was applied to identify trajectory groups according to change in the Clinical Dementia Rating Scale Sum of Boxes (CDR-SB) over time. Multinomial logistic regression models assessed the association of SUVRs with trajectory group membership.
Results:
Three trajectory groups were identified. In the regression models, neither composite nor regional SUVRs were associated with trajectory group membership.
Conclusion:
There were no associations between CDR progression and 18F-Flutemetamol PET-derived composite SUVRs or regional SUVRs in clinical AD.
INTRODUCTION
Positron emission tomography (PET) imaging with tracers detecting fibrillary amyloid-β (Aβ), such as 18F-Flutemetamol, is used to assess the cortical Aβ burden in selected patients under evaluation of cognitive impairment [1]. Although visual binary classification is commonly used in clinical routine, semi-quantification is increasingly applied with standardized uptake value ratios (SUVR) representing a continuous measure of Aβ burden. The Aβ burden, together with other imaging and cerebrospinal fluid (CSF) biomarkers, are useful to support a clinical diagnosis, especially when Alzheimer’s disease (AD) is suspected [2, 3]. As suggested by the NIA-AA Research Framework, patients with a positive Aβ-PET are considered to be in the AD continuum [4], although it is emphasized that this approach is reserved for research. Previous studies state that the main value of Aβ-PET on a group level is the high negative predictive value [5–7]. However, research groups have recently assessed the usefulness of Aβ-PET imaging, demonstrating its value in terms of change in diagnosis [8, 9] and management [10].
Studies have shown contradictory results regarding the association between Aβ burden assessed by Aβ-PET imaging and clinical progression in patients with subjective cognitive decline (SCD) [11, 12]. To our knowledge, few studies have explored the association between 18F-Flutemetamol PET and clinical progression in symptomatic AD, which is important for patients typically encountered in memory clinics. Patients with AD show heterogeneity in the progression rate with a non-negligible proportion demonstrating rapid progression [13]. We and others have identified trajectory groups of clinical progression within memory clinic populations with different rates of progression and further recognized factors associated with progression rates, such as age, education, neuropsychiatric symptoms, and performance on cognitive tests [14, 15]. However, the identification of risk factors is a complex task, and we still have limited tools to predict the rate of clinical progression. Therefore, it is relevant to further explore risk factors of progression by assessing whether continuous measures of Aβ burden measured with PET are associated with the progression of cognitive and functional impairment.
This study aims to investigate if 18F-Flutemetamol PET SUVR is associated with trajectories of clinical progression, as assessed with changes in the Clinical Dementia Rating Scale Sum of Boxes (CDR-SB) in patients with clinical AD. We investigate whether composite SUVR, regional SUVRs, and visual assessment of the striatal region are associated with different cognitive trajectories.
METHODS
Study population
This observational longitudinal study included 94 patients assessed at the Memory Clinic of Oslo University Hospital, included in the Norwegian Registry of Persons assessed for Cognitive Symptoms (NorCog). All patients underwent 18F-Flutemetamol PET/CT according to clinical judgement by the responsible physician and according to the appropriate use criteria for amyloid-PET [1]. Participants were deemed to have sufficient cognitive capacity to consent at the time of inclusion. The Regional Ethics Committee for medical research in the South-East of Norway (REK 2017/1929) and the data protection officer at OUH approved the study. The study was conducted according to the Helsinki Declaration.
Clinical assessment
At baseline, as a part of the clinical routine, all patients were evaluated following the extensive NorCog research protocol [16] with demographic information, comorbidities, symptoms, and daily medication use. Cognitive and functional abilities were determined by a test battery including the following: Mini-Mental State Examination (MMSE) (0–30; lower values signify greater cognitive impairment), Clock Drawing Test (pathological cut-off ≤3/5 points), Trail Making Tests (TMT) A and B (pathological if ≥2 standard deviations [SD] below age-adjusted cut-off), Consortium to Establish a Registry of Alzheimer’s Disease (CERAD) 10-item word list and constructional praxis exercise, animal-naming test, Controlled Oral Word Association Test (COWAT-FAS test), 15-word short of the Boston Naming Test (BNT), Lawton Instrumental Activities of Daily Living Scale (IADL), and Physical Self-Maintenance Scale (PSMS). In addition, the patients underwent a physical examination, blood sampling, and magnetic resonance imaging (MRI) of the brain (n = 87). Using the results of this extensive work-up, a researcher (THE, experienced clinician) determined the diagnosis post hoc according to the diagnostic criteria of the National Institute on Aging and the Alzheimer’s Association [2, 3].
Assessment of clinical progression
To assess the clinical stage, at baseline and each follow-up examination, the CDR [17] was scored post hoc by a certified researcher, using all available information from the patients’ records. The CDR-SB [18, 19] (0–18; higher scores indicate more severe impairment) sum up the scores 0, 0.5, 1, 2, or 3 in the categories: memory, orientation, judgment and problem-solving, community affairs and home, and hobbies, as well as the scores 0, 1, 2, or 3 in the category personal care [20]. The baseline CDR-SB was based on the clinical evaluation closest to the PET examination (mean 63 days before PET, range –222–233), and the follow-up examinations were at varying time intervals, according to clinical judgment.
18F-Flutemetamol PET CT acquisition
All patients were examined with a Siemens Biograph40 mCT PET scanner (Siemens Healthineers, Erlangen, Germany). The standard protocol applied for all patients included an injection of 185 MBq 18F-Flutemetamol, image acquisition after 90 min, and an acquisition time of 20 min. PET was acquired with four frames of 5 min, and a low-dose CT was performed for attenuation correction and anatomic information (120 kV, 70 mAs, and with a slice thickness of 3 mm). 3D dynamic emission data were reconstructed using a resolution recovery algorithm with time of flight (TrueX with two iterations, 21 subsets, and a Gaussian filter with a full width half maximum [FWHM] of 2 mm and a matrix size of 400×400). The slice thickness of the reconstructed image series was 2 mm.
18F-Flutemetamol PET CT image analyses
All PET images were visually binary classified, blinded to all clinical information by one experienced reader (EGM), and compared to the clinical image report. If disagreement, a third reader (MER) classified the images, and this classification was used in the analyses. There was an excellent agreement of 97.9%with Cohens κ= 0.925 (p < 0.001) between readers. Global visual classifications were performed according to the validated reader program supplied by the manufacturer [21], and all readers had completed the online training program. An additional visual classification was performed for each of the abovementioned individual regions in each hemisphere. Only the visually classified striatal region was used for this study as this region is not included in the CortexID semi-quantification.
All images were semi-quantified using CortexID (AW server, version 3.2, GE Healthcare). This software provides regional SUVRs from eight cortical regions (prefrontal, anterior cingulate, precuneus/posterior cingulate, parietal, lateral temporal, occipital, sensorimotor, temporal mesial) in each hemisphere as well as a composite SUVR as a continuous measure of global amyloid burden. SUVR was normalized to pons.
Statistical analyses
Analyses were performed using Stata/IC 15.1 (StataCorp LLC 2018, Stata Statistical Software, revision 17 December 2018, College Station, TX, USA). The baseline characteristics were described by summary statistics (means and proportions).
The clinical progression trajectories were based on baseline CDR-SB and change in CDR-SB over time using group-based trajectory modeling [22], in Stata package traj [23]. Often, mixed models are used for analyses of longitudinal data, but we opted for GBTM due to its advantage of grouping those with similar development, without constructing categories a priori. This allows the groups to have different starting points and courses of development [22]. GBTM is a latent class modelling method that is simpler to interpret than growth mixture modelling, but with the same advantages as it is flexible, allowing time-varying covariates and partially missing data [24]. The number and shapes of the trajectory groups were decided based on the goodness of fit assessed by the Bayesian information criterion (BIC), the posterior probability of group membership (at least ≥0.7), the odds of correct classification (at least five in each group), class size, and clinical usefulness.
Firstly, univariate multinomial logistic regression models assessed the association of global and striatal visual classification as well as composite and regional SUVR with trajectory group membership. Next, we performed a multivariate multinomial logistic regression model assessing the association between the composite SUVR and trajectory group membership, adjusted for age, sex, and education. In these regression models, the SUVRs were included as continuous values, resulting in some of the effect sizes being on the extreme, although without statistical significance. Therefore, we performed the same multinomial logistic regression models with standardized SUVR values, which did not change the p-values. In a sensitivity analysis to assess the robustness of the findings, we additionally adjusted for the result of MMSE and TMT-A according to results from a progression study by an associated research group [14]. Furthermore, as a sensitivity analysis, we applied a linear mixed effect regression model with CDR-SB as the dependent variable and SUVR x time, SUVR, age, years of education and sex as fixed effects. Random effects included intercept and time. The goodness of fit between these multivariate multinomial logistic regression models, including patients without missing variables (n = 85), was assessed using a likelihood ratio test. The level of significance of all tests was set at p value ≤0.05.
RESULTS
Patients were injected with a mean of 187 (SD 7.8, range 164–213) MBq 18F-Flutemetamol. The mean image delay time was 91 (SD, 6.8, range 75–123) min. Acquisition time was 20 min for all. All patients had clinical AD, of which 39%had AD mixed with cerebrovascular disease. Patient characteristics are listed in Table 1.
Table 1
Descriptive statistics of all patients and by trajectory group
| Variables | All (n = 94) | Group 1 (n = 39) | Group 2 (n = 28) | Group 3 (n = 27) |
| Age, mean (SD) | 69.1 (6.9) | 67.1 (7.1) | 69.9 (7.5) | 71.1 (5.2) |
| Female, n (%) | 51 (54.3) | 19 (48.7) | 18 (64.3) | 14 (51.9) |
| Education, mean (SD) | 13 (3.4) | 14.1 (3.6) | 12.8 (3.1) | 11.8 (2.9) |
| Diagnosis, n (%) | ||||
| MCI | 28 (29.8) | 24 (61.5) | 3 (10.7) | 1 (3.7) |
| Dementia | 66 (70.2) | 15 (38.5) | 25 (89.3) | 26 (96.3) |
| MMSE, mean (SD) (n = 89) | 24.4 (4.5) | 27.0 (2.3) | 24.9 (3.1) | 19.9 (4.8) |
| TMT-A better than –2 SD, n (%) (n = 89) | 59 (66.3) | 32 (88.9) | 17 (65.4) | 10 (37.0) |
| TMT-B better than –2 SD, n (%) (n = 89) | 46 (51.7) | 29 (80.6) | 13 (50.0) | 4 (14.8) |
| CDT≥4/5 points, n (%) (n = 92) | 53 (57.6) | 30 (79.0) | 17 (60.7) | 6 (23.1) |
| CDR-SB, mean (SD) | 4.0 (2.6) | 2.0 (0.9) | 3.7 (1.2) | 7.1 (2.5) |
| CDR-SB, annual change (SE) | 0.70 (0.2) | 0.33 (0.1) | 1.53 (0.2) | 2.70 (0.2) |
| Visually positive PET, n (%) | 77 (81.9) | 31 (79.5) | 23 (82.1) | 23 (85.2) |
| Composite SUVR, mean (SD) | 0.70 (0.15) | 0.68 (0.15) | 0.71 (0.14) | 0.73 (0.17) |
The table presents valid means and valid percentages. CDR, Clinical Dementia Rating scale; SB, sum of boxes; CDT, Clock Drawing Test; n, number; SD, standard deviation; SE, standard error; MCI, mild cognitive impairment; MMSE, Mini Mental State Examination; SUVR, standardized uptake value ratio; TMT, Trail Making Test.
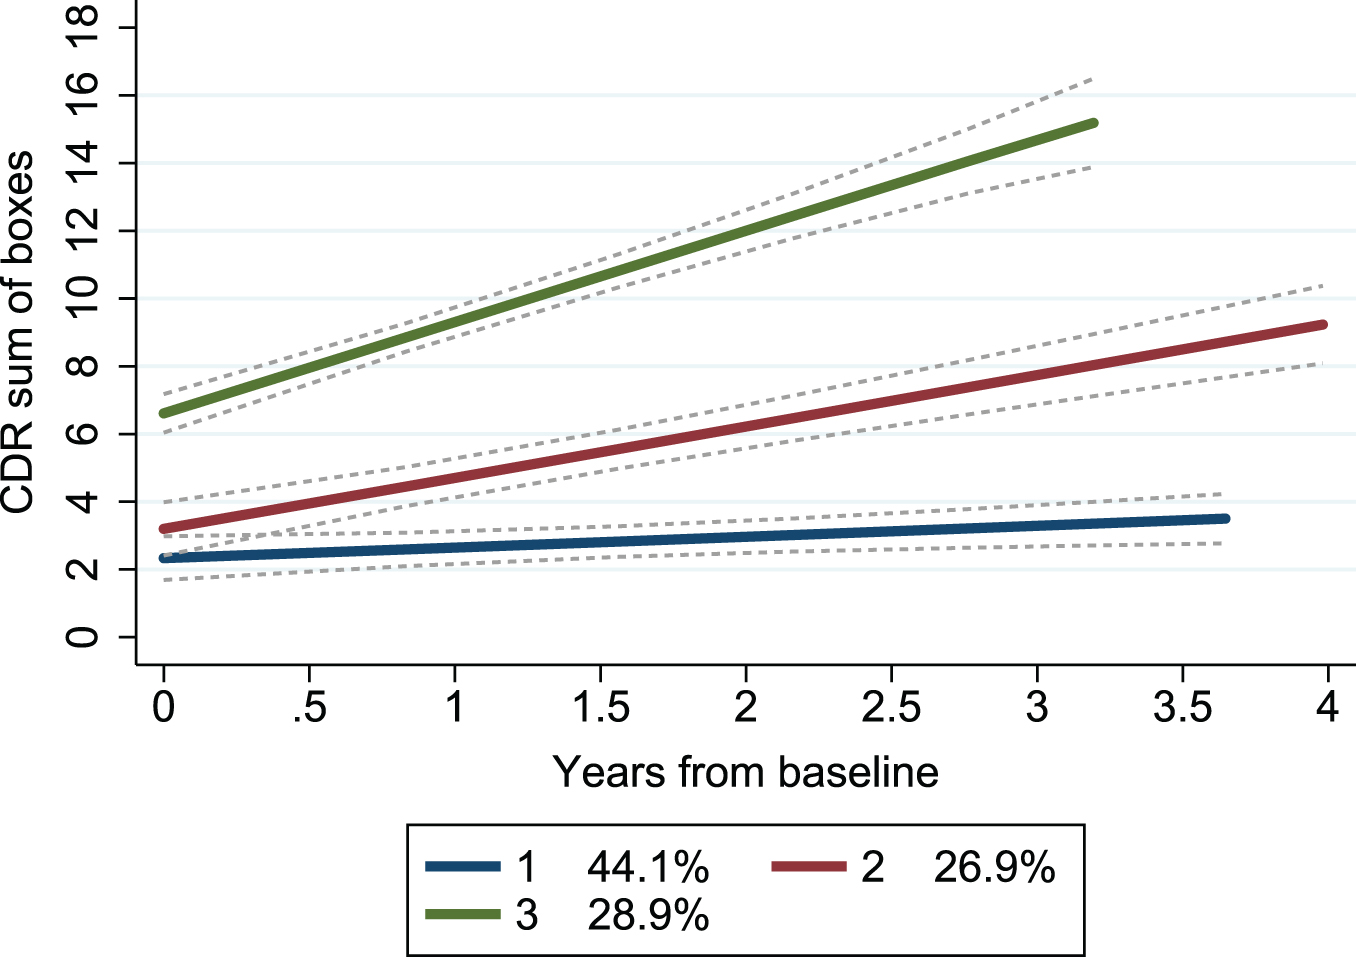
By applying group-based trajectory modeling on CDR-SB obtained at repeated follow-ups (mean 3.8, SD 1.5, range 2–8) over a mean period of 2.1 (range 0.3–4.5) years, we found that a model with three trajectory groups best described the heterogeneity in the progression rate. Both linear and quadratic trajectories were modelled, with almost identical BIC, and for simplicity the linear trajectory was used. Each trajectory group showed a different baseline CDR-SB and annual change (Table 1). A model with four trajectory groups showed favorable BIC but resulted in one group having only 10 patients and thus was deemed less suitable (details displayed in Supplementary Table 1). The trajectories mainly showed non-overlapping confidence intervals, indicating a good fit (Fig. 1).
Fig. 1
Trajectory groups according to change in clinical dementia rating scale over time. Group-based trajectory modeling, with the trajectory shapes 1 1 1 (1 = linear). Group 1 (blue); number of patients (n) = 39, the posterior probability of group membership = 0.90 and the odds of correct classification = 13.4. Group 2 (red); n = 28, the posterior probability of group membership = 0.79 and the odds of correct classification = 9.0. Group 3 (green); n = 27, the posterior probability of group membership = 0.97 and the odds of correct classification = 83.3. The stippled lines are the confidence intervals of the trajectory groups. Percentages are proportion of the patients established by the maximum probability assignment rule. CDR, Clinical Dementia Rating scale.
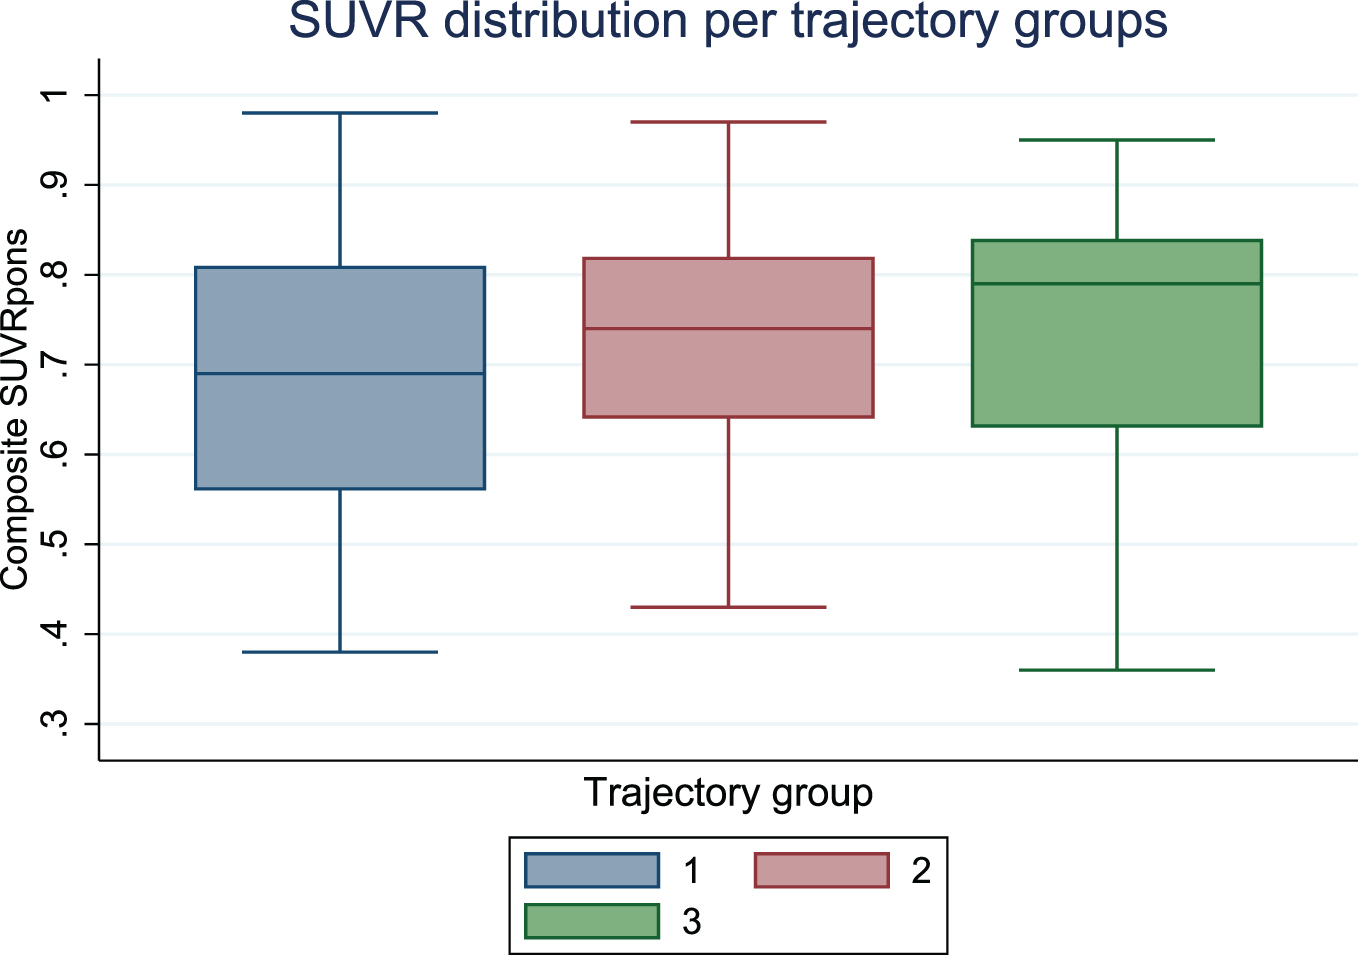
Graphical depiction of SUVR showed a similar distribution in the three trajectory groups (Fig. 2).
Fig. 2
Boxplot displaying distribution of standardized uptake value ratios (SUVR) by trajectory group.
In the univariate multinomial logistic regression models, neither the composite SUVR, the regional SUVRs nor the global or striatal visual classification was associated with trajectory group membership (data not shown).
In the multivariate multinomial logistic regression model, adjusted for age, sex, and education, the global amyloid burden measured by composite SUVR was not associated with membership in any of the trajectory groups (Table 2A). Neither the mixed model sensitivity analysis showed any association between SUVR at baseline and decline on the CDR-SB over time (data not shown). Furthermore, in the multivariate multinomial logistic regression sensitivity analysis, including patients without missing variables (n = 85), lower MMSE scores, and worse performance on the TMT-A were associated with rapid clinical progression (Table 2B). By including the MMSE and TMT-A the goodness of fit of the model improved significantly (p < 0.001).
Table 2A
Multivariate multinomial logistic regression model assessing trajectory-group membership by amyloid burden
| n = 94 | Group 2 versus group 1 | Group 3 versus group 1 | pseudo R2 0.07 | ||||
| RRR | 95%CI | p | RRR | 95%CI | p | ||
| Composite SUVR | 5.87 | 0.20, 171.52 | 0.304 | 28.46 | 0.67, 1201.33 | 0.080 | |
| Age | 1.06 | 0.98, 1.15 | 0.124 | 1.09 | 1.00, 1.18 | 0.047 | |
| Sex | |||||||
| female | 1 | 1 | |||||
| Male | 0.61 | 0.21, 1,75 | 0.355 | 1.13 | 0.38, 3.39 | 0.830 | |
| Education | 0.90 | 0.76, 1.06 | 0.204 | 0.80 | 0.67, 0.96 | 0.016 | |
Bold values highlight significant differences (p≤0.05). n, number of patients; RRR, relative risk ratio; CI, confidence interval; SUVR, standardized uptake value ratio
Table 2B
Multivariate multinomial logistic regression model assessing trajectory-group membership by amyloid burden
| n = 85 | Group 2 versus group 1 | Group 3 versus group 1 | pseudo R2 0.32 | ||||
| RRR | 95%CI | p | RRR | 95%CI | p | ||
| Composite SUVR | 4.02 | 0.05, 310.13 | 0.531 | 0.37 | 0.00, 106.20 | 0.731 | |
| Age | 1.07 | 0.97, 1.18 | 0.153 | 1.12 | 0.97, 1.28 | 0.112 | |
| Sex | |||||||
| female | 1 | 1 | |||||
| male | 0.75 | 0.22, 2.54 | 0.644 | 0.64 | 0.12, 3.31 | 0.594 | |
| Education | 0.98 | 0.87, 1.19 | 0.847 | 1.00 | 0.77, 1.29 | 0.997 | |
| MMSE | 0.83 | 0.66, 1.03 | 0.092 | 0.56 | 0.43, 0.75 | <0.001 | |
| TMT-A | 0.27 | 0.65, 1.13 | 0.074 | 0.12 | 0.22, 0.69 | 0.017 | |
Bold values highlight significant differences (p≤0.05). n, number of patients; RRR, relative risk ratio; CI, confidence interval; MMSE, Mini Mental State Examination; SUVR, standardized uptake value ratio; TMT-A, Trail Making Test A.
DISCUSSION
We found no association between the cerebral Aβ burden measured with 18F-Flutemetamol PET and the progression rate in clinically diagnosed AD (MCI or dementia stage). Neither global Aβ burden measured by composite SUVR, regional Aβ burden measured by SUVR in 16 cortical regions, nor the visual classification of striatum was associated with the clinical progression rate. In the sensitivity analysis, more severe cognitive impairment, measured by the MMSE and TMT-A, showed an association with the trajectory group membership. Moreover, by including clinical markers alongside demographic markers, the goodness of fit of the model improved significantly (p < 0.001).
Accumulation of Aβ in the brain begins years before clinically evident AD [25, 26], and a substantial Aβ burden might have already been established at the time of diagnosis. Still, results are inconsistent with regard to the association between amyloid burden and the progression rate, even in the preclinical phase. One study on individuals with SCD did show that higher Aβ load, measured by 18F-Florbetapir PET, was associated with a more rapid decline in delayed recall (memory domain) and also attention, executive function, and language [12]. On the contrary, another study in patients with SCD found no association between positive/negative 18F-Florbetapir PET and changes in MMSE or CDR after 30 months, further concluding that Aβ burden alone was not able to predict progression to prodromal AD [11]. The role of biomarkers on conversion from amnestic MCI to probable AD has also been explored with results from one study showing that a positive 18F-Flutemetamol PET, both alone and in combination with other biomarkers and cognitive status, is associated with a higher risk of progression [8]. Conversely, the influence of CSF Aβ42 level on clinical progression rate has also been investigated and recent studies have found no associations [27, 28]. The latter study supports our findings due to the previously demonstrated high correlation between Aβ burden measured by PET and CSF Aβ42 [29]. When interpreting these conflicting results, it should be noted that the length of follow-up may impact the predictive ability of Aβ-PET on conversion from MCI to AD [30].
Markers of neurodegeneration, such as pathological CSF levels of total tau (t-tau) or phosphorylated tau181 (p-tau) have been indicated to be closely associated with rapid progression [28, 31–33]. Tau-PET patterns using 18F-Flortaucipir have also been associated with clinical progression as assessed with changes in CDR over 18 months [34]. Moreover, p-tau in plasma was recently investigated and had a high association with cognitive decline [35], making this biomarker a promising, less invasive tool for estimating progression rate. It should be noted that in a recent study, CSF tau was associated with clinical progression in APOE ɛ4 allele carriers only [27], indicating that the association between tau and APOE ɛ4 genotypes in AD is not completely understood.
The demonstrated lack of association between Aβ-PET and clinical progression in this study indicates that amyloid is less likely to be the main contributor to the progression rate in clinical AD. In the present study, 17 patients (18%) had no evidence of increased cortical uptake of 18F-Flutemetamol, which is in concordance with previous autopsy studies demonstrating the lack of AD neuropathological changes in 10-30%of patients with clinical AD symptomatology [36]. Another complicating factor is that the tolerated amyloid burden seems to vary between patients [37]. Lately, the amyloid theory has also received criticism and anti-amyloid therapies have so far failed to meet the clinical endpoints [38, 39]. Consequently, the recent approval by the US Food and Drug Administration (FDA) of one of the anti-amyloid drugs, Aducanumab, has posed concerns and is currently debated [40]. Patients with clinical AD often have co-pathologies [41] probably affecting the progression rate. Furthermore, the term Alzheimer’s disease is used to define different entities, such as the typical clinical symptoms, typical biomarker profiles, or a combination, hampering the comparison of studies. Consequently, it is challenging to determine if, and what combinations of, biomarkers are suitable for estimating progression rate in AD patients. This is partly due to conflicting evidence but also due to the use of different measures of clinical progression, clinical stage of patients included, length of follow-up, and statistical methods used to model progression.
In the sensitivity analysis, we found that a worse score on the MMSE and TMT-A at baseline was associated with rapid progression rate. By including clinical markers alongside demographic markers, the goodness of fit of the model improved significantly. A study on MCI found that a prediction model including demographic and clinical markers (age, education, MMSE, APOE), MRI volumes, and Aβ-PET (positive/negative) was best at predicting conversion to AD-dementia [7]. More advanced cognitive decline has previously been linked to rapid progression [15, 42, 43]. Furthermore, memory decline has been found to be superior compared to the CSF p-tau/Aβ42 ratio at predicting progression from MCI to AD dementia [44]. Ultimately, the stage of disease and demographics provide valuable information in the estimation of progression. Thus, the combination of clinical information and biomarkers seems to be the optimal approach to estimate progression [8].
We chose to apply group-based trajectory modeling to identify individuals with similar clinical development as this method is robust to differences in starting points. This is beneficial because AD has an insidious onset and patients seek medical attention at various stages of cognitive and functional impairment [45]. Nevertheless, it should not be neglected that group-based trajectory modeling is an explorative method [22], and the trajectory groups cannot be considered as real entities. The present study includes thorough clinical assessments performed in a naturalistic memory clinic cohort. All AD diagnoses were based on internationally accepted diagnostic criteria, where biomarkers are used only for support. The patients were recruited from a memory clinic population and are highly selected, considering the whole population of people living with AD. We do, however, believe our results are transferrable to other memory clinic populations consisting of patients with clinical AD. PET examinations were performed in a standardized manner with very few variations in examination parameters. No strict consensus has been reached as to which reference region should be used in semi-quantification and pons was applied due to local tradition. A high non-specific uptake of 18F-Flutemetamol in white matter combined with atrophy may cause partial volume effects, which are not corrected for during semi-quantification with CortexID. However, CortexID SUVRs have been shown to have a high linear correlation with SUVRs based on segmented grey matter from the patients' own volumetric MRI with additional partial volume correction [46]. The high interrater agreement in visual classifications reflects a robust method, and semi-quantification was performed with widely used software.
CONCLUSION
This longitudinal study on patients with clinical AD showed no association between trajectory groups of CDR progression and 18F-Flutemetamol PET-derived composite SUVR, regional SUVRs, or visually positive striatal region. However, more advanced cognitive impairment as measured by MMSE and TMT-A was associated with rapid clinical progression. Combining clinical markers, demographics, and biomarkers is likely superior to Aβ-PET alone in estimating progression rates in clinical AD.
ACKNOWLEDGMENTS
The authors would like to acknowledge NorCog for providing access to the patient data, Civitan Norway Research Foundation for Alzheimer's disease and the Norwegian Health Association, for supporting the research project. Funding resources were not involved in any part of conducting the study or manuscript preparation.
Authors’ disclosures available online (https://www.j-alz.com/manuscript-disclosures/21-5046r1).
SUPPLEMENTARY MATERIAL
[1] The supplementary material is available in the electronic version of this article: https://dx.doi.org/10.3233/JAD-215046.
REFERENCES
[1] | Johnson KA , Minoshima S , Bohnen NI , Donohoe KJ , Foster NL , Herscovitch P , Karlawish JH , Rowe CC , Carrillo MC , Hartley DM , Hedrick S , Pappas V , Thies WH ((2013) ) Appropriate use criteria for amyloid PET: A report of the Amyloid Imaging Task Force, the Society of Nuclear Medicine and Molecular Imaging, and the Alzheimer’s Association. Alzheimers Dement 9: , e-1–16. |
[2] | Albert MS , DeKosky ST , Dickson D , Dubois B , Feldman HH , Fox NC , Gamst A , Holtzman DM , Jagust WJ , Petersen RC , Snyder PJ , Carrillo MC , Thies B , Phelps CH ((2011) ) The diagnosis of mild cognitive impairment due to Alzheimer’s disease: Recommendations from the National Institute on Aging-Alzheimer’s Association workgroups on diagnostic guidelines for Alzheimer’s disease. Alzheimers Dement 7: , 270–279. |
[3] | McKhann GM , Knopman DS , Chertkow H , Hyman BT , Jack CR , Kawas CH , Klunk WE , Koroshetz WJ , Manly JJ , Mayeux R , Mohs RC , Morris JC , Rossor MN , Scheltens P , Carrillo MC , Thies B , Weintraub S , Phelps CH ((2011) ) The diagnosis of dementia due to Alzheimer’s disease: Recommendations from the National Institute on Aging-Alzheimer’s Association workgroups on diagnostic guidelines for Alzheimer’s disease. Alzheimers Dement 7: , 263–269. |
[4] | Jack CR Jr. , Bennett DA , Blennow K , Carrillo MC , Dunn B , Haeberlein SB , Holtzman DM , Jagust W , Jessen F , Karlawish J , Liu E , Molinuevo JL , Montine T , Phelps C , Rankin KP , Rowe CC , Scheltens P , Siemers E , Snyder HM , Sperling R ((2018) ) NIA-AA Research Framework: Toward a biological definition of Alzheimer’s disease. Alzheimers Dement 14: , 535–562. |
[5] | Grill JD , Apostolova LG , Bullain S , Burns JM , Cox CG , Dick M , Hartley D , Kawas C , Kremen S , Lingler J , Lopez OL , Mapstone M , Pierce A , Rabinovici G , Roberts JS , Sajjadi SA , Teng E , Karlawish J ((2017) ) Communicating mild cognitive impairment diagnoses with and without amyloid imaging. Alzheimers Res Ther 9: , 35. |
[6] | Chiotis K , Saint-Aubert L , Boccardi M , Gietl A , Picco A , Varrone A , Garibotto V , Herholz K , Nobili F , Nordberg A ((2017) ) Clinical validity of increased cortical uptake of amyloid ligands on PET as a biomarker for Alzheimer’s disease in the context of a structured 5-phase development framework. Neurobiol Aging 52: , 214–227. |
[7] | van Maurik IS , van der Kall LM , de Wilde A , Bouwman FH , Scheltens P , van Berckel BNM , Berkhof J , van der Flier WM ((2019) ) Added value of amyloid PET in individualized risk predictions for MCI patients. Alzheimers Dement (Amst) 11: , 529–537. |
[8] | Wolk DA , Sadowsky C , Safirstein B , Rinne JO , Duara R , Perry R , Agronin M , Gamez J , Shi J , Ivanoiu A , Minthon L , Walker Z , Hasselbalch S , Holmes C , Sabbagh M , Albert M , Fleisher A , Loughlin P , Triau E , Frey K , Hogh P , Bozoki A , Bullock R , Salmon E , Farrar G , Buckley CJ , Zanette M , Sherwin PF , Cherubini A , Inglis F ((2018) ) Use of Flutemetamol F 18-labeled positron emission tomography and other biomarkers to assess risk of clinical progression in patients with amnestic mild cognitive impairment. JAMA Neurol 75: , 1114–1123. |
[9] | Altomare D , Caprioglio C , Assal F , Allali G , Mendes A , Ribaldi F , Ceyzeriat K , Martins M , Tomczyk S , Stampacchia S , Dodich A , Boccardi M , Chicherio C , Frisoni GB , Garibotto V ((2021) ) Diagnostic value of amyloid-PET and tau-PET: A head-to-head comparison. Eur J Nucl Med Mol Imaging 48: , 2200–2211. |
[10] | Rabinovici GD , Gatsonis C , Apgar C , Chaudhary K , Gareen I , Hanna L , Hendrix J , Hillner BE , Olson C , Lesman-Segev OH , Romanoff J , Siegel BA , Whitmer RA , Carrillo MC ((2019) ) Association of amyloid positron emission tomography with subsequent change in clinical management among medicare beneficiaries with mild cognitive impairment or dementia. JAMA 321: , 1286–1294. |
[11] | Dubois B , Epelbaum S , Nyasse F , Bakardjian H , Gagliardi G , Uspenskaya O , Houot M , Lista S , Cacciamani F , Potier MC , Bertrand A , Lamari F , Benali H , Mangin JF , Colliot O , Genthon R , Habert MO , Hampel H ((2018) ) Cognitive and neuroimaging features and brain beta-amyloidosis in individuals at risk of Alzheimer’s disease (INSIGHT-preAD): A longitudinal observational study. Lancet Neurol 17: , 335–346. |
[12] | Timmers T , Ossenkoppele R , Verfaillie SCJ , van der Weijden CWJ , Slot RER , Wesselman LMP , Windhorst AD , Wolters EE , Yaqub M , Prins ND , Lammertsma AA , Scheltens P , van der Flier WM , van Berckel BNM ((2019) ) Amyloid PET and cognitive decline in cognitively normal individuals: The SCIENCe project. Neurobiol Aging 79: , 50–58. |
[13] | Melis RJF , Haaksma ML , Muniz-Terrera G ((2019) ) Understanding and predicting the longitudinal course of dementia. Curr Opin Psychiatry 32: , 123–129. |
[14] | Edwin TH , Strand BH , Persson K , Engedal K , Selbæk G , Knapskog AB ((2020) ) Trajectories and risk factors of dementia progression: Amemory clinic cohort followed up to 3 years from diagnosis. IntPsychogeriatr 33: , 779–789. |
[15] | Haaksma ML , Calderón-Larrañaga A , Olde Rikkert MGM , Melis RJF , Leoutsakos J-MS ((2018) ) Cognitive and functional progression inAlzheimer disease: A prediction model of latent classes. Int JGeriatr Psychiatry 33: , 1057–1064. |
[16] | Braekhus A , Ulstein I , Wyller TB , Engedal K ((2011) ) The Memory Clinic–outpatient assessment when dementia is suspected. Tidsskr Nor Laegeforen 131: , 2254–2257. |
[17] | Hughes CP , Berg L , Danziger W , Coben LA , Martin RL ((1982) ) A new clinical scale for the staging of dementia. Br J Psychiatry 140: , 566–572. |
[18] | O’Bryant SE , Waring SC , Cullum CM , Hall J , Lacritz L , Massman PJ , Lupo PJ , Reisch JS , Doody R ((2008) ) Staging dementia using Clinical Dementia Rating Scale Sum of Boxes scores: A Texas Alzheimer’s research consortium study. Arch Neurol 65: , 1091–1095. |
[19] | Coley N , Andrieu S , Jaros M , Weiner M , Cedarbaum J , Vellas B ((2011) ) Suitability of the Clinical Dementia Rating-Sum of Boxes as a single primary endpoint for Alzheimer’s disease trials. Alzheimers Dement 7: , 602–610.e602. |
[20] | Morris JC ((1993) ) The Clinical Dementia Rating (CDR). Neurology 43: , 2412. |
[21] | Buckley CJ , Sherwin PF , Smith AP , Wolber J , Weick SM , Brooks DJ ((2017) ) Validation of an electronic image reader training programme for interpretation of [18F]flutemetamol beta-amyloid PET brain images. Nucl Med Commun 38: , 234–241. |
[22] | Nagin DS , Odgers CL ((2010) ) Group-based trajectory modeling in clinical research. Annu Rev Clin Psychol 6: , 109–138. |
[23] | Jones BL , Nagin DS ((2013) ) A note on a stata plugin for estimating group-based trajectory models. Sociol Methods Res 42: , 608–613. |
[24] | Nguena Nguefack HL , Pagé MG , Katz J , Choinière M , Vanasse A , Dorais M , Samb OM , Lacasse A ((2020) ) Trajectory modelling techniquesuseful to epidemiological research: A comparative narrative reviewof approaches. Clin Epidemiol 12: , 1205–1222. |
[25] | Jack CR Jr. , Knopman DS , Jagust WJ , Petersen RC , Weiner MW , Aisen PS , Shaw LM , Vemuri P , Wiste HJ , Weigand SD , Lesnick TG , Pankratz VS , Donohue MC , Trojanowski JQ ((2013) ) Tracking pathophysiological processes in Alzheimer’s disease: An updated hypothetical model of dynamic biomarkers. Lancet Neurol 12: , 207–216. |
[26] | Jack CR Jr. , Knopman DS , Jagust WJ , Shaw LM , Aisen PS , Weiner MW , Petersen RC , Trojanowski JQ ((2010) ) Hypothetical model of dynamic biomarkers of the Alzheimer’s pathological cascade. Lancet Neurol 9: , 119–128. |
[27] | Wattmo C , Blennow K , Hansson O ((2020) ) Cerebro-spinal fluid biomarker levels: Phosphorylated tau (T) and total tau (N) as markers for rate of progression in Alzheimer’s disease. BMC Neurol 20: , 10. |
[28] | Edwin TH , Henjum K , Nilsson LNG , Watne LO , Persson K , Eldholm RS , Saltvedt I , Halaas NB , Selbæk G , Engedal K , Strand BH , Knapskog AB ((2020) ) A high cerebrospinal fluid soluble TREM2 level is associated with slow clinical progression of Alzheimer’s disease. Alzheimers Dement (Amst) 12: , e12128. |
[29] | Muller EG , Edwin TH , Stokke C , Navelsaker SS , Babovic A , Bogdanovic N , Knapskog AB , Revheim ME ((2019) ) Amyloid-beta PET-Correlation with cerebrospinal fluid biomarkers and prediction of Alzheimer s disease diagnosis in a memory clinic. PLoS One 14: , e0221365. |
[30] | Ma Y , Zhang S , Li J , Zheng DM , Guo Y , Feng J , Ren WD ((2014) ) Predictive accuracy of amyloid imaging for progression from mild cognitive impairment to Alzheimer disease with different lengths of follow-up: A meta-analysis. [Corrected]. Medicine (Baltimore) 93: , e150. |
[31] | Degerman Gunnarsson M , Ingelsson M , Blennow K , Basun H , Lannfelt L , Kilander L ((2016) ) High tau levels in cerebrospinal fluid predict nursing home placement and rapid progression in Alzheimer’s disease. Alzheimers Res Ther 8: , 22. |
[32] | Mattsson N , Insel PS , Palmqvist S , Portelius E , Zetterberg H , Weiner M , Blennow K , Hansson O ((2016) ) Cerebrospinal fluid tau, neurogranin, and neurofilament light in Alzheimer’s disease. EMBO Mol Med 8: , 1184–1196. |
[33] | Teipel S , Drzezga A , Grothe MJ , Barthel H , Chételat G , Schuff N , Skudlarski P , Cavedo E , Frisoni GB , Hoffmann W , Thyrian JR , Fox C , Minoshima S , Sabri O , Fellgiebel A ((2015) ) Multimodal imaging inAlzheimer’s disease: Validity and usefulness for early detection. Lancet Neurol 14: , 1037–1053. |
[34] | Lu M , Pontecorvo MJ , Devous MD Sr. , Arora AK , Galante N , McGeehan A , Devadanam C , Salloway SP , Doraiswamy PM , Curtis C , Truocchio SP , Flitter M , Locascio T , Devine M , Zimmer JA , Fleisher AS , Mintun MA , Collaborators A ((2021) ) Aggregated tau measured by visual interpretation of Flortaucipir positron emission tomography and the associated risk of clinical progression of mild cognitive impairment and Alzheimer disease: Results from 2 phase III clinical trials. JAMA Neurol 78: , 445–453. |
[35] | Simrén J , Leuzy A , Karikari TK , Hye A , Benedet AL , Lantero-Rodriguez J , Mattsson-Carlgren N , Schöll M , Mecocci P , Vellas B , Tsolaki M , Kloszewska I , Soininen H , Lovestone S , Aarsland D , Hansson O , Rosa-Neto P , Westman E , Blennow K , Zetterberg H , Ashton NJ ((2021) ) The diagnostic and prognostic capabilities of plasma biomarkers in Alzheimer’s disease. Alzheimers Dement 17: , 1145–1156. |
[36] | Nelson PT , Head E , Schmitt FA , Davis PR , Neltner JH , Jicha GA , Abner EL , Smith CD , Van Eldik LJ , Kryscio RJ , Scheff SW ((2011) ) Alzheimer’s disease is not “brain aging”: Neuropathological, genetic, and epidemiological human studies. Acta Neuropathol 121: , 571–587. |
[37] | Insel PS , Mattsson N , Mackin RS , Schöll M , Nosheny RL , Tosun D , Donohue MC , Aisen PS , Jagust WJ , Weiner MW ((2016) ) Accelerating rates of cognitive decline and imaging markers associated with β-amyloid pathology. Neurology 86: , 1887–1896. |
[38] | Selkoe DJ , Hardy J ((2016) ) The amyloid hypothesis of Alzheimer’s disease at 25 years. EMBO Mol Med 8: , 595–608. |
[39] | Ackley SF , Zimmerman SC , Brenowitz WD , Tchetgen Tchetgen EJ , Gold AL , Manly JJ , Mayeda ER , Filshtein TJ , Power MC , Elahi FM , Brickman AM , Glymour MM ((2021) ) Effect of reductions in amyloid levels on cognitive change in randomized trials: Instrumental variable meta-analysis. BMJ 372: , n156. |
[40] | de la Torre JC , Gonzalez-Lima F ((2021) ) The FDA approves Aducanumab for Alzheimer’s disease, raising important scientific questions. J Alzheimers Dis 82: , 881–882. |
[41] | Robinson JL , Richardson H , Xie SX , Suh E , Van Deerlin VM , Alfaro B , Loh N , Porras-Paniagua M , Nirschl JJ , Wolk D , Lee VM , Lee EB , Trojanowski JQ ((2021) ) The development and convergence of co-pathologies in Alzheimer’s disease. Brain 144: , 953–962. |
[42] | Song Y-N , Wang P , Xu W , Li J-Q , Cao X-P , Yu J-T , Tan L ((2018) ) Risk factors of rapid cognitive decline in Alzheimer’s disease and mild cognitive impairment: A systematic review and meta-analysis. J Alzheimers Dis 66: , 497–515. |
[43] | Tchalla AE , Clément JP , Saulnier I , Beaumatin B , Lachal F , Gayot C , Bosetti A , Desormais I , Perrochon A , Preux PM , Couratier P , Dantoine T ((2018) ) Predictors of rapid cognitive decline in patientswith mild-to-moderate Alzheimer disease: A prospective cohort studywith 12-month follow-up performed in memory clinics. DementGeriatr Cogn Disord 45: , 56–65. |
[44] | Landau SM , Harvey D , Madison CM , Reiman EM , Foster NL , Aisen PS , Petersen RC , Shaw LM , Trojanowski JQ , Jack CR Jr. , Weiner MW , Jagust WJ ((2010) ) Comparing predictors of conversion and decline in mild cognitive impairment. Neurology 75: , 230–238. |
[45] | Helvik AS , Engedal K , Šaltytė Benth J , Selbæk G ((2018) ) Time from symptom debut to dementia assessment by the specialisthealthcare service in Norway. Dement Geriatr Cogn Dis Extra 8: , 117–127. |
[46] | MüllerEG, StokkeC, StokmoHL, EdwinTH, KnapskogA-B, RevheimM-E ((2021) ) Evaluation of semi-quantitative measures of 18 F-Flutemetamol PET for the clinical diagnosis of Alzheimer’s disease. Quantitative Imaging in Medicine and Surgery 12: , 493–509. |


