
Site-Specific Cerebrospinal Fluid Tau Hyperphosphorylation in Response to Alzheimer’s Disease Brain Pathology: Not All Tau Phospho-Sites are Hyperphosphorylated
Abstract
Background:
Understanding patterns of association between CSF phosphorylated tau (p-tau) species and clinical disease severity will aid Alzheimer’s disease (AD) diagnosis and treatment.
Objective:
To evaluate changes in tau phosphorylation ratios to brain imaging (amyloid PET, [18F]GTP1 PET, and MRI) and cognition across clinical stages of AD in two different cohorts.
Methods:
A mass spectrometry (MS)-based method was used to evaluate the relationship between p-tau/tau phosphorylation ratios on 11 sites in CSF and AD pathology measured by tau PET ([18F]GTP1) and amyloid PET ([18F]florbetapir or [18F]florbetaben). Cohort A included cognitively normal amyloid negative (n = 6) and positive (n = 5) individuals, and amyloid positive prodromal (n = 13), mild (n = 12), and moderate AD patients (n = 10); and Cohort B included amyloid positive prodromal (n = 24) and mild (n = 40) AD patients.
Results:
In this cross-sectional analysis, we identified clusters of phosphosites with different profiles of phosphorylation ratios across stages of disease. Eight of 11 investigated sites were hyperphosphorylated and associated with SUVR measures from [18F]GTP1 and amyloid PET. Novel sites 111, 153, and 208 may be relevant biomarkers for AD diagnosis to complement tau hyperphosphorylation measures on previously established sites 181, 205, 217, and 231. Hypophosphorylation was detected on residues 175, 199, and 202, and was inversely associated with [18F]GTP1 and amyloid PET.
Conclusion:
Hyperphosphorylated and hypophosphorylated forms of tau are associated with AD pathologies, and due to their different site-specific profiles, they may be used in combination to assist with staging of disease.
INTRODUCTION
Amyloid-β (Aβ) plaques and neurofibrillary tangles (NFT) are key pathological features of Alzheimer’s disease (AD). Postmortem studies indicate that NFT density correlates more closely with neurodegeneration and cognitive impairment than Aβ plaque density [1]. NFTs within neuronal cell bodies are composed primarily of hyperphosphorylated tau [2]. Tau has over 80 potential phosphorylation sites [3], each with different influences on tau metabolism, conformation, and aggregation [4]. In AD, sequential alteration of tau phosphorylation epitopes likely precedes aggregation and formation of tau filaments [5].
Neuroimaging and cerebrospinal fluid (CSF) biomarkers related to AD neuropathology are increasingly used to aid clinical diagnosis and patient selection for therapeutic trials [6, 7]. Tau PET uptake typically correlates with clinical severity and poorer cognitive performance [8–13]. Tau PET measures suggest pathological tau begins to aggregate around the time of symptom onset [14–16]. CSF total tau (t-tau) and phosphorylated tau (p-tau) levels, which reflect the circulating pool of soluble tau released by central nervous system cells [17], may enable earlier assessment of tau abnormalities prior to the deposition of NFTs in brain parenchyma [18, 19]. Many different tau isoforms, including phosphorylated tau, exist and can be monitored in CSF [20–22]. However, it is unclear how soluble tau species reflect brain neuropathology. CSF levels of tau, p-tau181, and p-tau217 have been associated with brain tau deposition measured by PET [23–28]. Higher CSF tau levels are observed on threonine(T) 217, T181, and T231 at asymptomatic stage suggesting that soluble species and tau PET may be differentially related to pathology and clinical symptoms [29]. The relationship with tau aggregation of numerous other tau phosphorylated sites in CSF remains uninvestigated. Clarifying the relationships between tau pathology using tau PET and CSF tau phosphorylation status may identify alterations in tau metabolism that occur before and concurrently to tau aggregation.
Moreover, the increase in levels of CSF tau during the symptomatic phase of the AD continuum can contribute in part to the rise of phosphorylated tau isoforms. Indeed, CSF p-tau measures are rarely corrected from total tau variation, mitigating the attribution of high CSF p-tau level to only tau hyperphosphorylation as a consequence of abnormal brain metabolism and the presence of hyperphosphorylated tau aggregates. Mass spectrometry (MS) simultaneously quantifies phosphorylated and unphosphorylated peptides to enable calculation of the ratio of phosphorylated to unphosphorylated tau (p-tau/u-tau), thereby quantifying changes in tau phosphorylation ratios independently from variations in CSF tau levels. This approach has been already applied to the measure of one of the most abundant phosphorylated peptides in CSF. In particular, MS demonstrated that tau hyperphosphorylation at T217 was positively associated with abnormal amyloid status, as measured by PiB PET and MS CSF Aβ42/40 ratio, in both pre-clinical and mild AD [30] and more accurate in predicting amyloid load than hyperphosphorylation on other sites as T181 or T205 [31, 32]. A recent study confirmed better performance of p-tau/u-tau ratio on T217 levels in plasma for predicting amyloid load [33].
Overall, previous studies have highlighted the importance of considering alternative p-tau sites for AD diagnosis [34, 35]. A quantitative method was developed to simultaneously monitor CSF phosphorylation sites detectable by MS within the N-terminal and mid-region domains. These domains correspond to the most abundant CSF tau isoforms recovered by immunoprecipitation [22]. For the screening of a small CSF cohort including a dozen late-onset AD participants, we previously demonstrated that several p-tau/u-tau sites were hyperphosphorylated (T111, T153, T175, T205, S208, T217, and T231) or hypophosphorylated (S202), and were significantly modified with amyloid status [20]. Association of these phosphorylations with brain tau pathology, as measured by Tau PET ([18F]GTP1), in patients with close temporally paired CSF, has not been assessed. Expanding upon previous work, relationships between CSF tau phosphorylation (measured by MS at 11 phosphorylation sites) and underlying NFT pathology (measured by tau PET) were investigated in two separate cohorts of participants; the first cohort spanned cognitively normal to moderate AD, and the second cohort focused on prodromal to mild AD. We hypothesized, based on our previous results, that not all sites would be hyperphosphorylated in amyloid-positive AD patients. These analyses permitted an evaluation of the clinical utility of measuring site-specific phosphorylation by clarifying its association with Aβ PET imaging, tau PET ([18F]GTP1) structural MRI, and cognition in sporadic AD.
METHODS
Study design
Cohort A drew from patients enrolled in: study e0048 [36] evaluating the basic performance and reproducibility characteristics of [18F]GTP1 and an open-label observational study evaluating longitudinal change in [18F]GTP1 tau PET imaging in AD patients and cognitively normal (CN) controls (GN30009; NCT02640092) [11]. Cohort B included patients from a Phase II study that evaluated the efficacy and safety of semorinemab (GN39763; NCT03289143) in prodromal to mild Alzheimer’s disease [11, 37–39]. Amyloid PET, MRI scans, CSF, and cognitive data were also acquired in these studies. For Cohort B, assessments and samples were acquired at screening or baseline prior to dosing with semorinemab or placebo.
Participants
Cohort A was composed of CN, prodromal AD (i.e., mild cognitive impairment due to AD), and mild and moderate AD dementia participants from GN30009 (NCT02640092) and e0048, as previously described [11, 40]. In Cohort A, AD patients were required to have a positive [18F]florbetapir (FBP) Aβ PET scan by visual read. Cohort B from GN39763 (NCT03289143) included participants diagnosed with prodromal or mild AD who were between 50–80 years old, had Mini-Mental State Examination (MMSE) scores≥20, CDR = 0.5 or 1, Repeatable Battery for the Assessment of Neuropsychological Status (RBANS) Delayed Memory Index ≤85, and were Aβ positive by PET scan (FBP or florbetaben [FBB]; visual read) or CSF (Elecsys Aβ42≤1000 pg/mL). Each study was approved by each site’s institutional review board and was conducted in accordance with ICH E6 Guidelines. Written informed consent was obtained from all participants or their legal representatives.
CSF collection and analyses
CSF (up to 20 mL) was collected by lumbar puncture into polypropylene tubes, centrifuged at 2000×g for 10 min at room temperature, and transferred into 0.5 mL tubes that were frozen and stored at –80°C until analysis. CSF collection and [18F]GTP1 PET scans for Cohort A were separated by an average of 14.3±12.4 days (range: 0–64 days). CSF collection and [18F]GTP1 PET scans for Cohort B were separated by an average of 32.6±23.5 days (range: 0–111 days).
CSF tau species were captured by immunoprecipitation (IP) and analyzed using a high resolution MS quantitating multiple tau phosphorylation sites and their corresponding unphosphorylated peptide [20]. Tau from CSF (500μl) was extracted and immuno-purified with Tau1 and HJ8.5 antibodies as previously reported [17]. Briefly, 15N tau labeled standard was added to CSF sample prior to immuno-purification, and after overnight digestion with trypsin, AQUA peptides (Life Technologies, Carlsbad, CA) were spiked to obtain an amount of 5 fmol per labeled phosphorylated peptide and 50 fmol per labeled unmodified peptide in each sample. The peptide mixture was purified by solid phase extraction. Eluates were dried and resuspend in MS vials prior nanoLC-MS/HRMS analysis on nanoAcquity UPLC system (Waters, Mildford, Massachusetts) coupled to a Lumos Tribrid MS (Thermo Scientific, San Jose, CA) as reported [20].
MS/HRMS transitions were extracted using Skyline software (MacCoss laboratory, University of Washington). CSF tau phosphorylation levels were calculated using measured ratios between MS/HRMS transitions of endogenous unphosphorylated peptides and 15N labeled peptides from protein internal standard. Ratios of phosphorylation at the T181, S202, T205, and T217 sites were measured using the ratio of the MS/HRMS transitions from phosphorylated peptides (103–126 for pT111; 151–155 for pT153; 171–180 for pT175; 175–190 for pT181; 195–209 for pS202, pT205, and pS208; 212–221 for pS214 and pT217; 226–234 for pT231) and corresponding unphosphorylated peptides (103–126 for T111; 151–155 for T153; 181–190 for T181 and T175; 195–209 for S202, T205, and S208; 212–221 for S214 and T217; 226–230 for T231). pS113 was not considered in this analysis due to insufficient MS sensitivity. Each phosphorylated/unphosphorylated peptide endogenous ratio was normalized using the ratio measured on the MS/HRMS transitions of the corresponding AQUA phosphorylated/unphosphorylated peptide internal standards. Ratios of phosphorylation at the T111, T153, S208, and S214 sites were measured without internal standard using corresponding non-phosphorylated peptides signal as reference.
Comparison of quantitative MS results to p-tau181 levels and p-tau181/t-tau ratios using the Elecsys in vitro diagnostics immunoassay (Roche Diagnostics, Penzberg, Germany) was performed, which captures mid-domain species containing residues 159–224 (t-tau) and 175–200 (p-tau181) [41].
Imaging
[18F]GTP1 synthesis and [18F]GTP1 and Aβ PET imaging was performed as previously described [11, 40]. Images were acquired on a Siemens HR+ or Siemens Biograph 6 PET-CT scanners and were reconstructed with an iterative reconstruction algorithm (OSEM 4 iterations, 16 subsets) and a post hoc 5 mm Gaussian filter. All [18F]GTP1 PET studies were conducted in the same scanner for a given participant. A structural three-dimensional sagittal T1-weighted MR image (MP-RAGE or SPGR; 1 mm2 in plane resolution, 1.0–1.2 mm slice thickness) was also acquired for all participants in a 1.5-T or 3-T MRI scanner using the manufacturer’s recommended acquisition parameters. Image processing and data analysis were performed using SPM12 and in-house developed analysis software in MATLAB (MathWorks Inc, Natick, MA). Images were normalized to the standard Montreal Neurological Institute space and regions of interest (ROIs) were defined for each participant using the Hammers brain atlas. The cerebellar cortex region was defined using a modified cerebellum SUIT template (http://www.diedrichsenlab.org/imaging/suit.htm) to include only the inferior cerebellum to avoid spillover from the surrounding temporal and occipital regions in AD participants.
[18F]GTP1 SUVRs were calculated using the cerebellar gray as reference. ROIs included the whole cortical gray matter (WCG), an AD-specific temporal (TMP) meta-ROI [41] and hierarchical in vivo Braak tau PET stages (I–II, III–IV, V–VI) [42]. Aβ PET was performed using [18F]FBP (GN30009, e0048, and GN39763) or [18F]FBB (GN39763) prepared at commercial facilities. Participants were defined as Aβ positive by visual read. For quantitative purposes, in Cohort A, the CN (GN30009, e0048) were defined as Aβ high if their [18F]FBP SUVR was above 1.10 in a composite cortical ROI, and Aβ low if their FBP SUVR was below 1.10 [42]. Aβ PET SUVRs were calculated using the cerebellum grey as reference. FBP SUVRs and FBB SUVRs were converted to the Centiloid scale [43]. MRI was performed for participant eligibility (e.g., potential participants with evidence of other pathologies that might contribute to cognitive impairment were excluded), [18F]GTP1 and Aβ PET image processing, and volumetric analyses. Hippocampus, whole cortex, and ventricle volume were normalized by the intracranial volume.
Statistical analyses
Spearman correlations were used to assess relationships between different AD biomarkers and clinical assessments. Uncertainty in Spearman correlation and difference in dependent Spearman correlation estimates were characterized with bootstrap sampling. p-values and confidence intervals were not adjusted for multiple comparisons. Hedges’ g was calculated to compare the separation of clinical subgroups in Cohort A by the measured biomarkers. CSF tau phosphorylation at various sites were clustered by correlation distance and represented by dendrograms. Assessment of the similarity/dissimilarity of the phosphorylation ratios of subjects in subgroups of Cohort A by principal component analysis (PCA) was performed, applying the singular value decomposition approach to the standardized features. Association between [18F]GTP1 SUVR and CSF phosphorylation ratios was also assessed in a multivariable linear regression model with LASSO penalty in Cohort A. Stepwise lambda grid from 0.01 to 0.05 was tested and the best lambda was selected based on the lowest RMSE value. The model performance was measured by adjusted R2. R software version 3.5.2 [44] was used for all analyses.
Data sharing
Qualified researchers may request access to individual patient level data (https://vivli.org/). Roche’s criteria for eligible studies are available here (https://vivli.org/members/ourmembers/). For further details on Roche’s Global Policy on the Sharing of Clinical Information and how to request access to related clinical study documents, see https://go.gene.com/datasharing.
RESULTS
Demographics
Participant demographics and group means for each of the biomarkers measured are shown in Table 1. Mean age (∼70 years) was similar between cohorts, with the exception of the amyloid-low cognitive normal group (59 years). The prodromal to mild patients in the Cohort B on average had poorer performance on cognitive assessments, in comparison with prodromal to mild patients in Cohort A (MMSE shown in Supplementary Figure 1).
Table 1
Patient demographic and disease characteristics expressed as mean (SD).
| Cohort A | Cohort B | ||||||
| CN– | CN+ | Prodromal | Mild | Moderate | Prodromal | Mild | |
| (n = 6) | (n = 5) | (n = 13) | (n = 12) | (n = 10) | (n = 24) | (n = 40) | |
| Age | 59 (8.22) | 68.63 (3.38) | 69.81 (6.85) | 70.6 (6.14) | 70.87 (7.02) | 70.71 (7.06) | 69.28 (7.47) |
| Female | 3 (50%) | 2 (40%) | 7 (54%) | 8 (67%) | 2 (20%) | 10 (42%) | 17 (43%) |
| Caucasian descent | 6 (100%) | 4 (80%) | 13 100%) | 11 (92%) | 9 (90%) | 23 (96%) | 33 (83%) |
| MMSE | 29.33 (0.82) | 29.00 (0.71) | 28.31 (1.18) | 26.58 (2.47) | 17.60 (2.76) | 25.83 (2.70) | 23.03 (2.48) |
| CDRSB | 0.00 (0.00) | 0.10 (0.22) | 1.58 (0.91) | 3.18 (1.27) | 6.22 (1.72) | 2.56 (1.15) | 4.72 (1.85) |
| ADAS13 | 12.34 (4.72) | 8.00 (4.75) | 15.31 (6.11) | 19.24 (6.87) | 39.78 (7.29) | 22.53 (7.39) | 29.57 (6.84) |
| RBANS-Total | 98.50 (3.54) | 91.8 (11.56) | 85.23 (9.28) | 77 (14.55) | 60.5 (12.12) | 76.13 (13.50) | 61.24 (11.83) |
| [18F]GTP1-PET Temp ROI SUVR | 1.02 (0.05) | 1.26 (0.05) | 1.36 (0.19) | 1.5 (0.26) | 1.67 (0.32) | 1.42 (0.34) | 1.52 (0.37) |
| [18F]GTP1-PET WCG SUVR | 1.00 (0.05) | 1.17 (0.05) | 1.18 (0.10) | 1.34 (0.27) | 1.45 (0.41) | 1.2 (0.21) | 1.31 (0.26) |
| [18F]GTP1-PET Braak12 SUVR | 1.00 (0.05) | 1.27 (0.04) | 1.36 (0.17) | 1.44 (0.14) | 1.48 (0.26) | 1.39 (0.22) | 1.41 (0.22) |
| [18F]GTP1-PET Braak34 SUVR | 1.00 (0.05) | 1.2 (0.05) | 1.27 (0.16) | 1.44 (0.30) | 1.55 (0.35) | 1.35 (0.29) | 1.46 (0.34) |
| [18F]GTP1-PET Braak56 SUVR | 1.00 (0.06) | 1.15 (0.06) | 1.13 (0.09) | 1.29 (0.26) | 1.4 (0.46) | 1.14 (0.19) | 1.25 (0.25) |
| Amyloid centiloid | –3.47 (8.98) | 38.18 (17.53) | 79.58 (38.31) | 82.71 (32.89) | 90.63 (24.61) | 70.25 (41.03) | 63.10 (35.41) |
| Elecsys pTau181 (pg/ml) | 18.07 (6.52) | 22.92 (8.78) | 32.8 (18.24) | 32.7 (15.11) | 36.73 (15.54) | 34.74 (21.2) | 36.22 (23.75) |
| Elecsys tTau (pg/ml) | 217.02 | 261.54 | 317.28 | 326.48 | 359.21 | 331.33 | 354.1 |
| (77.36) | (82.36) | (140.77) | (118.16) | (117.92) | (168.76) | (199.17) | |
| Elecsys pTau181 (pT181/tTau) | 0.083 (0.005) | 0.086 (0.008) | 0.099 (0.011) | 0.098 (0.01) | 0.1 (0.011) | 0.1 (0.014) | 0.098 (0.014) |
| pT111 (ptau/utau) | 0.039 (0.015) | 0.065 (0.028) | 0.119 (0.044) | 0.111 (0.034) | 0.137 (0.020) | 0.087 (0.035) | 0.09 (0.035) |
| pT153 (ptau/utau) | 0.002 (0.000) | 0.003 (0.002) | 0.009 (0.003) | 0.009 (0.004) | 0.009 (0.004) | 0.007 (0.003) | 0.007 (0.003) |
| pT175 (ptau/utau) | 0.003 (0.001) | 0.003 (0.001) | 0.003 (0.001) | 0.003 (0.000) | 0.002 (0.001) | 0.003 (0.001) | 0.003 (0.001) |
| pT181 (ptau/utau) | 0.237 (0.025) | 0.300 (0.027) | 0.347 (0.059) | 0.308 (0.047) | 0.28 (0.048) | 0.329 (0.058) | 0.317 (0.061) |
| pS199 (ptau/utau) | 0.003 (0.001) | 0.003 (0.001) | 0.004 (0.001) | 0.004 (0.002) | 0.004 (0.001) | 0.005 (0.002) | 0.005 (0.001) |
| pS202 (ptau/utau) | 0.039 (0.005) | 0.045 (0.016) | 0.039 (0.008) | 0.039 (0.011) | 0.034 (0.005) | 0. (0.011) | 0.037 (0.013) |
| pT205 (ptau/utau) | 0.004 (0.001) | 0.005 (0.002) | 0.006 (0.002) | 0.008 (0.002) | 0.007 (0.001) | 0.007 (0.002) | 0.007 (0.002) |
| pS208 (ptau/utau) | 0.000 (0.000) | 0.001 (0.000) | 0.001 (0.000) | 0.001 (0.000) | 0.001 (0.000) | 0.001 (0) | 0.001 (0) |
| pS214 (ptau/utau) | 0.000 (0.000) | 0.001 (0.000) | 0.001 (0.000) | 0.001 (0.000) | 0.001 (0.000) | 0.001 (0) | 0.001 (0) |
| pT217 (ptau/utau) | 0.015 (0.003) | 0.026 (0.011) | 0.061 (0.019) | 0.063 (0.020) | 0.068 (0.017) | 0.053 (0.026) | 0.059 (0.025) |
| pT231 (ptau/utau) | 0.050 (0.013) | 0.081 (0.046) | 0.203 (0.069) | 0.147 (0.061) | 0.151 (0.051) | 0.146 (0.065) | 0.157 (0.055) |
AD, Alzheimer’s disease; CN, cognitively normal; MMSE; Mini-Mental State Examination; CDRSB; Clinical Dementia Rating Sum of Boxes; ADAS13, Alzheimer’s Disease Assessment Scale; RBANS, Repeatable Battery for the Assessment of Neuropsychological Status; PET, positron emission tomography; ROI, region of interest; SUVR, standardized uptake value ratio. Elecsys pTau181 (pTau181/tTau): ratio of Elecsys pTau181/tTau; LC/MS measures pT/SXXX (ptau/utau): ratio phosphorylated peptide/unphosphorylated peptide.
Cross-sectional associations between tau phosphorylation sites and amyloid and tau PET uptake
In the Cohort A, [18F]FBP uptake increased and plateaued in the AD patients, unlike [18F]GTP1, which increased in a stepwise manner with disease severity (Fig. 1A, B). [18F]GTP1 offered greater differentiation between diagnostic groups than [18F]FBP, as evidenced by larger Hedge’s effect sizes (g = 0.38 and 0.02 between prodromal-moderate and mild-moderate for FBP versus g = 1.17 and 0.56 between prodromal-moderate and mild-moderate for [18F]GTP1) (Supplementary Figure 2A, B). P-tau181 monitored by immunoassay followed the same pattern as FBP (Fig. 1C, D). For the eleven phosphorylation sites monitored by MS (T111, T153, T175, T181, S199, S202, T205, S208, S214, T217, and T231), most of the sites displayed an increase in their phosphorylation ratios (phosphorylated peptide/unphosphorylated peptide, p-tau/u-tau) from amyloid-negative controls to prodromal stages (i.e., T181, T111, T153, T205, S208, S214, T217, and T231) (Fig. 1E–O). Sites T111, T153, S208, and T217, like Elecsys p-tau181, followed the amyloid PET pattern with similar levels across prodromal, mild, and moderate patients. Conversely, progressive decreases in phosphorylation rates were observed for T175 and S202 with increasing disease severity, analogous to the progressive increases in [18F]GTP1 PET uptake with increasing disease severity. To gain confidence in the hyper- or hypophosphorylation reflected by the ratios, we looked at phosphorylated and unphosphorylated levels separately (Supplementary Figure 3). We compared levels of adjacent phosphosites which shared the same unphosphorylated peptide; pS202l (Supplementary Figure 3F) shows a decreasing pattern with disease severity, which is opposite to pS199, pT205, and pT208, which all have higher levels in symptomatic subjects (Supplementary Figure 3E, G, H). They share the unphosphorylated peptide S199-T208 shown in Supplementary Figure 3O. Similarly, pT175 (Supplementary Figure 3C) and pT181 (Supplementary Figure 3D) share the peptide shown in Supplementary Figure 3N.
Fig. 1
Cross-sectional boxplots from Cohort A comparing brain amyloid deposition (A) measured by FBP tracer (Amyloid centiloid), (B) [18F]GTP1 SUVR measuring brain tau aggregates, (C) Elecsys immunoassay measures of pTau181 level (E_pT181l), and (D) ratio of pTau181/tTau (E_pT181), (E) ratio of pTau181/uTau by MS, and (F–O) ratio of other phosphorylated residues by MS. CN-, cognitively normal, amyloid-low control; CN+, amyloid-high control; prod, prodromal; mod, moderate.
![Cross-sectional boxplots from Cohort A comparing brain amyloid deposition (A) measured by FBP tracer (Amyloid centiloid), (B) [18F]GTP1 SUVR measuring brain tau aggregates, (C) Elecsys immunoassay measures of pTau181 level (E_pT181l), and (D) ratio of pTau181/tTau (E_pT181), (E) ratio of pTau181/uTau by MS, and (F–O) ratio of other phosphorylated residues by MS. CN-, cognitively normal, amyloid-low control; CN+, amyloid-high control; prod, prodromal; mod, moderate.](https://content.iospress.com:443/media/jad/2022/85-1/jad-85-1-jad210677/jad-85-jad210677-g001.jpg)
Cross-sectional patterns of phosphorylation ratios at the other monitored phosphorylation sites did not fit into the patterns seen with [18F]FBP or [18F]GTP1 PET. T181, S214, and T231 were highest in prodromal AD, and lower in mild and moderate AD. S199 and T205 showed a bell-shaped distribution with highest levels in mild AD.
Diagnostic groups in Cohort A were strongly separated by MMSE scores. To produce comparable figures for Cohort B, which only included two diagnostic groups, scatter plots with MMSE scores on the x-axis instead of boxplots with diagnostic groups are shown. Similar trends to Cohort A were observed in the Cohort B with phosphorylation increasing with disease severity for the majority of sites, with the exception of T175, S199, and S202 that were decreasing as cognitive performance declined (Fig. 2). However, no substantial differences were observed between prodromal and mild patients.
Fig. 2
Scatter plot from Cohort B comparing MMSE and brain amyloid deposition measured by (A) florbetaben or florbetapir tracer (Amyloid centiloid), (B) [18F]GTP1 SUVR measuring brain tau aggregates, (C) Elecsys immunoassay measures of pTau181 level (E_pT181l), and (D) ratio of pTau181/tTau (E_pT181), (E) ratio of pTau181/uTau by MS, and (F–O) on other phosphorylated residues by MS. The polynomial curve and the shaded area show the locally weighted average (tricube weight function with quadratic local regressions) phosphorylation and its 95% confidence interval. orange, prodromal; blue, mild; PET, positron emission tomography; SUVR, standardized uptake value ratio; MMSE, Mini-Mental State Examination.
![Scatter plot from Cohort B comparing MMSE and brain amyloid deposition measured by (A) florbetaben or florbetapir tracer (Amyloid centiloid), (B) [18F]GTP1 SUVR measuring brain tau aggregates, (C) Elecsys immunoassay measures of pTau181 level (E_pT181l), and (D) ratio of pTau181/tTau (E_pT181), (E) ratio of pTau181/uTau by MS, and (F–O) on other phosphorylated residues by MS. The polynomial curve and the shaded area show the locally weighted average (tricube weight function with quadratic local regressions) phosphorylation and its 95% confidence interval. orange, prodromal; blue, mild; PET, positron emission tomography; SUVR, standardized uptake value ratio; MMSE, Mini-Mental State Examination.](https://content.iospress.com:443/media/jad/2022/85-1/jad-85-1-jad210677/jad-85-jad210677-g002.jpg)
CSF tau phosphorylation sites cluster
The Elecsys immunoassay was used as a benchmark comparison for the MS assay. A comparison of what the Elecsys p-tau181, t-tau, and MS assays measure is shown in Supplementary Figure 4A. Because the MS assay uses ratios, the performance of the Elecsys p-tau181/t-tau ratio was evaluated, which showed greater separation between CN and AD patients than Elecsys p-tau181 levels (g = 1.21; 1.12; 1.32 between CN Aβ high and prodromal, mild, and moderate respectively for p-tau/t-tau versus g = 0.57; 0.68; 0.94 between CN Aβ high and prodromal, mild, and moderate respectively for p-tau) (Supplementary Figure 2C–E). The Elecsys p-tau181/t-tau and MS pT181/uT181 ratios correlated more strongly in the Cohort A (r(S) = 0.73; Supplementary Figure 4B) than in Cohort B (r(S) = 0.64, Supplementary Figure 4C).
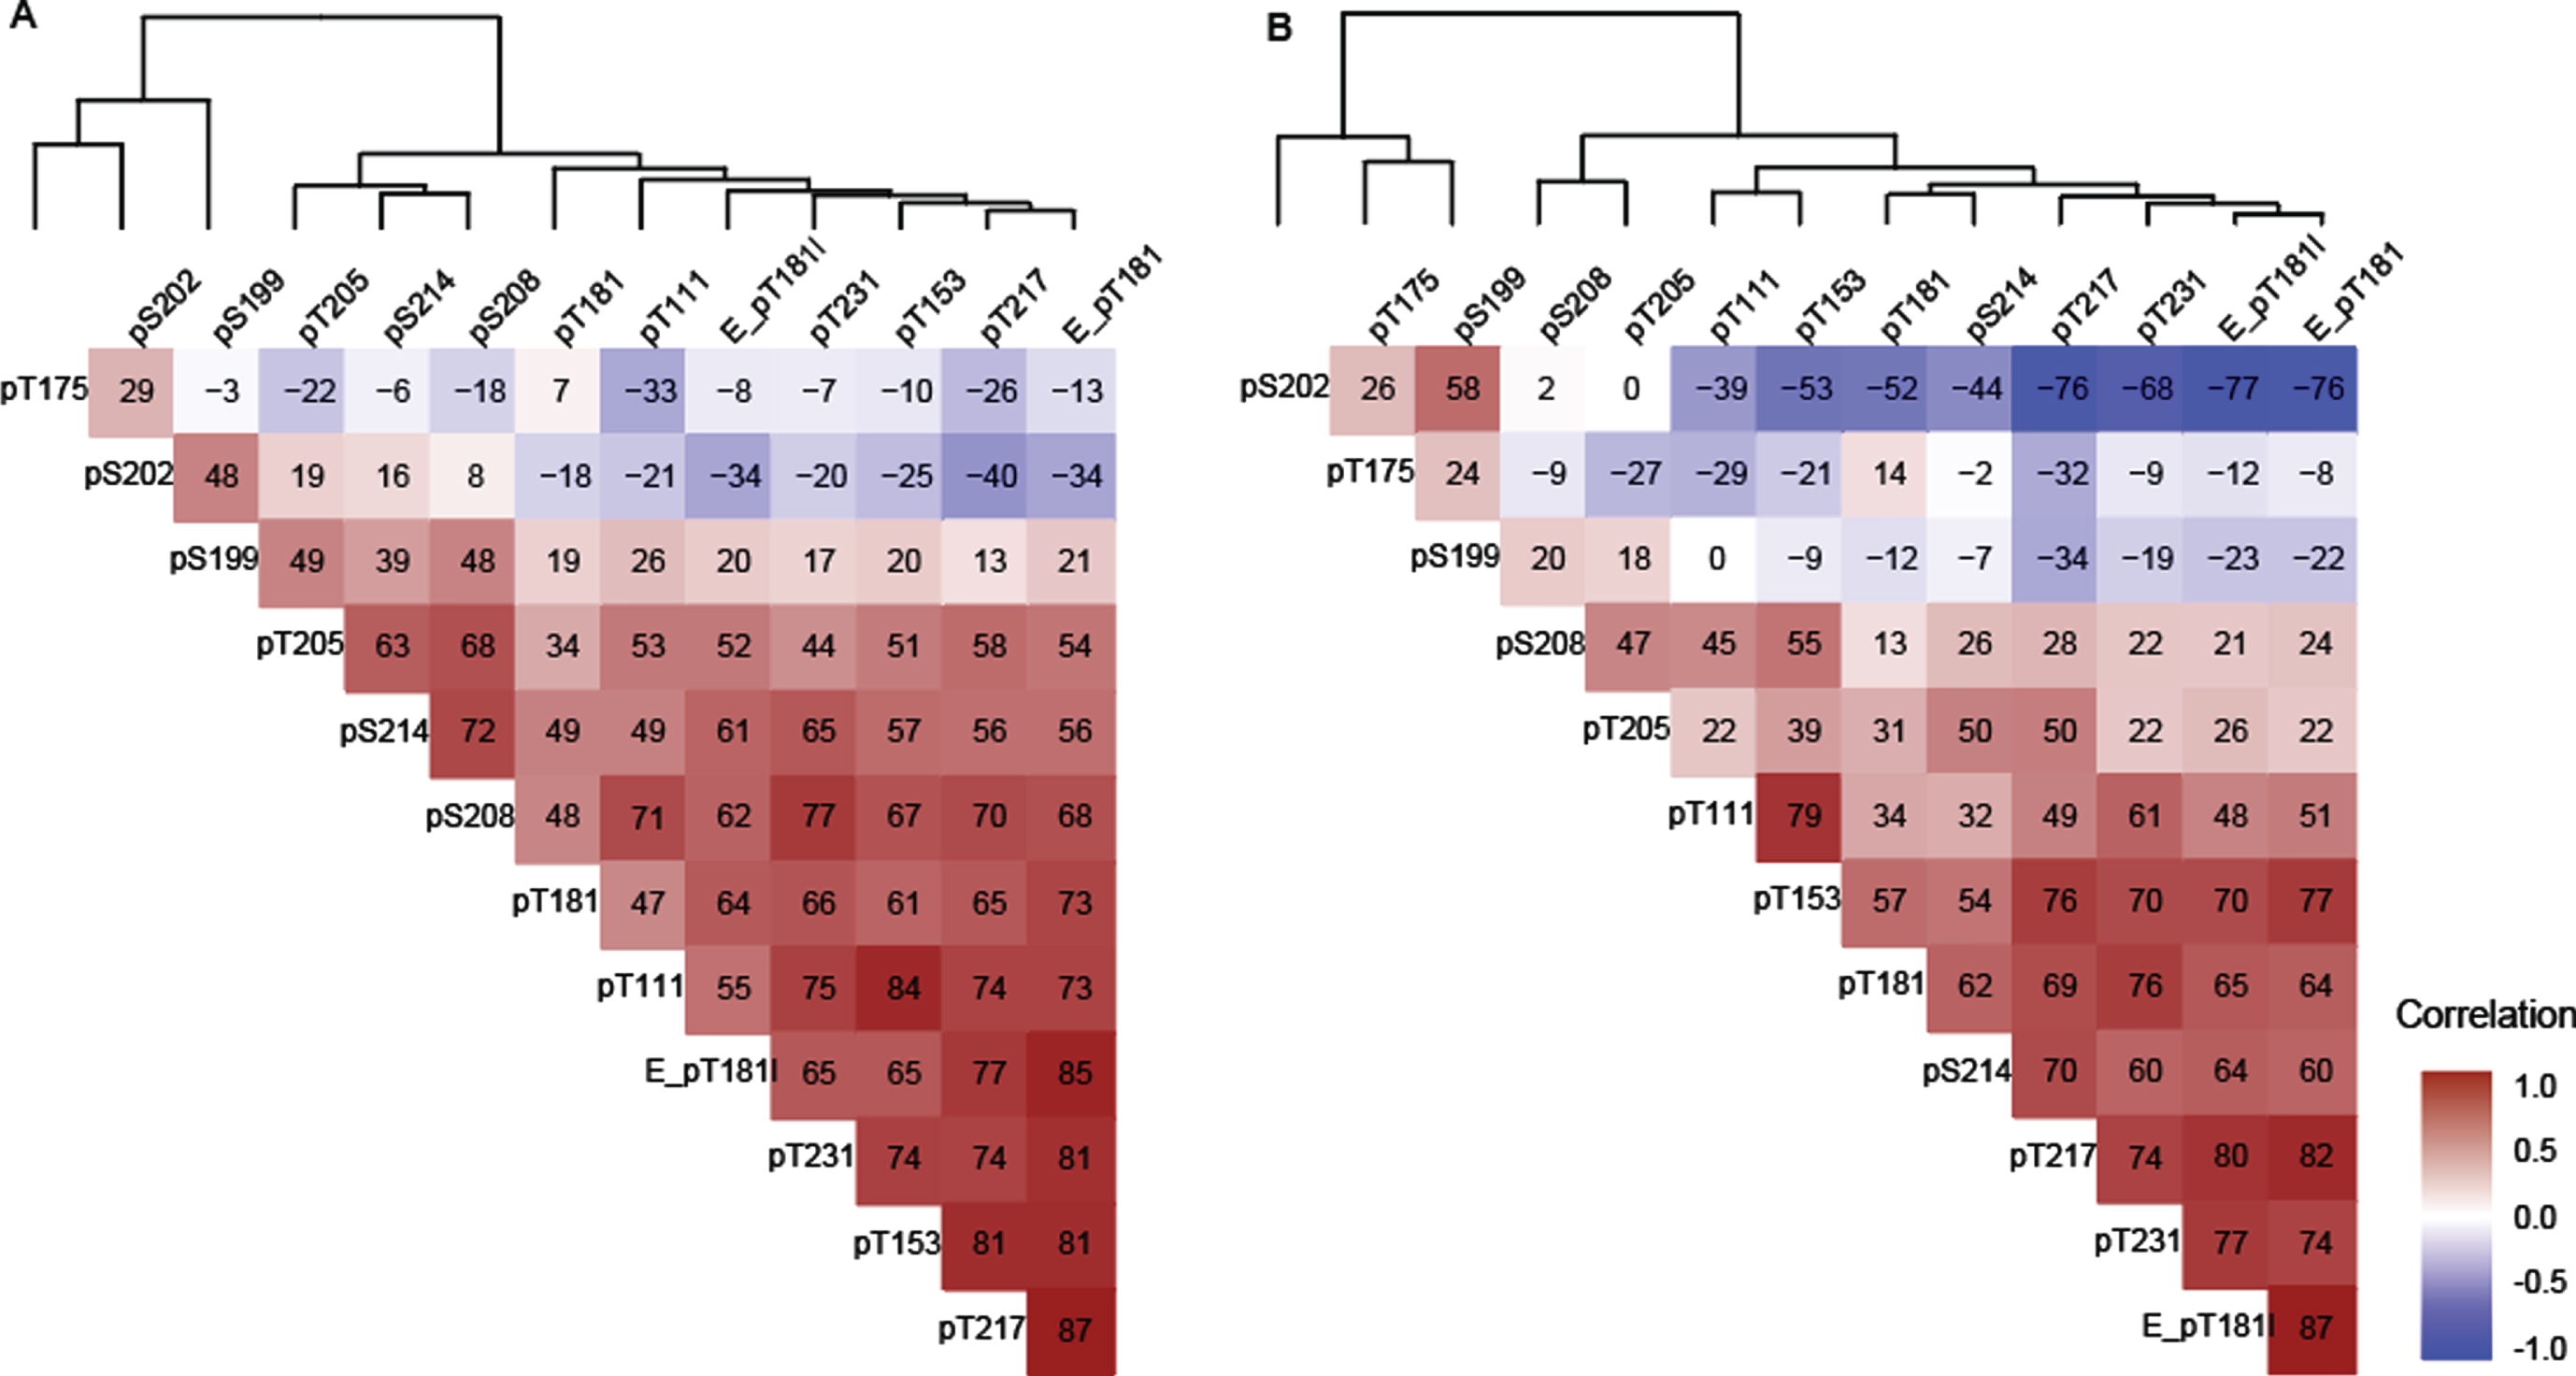
In general, in both Cohort A and Cohort B, the majority of sites were positively correlated with the exception of pT175, pS202, and pS199 in Cohort B which were negatively correlated (Fig. 3A, B). In Cohorts A and B, T217 phosphorylation ratios exhibited numerically higher correlations with Elecsys p-tau181/t-tau ratios than MS phosphorylation ratios (p-tau/u-tau) measured at other sites (Fig. 3). T217, T153, T181 (by MS and Elecsys), T111, and T231 could be grouped into a strong cluster of correlation. Correlations among this “pT217 cluster” were numerically weaker in Cohort B (Fig. 3B).
T175 behaved independently from all other phosphorylation sites at all stages in both cohorts, (–0.32 < r(S) < 0.2, Fig. 3A, B). Phosphorylation ratio at S199 and S202 were moderately associated (0.48 < r(S) < 0.58) together across different disease stages in both cohorts (Fig. 3A, B). Phosphorylation at these two sites decreased as phosphorylation at T217 increased in Cohort B (r(S) = –0.76 and –0.34) (Fig. 3B). Out of the two, only S202 phosphorylation was inversely associated with T217 phosphorylation in the Cohort A. For the Cohort B population, notable associations were observed between pT205 and pS208, pS214, and pT217 but not with other sites from the pT217 cluster (Fig. 3B).
Fig. 3
Spearman correlation (x 100) between tau phosphorylation ratios on monitored sites in (A) Cohort A, (B) Cohort B. The two cohorts support the identification of independent groups of association on site-specific phosphorylation occupancies that shift with disease severity. The dendrogram represents clusters of CSF hyperphosphorylation at different sites in Cohort A and resembles the pattern similarities seen in Fig. 1. Red highlight indicates positive correlation, white no correlation, blue negative correlation. Elecsys level (pg/mL):E_pT181l, Elecsys ratio (pTau181/tTau):(E_pT181), others are corresponding MS ratio pTau/uTau).
Cross-sectional association of CSF tau phosphorylation sites, [18F]GTP1 and [18F]FBP or [18F]FBB uptake
P-tau217, the p-Tau217 cluster and pT205 were significantly related to [18F]GTP1 (p < 0.001). Among hyperphosphorylated sites, pT217 had numerically the highest association with [18F]GTP1 SUVR in both cohorts ([Cohort A]: r(S) = 0.77 for pT217 versus r(S) = 0.68 for pT205, where the p of the difference is 0.006 Fig. 4A; [Cohort B]: r(S) = 0.82 for pT217 versus r(S) = 0.55 for pT231, where the p < 0.001 Fig. 4B), and between the diagnostic subgroups pT217’s correlation with [18F]GTP1 SUVR was highest in prodromal AD, (r(S) = 0.83 [Cohort A] and 0.87 [Cohort B], Fig. 4C, D). [18F]GTP1 SUVR was elevated in moderate AD relative to the other subgroups whereas pT217 levels were similar across AD subgroups (Fig. 1A–N). pT217 also correlated well with [18F]FBP in Aβ+ subgroups of Cohort A (Fig. 4E), but the association was weaker in Cohort B (Fig. 4F). The association between [18F]GTP1 PET and [18F]Aβ PET was weaker (r(S) = 0.69 [Cohort A] and 0.44 [Cohort B], Fig. 4A, B) than the association of either biomarker with pT217.
Fig. 4
Association between [18F]GTP1 SUVR and CSF p-tau measures. Correlation comparison (Spearman r) between measures of amyloid PET centiloid and brain tau aggregation in various regions of interest using [18F]GTP1 SUVR in select regions of interest (temporal meta: tmp_metaROI, whole cortical grey:WCG, Braak12, Braak34, Braak56) with CSF p-tau measures (middle sites: “pT217 cluster”) and amyloid PET in (A) Cohort A, and (B) Cohort B. Correlation between [18F]GTP1 SUVR (tmp_metaROI) and CSF tau phosphorylation occupancy on T217 in (C) Cohort A and (D) Cohort B. Correlation between Aβ PET(centiloid) and CSF tau phosphorylation occupancy on T217 in (E) Cohort A and (F) Cohort B. Empty triangle, CN- (cognitively normal); solid triangle, CN+; orange, prodromal AD; blue, mild AD; gray, moderate AD. Elecsys pTau181 level (pg/mL):E_pT181l, Elecsys pTau181/tTau ratio: E_pT181, MS pTau/uTau ratios: pX###
![Association between [18F]GTP1 SUVR and CSF p-tau measures. Correlation comparison (Spearman r) between measures of amyloid PET centiloid and brain tau aggregation in various regions of interest using [18F]GTP1 SUVR in select regions of interest (temporal meta: tmp_metaROI, whole cortical grey:WCG, Braak12, Braak34, Braak56) with CSF p-tau measures (middle sites: “pT217 cluster”) and amyloid PET in (A) Cohort A, and (B) Cohort B. Correlation between [18F]GTP1 SUVR (tmp_metaROI) and CSF tau phosphorylation occupancy on T217 in (C) Cohort A and (D) Cohort B. Correlation between Aβ PET(centiloid) and CSF tau phosphorylation occupancy on T217 in (E) Cohort A and (F) Cohort B. Empty triangle, CN- (cognitively normal); solid triangle, CN+; orange, prodromal AD; blue, mild AD; gray, moderate AD. Elecsys pTau181 level (pg/mL):E_pT181l, Elecsys pTau181/tTau ratio: E_pT181, MS pTau/uTau ratios: pX###](https://content.iospress.com:443/media/jad/2022/85-1/jad-85-1-jad210677/jad-85-jad210677-g004.jpg)
Other hyperphosphorylated sites were moderately associated with [18F]GTP1 SUVR in both cohorts. Conversely, phosphorylation ratios at S202, S199, and T175 showed negative correlations with [18F]GTP1 SUVR (Fig. 4A, B). The correlation was higher for pS202 and pT175 in Cohort B (Fig. 4C). The multivariable linear model with LASSO identified three sites (pT181, pT205, and pT217). Each of the identified sites may provide independent information about the [18F]GTP1 signal. Numerically, the model performance of this combination of sites was higher than pT217 alone, with more marked differences seen in Cohort A (R2 = 65% combined versus 55% with pT217 alone) than in Cohort B (R2 = 59% combined versus 57% with pT217 alone). Among the phosphorylated sites tested, pT217 was also numerically the most closely associated with [18F]Aβ PET (r(S) = 0.80 [Cohort A]; r(S) = 0.52 [Cohort B], Fig. 4C, D) however, statistically only separated from the hypophosphorylated trio.
Association with brain volume
The associations between CSF tau phosphorylation, tau PET and brain atrophy measured by MRI in the two AD cohorts were assessed. The absolute Spearman correlations with confidence intervals (CI) (unadjusted for multiplicity) for [18F]GTP1 SUVR in the temporal meta-ROI, the different phosphorylated species, whole cortical volume, hippocampal volume and ventricular volume is shown in Fig. 5.
Fig. 5
Association measured by Spearman r between [18F]GTP1 SUVR and CSF p-tau measures with brain atrophy as measured by MRI in different regions in (A) Cohort A, (B) Cohort A excluding cognitively normal individuals, and (C) Cohort B. Middle sites: “pT217 cluster”, Elecsys pTau181 level (pg/mL):E_pT181l, Elecsys pTau181/tTau ratio: E_pT181, MS pTau/uTau ratios: pX###, temporal meta ROI: tmp_metaROI.
![Association measured by Spearman r between [18F]GTP1 SUVR and CSF p-tau measures with brain atrophy as measured by MRI in different regions in (A) Cohort A, (B) Cohort A excluding cognitively normal individuals, and (C) Cohort B. Middle sites: “pT217 cluster”, Elecsys pTau181 level (pg/mL):E_pT181l, Elecsys pTau181/tTau ratio: E_pT181, MS pTau/uTau ratios: pX###, temporal meta ROI: tmp_metaROI.](https://content.iospress.com:443/media/jad/2022/85-1/jad-85-1-jad210677/jad-85-jad210677-g005.jpg)
Compared with Cohort A (Fig. 5A), Cohort A excluding CN (Fig. 5B), [18F]GTP1 SUVR had a moderate correlation with whole cortical volume (r(S) = –0.56, p < 0.001) (Fig. 5B). The correlation between Elecsys pT181, pT217, pT153 and pT111 from the ‘cluster’, and MRI features trended in the expected direction (r(S) = –0.14, –0.20, –0.27, and –0.29 respectively for whole cortical volume), but remained modest and statistically insignificant. For the other CSF phosphosites measured, there were no consistent relationships of CSF tau phosphorylation and brain volume in these 2 cohorts. In Cohort B (Fig. 5C), pS202 and pT231 were correlated with ventricular volume (r(S) = 0.31, and –0.27 respectively; p < 0.02 each). E_pT181, E_pT181l, and pT181 had significant correlations (abs[r(S)] = 0.21–0.32 p < 0.03) with hippocampal volume and ventricles in Cohort B. None of the other sites nor [18F]GTP1 associated with brain volume in Cohort B (Fig. 5C).
Association with cognition
The association of [18F]GTP1 SUVR and CSF p-tau with ADAS13 and RBANS cognitive measures was compared (Fig. 6). [18F]GTP1 SUVR was consistently associated with cognitive measures in Cohort A (r(S) = 0.62 (p < 0.001) with ADAS13 and r(S) = –0.72 (p < 0.001) with RBANS Fig. 6A), consistent with previous reports [11], and this relationship replicated in Cohort B (r(S) = 0.48 with ADAS13 and r(S) = –0.42 with RBANS; Fig. 6C). Both pT217 and Elecsys pT181 showed significant correlation with cognitive measures (r(S) = 0.49 and 0.43 with ADAS13 respectively p < 0.024; r(S) = –0.61 and –0.42 with RBANS respectively p < 0.048). A subset of the pT217 cluster (pT111, pT153) had correlations with cognition that approached [18F]GTP1 (the difference between the correlations were not statistically significant in [Cohort A] for ADAS13; Fig. 6A). The relationship weakened when CN participants were removed (Fig. 6B), however, it was notable again in Cohort B (Fig. 6C). Other sites also had positive relationships, but the result was weaker and less consistent (pS202, pT205, pS208). The correlations of cognition with the hypophosphorylated trio pT175, pS202 and pS199, were the inverse of [18F]GTP1 and the hyperphosphorylated sites. Of the three, the correlations of pT175 with cognition was more robust, matching [18F]GTP1s performance and reached significance on both tests in Cohort B (Fig. 6C).
Fig. 6
Association between [18F]GTP1 SUVR (tmp_metaROI) and CSF p-tau measures with cognitive scores in different regions in (A) Cohort A, (B) in Cohort A excluding cognitively normal individuals, and (C) in Cohort B. Middle sites: “pT217 cluster”, Elecsys pTau181 level (pg/mL):E_pT181l, Elecsys pTau181/tTau ratio: E_pT181, MS pTau/uTau ratios: pX###, temporal meta ROI: tmp_metaROI.
![Association between [18F]GTP1 SUVR (tmp_metaROI) and CSF p-tau measures with cognitive scores in different regions in (A) Cohort A, (B) in Cohort A excluding cognitively normal individuals, and (C) in Cohort B. Middle sites: “pT217 cluster”, Elecsys pTau181 level (pg/mL):E_pT181l, Elecsys pTau181/tTau ratio: E_pT181, MS pTau/uTau ratios: pX###, temporal meta ROI: tmp_metaROI.](https://content.iospress.com:443/media/jad/2022/85-1/jad-85-1-jad210677/jad-85-jad210677-g006.jpg)
DISCUSSION
CSF t-tau and p-tau181 levels have consistently demonstrated their utility for aiding in the diagnosis of AD. However, because the levels of these analytes plateau at early stages of clinical disease, they have more limited utility as biomarkers of disease severity [45]. This study assessed tau phosphorylation across a wide range of phosphorylation sites and stages of disease in patients who had paired CSF, imaging (amyloid and tau PET, MRI) and clinical assessments acquired at the same visit (on average within one month), which enabled us to direct assessments of cross-sectional associations of CSF tau phosphorylation with AD pathology and cognition. There are a number of factors that may limit the interpretation of the results, including the relatively modest sample size, fewer women participants, the high proportion of participants who had high amyloid levels, and the cross-sectional nature of the study. Due to these limitations, some of our findings on new phosphorylated sites need confirmation in larger cohorts. Nevertheless, it is encouraging that observations made on p-tau sites 217, 181, 202, and 205 in this study are in-line with prior trends observed in larger cohorts.
These results reveal different patterns of phosphorylation changes across the 11 investigated phosphorylation sites. The comparison between MS results and Elecsys p-tau181 and t-tau supported better separation of diagnostic subgroups using ptau/tau ratio compared to p-tau levels (Fig. 1C–E). It also revealed slightly different profiles between the two techniques. The profile of ptau181 level and pTau/tTau ratio as measured by the Elecsys immunoassay (Fig. 1C,D) is similar to amyloid PET (Fig. 1A) which increases and plateaus, but the mean pT181/u181 ratio by MS (Fig. 1E) is higher in prodromal patients and is lower in mild and moderate. While the overall correlation between these assays was robust, differences in the exact species that are captured by each assay, e.g., different antibodies used, presence of truncated species in CSF [17, 46], can account for the observed differences in performance. The Elecsys assay captures a broader spectrum of fragments, where the MS assay is more specific and measures the phosphorylated and unphosphorylated peptide most proximal to T181 (Supplementary Figure 4A). The MS data suggest that phosphorylation on 181 is more dynamic, decreasing in later disease. One could speculate that pTau181/uT181 (MS ratio) is sensitive to a phosphorylation event on 181 which is driven by amyloid plaque deposition, as an adaptive response. Once the plaque growth plateaus, the trigger for hyperphosphorylation could subside.
Phosphorylation ratios at T217 have a higher association with both tau and Aβ PET. These findings confirm previous reports suggesting stronger associations of phosphorylation at T217 than T181 with Aβ and tau PET measures [23, 31]. We speculate that elevations in pT217 may become measurable in the temporal interval between the elevations observed with [18F]Aβ PET and [18F]GTP1 PET SUVRs. While phosphorylation at T181 was highly correlated with phosphorylation at other sites, such as T217, it was not as well correlated with disease pathology (Aβ and tau PET) or cognition. This study suggests pT217 more accurately reflects the AD-related changes observed by brain imaging relative to the other CSF p-tau sites that have been examined. However, the diversity of phosphorylation trajectories associated with disease progression among these sites highlights the potential challenges associated with simply attributing increased CSF p-tau species in AD to increased aggregation and cerebral deposition of tau.
[18F]GTP1 SUVR appears to increase gradually with disease severity and is more closely associated with brain atrophy and cognitive measures than CSF tau phosphorylation ratios. Conversely, different patterns are observed for the majority of CSF p-tau sites with increasing clinical disease severity. Moreover, phosphorylation ratios at some sites (T175, S202) decreased with disease severity, particularly among symptomatic participants, which we interpreted as hypophosphorylation. This was in contrast to the interpretation of hyperphosphorylation of adjacent phosphorylation sites, which share the same unphosphorylated peptide (ex. T181 and T205, respectively), which increased in symptomatic patients. We hypothesized that the discrepancies between tau PET and CSF p-tau measures could result from different mechanisms affecting soluble tau phosphorylated sites in opposite manners.
One mechanism would imply that brain soluble tau becomes hyperphosphorylated in response to brain amyloid deposition in the absence of significant tau aggregation. In this scheme, tau isoforms that are released from neurons and detected in CSF are hyperphosphorylated in association to amyloid deposition. Such a relationship, which may be particularly sensitive for pT217, which was previously reported in asymptomatic participants with positive Aβ PET scans in both late onset sporadic AD and early onset dominantly inherited AD [22, 23] and is supported by the results of our current analyses. The stronger association of pT217 compared to other investigated phosphorylated sites would support earlier or more sensitive change of pT217 in response to amyloidosis as previously suggested when compared to pT181, t-tau, and pT205 [32]. In Cohort A, the relatively strong association of other members of the pT217 cluster (pT111, pT153, or pS208), as well as p-tau/t-tau ratio measured by Elecsys with [18F]FBP suggests that phosphorylation at these residues may also be detectable at preclinical stages of AD.
The similar patterns of signal saturation seen in Cohort A with [18F]FBP, and the pT217 cluster at later, symptomatic stages of disease severity (Fig. 1) also support the hypothesis that phosphorylation of certain CSF tau species may be more closely linked to cerebral Aβ deposition. Hypophosphorylated sites such as pT175 and pS202 might be unaffected by pathological changes driven by amyloidosis and may be biomarkers that are more dynamic in later stages of disease. As such, the different trajectories on CSF tau phosphorylation across different phosphorylation sites observed with increasing disease severity would support site-specific modification by different kinases and phosphatases [47]. Thus, enzymatic pathways that affect only a subset of tau phosphorylation sites might be dysregulated in conjunction with AD amyloidosis.
A second mechanism could involve a pool of hyperphosphorylated tau species becoming insoluble and accumulating into brain tau aggregates that are detectable by tau PET imaging. This process could in turn result in a reduction in the levels of corresponding phosphorylated isoforms in the soluble tau pool subsequently released into the CSF. Hypophosphorylation of sites, such as S199, T175, and S202, where progressive reductions in phosphorylation are seen with increasing [18F]GTP1 SUVR, may occur concomitantly with tau aggregation. Considering that no further increases in phosphorylation rates for soluble CSF tau are observed after symptom onset, it could be predicted that phosphorylation at all 11 phosphorylated sites analyzed here would be enriched in AD tau aggregates. Such a prediction is supported by differential phosphorylation analyses of brain soluble tau and AD tau aggregates [20, 47, 48].
Irrespective of mechanisms underlying these results, they suggest that the use and interpretation of CSF p-tau biomarkers for evaluating potential anti-tau therapeutics should be approached with caution. Longitudinal changes in tau pathology as measured by tau PET may be a more straightforward and clinically applicable outcome measure compared to longitudinal changes in soluble p-tau species for evaluating impact of a potential tau-targeted treatment. Phosphorylated CSF tau species may have greater utility for improving diagnostic accuracy, particularly at asymptomatic stages.
In summary, tau phosphorylation ratios were evaluated across 11 different phosphorylation sites and compared for the first time with tau PET. We observed sites clustered together, with clusters sharing similar cross-sectional patterns and relationships with disease pathology. These results suggest that the pT217 cluster correlates with amyloid PET and [18F]GTP1 tau PET cross-sectionally, with pT217 having higher correlations with both pathologies. There were no consistent relationships with brain volume, potentially because the majority of subjects were early AD. A few of the phosphorylation sites, including pT217, that correlate with [18F]GTP1, demonstrated similar correlations as [18F]GTP1 with cognition. The hypophosphorylated sites pS199, pT175, and pS202, had an inverse relationship with amyloid PET, tau PET, and cognition. Future studies that include direct comparisons with other tau fragments that also have been shown to correlate with Tau PET, such as those in the microtubule binding domain [49, 50], longitudinal observations, more AD participants at advanced stages of disease, and asymptomatic individuals at-risk for developing AD, will increase the understanding of the performance of these fluid biomarkers of tau pathology and guide their use in clinical trials, potentially as alternatives to tau PET or as complementary prognostic markers of clinical progression.
ACKNOWLEDGMENTS
We thank the patients and their families who took part in the study, as well as the staff, research coordinators, and investigators at each participating institution. We thank Mike Ward for his expert support of this project. Writing assistance provided by Kathleen Schoch and Bryan Hains at Genentech, Inc.
This work was funded by Genentech, Inc.
Authors’ disclosures available online (https://www.j-alz.com/manuscript-disclosures/21-0677r2).
SUPPLEMENTARY MATERIAL
[1] The supplementary material is available in the electronic version of this article: https://dx.doi.org/10.3233/JAD-210677.
REFERENCES
[1] | Nelson PT , Alafuzoff I , Bigio EH , Bouras C , Braak H , Cairns NJ , Castellani RJ , Crain BJ , Davies P , Del Tredici K , Duyckaerts C , Frosch MP , Haroutunian V , Hof PR , Hulette CM , Hyman BT , Iwatsubo T , Jellinger KA , Jicha GA , Kövari E , Kukull WA , Leverenz JB , Love S , Mackenzie IR , Mann DM , Masliah E , McKee AC , Montine TJ , Morris JC , Schneider JA , Sonnen JA , Thal DR , Trojanowski JQ , Troncoso JC , Wisniewski T , Woltjer RL , Beach TG ((2012) ) Correlation of Alzheimer disease neuropathologic changes with cognitive status: A review of the literature. J Neuropathol Exp Neurol 71: , 362–81. |
[2] | Querfurth HW , LaFerla FM ((2010) ) Alzheimer’s disease. N Engl J Med 362: , 329–344. |
[3] | Hanger DP , Anderton BH , Noble W ((2009) ) Tau phosphorylation: The therapeutic challenge for neurodegenerative disease. Trends Mol Med 15: , 112–9. |
[4] | Despres C , Byrne C , Qi H , Cantrelle FX , Huvent I , Chambraud B , Baulieu EE , Jacquot Y , Landrieu I , Lippens G , Smet-Nocca C ((2017) ) Identification of the Tau phosphorylation pattern that drives its aggregation. Proc Natl Acad Sci U S A 114: , 9080–9085. |
[5] | Augustinack JC , Schneider A , Mandelkow EM , Hyman BT ((2002) ) Specific tau phosphorylation sites correlate with severity of neuronal cytopathology in Alzheimer’s disease. Acta Neuropathol 103: , 26–3. |
[6] | Blennow K , Hampel H ((2003) ) Cerebrospinal fluid markers for incipient Alzheimer’s disease. Lancet Neurol 2: , 605–613. |
[7] | Blennow K , Zetterberg H ((2018) ) The past and the future of Alzheimer’s disease fluid biomarkers. J Alzheimers Dis 62: , 1125–1140. |
[8] | Aschenbrenner AJ , Gordon BA , Benzinger TLS , Morris JC , Hassenstab JJ ((2018) ) Influence of tau PET, amyloid PET, and hippocampal volume on cognition in Alzheimer disease. Neurology 91: , e859–e866. |
[9] | Pontecorvo MJ , Devous MD , Kennedy I , Navitsky M , Lu M , Galante N , Salloway S , Doraiswamy PM , Southekal S , Arora AK , McGeehan A , Lim NC , Xiong H , Truocchio SP , Joshi AD , Shcherbinin S , Teske B , Fleisher AS , Mintun MA ((2019) ) A multicentre longitudinal study of flortaucipir (18F) in normal ageing, mild cognitive impairment and Alzheimer’s disease dementia. Brain 142: , 1723–1735. |
[10] | Sperling RA , Mormino EC , Schultz AP , Betensky RA , Papp KV , Amariglio RE , Hanseeuw BJ , Buckley R , Chhatwal J , Hedden T , Marshall GA , Quiroz YT , Donovan NJ , Jackson J , Gatchel JR , Rabin JS , Jacobs H , Yang HS , Properzi M , Kirn DR , Rentz DM , Johnson KA ((2019) ) The impact of amyloid-beta and tau on prospective cognitive decline in older individuals. Ann Neurol 85: , 181–193. |
[11] | Teng E , Ward M , Manser PT , Sanabria-Bohorquez S , Ray RD , Wildsmith KR , Baker S , Kerchner GA , Weimer RM ((2019) ) Cross-sectional associations between [18F]GTP1 tau PET and cognition in Alzheimer’s disease. Neurobiol Aging 81: , 138–145. |
[12] | Betthauser TJ , Koscik RL , Jonaitis EM , Allison SL , Cody KA , Erickson CM , Rowley HA , Stone CK , Mueller KD , Clark LR , Carlsson CM , Chin NA , Asthana S , Christian BT , Johnson SC ((2020) ) Amyloid and tau imaging biomarkers explain cognitive decline from late middle-age. Brain 143: , 320–335. |
[13] | Malpetti M , Kievit RA , Passamonti L , Jones PS , Tsvetanov KA , Rittman T , Mak E , Nicastro N , Bevan-Jones WR , Su L , Hong YT , Fryer TD , Aigbirhio FI , O’Brien JT , Rowe JB ((2020) ) Microglial activation and tau burden predict cognitive decline in Alzheimer’s disease. Brain 143: , 1588–1602. |
[14] | Gordon BA , Blazey TM , Su Y , Hari-Raj A , Dincer A , Flores S , Christensen J , McDade E , Wang G , Xiong C , Cairns NJ , Hassenstab J , Marcus DS , Fagan AM , Jack CR Jr , Hornbeck RC , Paumier KL , Ances BM , Berman SB , Brickman AM , Cash DM , Chhatwal JP , Correia S , Förster S , Fox NC , Graff-Radford NR , la Fougère C , Levin J , Masters CL , Rossor MN , Salloway S , Saykin AJ , Schofield PR , Thompson PM , Weiner MM , Holtzman DM , Raichle ME , Morris JC , Bateman RJ , Benzinger TLS ((2018) ) Spatial patterns of neuroimaging biomarker change in individuals from families with autosomal dominant Alzheimer’s disease: A longitudinal study. Lancet Neurol 17: , 241–250. |
[15] | Wang G , Xiong C , McDade EM , Hassenstab J , Aschenbrenner AJ , Fagan AM , Benzinger TLS , Gordon BA , Morris JC , Li Y , Bateman RJ ; Dominantly Inherited Alzheimer Network (DIAN) ((2018) ) Simultaneously evaluating the effect of baseline levels and longitudinal changes in disease biomarkers on cognition in dominantly inherited Alzheimer’s disease. Alzheimers Dement 4: , 669–676. |
[16] | Pichet Binette A , Vachon-Presseau É , Morris J , Bateman R , Benzinger T , Collins DL , Poirier J , Breitner JCS , Villeneuve S ; Dominantly Inherited Alzheimer Network (DIAN); PREVENT-AD Research Group ((2021) ) Amyloid and tau pathology associations with personality traits, neuropsychiatric symptoms, and cognitive lifestyle in the preclinical phases of sporadic and autosomal dominant Alzheimer’s Disease. Biol Psychiatry 89: , 776–785. |
[17] | Sato C , Barthélemy NR , Mawuenyega KG , Patterson BW , Gordon BA , Jockel-Balsarotti J , Sullivan M , Crisp MJ , Kasten T , Kirmess KM , Kanaan NM , Yarasheski KE , Baker-Nigh A , Benzinger TLS , Miller TM , Karch CM , Bateman RJ ((2018) ) Tau kinetics in neurons and the human central nervous system. Neuron 98: , 861–864. |
[18] | Benzinger TL , Gordon BA , Morris JC , Bateman RJ ((2017) ) Time course of amyloid and tau deposition in autosomal dominant Alzheimer’s disease: Update from the Dominantly Inherited Alzheimer Network (DIAN) and DIAN-TU. Alzheimer Association International Conference;, 2017. |
[19] | Quiroz YT , Sperling RA , Norton DJ , Baena A , Arboleda-Velasquez JF , Cosio D , Schultz A , Lapoint M , Guzman-Velez E , Miller JB , Kim LA , Chen K , Tariot PN , Lopera F , Reiman EM , Johnson KA ((2018) ) Association between amyloid and tau accumulation in young adults with autosomal dominant Alzheimer disease. JAMA Neurol 75: , 548–556. |
[20] | Barthélemy NR , Mallipeddi N , Moiseyev P , Sato C , Bateman RJ ((2019) ) Tau phosphorylation rates measured by mass spectrometry differ in the intracellular brain vs. extracellular cerebrospinal fluid compartments and are differentially affected by Alzheimer’s disease. Front Aging Neurosci 11: , 121. |
[21] | Cicognola C , Brinkmalm G , Wahlgren J , Portelius E , Gobom J , Cullen NC , Hansson O , Parnetti L , Constantinescu R , Wildsmith K , Chen HH , Beach TG , Lashley T , Zetterberg H , Blennow K , Höglund K ((2019) ) Novel tau fragments in cerebrospinal fluid: Relation to tangle pathology and cognitive decline in Alzheimer’s disease. Acta Neuropathol 137: , 279–296. |
[22] | Barthélemy NR , Fenaille F , Hirtz C , Sergeant N , Schraen-Maschke S , Vialaret J , Buée L , Gabelle A , Junot C , Lehmann S , Becher F ((2016) ) Tau protein quantification in human cerebrospinal fluid by targeted mass spectrometry at high sequence coverage provides insights into its primary structure heterogeneity. J Proteome Res 15: , 667–76. |
[23] | Janelidze S , Stomrud E , Smith R , Palmqvist S , Mattsson N , Airey DC , Proctor NK , Chai X , Shcherbinin S , Sims JR , Triana-Baltzer G , Theunis C , Slemmon R , Mercken M , Kolb H , Dage JL , Hansson O ((2020) ) Cerebrospinal fluid p-tau217 performs better than p-tau181 as a biomarker of Alzheimer’s disease. Nat Commun 11: , 1683. |
[24] | Brier MR , Gordon B , Friedrichsen K , McCarthy J , Stern A , Christensen J , Owen C , Aldea P , Su Y , Hassenstab J , Cairns NJ , Holtzman DM , Fagan AM , Morris JC , Benzinger TL , Ances BM ((2016) ) Tau and Aβ imaging, CSF measures, and cognition in Alzheimer’s disease. Sci Transl Med 8: , 338ra66. |
[25] | Chhatwal JP , Schultz AP , Marshall GA , Boot B , Gomez-Isla T , Dumurgier J , LaPoint M , Scherzer C , Roe AD , Hyman BT , Sperling RA , Johnson KA ((2016) ) Temporal T807 binding correlates with CSF tau and phospho-tau in normal elderly. Neurology 87: , 920–926. |
[26] | Gordon BA , Blazey T , Su Y , Fagan AM , Holtzman DM , Morris JC , Benzinger TL ((2016) ) Longitudinal beta-amyloid deposition and hippocampal volume in preclinical Alzheimer disease and suspected non-Alzheimer disease pathophysiology. JAMA Neurol 73: , 1192–1200. |
[27] | Mattsson N , Insel PS , Palmqvist S , Portelius E , Zetterberg H , Weiner M , Blennow K , Hansson O ; Alzheimer’s Disease Neuroimaging Initiative ((2016) ) Cerebrospinal fluid tau, neurogranin, and neurofilament light in Alzheimer’s disease. EMBO Mol Med 8: , 1184–1196. |
[28] | Lim Y , Maruff P , Johnson K , Sperling R , Morimoto E ((2018) ) Distinct information from CSF tau and AV1451 PET measures in nondemented individuals. Human Amyloid Imaging Conference, 2018. |
[29] | Suárez-Calvet M , Karikari TK , Ashton NJ , Lantero Rodríguez J , Milà-Alomà M , Gispert JD , Salvadó G , Minguillon C , Fauria K , Shekari M , Grau-Rivera O , Arenaza-Urquijo EM , Sala-Vila A , Sánchez-Benavides G , González-de-Echávarri JM , Kollmorgen G , Stoops E , Vanmechelen E , Zetterberg H , Blennow K , Molinuevo JL ; ALFA Study ((2020) ) Novel tau biomarkers phosphorylated at T181, T217 or T231 rise in the initial stages of the preclinical Alzheimer’s continuum when only subtle changes in Aβ pathology are detected. EMBO Mol Med 12: , e12921. |
[30] | Barthélemy NR , Bateman RJ , Marin P , Becher F , Saro C , Lehmann S , Gabelle A ((2017) ) Tau hyperphosphorylation on T217 in cerebrospinal fluid is specifically associated to amyloid-β pathology bioRxiv 226977; doi: https://doi.org/10.1101/226977. |
[31] | Barthélemy NR , Bateman RJ , Hirtz C , Marin P , Becher F , Sato C , Gabelle A , Lehmann S ((2020) ) Cerebrospinal fluid phospho-tau T217 outperforms T181 as a biomarker for the differential diagnosis of Alzheimer’s disease and PET amyloid-positive patient identification. Alzheimers Res Ther 12: , 26. |
[32] | Barthélemy NR , Li Y , Joseph-Mathurin N , Gordon BA , Hassenstab J , Benzinger TLS , Buckles V , Fagan AM , Perrin RJ , Goate AM , Morris JC , Karch CM , Xiong C , Allegri R , Mendez PC , Berman SB , Ikeuchi T , Mori H , Shimada H , Shoji M , Suzuki K , Noble J , Farlow M , Chhatwal J , Graff-Radford NR , Salloway S , Schofield PR , Masters CL , Martins RN , O’Connor A , Fox NC , Levin J , Jucker M , Gabelle A , Lehmann S , Sato C , Bateman RJ , McDade E ; Dominantly Inherited Alzheimer Network ((2020) ) Dominantly Inherited Alzheimer Network. A soluble phosphorylated tau signature links tau, amyloid and the evolution of stages of dominantly inherited Alzheimer’s disease. Nat Med 26: , 398–407. |
[33] | Barthélemy NR , Horie K , Sato C , Bateman RJ ((2020) ) Blood plasma phosphorylated-tau isoforms track CNS change in Alzheimer’s disease. J Exp Med 217: , e20200861. |
[34] | Russell CL , Mitra V , Hansson K , Blennow K , Gobom J , Zetterberg H , Hiltunen M , Ward M , Pike I ((2017) ) Comprehensive quantitative profiling of tau and phosphorylated tau peptides in cerebrospinal fluid by mass spectrometry provides new biomarker candidates. J Alzheimers Dis 55: , 303–313. |
[35] | Wesseling H , Mair W , Kumar M , Schlaffner CN , Tang S , Beerepoot P , Fatou B , Guise AJ , Cheng L , Takeda S , Muntel J , Rotunno MS , Dujardin S , Davies P , Kosik KS , Miller BL , Berretta S , Hedreen JC , Grinberg LT , Seeley WW , Hyman BT , Steen H , Steen JA ((2020) ) Tau PTM profiles identify patient heterogeneity and stages of Alzheimer’s disease. Cell 183: , 1699–1713. |
[36] | Ward M , Sanabria-Bohorquez S , Manser PT , Teng E , Ayalon G , Wildsmith KR , Kerchner GA , Weimer RM ((2017) ) Cross-sectional associations between tau pathology burden measured by [18F]GTP1 PET imaging and cognition in Alzheimer’s disease. J Prev Alzheimers Dis 7: , 4. |
[37] | Weimer R , Sanabria-Bohorquez S , Baker SL , Toth B , Teng E , Marik J , Manser PT ((2019) ) Longitudinal changes in [18F]GTP1 SUVR and cognition correlate with baseline tau burden and spatial distribution. Clinical Trials on Alzheimer’s Disease. |
[38] | Manser PT , Teng E , Pickthorn K , Blendstrup M , Anegondi N , Krishnan A , Song Z , Carano RAD , Keeley M , Wildsmith KR , Weimer R , Sanabria-Bohorquez S ((2020) ) Baseline correlations between [18F]GTP1 PET SUVR and MRI white matter hyperintensities in prodromal-to-mild Alzheimer’s disease suggest independent contributions to cognitive impairment. Alzheimer’s Association International Conference. |
[39] | Teng E , Manser PT , Pickthorn K , Blendstrup M , Anegondi N , Krishnan A , Song Z , Carano RAD , Keeley M , Wildsmith KR , Weimer R , Sanabria-Bohorquez S ((2020) ) Cognitive indices correlate with [18F]GTP1 tau PET signal and white matter hyperintensities in prodromal to mild Alzheimer’s disease: Baseline data from the Tauriel study. Alzheimer’s Association International Conference. |
[40] | Sanabria Bohórquez S , Marik J , Ogasawara A , Tinianow JN , Gill HS , Barret O , Tamagnan G , Alagille D , Ayalon G , Manser P , Bengtsson T , Ward M , Williams SP , Kerchner GA , Seibyl JP , Marek K , Weimer RM ((2019) ) [18F]GTP1 (Genentech Tau Probe 1), a radioligand for detecting neurofibrillary tangle tau pathology in Alzheimer’s disease. Eur J Nucl Med Mol Imaging 46: , 2077–2089. |
[41] | Schindler SE , Gray JD , Gordon BA , Xiong C , Batrla-Utermann R , Quan M , Wahl S , Benzinger TLS , Holtzman DM , Morris JC , Fagan AM ((2018) ) Cerebrospinal fluid biomarkers measured by Elecsys assays compared to amyloid imaging. Alzheimers Dement 14: , 1460–1469. |
[42] | Landau SM , Breault C , Joshi AD , Pontecorvo M , Mathis CA , Jagust WJ , Mintun MA ; Alzheimer’s Disease Neuroimaging Initiative ((2013) ) Amyloid-beta imaging with Pittsburgh compound B and florbetapir: Comparing radiotracers and quantification methods. J Nucl Med 54: , 70–77. |
[43] | Klunk WE , Koeppe RA , Price JC , Benzinger TL , Devous MD Sr , Jagust WJ , Johnson KA , Mathis CA , Minhas D , Pontecorvo MJ , Rowe CC , Skovronsky DM , Mintun MA ((2015) ) The Centiloid Project: Standardizing quantitative amyloid plaque estimation by PET. Alzheimers Dement 11: , 1-15.e1–4. |
[44] | R Core Team. R: A Language and Environment for Statistical Computing. R Foundation for Statistical Computing, Vienna, Austria. http://www.R-project.org/. (Accessed 1 Oct 2020). |
[45] | McDade E , Wang G , Gordon BA , Hassenstab J , Benzinger TLS , Buckles V , Fagan AM , Holtzman DM , Cairns NJ , Goate AM , Marcus DS , Morris JC , Paumier K , Xiong C , Allegri R , Berman SB , Klunk W , Noble J , Ringman J , Ghetti B , Farlow M , Sperling RA , Chhatwal J , Salloway S , Graff-Radford NR , Schofield PR , Masters C , Rossor MN , Fox NC , Levin J , Jucker M , Bateman RJ ; Dominantly Inherited Alzheimer Network ((2018) ) Dominantly Inherited Alzheimer Network. Longitudinal cognitive and biomarker changes in dominantly inherited Alzheimer disease. Neurology 91: , e1295–e1306. |
[46] | Meredith JE Jr , Sankaranarayanan S , Guss V , Lanzetti AJ , Berisha F , Neely RJ , Slemmon JR , Portelius E , Zetterberg H , Blennow K , Soares H , Ahlijanian M , Albright CF ((2013) ) Characterization of novel CSF Tau and ptau biomarkers for Alzheimer’s disease. PLoS One 8: , e76523. |
[47] | Hanger DP , Byers HL , Wray S , Leung KY , Saxton MJ , Seereeram A , Reynolds CH , Ward MA , Anderton BH ((2007) ) Novel phosphorylation sites in tau from Alzheimer brain support a role for casein kinase 1 in disease pathogenesis. J Biol Chem 282: , 23645–54. |
[48] | Horie K , Barthélemy NR , Mallipeddi N , Li Y , Franklin EE , Perrin RJ , Bateman RJ , Sato C ((2020) ) Regional correlation of biochemical measures of amyloid and tau phosphorylation in the brain. Acta Neuropathol Commun 8: , 1–14. |
[49] | Blennow K , Chen C , Cicognola C , Wildsmith KR , Manser PT , Bohorquez SMS , Zhang Z , Xie B , Peng J , Hansson O , Kvartsberg H , Portelius E , Zetterberg H , Lashley T , Brinkmalm G , Kerchner GA , Weimer RM , Ye K , Höglund K ((2020) ) Cerebrospinal fluid tau fragment correlates with tau PET: A candidate biomarker for tangle pathology. Brain 143: , 650–660. |
[50] | Horie K , Barthélemy NR , Sato C , Bateman RJ ((2021) ) CSF tau microtubule binding region identifies tau tangle and clinical stages of Alzheimer’s disease. Brain 144: , 515–527. |


